
 Submit a Paper
 Propose a Special lssue
 Open Access
ARTICLE

Trends in Rainfall-Temperature Projections in Upper Bernam River Basin Using CMIP6 Scenarios in Malaysia
1 Department of Biological and Agricultural Engineering, Faculty of Engineering, Universiti Putra Malaysia, Serdang, 43400, Malaysia
2 Agricultural and Environmental Engineering Department, Faculty of Engineering, Bayero University, Kano, PMB 3011, Nigeria
3 Department of Civil Engineering, Faculty of Engineering, Universiti Putra Malaysia, Serdang, 43400, Malaysia
4 River Basin Research Centre, National Water Research Institute of Malaysia, Seri Kembangan, 43300, Malaysia
* Corresponding Authors: Muazu Dantala Zakari. Email: ; Md. Rowshon Kamal. Email:
(This article belongs to the Special Issue: Resource and Environmental Information Modeling)
Revue Internationale de Géomatique 2025, 34, 487-511. https://doi.org/10.32604/rig.2025.065835
Received 22 March 2025; Accepted 30 June 2025; Issue published 29 July 2025
 View Full Text
 Download PDF
Abstract
Understanding trends in rainfall and temperature projections is critical for assessing climate change impacts, managing water resources, mitigating disaster risks, and guiding sustainable agricultural and infrastructure planning. This study investigates projected changes in temperature and rainfall in the Upper Bernam River Basin (UBRB), Malaysia, using ten Global Climate Models (GCMs) from CMIP6 across four scenarios (SSP126, SSP245, SSP370, and SSP585). Downscaling was conducted with the Climate-Smart Decision Support System (CSDSS) for the baseline period (1985–2014) and for future periods: 2020s, 2040s, 2060s, and 2080s. Results indicate a consistent warming trend, with maximum temperatures projected to increase from 1.4°C (2020s, SSP126) to 4.66°C (2080s, SSP585), and minimum temperatures from 1.97°C to 5.70°C over the same period and scenarios. Rainfall projections reveal high variability and inter-scenario uncertainty, with average monthly rainfall changes ranging from −17.6% (2020s, SSP585) to +6.6% (2080s, SSP370). Extremes analysis shows intensifying wet and dry spells, with 95th percentile rainfall rising to 7.87% and significant increases in 90th percentile temperatures, reaching nearly 20% under SSP585 by 2080s. Seasonal shifts include reduced rainfall from January to April and potential increases in main-season (July–August) flooding. These findings highlight the importance of adaptive strategies such as flood control, off-season (January–June) water storage, and climate-resilient infrastructure. The study underscores inter-scenario uncertainties and provides critical insights for climate-resilient water resource planning and disaster risk mitigation in UBRB.Keywords
Climate change is one of the most pressing challenges of the 21st century, with significant implications for hydrological cycles, temperature variations, precipitation patterns, agriculture, and disaster risk management [1,2]. The Intergovernmental Panel on Climate Change (IPCC) has consistently highlighted the increasing frequency and intensity of extreme weather events, such as floods, droughts, and heatwaves, driven by rising global temperatures and shifting precipitation patterns [3,4]. These changes are particularly pronounced in tropical regions, where ecosystems and human activities are susceptible to climate variability [5,6]. In Southeast Asia, an area characterized by its monsoon-driven climate, the impacts of climate change are exacerbated by rapid urbanization, deforestation, and intensive agricultural practices [7,8].
Malaysia, located in the heart of Southeast Asia, is highly vulnerable to climate change due to its reliance on rain-fed agriculture and its exposure to extreme weather events [9,10]. The Upper Bernam River Basin (UBRB) is a critical hydrological and agricultural zone in Peninsular Malaysia and plays a vital role in supporting local livelihoods and regional food security. However, this basin is vulnerable to these climate fluctuations. Temperature and rainfall patterns can influence crop yields, increase the frequency of extreme weather events, and alter river discharge patterns, ultimately affecting livelihoods and biodiversity [11–13].
Recent studies have documented that global average temperatures have been rising due to increased greenhouse gas emissions, leading to disruptions in hydrological regimes worldwide [14,15] alongside erratic rainfall patterns in the region, raising concerns about the sustainability of water resources and the resilience of agricultural systems [16,17]. In Southeast Asia, including Malaysia, temperature increases have accelerated over the past decades, intensifying rainfall variability and increasing the risks of droughts and floods [17–19]. For instance, Ismail [20] reported significant warming trends using CMIP5 models, but these projections may underestimate future climate extremes due to their limited representation of regional dynamics [21].
The Coupled Model Intercomparison Project Phase 6 (CMIP6) represents a significant advancement in climate modeling, offering improved spatial resolution and a more comprehensive range of Shared Socioeconomic Pathways (SSPs) compared to CMIP5 [14,22–24]. These SSPs provide scenarios integrating socioeconomic factors with climate projections, enabling a more nuanced understanding of future climate risks [25]. Despite these advancements and extensive research on climate variability, limited studies have focused on UBRB using CMIP6 projections, particularly in assessing temperature and rainfall trends under different future scenarios, where localized climate impacts can deviate significantly from global trends [18,26]. This gap in knowledge hinders the development of targeted adaptation strategies, underscoring the need for detailed, regional, and locally specific climate assessments. Accurate climate projections are critical for effective water resource management, disaster risk reduction, and infrastructure planning in the study area [27].
Climate change poses significant challenges to water resource management and agricultural productivity [28,29], particularly in regions such as UBRB in Malaysia. The increasing intensity of temperature and changes in rainfall patterns, as driven by global climate variability, necessitate localized studies to provide actionable data for climate adaptation strategies. Previous studies [20,30] using CMIP5 projections have provided a foundation for understanding climate impacts, but with the advancement of CMIP6 models, it is crucial to update the analysis with the latest projections.
This study addresses this critical gap by analyzing trends in rainfall and temperature projections in the UBRB using downscaled CMIP6 scenarios (SSP126, SSP245, SSP370, and SSP585) for the baseline period (1985–2014) and future periods (2020s, 2040s, 2060s, and 2080s). The primary objectives of this study are to (1) examine trends in temperature and rainfall projections under different CMIP6 scenarios (SSP126, SSP245, SSP370, and SSP585) for UBRB, (2) compare historical (1985–2014) and projected climate trends for the 2020s, 2040s, 2060s, and 2080s, and (3) assess the implications of projected changes on water resource management, disaster risk reduction, and climate adaptation strategies.
Climate model projections are essential to anticipate these impacts and inform long-term planning. The CMIP6 provides a range of SSPs that reflect different greenhouse gas emissions trajectories [31,32]. However, raw outputs from Global Climate Models (GCMs) have coarse spatial resolution and inherent biases that limit their direct application to basin-scale impact studies [33,34]. Therefore, downscaling and bias correction techniques are employed to refine these outputs to regional or local scales.
Statistical downscaling methods, including stochastic weather generators like LARS-WG and regression-based models like SDSM, have been widely applied in Southeast Asia to enhance climate model projections [35–38]. LARS-WG has been used effectively to simulate daily rainfall and temperature in Malaysia and nearby tropical regions due to its ability to generate site-specific weather data [37,39,40]. SDSM, on the other hand, combines multiple linear regression with stochastic error modeling and has proven effective for capturing extreme climate indices [37,41,42]. However, the SDSM method was reported to be more efficient than LARS-WG in downscaling rainfall and temperature [34]. Meanwhile, more advanced statistical techniques, such as empirical quantile mapping, have been increasingly used for bias correction due to their ability to preserve distributional characteristics and extremes in precipitation [43–45].
Despite these developments, the delta method is one of the approaches in many regional climate impact studies for its simplicity, robustness, and ease of integration into hydrological models [46–50]. The method involves calculating the change signal (delta) between future and historical periods from GCM outputs and applying these deltas to observed local climate data. Although it lacks the temporal variability of weather generators, the delta method is effective for trend analysis, seasonal comparisons, and long-term scenario development, especially in data-scarce basins such as the UBRB. Moreover, its ability to maintain relative changes without introducing additional modeling uncertainty makes it suitable for multi-GCM ensemble assessments [49,51].
In this study, the Climate-Smart Decision Support System (CSDSS), which implements a delta-based downscaling framework, was used to project changes in rainfall and temperature over the UBRB. The analysis incorporated ten CMIP6 GCMs under four emission scenarios (SSP126, SSP245, SSP370, and SSP585) and covered four future time periods (2020s, 2040s, 2060s, and 2080s).
The central research question of the study is: how will climate change, as projected by the latest CMIP6 scenarios (SSP126, SSP245, SSP370, and SSP585), affect trends in rainfall and temperature in the UBRB in Malaysia across different time horizons (2020s, 2040s, 2060s, and 2080s)? However, the study hypothesizes that: Both maximum and minimum temperatures in the UBRB will increase significantly under all SSP scenarios, with the highest increases observed under the SSP585 pathways; Rainfall will exhibit increased variability, with a general trend toward reductions during dry seasons and potential increases in wet-season rainfall, particularly under higher-emission scenarios (SSP370 and SSP585); and the temperature and rainfall trends will show chronological progression, with more extreme changes occurring towards the end of the century (2080s).
While numerous studies in Southeast Asia have examined projected climate changes using CMIP5 and CMIP6 datasets [52–55], few have specifically targeted the UBRB using CMIP5 [30,56], a strategically important watershed for agriculture, water supply, and disaster mitigation in Peninsular Malaysia. Many prior studies rely on national-scale or coarse-resolution projections, often overlooking sub-basin-level dynamics and their implications for localized decision-making [57]. Nonetheless, significant gaps remain in understanding localized climate dynamics in strategic sub-basins such as the UBRB, and these studies have either focused on national or regional scales without capturing basin-specific characteristics; relied primarily on CMIP5 projections, which have been shown to underrepresent certain extremes and uncertainty ranges compared to CMIP6; and did not include a robust analysis of climate extremes (e.g., 90th, 95th percentiles), which are crucial for disaster risk assessment [30,56]. Moreover, downscaling tools like SDSM and LARS-WG have been more commonly applied in the region [35–38]. In contrast, the CSDSS used in this study remains underutilized despite its capacity for integrating climate data with decision-relevant metrics. This research also distinguishes itself by combining analyses of climate extremes using the 95th and 10th percentiles for rainfall and 90th and 10th percentiles for temperature alongside mean trends, thereby addressing compound risks such as simultaneous droughts and floods [1,5,58]. This study aims to fill these critical gaps through the following objectives: (1) To downscale CMIP6 outputs using CSDSS, thereby integrating climate science with actionable decision-making support at the sub-basin level. (2) To project future trends in rainfall and temperature in the UBRB under four CMIP6 SSPs (SSP126, SSP245, SSP370, and SSP585) for near-to-long-term periods (2020s, 2040s, 2060, and 2080s). (3) To assess changes in climate extremes, focusing on 10th and 90th/95th percentile thresholds for rainfall and temperature, which are vital for flood and drought risk evaluation. (4) To evaluate inter-scenario uncertainties and their implications for adaptive water resource management, agricultural planning, and infrastructure development in the UBRB.
By capturing both average and extreme projections under four CMIP6 scenarios (SSP126, SSP245, SSP370, and SSP585), integrating multi-GCM ensemble data with downscaling techniques tailored for trend analysis, this research provides insights into future climate variability in the UBRB. The outcome will aid policymakers, researchers, and stakeholders in formulating adaptive strategies, ensuring the sustainability and resilience of UBRB in the face of climate change. Moreover, the findings of this study are timely, as Malaysia, particularly the UBRB, grapples with the dual challenges of climate and sustainable development. The results will contribute to the growing body of knowledge on local climate impacts and support the development of evidence-based adaptation strategies, such as improved flood control, off-season water storage, and climate-resilience agricultural practices [59,60]. Ultimately, this study seeks to bridge the gap between global climate projections and local adaptation needs, providing a foundation for informed decision-making in UBRB and beyond.
The Upper Bernam River Basin (UBRB), located in Malaysia, was selected as the study area due to its significance for regional water supply, agriculture, and disaster management. The UBRB spans approximately 108,000 hectares, originating from the mountainous regions of the main range bordering Pahang and flowing 200 km to the Melaka Straits. Fig. 1 presents the study area and its features, with Fig. 1a depicting the UBRB catchment, Fig. 1b showing how the UBRB discharge flows to the straits of Melaka and is partly diverted to the location of the Integrated Agricultural Development Area (IADA) Selangor within the Bernam Basin. Fig. 1c presents the Bernam Basin’s position in Malaysia. The UBRB is a natural boundary between Selangor and Perak, with around 65% of its area in Perak [61]. The UBRB watershed has an average elevation of 950 m above sea level and includes forests, oil palm plantations, rubber, and paddy fields [30]. The north and east mountain regions reach approximately 1830 m above sea level. The temperatures in the area range between 26°C and 32°C, with a relative humidity of 77%. Rainfall patterns are influenced by the Northeast monsoon (November–February) and Southwest monsoon (May–August), with peaks in rainfall occurring from October to December and February to May. Annual precipitation varies between 1800 mm and 3500 mm, while the mean annual flow ranges from 800 mm to 1950 mm [62]. The inter-monsoon periods, occurring from March to April and September to October, are considered dry seasons with minimum rainfall. Consequently, the UBRB catchment serves as the primary source of irrigation water for IADA Selangor, which operates in two distinct seasons: the off-season from January to June and the main-season from July to December. The off-season experiences lower rainfall, while the main-season is marked by higher rainfall levels.

Figure 1: Study area: (a) is the Upper Bernam River Basin (UBRB) showing the boundary, catchment outlet, and tributaries; (b) is the map showing the UBRB catchment, river Bernam, Feeder canal, and the Integrated Agricultural Development Area (IADA) Selangor irrigation compartments; and (c) shows the location of UBRB in the map of West Malaysia
The study investigates future trends in rainfall and temperature for the UBRB using downscaled data from Global Climate Models (GCMs) under the Coupled Model Intercomparison Project Phase 6 (CMIP6) framework. The analysis considers four Shared Socioeconomic Pathways (SSP) scenarios, including SSP126 (low emissions), SSP245 (moderate emissions), SSP370 (high emissions), and SSP585 (very high emissions), over different future periods; the near future (2020s), mid-century (2040s), late-century (2060s), and end of the century (2080s). The study compares these periods with a historical baseline (1985–2014). The meteorological data used in this study include rainfall and temperature datasets derived from a combination of observed historical records and GCM outputs. The Climate-Smart Decision Support System (CSDSS) was used to downscale GCM data to a finer spatial resolution suitable for basin-level Analysis.
2.3 Climate Model Data and Downscaling
The study employed statistical downscaling using CSDSS to capture climate projections at a local scale. Climate projection data were obtained from ten Global Climate Models (GCMs) under the CMIP6 framework (Table 1), covering four emission scenarios (SSP126, SSP245, SSP370, and SSP585) through the Earth System Grid Federation (ESGF) data platform. The CMIP6 climate data for SSP126, SSP245, SSP370, and SSP585 were bias-corrected using an upgraded version (Fig. 2) of the Climate-Smart Decision Support System (CSDSS) to downscale hydro-meteorological variables, enhancing local accuracy [63,64]. The CSDSS was developed in the Matrix Laboratory (MATLAB R2024b) environment, where it employs the statistical downscaling method known as the “Delta Change Factor” [63]. This method bridges the gap between coarse GCM data and the high-resolution requirements of regional/local climate studies. The CSDSS adjusts GCM outputs to local climate conditions by applying bias correction methods based on observed meteorological data. This approach is widely used in hydrological modeling due to its rapid application, direct scaling of scenarios based on GCM-projected changes, and ability to incorporate multiple models with results from various GCM scenarios [63,65,66]. Refer to [30,64,65,67] for further details. In this study, the 2020s are referred to as the near future period, the 2040s as the mid-future period, the 2060s as the late century period, and the 2080s as the end-of-century period. The ten selected GCMs represent a range of climate responses, enhancing the robustness of the projections.


Figure 2: Revised Climate-Smart DSS for downscaling climate variables for the CMIP5 and CMIP6 models
The “Delta change factor” approach assessed the mean values of the GCM-simulated baseline and future climates using Eqs. (1) and (2) [30,63,68]:
where
Eqs. (3) and (4) calculated the monthly additive (CFadd) and multiplicative (CFmul) Change Factor, changes between the baseline and the future periods for the climate variable of interest for the GCM grid box. In the case of precipitation (ΔP), relative change factors derived from the ratio of projected-to-baseline averages were used. In contrast, absolute change factors were used for temperature, relative humidity, solar radiation, and wind speed (ΔT), which were calculated by subtracting the GCMs’ baseline averages from the future [63].
Finally, using Eqs. (5) and (6), future climate values at the local scale were calculated. This is accomplished by superimposing the change factors proposed by the GCM scenario.
where P and T are the rainfall and climatic variables, respectively, the subscript adj, fut, d denote the downscaled future daily variable; obs, d denote daily observations; CF denotes calculated additive and multiplicative change factors for rainfall and climatic variables; GCM, fut, m, and GCM, base, m are the average monthly values of GCM output and baseline periods, respectively.
2.4 Temperature and Rainfall Trend Analysis
For temperature projections, maximum and minimum daily temperatures were analyzed for their percentage change from the historical baseline to each future time horizon (2020s, 2040s, 2060s, and 2080s). Rainfall trends were analyzed by examining monthly and annual averages, focusing on changes in dry (off-season) and wet (main-season) season dynamics. Both increases and decreases in rainfall were identified to assess how future climate variability would affect the basin.
Projected changes in temperature and rainfall were calculated as percentage differences from the baseline period (1985–2014). The range of projected daily changes in temperature (ΔT) and rainfall (ΔR) using the 1985–2014 historical period and the four future periods (2020s, 2040s, 2060s, and 2080s) were computed. The 10th (dry days) and 95th (wet days) percentile values for ΔR were calculated for the historical period to determine the climate extremes. These percentile values serve as a threshold for computing the percentage change in future frequencies. For example, the number of days greater than or equal to the 95th percentile was computed; hence, the percentage change in frequency was calculated using Eq. (7). For temperature, the 10th (cold) and 90th (warm) percentile values serve as a threshold for the historical period. These thresholds were used to compute the percentage change of the future temperature for historical periods using Eqs. (8) and (9). Furthermore, the analysis also included a temporal comparison across the four SSP scenarios and the four future periods. The study used graphical trend analysis to detect chronological patterns, fluctuations, and significant trends in temperature and rainfall data.
The study acknowledges the uncertainties inherent in climate projections by considering the outputs of multiple GCMs. The ensemble means of ten GCMs allows for a more comprehensive evaluation of climate responses under different emission scenarios, reducing the uncertainty of relying on a single model. This ensemble means approach is crucial for generating reliable projections, especially for long-term climate planning.
2.7 Visualization and Results Presentation
Data from the Analysis were presented through graphs and figures to highlight the percentage changes in temperature and rainfall across periods and scenarios. Figures showing maximum and minimum temperature increments, rainfall variability, and the distribution of seasonal changes helped visualize how climate conditions might evolve under different SSP pathways. These visualizations provided an intuitive understanding of projected climate trends for the UBRB.
The average maximum temperature during the 2020s (near future period) was projected to rise by 1.47°C, 1.95°C, 2.13°C, and 2.13°C, respectively, for SSPs 126, 245, 370, and 585, as compared to the historical period, depicted in Figs. 3 and 4. Similarly, the 2040s (mid-future period), 2060s (late century period), and 2080s (end of century period) are as follows: 1.50°C, 2.11°C, 2.68°C, 2.96°C; 1.59°C, 2.23°C, 3.03°C, 3.82°C and 1.61°C, 2.39°C, 3.50°C and 4.66°C. The least maximum temperature increment between baseline and future temperature was observed in the 2020s period, corresponding to the SSP126 scenario by 5.01%. In comparison, the highest maximum temperature increment was observed in the 2080s period, matching the SSP585 scenario by 15.42%. Other percentage (%) increments of the maximum temperature corresponding to the various scenarios and periods are presented in Fig. 5. However, there is a chronological increment in the maximum temperature for the period (from the near future to the end of the century) and the scenarios.

Figure 3: Mean maximum temperature for historical and future periods across the scenarios: (a) presents the trend in the average maximum temperature for historical (1985–2014) and during the 2020s (2015 to 2034) for all the SSPs; (b) presents the trend in the average maximum temperature for historical (1985–2014) and during the 2040s (2035 to 2054) for all the SSPs; (c) presents the trend in the average maximum temperature for historical (1985–2014) and during the 2060s (2055 to 2074) for all the SSPs; and (d) presents the trend in the average maximum temperature for historical (1985–2014) and during the 2080s (2075 to 2094) for all the SSPs


Figure 4: Mean changes of maximum temperature for future periods across the scenarios: (a) presents the trend in the mean changes of maximum temperature during the 2020s (2015 to 2034) for all the SSPs (SSP126, SSP245, SSP370, and SSP585); (b) presents the trend in the average maximum temperature during the 2040s (2035 to 2054) for all the SSPs; (c) presents the trend in the average maximum temperature during the 2060s (2055 to 2074) for all the SSPs; and (d) presents the trend in the average maximum temperature during the 2080s (2075 to 2094) for all the SSPs

Figure 5: Percent increment in mean maximum temperature for future periods across the scenarios
The minimum temperature projections follow a similar trend to the maximum temperature. The average minimum temperature during the 2020s (near future period) was projected to rise by 1.97°C, 2.06°C, 2.09°C, and 2.16°C, respectively, for SSPs 126, 245, 370, and 585, as compared to the historical period, depicted in Figs. 6 and 7. Equally, the 2040s (mid-future period), 2060s (late century period), and 2080s (end of century period) are as follows: 2.46°C, 2.72°C, 2.82°C, 3.17°C; 2.81°C, 3.35°C, 3.72°C, 4.58°C and 3.08°C, 3.74°C, 4.40°C and 5.70°C. The lowest minimum temperature increment between baseline and future temperature was observed in the 2020s period, corresponding to the SSP126 scenario by 8.75%. In comparison, the highest minimum temperature increment was observed in the 2080s period, matching the SSP585 scenario by 24.50%. Other percent (%) increments of the minimum temperature corresponding to the various scenarios and periods are presented in Fig. 8. There is also a chronological increment in the minimum temperature for the period (from the near future to the end of the century) and the scenarios.

Figure 6: Mean minimum temperature for historical and future periods across the scenarios: (a) presents the trend in the mean minimum temperature for historical (1985–2014) and during the 2020s (2015 to 2034) for all the SSPs (SSP126, SSP245, SSP370, and SSP585); (b) presents the trend in the average maximum temperature for historical (1985–2014) and during the 2040s (2035 to 2054) for all the SSPs; (c) presents the trend in the average maximum temperature for historical (1985–2014) and during the 2060s (2055 to 2074) for all the SSPs; and (d) presents the trend in the average maximum temperature for historical (1985–2014) and during the 2080s (2075 to 2094) for all the SSPs

Figure 7: Mean changes of minimum temperature for future periods across the scenarios: (a) presents the trend in the mean changes of minimum temperature during the 2020s (2015 to 2034) for all the SSPs (SSP126, SSP245, SSP370, and SSP585); (b) presents the trend in the average maximum temperature during the 2040s (2035 to 2054) for all the SSPs; (c) presents the trend in the average maximum temperature during the 2060s (2055 to 2074) for all the SSPs; and (d) presents the trend in the average maximum temperature during the 2080s (2075 to 2094) for all the SSPs
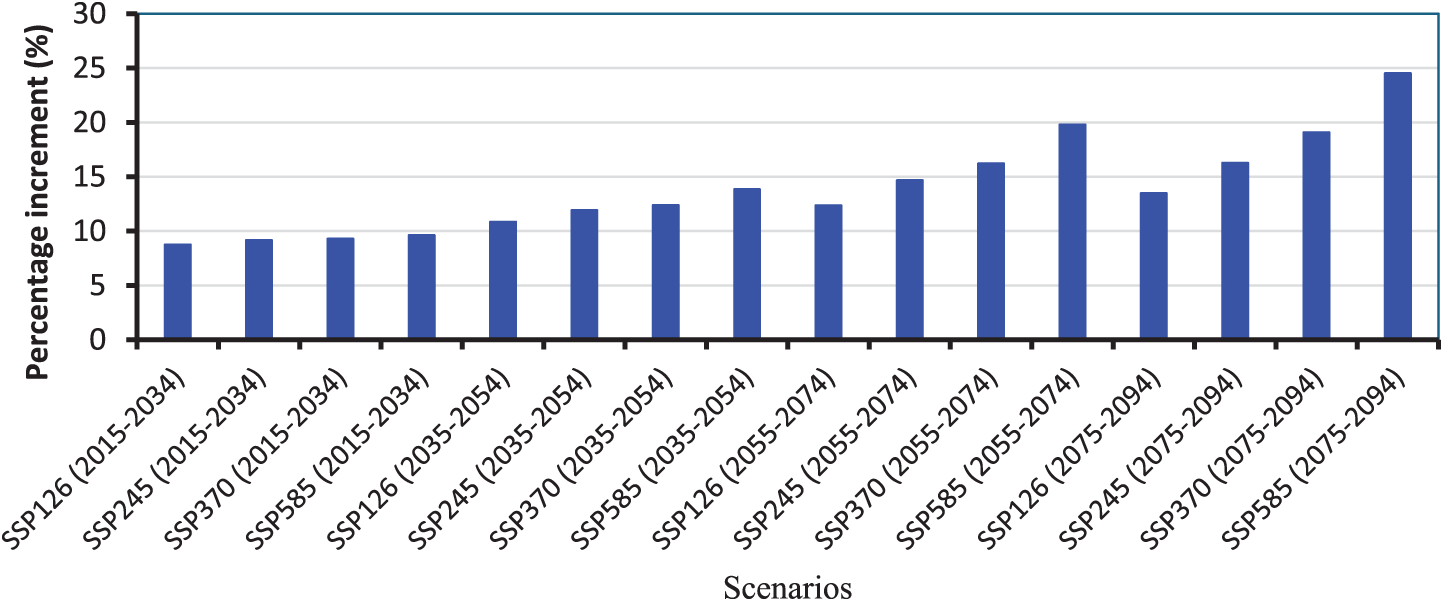
Figure 8: Percent increment in mean maximum temperature for future periods across the scenarios
Projected rainfall patterns exhibit notable inter-decadal variability. The average monthly rainfall during the historical period was estimated at 223.33 mm. However, the average rainfall during the 2020s (near future period) was projected to decrease by the following percentage with corresponding mean values: −15.13% (206.10 mm), −13.79% (208.19 mm), −12.47% (211.37 mm) and −17.59% (201.61 mm), respectively, for SSPs 126, 245, 370 and 585, when compared to the historical period, depicted in Figs. 9 and 10. Equally, for the 2040s (mid-future period), 2060s (late century period), and 2080 s (end of century period) are as follows; −12.41% (213.45 mm), −6.12% (226.37 mm), −6.85% (225.54 mm), −9.46% (219.95 mm); −12.73% (213..14 mm), −6.46% (225.52 mm), 2.52% (245.03 mm), −6.24% (226.49 mm); and −10.38% (216.46 mm), −7.20% (224.72 mm), 6.63% (252.53 mm) and −3.25% (233.09 mm), respectively. The lowest average rainfall compared with the baseline was observed in the 2020s period, corresponding to the SSP585 scenario with a mean change of −21.71 mm. Moreover, the highest average rainfall compared to the baseline was observed in the 2080s period, matching the SSP370 scenario with a mean change of 29.20 mm. Other percentage (%) changes in the rainfall corresponding to the various scenarios and periods are presented in Fig. 11. However, there is also a chronological change for the period (from the near future to the end of the century), with some fluctuations between the 2040s and 2060s for the SSP126 and SSP245 scenarios.
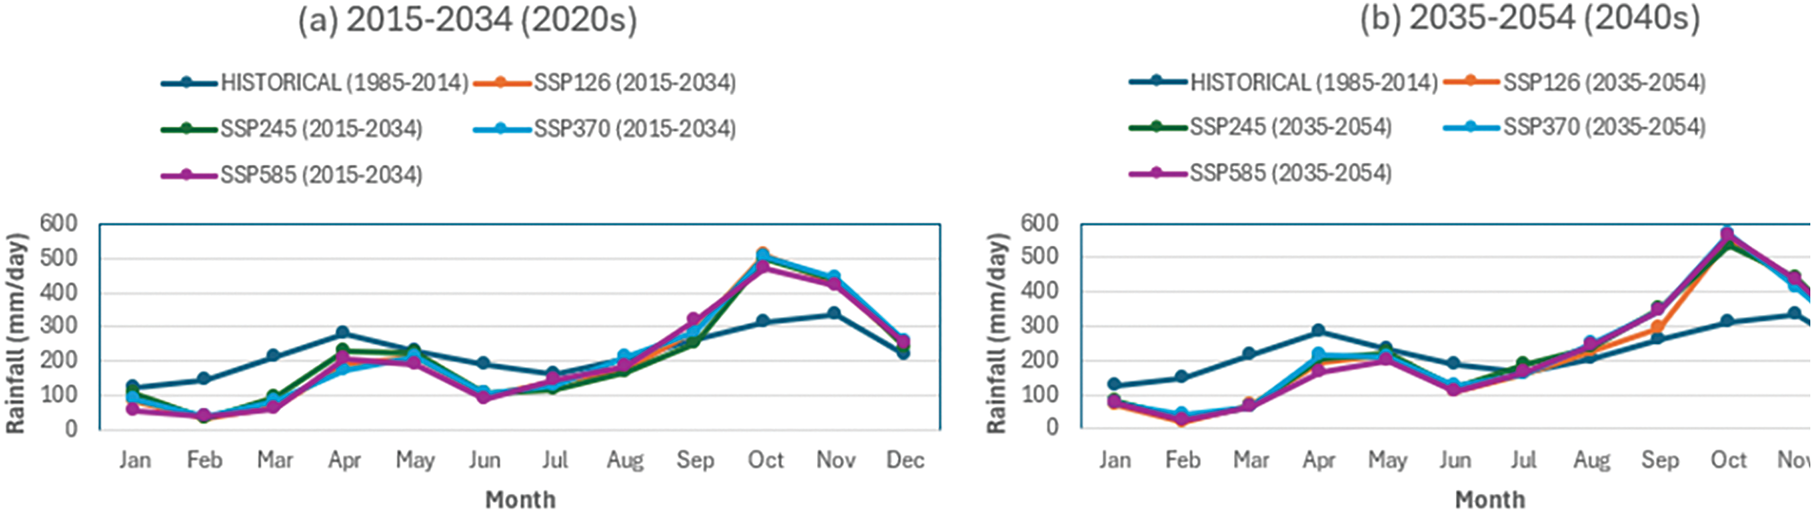

Figure 9: Mean rainfall for historical and future periods across the scenarios: (a) presents the trend in the mean rainfall for historical (1985–2014) and during the 2020s (2015 to 2034) for all the SSPs (SSP126, SSP245, SSP370, and SSP585); (b) presents the trend in the mean rainfall for historical (1985–2014) and during the 2040s (2035 to 2054) for all the SSPs; (c) presents the trend in the mean rainfall for historical (1985–2014) and during the 2060s (2055 to 2074) for all the SSPs; and (d) presents the trend in the mean rainfall for historical (1985–2014) and during the 2080s (2075 to 2094) for all the SSPs
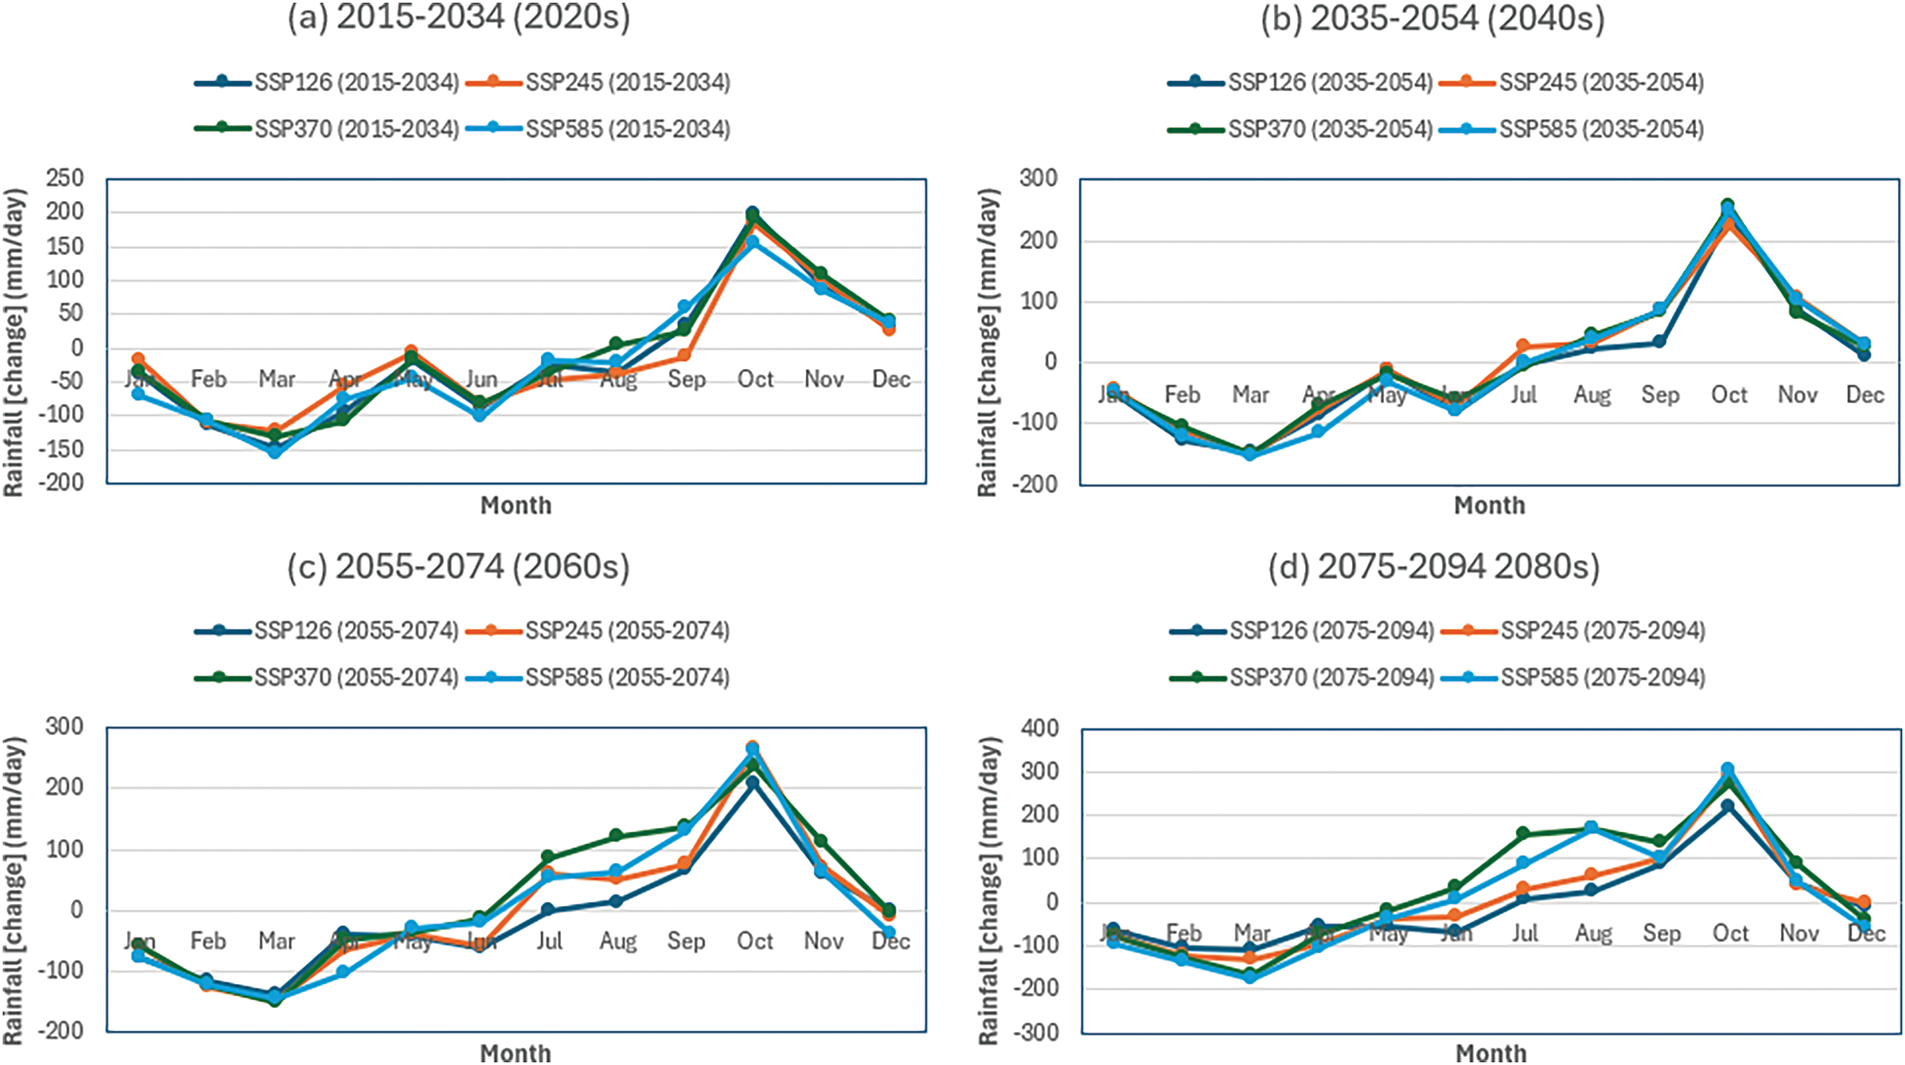
Figure 10: Mean changes of rainfall for future periods across the scenarios: (a) presents the trend in the mean changes of rainfall during the 2020s (2015 to 2034) for all the SSPs (SSP126, SSP245, SSP370, and SSP585); (b) presents the trend in the mean changes of rainfall during the 2040s (2035 to 2054) for all the SSPs; (c) presents the trend in the mean changes of rainfall during the 2060s (2055 to 2074) for all the SSPs; and (d) presents the trend in the mean changes of rainfall during the 2080s (2075 to 2094) for all the SSPs

Figure 11: Percent increment in mean maximum temperature for future periods across the scenarios
3.3 Changes in Climate Extremes
Table 2 presents the results of changes in climate extremes with values from the scenarios yielding a range of changes from the baseline dataset. The percentage changes in rainfall for wet days ranges from 4.39% (SSP585, 2020s)–77.87% (SSP370, 2080s), while for the dry days range from 1.56% (SSP245, 2020s)–5.58% (SSP585, 2080s). However, the percentage changes in maximum temperature for warmer periods range from 3.82% (SSP126, 2020s)–14.91% (SSP585, 2080s), while for the cold periods range from 6.39% (SSP126, 2020s)–16.19% (SSP585, 2080s), and the percentage changes in minimum temperature for warmer nights ranges from 6.74% (SSP126, 2020s)–19.98% (SSP585, 2080s), while for the cold nights range from −1.65% (SSP126, 2020s)–13.74% (SSP585, 2080s).

3.4.1 Spatial Variability and Implications of Maximum Temperature Projections
The maximum temperature (Tmax) in the Upper Bernam River Basin (UBRB) is projected to increase in both off-season and main seasons under different Shared Socioeconomic Pathways (SSPs). During the off seasons of the 2020s, Tmax was projected to increase significantly, with the lowest mean temperature of 32.3°C observed under SSP126 and the highest of 33.06°C under SSP585, compared to the historical mean temperature of 30.92°C. This represents an increase ranging from 4.47% (SSP126) to 6.91% (SSP585). Similarly, during the main seasons of the same period, Tmax increased with a mean ranging from 31.88°C under SSP126 to 32.46°C under SSP370, reflecting an increase of 5.16% to 7.05% from the historical mean of 30.32°C.
In the 2040s, similar trends were observed. During the off seasons, mean Tmax ranged from 32.39°C (SSP126) to 33.97°C (SSP585), increasing from 4.75% to 9.84%. For the main seasons, mean Tmax ranged from 31.85°C (SSP126) to 33.2°C (SSP585), showing an increase of 5.06% to 9.49%.
By the 2060s, off-season Tmax further increased, with SSP126 recording the lowest mean Tmax of 32.48°C (5.04% increase) and SSP585 the highest mean Tmax of 34.79°C (12.49% increase). Main-season Tmax also increased, ranging from 31.94°C (SSP126) to 34.09°C (SSP585), indicating increases of 5.34% to 12.43%.
By the 2080s, the off-season Tmax reached its highest point across all periods, with a mean Tmax of 35.68°C observed under SSP585 (15.38% increase), while SSP126 recorded a mean Tmax at 31.94°C (5.04% increase). Main-season average Tmax peaked at 31.99°C (SSP126, 5.5% increase) to 34.88°C (SSP585, 15.03% increase).
Overall, the lowest off-season average Tmax was observed in SSP126 during the 2020s, while the highest occurred in SSP585 during the 2080s. For the main seasons, the lowest average Tmax was recorded in SSP126 during the 2040s and the highest in SSP585 during the 2080s. The spatial variability of maximum temperature projections indicates a consistent increase across all scenarios (SSP126, SSP245, SSP370, SSP585) and timeframes, with the magnitude of warming intensifying from the near future (2020s) to the end of the century (2080s). These findings indicate that SSP585 is associated with increased Tmax and peak heat. This means high evapotranspiration will require more irrigation to compensate for this impact. These trends suggest local susceptibility to prolonged heat waves and heightened thermal stress, which could disrupt ecosystems and human activities.
The observed trends align with the findings of [20,68], who reported an increased Tmax for Malaysia’s Upper Bernam watershed. Based on the 5th Assessment Report, their study also noted that Tmax during the off-season and main-seasons are expected to increase across all scenarios compared to the historical period. Moreover, the trend observed in this study also aligns with the findings of [67,69–71].
The projections suggest that the selected climate scenarios will strongly influence future hydrological patterns, with SSP585 yielding the highest increases in Tmax. These results emphasize the importance of integrating climate projections into water resource management plans to mitigate the impacts of extreme heat, particularly during the 2080s.
3.4.2 Spatial Variability and Implications of Minimum Temperature Projections
The minimum temperature (Tmin) in the Upper Bernam River Basin (UBRB) was projected to increase in both off-seasons and main seasons under different Shared Socioeconomic Pathways (SSPs). During the off seasons of the 2020s, Tmin was projected to rise, with the lowest mean temperature of 25.49°C observed under SSP126 and the highest of 25.69°C under SSP585, compared to the historical mean temperature of 23.92°C. This represents an increase ranging from 6.56% (SSP126) to 7.36% (SSP585). Similarly, during the main seasons of the same period, Tmin increased with a mean ranging from 26.1°C under SSP126 to 26.3°C under SSP585, reflecting an increase of 9.96% to 10.81% from the historical mean of 23.74°C.
In the 2040s, similar trends were observed. During the off seasons, average Tmin ranged from 26.06°C (SSP126) to 26.72°C (SSP585), increasing from 8.92% to 11.68%. For the main seasons, the average Tmin ranged from 26.52°C (SSP126) to 27.28°C (SSP585), rising from 11.73% to 14.94%.
By the 2060s, off-season Tmin further increased, with SSP126 recording the lowest mean Tmin of 26.49°C (10.72% increase) and SSP585 the highest average Tmin of 28.12°C (17.55% increase). Main-season Tmin increased from 26.8°C (SSP126) to 28.69°C (SSP585), rising from 12.9% to 20.87%.
By the 2080s, the off-season Tmin reached its highest point across all periods, with an average Tmin of 26.82°C observed under SSP126 (12.1% increase), while SSP585 recorded an average Tmin at 29.22°C (22.14% increase). Main-season average Tmin peaked at 26.99°C (SSP126, 13.72% increase) to 29.84°C (SSP585, 25.73% increase).
Overall, the lowest off-season average Tmin was observed in SSP126 during the 2020s, while the highest occurred in SSP585 during the 2080s. For the main seasons, the lowest average Tmin was recorded in SSP126 during the 2020s and the highest in SSP585 during the 2080s. These findings indicate that SSP585 is associated with increased Tmin and peak heat. The notable pace of change implies warmer nights and reduced cooling periods, which could exacerbate urban heat island effects and stress nocturnal ecosystems. Additionally, the more significant rise in minimum temperatures relative to maximum temperatures could influence crop yields and increase energy demand for cooling. These results confirm trends reported by Ismail [20], though the smoother progression in this study reflects the adoption of more advanced CMIP6 data.
The minimum temperatures showed chronological increases both in the off-season and main-season, indicating a continuous increase in temperature till the end of the century. This implies adequate preparation and water-saving plans should be implemented to combat this impact. The observed trends align with the findings of [20,68], who reported an increased Tmin for Malaysia’s Upper Bernam watershed. Based on the 5th Assessment Report, their study also noted that Tmin during the off-season and main-seasons is expected to increase across all scenarios compared to the historical period. Furthermore, the trend observed in this study also aligns with the findings of [67,69–71].
The projections suggest that the selected climate scenarios will strongly influence future hydrological patterns, with SSP585 yielding the highest increases in Tmin. These results emphasize the importance of integrating climate projections into water resource management plans to mitigate the impacts of extreme heat, particularly during the 2080s. This study aligns with global climate change projections, which indicate a consistent rise in temperature and increased variability in rainfall patterns under high-emission scenarios [1]. The observed warming trend in UBRB is comparable to findings in other tropical regions, where rising temperatures contribute to enhanced evapotranspiration, altered hydrological cycles, and shifts in seasonal precipitation patterns [72–75]. The projected increase in maximum and minimum temperatures suggested a prolonged growing season but may also intensify heat stress on crops and water resources [69,76,77]. These changes necessitate adaptive measures, such as implementing climate-resilient agricultural practices and efficient water management strategies.
3.4.3 Spatial Variability and Implications of Rainfall Projections
The rainfall in the Upper Bernam River Basin (UBRB) is projected to experience contrasting trends between off seasons and main seasons under different Shared Socioeconomic Pathways (SSPs). During the off seasons of the 2020s, rainfall was projected to decline significantly, with the lowest mean fall of 105.05 mm observed under SSP585 and the highest of 131.22 mm under SSP245, compared to the historical mean of 197.48 mm. This represents a decrease ranging from 33.55% (SSP245) to 46.80% (SSP585). In contrast, during the main seasons of the same period, rainfall increased, ranging from 285.16 mm under SSP245 to 305.23 mm under SSP370, reflecting an increase of 14.44% to 22.49% from the historical means of 249.18 mm.
In the 2040s, similar trends were observed. During the off seasons, mean rainfall ranged from 106.22 mm (SSP585) to 121.21 mm (SSP370), with declines of 46.21% and 38.62%, respectively. For the main seasons, rainfall ranged from 313.89 mm (SSP126) to 333.73 mm (SSP245), increasing from 25.97% to 33.93%.
By the 2060s, off-season rainfall also declined, with SSP585 recording the lowest mean rainfall of 114.72 mm (41.9% decrease) and SSP370 the highest mean rainfall of 125.84 mm (36.27% decrease). Main-season rainfall increased drastically, from 307.56 mm (SSP126) to 364.22 mm (SSP370), rising from 23.43% to 46.17%.
Projections for the 2080s reveal the lowest off-season mean rainfall of 107.97 mm under SSP585 (45.32% decrease) and the highest of 125.19 mm under SSP370 (36.61% decrease). Main-season rainfall ranged from 311.56 mm (SSP126, 25.04% increase) to 379.87 mm (SSP370, 52.45% increase).
Overall, the lowest off-season rainfall was observed in SSP585 during the 2020s, while the highest occurred in SSP245 during the 2020s. For the main seasons, the lowest flow was recorded in SSP245 during the 2020s and the highest in SSP370 during the 2080s. These findings indicate that SSP370 is associated with increased precipitation and peak flows, whereas SSP585 suggests reduced precipitation and lower rainfall. Fluctuations between the 2040s and 2060s are evident, particularly in the SSP126 and SSP245 scenarios. The off-season reductions and increase in main-seasons suggest a heightened risk of seasonal droughts and flooding, necessitating improved water management and flood mitigation strategies. These findings are consistent with trends reported by [78] and align with [20,68], who reported significant seasonal variations in rainfall for Malaysia’s Upper Bernam watershed. Their study was based on the 5th Assessment Report, which also noted that precipitation during the main seasons is expected to increase across all scenarios compared to the off-season. Likewise, the trend observed in this study also aligns with the findings of [67,69–71].
This study shows the substantial seasonal and scenario-based variations in rainfall in the UBRB. The projections suggest that the selected climate scenarios will strongly influence future hydrological patterns, with SSP370 yielding the highest increases in main-season flows and SSP585 the most pronounced decline during off-seasons. These results emphasize the importance of integrating climate projections into water resource management plans to mitigate the impacts of extreme seasonal variations by saving excess flow during the main-season against the effects of low flows during the off-season. The variability in rainfall projections highlights potential risks associated with extreme droughts and increased flood frequency. The projected decline in rainfall during the dry months (January–April) may lead to water shortages, impacting irrigation systems and domestic water supply [79,80]. Meanwhile, the expected increase in precipitation during the monsoon season suggests an elevated risk of flooding, which could have severe consequences for infrastructure and livelihoods [54]. The findings indicate that future planning must include integrated flood risk management and investment in water storage infrastructure to mitigate these impacts [14].
Comparison with previous studies using CMIP5 models indicates that CMIP6 projections suggest more significant warming and intensified rainfall variability [81–84]. This reinforces the urgency of implementing climate adaptation strategies in the UBRB region, including early warning systems, improved land-use planning, and community-based adaptation initiatives [74]. The increased uncertainty in precipitation trends underscores the need for flexible, adaptive water governance frameworks to effectively respond to shifting climate conditions [75].
3.4.4 Analysis of Scenarios and Periodical Changes in Climate Extremes
Across all scenarios and periods, 95th percentile rainfall (extreme wet conditions) shows a gradual increase, particularly under SSP370 and SSP585. This suggests a growing likelihood of intense rainfall events, especially towards the late 21st century. The highest 95th percentile rainfall is projected for the 2080s under SSP370 (7.87%), indicating an intensification of extreme rainfall. The 10th percentile rainfall (indicative of dry conditions) also increases gradually but less sharply. This suggests some reduction in extreme dryness but not enough to offset wet-season flood risks. The range between the 95th and 10th percentiles widens over time, particularly under high-emission scenarios. This indicates increasing rainfall variability and hydrological extremes, which could strain water management systems.
Tmax at the 90th percentile, representing hot extremes, is projected to rise significantly over time and with emission severity. For instance, from 6.74% (SSP126, 2020s) to 19.98% (SSP585, 2080s), Tmax extremes nearly triple. The steepest increases occur under SSP370 and SSP585, underscoring the amplified warming under high-emission trajectories. 10th percentile Tmax values also rise across all scenarios, indicating a general warming trend even in the lower bounds of daytime temperatures. However, the gap between the 90th and 10th percentile Tmax widens, reflecting more frequent and intense heat waves.
Tmin extremes show a consistent upward trend; under SSP126, Tmin at the 90th percentile increases from 6.74% (2020s) to 11.76% (2080s). The highest Tmin 90th percentile change is under the SSP585, rising sharply to 19.98% by the 2080s, signifying pronounced nighttime warming. Notably, the 10th percentile Tmin typically cooler nighttime temperatures start negative or near zero in early periods (e.g., −1.65% in SSP126, 2020s) but become increasingly positive by the end of the century. The highest Tmin 10th percentile value is 13.74% under SSP585 in the 2080s, indicating a reduction in cold extremes.
Rainfall and temperature extremes (especially at the 95th and 90th percentiles) are projected to increase sharply, particularly under SSP370 and SSP585. This suggests heightened flood risks and heat stress. The widening gap between high and low percentiles (especially in Tmax and rainfall) signals increased inter-annual climate variability, complicating water and agricultural planning. The faster rise in Tmin, especially at the lower bound (10th percentile), indicates reduced cold relief during nights, which could have ecological and health impacts. While all scenarios indicate warming and more extreme events, the degree of change is highly scenario-dependent. Hence, mitigation efforts can be critical in reducing future extremes through adaptive infrastructure, climate-informed policy, and risk management strategies in the UBRB, especially as the region becomes more susceptible to compound extremes like heat waves followed by heavy rainfall events.
The study examined trends in rainfall and temperature projections in the Upper Bernam River Basin (UBRB), Malaysia, using downscaled CMIP6 scenarios (SSP126, SSP245, SSP370, and SSP585) for baseline (1985–2014) and future periods (2020s, 2040s, 2060s, and 2080s). The key findings and conclusions are summarized as follows:
Both maximum and minimum temperatures are projected to increase significantly across all scenarios and future periods. Projected increases in maximum temperature range from 1.47°C (2020s, SSP126) to 4.66°C (2080s, SSP585), while the minimum temperature range from 1.97°C (2020s, SSP126) to 5.70°C (2080s, SSP585).
The minimum temperatures are rising faster than maximum temperatures, indicating accelerated nighttime warming, which may affect crop physiology and evapotranspiration processes.
Rainfall projections show high temporal and inter-scenario variability. Relative changes range from decreases of up to −17.59% (2020s, SSP585) to increases of 6.63% (2080s, SSP370), suggesting growing uncertainty in seasonal water availability.
Seasonal shifts are evident, with reduced rainfall from January to April, raising concerns for off-season water supply and increased precipitation from May to November, which may intensify the risk of monsoonal flooding, especially under high-emission scenarios.
The most substantial decline in December rainfall is observed under SSP585 during the 2060s to 2080s, potentially disrupting end-of-year cropping cycles and water storage plans.
Compared to CMIP5-based studies, the projections from CMIP6 indicate more pronounced warming and rainfall changes, reflecting the higher climate sensitivity and improved representation of regional processes in the newer generation models.
The results reveal considerable uncertainty across emission scenarios and GCM ensembles, especially concerning future rainfall variability. This underscores the necessity of interpreting these projections as plausible ranges rather than deterministic outcomes. Decision-makers must adopt a precautionary and flexible approach to climate adaptation, emphasizing no-regret strategies and adaptive management frameworks that can accommodate various future conditions.
To build resilience against these projected trends, the study recommends the implementation of climate-resilient infrastructure, improved flood control systems, off-season water storage facilities, and the promotion of sustainable land use and agricultural practices. Policymakers and planners should incorporate climate scenario uncertainty into regional development frameworks to ensure sustainable and adaptive water and land management in the Upper Bernam River Basin.
Acknowledgement: The authors acknowledge the financial support of Nigeria’s Petroleum Technology Development Fund (PTDF). Also, the financial support of the Putra Grant under Universiti Putra Malaysia (Grant No. 9769000) is gratefully acknowledged, and we appreciate the Department of Irrigation and Drainage (DID) and the Malaysian Meteorological Department (MMD) for providing the daily meteorological data for this study. Additionally, the authors acknowledge the support of the Soil and Water Engineering Research Group, Faculty of Engineering, Universiti Putra Malaysia.
Funding Statement: This research was funded by the Petroleum Technology Development Fund (PTDF), the Federal Republic of Nigeria (Grant No. PTDF/ED/OSS/PHD/MDZ/1726/20).
Author Contributions: Conceptualization, Md. Rowshon Kamal and Muazu Dantala Zakari; data collection, Md. Rowshon Kamal and Muazu Dantala Zakari; formal analysis and interpretation of results, Md. Rowshon Kamal and Muazu Dantala Zakari; investigation, Muazu Dantala Zakari, Norulhuda Mohamed Ramli and Balqis Mohamed Rehan; resources, Md. Rowshon Kamal, Muazu Dantala Zakari and Mohd Syazwan Faisal Bin Mohd; writing—original draft preparation, Muazu Dantala Zakari; writing—review and editing, Md. Rowshon Kamal and Muazu Dantala Zakari; visualization, Md. Rowshon Kamal and Muazu Dantala Zakari; supervision, Md. Rowshon Kamal, Norulhuda Mohamed Ramli, Balqis Mohamed Rehan and Mohd Syazwan Faisal Bin Mohd; project administration, Md. Rowshon Kamal, Norulhuda Mohamed Ramli, Balqis Mohamed Rehan and Mohd Syazwan Faisal Bin Mohd; funding acquisition, Muazu Dantala Zakari. All authors reviewed the results and approved the final version of the manuscript.
Availability of Data and Materials: The original data used in this study are available in the Earth System Grid Federation (ESGF) data platform and the Malaysian Department of Irrigation and Drainage (DID), Water Resources and Hydrology Division, for historical meteorological and hydrological data.
Ethics Approval: Not applicable.
Conflicts of Interest: The authors declare no conflicts of interest to report regarding the present study.
References
1. IPCC. Climate change 2021—the physical science basis. Cambridge, UK: Cambridge University Press; 2023. 2392p. doi:10.1017/9781009157896. [Google Scholar] [CrossRef]
2. Mishra AK, Singh VP. A review of drought concepts. J Hydrol. 2010;391(1–2):202–16. [Google Scholar]
3. Trenberth KE, Fasullo JT, Shepherd TG. Attribution of climate extreme events. Nature Clim Change. 2015;5(8):725–30. doi:10.1038/nclimate2657. [Google Scholar] [CrossRef]
4. Allan RP, Soden BJ. Atmospheric warming and the amplification of precipitation extremes. Science. 2008;321(5895):1481–4. doi:10.1126/science.1160787. [Google Scholar] [PubMed] [CrossRef]
5. Intergovernmental Panel on Climate Change. Climate change 2007—the physical science basis: working group I contribution to the fourth assessment report of the IPCC. Cambridge, UK: Cambridge University Press; 2007. 1009 p. [Google Scholar]
6. Dai A. Drought under global warming: a review. Wires Clim Change. 2011;2(1):45–65. doi:10.1002/wcc.81. [Google Scholar] [CrossRef]
7. Yusuf AA, Francisco H. Climate change vulnerability mapping for Southeast Asia. Singapore: Economy and Environment Program for Southeast Asia (EEPSEA); 2009. 32 p. [Google Scholar]
8. Vadrevu K, Heinimann A, Gutman G, Justice C. Remote sensing of land use/cover changes in South and Southeast Asian Countries. Int J Digit Earth. 2019;12(10):1099–102. doi:10.1080/17538947.2019.1654274. [Google Scholar] [CrossRef]
9. Ooi SK, Amran A. Malaysia’s response and strategies towards climate change. World Rev Entrep Manag Sustain Dev. 2019;15(3):360. doi:10.1504/wremsd.2019.099411. [Google Scholar] [CrossRef]
10. Tan ML, Samat N, Chan NW, Lee AJ, Li C. Analysis of precipitation and temperature extremes over the Muda river basin. Malaysia Water. 2019;11(2):283. doi:10.3390/w11020283. [Google Scholar] [CrossRef]
11. Tan ML, Liang J, Hawcroft M, Haywood JM, Zhang F, Rainis R, et al. Resolution dependence of regional hydro-climatic projection: a case-study for the Johor River Basin. Malaysia Water. 2021;13(22):3158. doi:10.3390/w13223158. [Google Scholar] [CrossRef]
12. Sabater S, Freixa A, Jiménez L, López-Doval J, Pace G, Pascoal C, et al. Extreme weather events threaten biodiversity and functions of river ecosystems: evidence from a meta-analysis. Biol Rev Camb Philos Soc. 2023;98(2):450–61. doi:10.1111/brv.12914. [Google Scholar] [CrossRef]
13. Dorić V, Ivković M, Baranov V, Pozojević I, Mihaljević Z. Extreme freshwater discharge events exacerbated by climate change influence the structure and functional response of the chironomid community in a biodiversity hotspot. Sci Total Environ. 2023;879(6):163110. doi:10.1016/j.scitotenv.2023.163110. [Google Scholar] [PubMed] [CrossRef]
14. Eyring V, Bony S, Meehl GA, Senior CA, Stevens B, Stouffer RJ, et al. Overview of the coupled model intercomparison project phase 6 (CMIP6) experimental design and organization. Geosci Model Dev. 2016;9(5):1937–58. doi:10.5194/gmd-9-1937-2016. [Google Scholar] [CrossRef]
15. Abbas M, Zhao L, Wang Y. Perspective impact on water environment and hydrological regime owing to climate change: a review. Hydrology. 2022;9(11):203. [Google Scholar]
16. Ng CY, Wan Jaafar WZ, Mei Y, Othman F, Lai SH, Liew J. Assessing the changes of precipitation extremes in Peninsular Malaysia. Int J Climatol. 2022;42(15):7914–37. doi:10.1002/joc.7684. [Google Scholar] [CrossRef]
17. Singh V, Qin X. Study of rainfall variabilities in Southeast Asia using long-term gridded rainfall and its substantiation through global climate indices. J Hydrol. 2020;585(1):124320. doi:10.1016/j.jhydrol.2019.124320. [Google Scholar] [CrossRef]
18. Fredolin TT, Liew J, Ester S, Kwan MS, Le Loh J, Halimatun M. Climate change and variability over Malaysia: gaps in science and research information. Sains Malays. 2012;41(11):1355–66. [Google Scholar]
19. Venkatappa M, Sasaki N, Han P, Abe I. Impacts of droughts and floods on croplands and crop production in Southeast Asia—an application of Google Earth Engine. Sci Total Environ. 2021;795(170191):148829. doi:10.1016/j.scitotenv.2021.148829. [Google Scholar] [CrossRef]
20. Ismail H. Climate-smart agro-hydrological model for the assessment of future adaptive water allocation for Tanjong Karang rice irrigation scheme [dissertation]. Serdang, Malaysia: Universiti Putra Malaysia; 2021. [Google Scholar]
21. Salman SA, Nashwan MS, Ismail T, Shahid S. Selection of CMIP5 general circulation model outputs of precipitation for peninsular Malaysia. Hydrol Res. 2020;51(4):781–98. doi:10.2166/nh.2020.154. [Google Scholar] [CrossRef]
22. Shiru MS, Shahid S, Chae ST, Chung ES. Replicability of annual and seasonal precipitation by CMIP5 and CMIP6 GCMs over east Asia. KSCE J Civ Eng. 2022;26(4):1978–89. doi:10.1007/s12205-022-0992-6. [Google Scholar] [CrossRef]
23. Shiru MS, Chung ES, Shahid S, Wang XJ. Comparison of precipitation projections of CMIP5 and CMIP6 global climate models over Yulin. China Theor Appl Climatol. 2022;147(1):535–48. doi:10.1007/s00704-021-03823-6. [Google Scholar] [CrossRef]
24. O’Neill BC, Tebaldi C, van Vuuren DP, Eyring V, Friedlingstein P, Hurtt G, et al. The scenario model intercomparison project (ScenarioMIP) for CMIP6. Geosci Model Dev. 2016;9(9):3461–82. doi:10.5194/gmd-9-3461-2016. [Google Scholar] [CrossRef]
25. Riahi K, van Vuuren DP, Kriegler E, Edmonds J, O’Neill BC, Fujimori S, et al. The shared socioeconomic pathways and their energy, land use, and greenhouse gas emissions implications: an overview. Glob Environ Change. 2017;42:153–68. doi:10.1016/j.gloenvcha.2016.05.009. [Google Scholar] [CrossRef]
26. Kitoh A, Endo H, Krishna Kumar K, Cavalcanti IFA, Goswami P, Zhou T. Monsoons in a changing world: a regional perspective in a global context. J Geophys Res Atmos. 2013;118(8):3053–65. doi:10.1002/jgrd.50258. [Google Scholar] [CrossRef]
27. Tan ML, Ficklin DL, Ibrahim AL, Yusop Z. Impacts and uncertainties of climate change on streamflow of the Johor River Basin, Malaysia using a CMIP5 general circulation model ensemble. J Water Clim Change. 2014;5(4):676–95. doi:10.2166/wcc.2014.020. [Google Scholar] [CrossRef]
28. Prajapati HA, Yadav K, Hanamasagar Y, Kumar MB, Khan T, Belagalla N, et al. Impact of climate change on global agriculture: challenges and adaptation. Int J Environ Clim Change. 2024;14(4):372–9. doi:10.9734/ijecc/2024/v14i44123. [Google Scholar] [CrossRef]
29. Sivakumar MV. Climate change and water productivity. Water Product J. 2021;1(3):1–12. [Google Scholar]
30. Dlamini NS, Kamal MR, Bin Mohd Soom MA, bin Mohd MSF, Abdullah AFB, Hin LS. Modeling potential impacts of climate change on streamflow using projections of the 5th assessment report for the bernam river basin. Malaysia Water. 2017;9(3):226. doi:10.3390/w9030226. [Google Scholar] [CrossRef]
31. O’Neill BC, Kriegler E, Ebi KL, Kemp-Benedict E, Riahi K, Rothman DS, et al. The roads ahead: narratives for shared socioeconomic pathways describing world futures in the 21st century. Glob Environ Change. 2017;42(2):169–80. doi:10.1016/j.gloenvcha.2015.01.004. [Google Scholar] [CrossRef]
32. Zou J, Lu H, Shu C, Ji L, Gaur A, Wang L. Multiscale numerical assessment of urban overheating under climate projections: a review. Urban Clim. 2023;49:101551. doi:10.1016/j.uclim.2023.101551. [Google Scholar] [CrossRef]
33. Maraun D, Wetterhall F, Ireson AM, Chandler RE, Kendon EJ, Widmann M, et al. Precipitation downscaling under climate change: recent developments to bridge the gap between dynamical models and the end user. Rev Geophys. 2010;48(3):RG3003. doi:10.1029/2009rg000314. [Google Scholar] [CrossRef]
34. Munawar S, Rahman G, Moazzam MFU, Miandad M, Ullah K, Al-Ansari N, et al. Future climate projections using SDSM and LARS-WG downscaling methods for CMIP5 GCMs over the transboundary Jhelum River Basin of the Himalayas Region. Atmos. 2022;13(6):898. doi:10.3390/atmos13060898. [Google Scholar] [CrossRef]
35. Wilby RL, Dawson CW, Barrow EM. SDSM—a decision support tool for the assessment of regional climate change impacts. Environ Model Softw. 2002;17(2):145–57. doi:10.1016/S1364-8152(01)00060-3. [Google Scholar] [CrossRef]
36. Semenov MA, Stratonovitch P. Use of multi-model ensembles from global climate models for assessment of climate change impacts. Clim Res. 2010;41(1):1–14. doi:10.3354/cr00836. [Google Scholar] [CrossRef]
37. Hassan Z, Shamsudin S, Harun S. Application of SDSM and LARS-WG for simulating and downscaling of rainfall and temperature. Theor Appl Climatol. 2014;116(1):243–57. doi:10.1007/s00704-013-0951-8. [Google Scholar] [CrossRef]
38. Han Y, Yang J, Das LC. Evaluation of SDSM models for climate predictions in Bangladesh. Int J Big Data Mini Glob Warm. 2023;5(1):2350003. doi:10.1142/s2630534823500031. [Google Scholar] [CrossRef]
39. Chen J, Brissette FP, Leconte R. Uncertainty of downscaling method in quantifying the impact of climate change on hydrology. J Hydrol. 2011;401(3–4):190–202. doi:10.1016/j.jhydrol.2011.02.020. [Google Scholar] [CrossRef]
40. Disasa KN, Yan H, Wang G, Zhang J, Zhang C, Zhu X, et al. Trend analysis and projection of climate variables using the LARS-WG Model in coastal areas of China. Forthcoming. 2024;57(2):89. doi:10.21203/rs.3.rs-4015632/v1. [Google Scholar] [CrossRef]
41. Dibike YB, Coulibaly P. Hydrologic impact of climate change in the Saguenay watershed: comparison of downscaling methods and hydrologic models. J Hydrol. 2005;307(1–4):145–63. doi:10.1016/j.jhydrol.2004.10.012. [Google Scholar] [CrossRef]
42. Rahman M, Van Nguyen VT. A statistical approach to multisite downscaling of daily extreme temperature series: a case study using data in Bangladesh. J Hydro Environ Res. 2022;44(6):77–87. doi:10.1016/j.jher.2022.07.006. [Google Scholar] [CrossRef]
43. Cannon AJ, Sobie SR, Murdock TQ. Bias correction of GCM precipitation by quantile mapping: how well do methods preserve changes in quantiles and extremes? J Clim. 2015;28(17):6938–59. doi:10.1175/jcli-d-14-00754.1. [Google Scholar] [CrossRef]
44. Chen J, Yang Y, Tang J. Bias correction of surface air temperature and precipitation in CORDEX East Asia simulation: what should we do when applying bias correction? Atmos Res. 2022;280:106439. doi:10.1016/j.atmosres.2022.106439. [Google Scholar] [CrossRef]
45. Themeßl MJ, Gobiet A, Leuprecht A. Empirical-statistical downscaling and error correction of daily precipitation from regional climate models. Int J Climatol. 2011;31(10):1530–44. doi:10.1002/joc.2168. [Google Scholar] [CrossRef]
46. Dinku MB, Gibre AM. Comparison of bias correction methods to regional climate model simulations for climate change projection in Muger Subbasin, Upper Blue Nile Basin. Ethiopia J Water Clim Change. 2024;15(6):2612–27. doi:10.2166/wcc.2024.591. [Google Scholar] [CrossRef]
47. Feng D, Beck H, Lawson K, Shen C. The suitability of differentiable, physics-informed machine learning hydrologic models for ungauged regions and climate change impact assessment. Hydrol Earth Syst Sci. 2023;27(12):2357–73. doi:10.5194/hess-27-2357-2023. [Google Scholar] [CrossRef]
48. Hay LE, Wilby RL, Leavesley GH. A comparison of delta change and downscaled gcm scenarios for three mountainous basins in the United States. J Am Water Resour Assoc. 2000;36(2):387–97. doi:10.1111/j.1752-1688.2000.tb04276.x. [Google Scholar] [CrossRef]
49. Mohammed R, Scholz M. Climate change scenarios for impact assessment: lower Zab River Basin (Iraq and Iran). Atmos. 2024;15(6):673. doi:10.3390/atmos15060673. [Google Scholar] [CrossRef]
50. Teutschbein C, Seibert J. Bias correction of regional climate model simulations for hydrological climate-change impact studies: review and evaluation of different methods. J Hydrol. 2012;456(3):12–29. doi:10.1016/j.jhydrol.2012.05.052. [Google Scholar] [CrossRef]
51. Tefera GW, Ray RL, Wootten AM. Evaluation of statistical downscaling techniques and projection of climate extremes in central Texas, USA. Weather Clim Extrem. 2024;43(17):100637. doi:10.1016/j.wace.2023.100637. [Google Scholar] [CrossRef]
52. Su B, Huang J, Fischer T, Wang Y, Kundzewicz ZW, Zhai J, et al. Drought losses in China might double between the 1.5°C and 2.0°C warming. Proc Natl Acad Sci U S A. 2018;115(42):10600–5. doi:10.1073/pnas.1802129115. [Google Scholar] [PubMed] [CrossRef]
53. Hijioka Y, Lin E, Pereira JJ, Corlett RT, Cui X, Insarov G, et al. IPCC fifth assessment report: chapter 24 Asia. In: Barros VR, Field CB, Dokken DJ, Mastrandrea MD, Mach KJ, Bilir TE, et al., editors. Climate change 2014—impacts, adaptation and vulnerability: part B: regional aspects working group II contribution to the IPCC fifth assessment report. Cambridge, UK: Cambridge University Press; 2014. p. 1327–70. doi:10.1017/cbo9781107415416.007. [Google Scholar] [CrossRef]
54. Ismail H, Rowshon MK, Shanono NJ, Nasidi NM, Umar DA. Hydrological modelling for evaluating climate change impacts on streamflow regime in the Bernam River Basin Malaysia. Fudma J Sci. 2021;5(3):219–30. doi:10.33003/fjs-2021-0503-707. [Google Scholar] [CrossRef]
55. Liu Z, Huang J, Xiao X, Tong X. The capability of CMIP6 models on seasonal precipitation extremes over Central Asia. Atmos Res. 2022;278:106364. doi:10.1016/j.atmosres.2022.106364. [Google Scholar] [CrossRef]
56. Ismail H, Kamal MR, Abdullah AFB, Jada DT, Sai Hin L. Modeling future streamflow for adaptive water allocation under climate change for the tanjung karang rice irrigation scheme Malaysia. Appl Sci. 2020;10(14):4885. doi:10.3390/app10144885. [Google Scholar] [CrossRef]
57. Ha TV, Huth J, Bachofer F, Kuenzer C. A review of earth observation-based drought studies in Southeast Asia. Remote Sens. 2022;14(15):3763. doi:10.3390/rs14153763. [Google Scholar] [CrossRef]
58. Donat MG, Alexander LV, Yang H, Durre I, Vose R, Caesar J. Global land-based datasets for monitoring climatic extremes. Bull Am Meteor Soc. 2013;94(7):997–1006. doi:10.1175/bams-d-12-00109.1. [Google Scholar] [CrossRef]
59. Adger WN, Arnell NW, Tompkins EL. Successful adaptation to climate change across scales. Glob Environ Change. 2005;15(2):77–86 doi:10.1016/j.gloenvcha.2004.12.005. [Google Scholar] [CrossRef]
60. Mimura N. Sea-level rise caused by climate change and its implications for society. Proc Jpn Acad Ser B Phys Biol Sci. 2013;89(7):281–301. doi:10.2183/pjab.89.281. [Google Scholar] [PubMed] [CrossRef]
61. Kondum FA, Rowshon MK, Luqman CA, Hasfalina CM, Zakari MD. Change analyses and prediction of land use and land cover changes in Bernam River Basin. Malaysia Remote Sens Appl Soc Environ. 2024;36:101281. doi:10.1016/j.rsase.2024.101281. [Google Scholar] [CrossRef]
62. Alansi AW, Amin MSM, Abdul Halim G, Shafri HZM, Aimrun W. Validation of SWAT model for stream flow simulation and forecasting in Upper Bernam humid tropical river basin. Malaysia Hydrol Earth Syst Sci Discuss. 2009;6(6):7581–609. doi:10.5194/hessd-6-7581-2009. [Google Scholar] [CrossRef]
63. Ismail H, Kamal MR, bin Abdullah AF, bin Mohd MSF. Climate-smart agro-hydrological model for a large scale rice irrigation scheme in Malaysia. Appl Sci. 2020;10(11):3906. doi:10.3390/app10113906. [Google Scholar] [CrossRef]
64. Rowshon MK, Dlamini NS, Mojid MA, Adib MNM, Amin MSM, Lai SH. Modeling climate-smart decision support system (CSDSS) for analyzing water demand of a large-scale rice irrigation scheme. Agric Water Manag. 2019;216(3):138–52. doi:10.1016/j.agwat.2019.01.002. [Google Scholar] [CrossRef]
65. Abatzoglou JT, Brown TJ. A comparison of statistical downscaling methods suited for wildfire applications. Int J Climatol. 2012;32(5):772–80. doi:10.1002/joc.2312. [Google Scholar] [CrossRef]
66. Fang GH, Yang J, Chen YN, Zammit C. Comparing bias correction methods in downscaling meteorological variables for a hydrologic impact study in an arid area in China. Hydrol Earth Syst Sci. 2015;19(6):2547–59. doi:10.5194/hess-19-2547-2015. [Google Scholar] [CrossRef]
67. Muhammad MKI, Hamed MM, Harun S, Sa’adi Z, Sammen SS, Al-Ansari N, et al. Heatwaves in peninsular Malaysia: a spatiotemporal analysis. Sci Rep. 2024;14(1):4255. doi:10.1038/s41598-024-53960-x. [Google Scholar] [PubMed] [CrossRef]
68. Dlamini NS. Decision support system for water allocation in rice irrigation scheme under climate change scenarios [dissertation]. Serdang, Malaysia: Universiti Putra Malaysia; 2017. [Google Scholar]
69. Tan BT, Fam PS, Radin Firdaus RB, Tan ML, Gunaratne MS. Impact of climate change on rice yield in Malaysia: a panel data analysis. Agriculture. 2021;11(6):569. doi:10.3390/agriculture11060569. [Google Scholar] [CrossRef]
70. Tang KHD. Climate change in Malaysia: trends, contributors, impacts, mitigation and adaptations. Sci Total Environ. 2019;650((Pt 2)):1858–71. doi:10.1016/j.scitotenv.2018.09.316. [Google Scholar] [PubMed] [CrossRef]
71. Yang H, Zhong C, Jin T, Chen J, Zhang Z, Hu Z, et al. Stronger impact of extreme heat event on vegetation temperature sensitivity under future scenarios with high-emission intensity. Remote Sens. 2024;16(19):3708. doi:10.3390/rs16193708. [Google Scholar] [CrossRef]
72. Ehtasham L, Sherani SH, Nawaz F. Acceleration of the hydrological cycle and its impact on water availability over land: an adverse effect of climate change. Meteorol Hydrol Water Manage. 2024:188920. doi:10.26491/mhwm/188920. [Google Scholar] [CrossRef]
73. Stagl J, Mayr E, Koch H, Hattermann FF, Huang S, Rannow S, et al. Effects of climate change on the hydrological cycle in Central and Eastern Europe. In: Rannow S, Neubert M, editors. Managing protected areas in central and eastern Europe under climate change. Berlin/Heidelberg, Germany: Springer; 2014. p. 31–43. doi:10.1007/978-94-007-7960-0_3. [Google Scholar] [CrossRef]
74. Shrestha S, Bae DH, Hok P, Ghimire S, Pokhrel Y. Future hydrology and hydrological extremes under climate change in Asian River Basins. Sci Rep. 2021;11(1):17089. doi:10.1038/s41598-021-96656-2. [Google Scholar] [PubMed] [CrossRef]
75. Liang J, Tan ML, Hawcroft M, Catto JL, Hodges KI, Haywood JM. Monsoonal precipitation over peninsular Malaysia in the CMIP6 HighResMIP experiments: the role of model resolution. Clim Dyn. 2022;58(9–10):2783–805. doi:10.1007/s00382-021-06033-y. [Google Scholar] [CrossRef]
76. Becker R, Schüth C, Merz R, Khaliq T, Usman M, der Beek TA, et al. Increased heat stress reduces future yields of three major crops in Pakistan’s Punjab region despite intensification of irrigation. Agric Water Manag. 2023;281(4):108243. doi:10.1016/j.agwat.2023.108243. [Google Scholar] [CrossRef]
77. Tarkegn GB, Jury MR. Changes in the seasonality of Ethiopian Highlands climate and implications for crop growth. Atmos. 2020;11(9):892. doi:10.3390/atmos11090892. [Google Scholar] [CrossRef]
78. Tangang F, Chung JX, Juneng L, Supari, Salimun E, Ngai ST, et al. Projected future changes in rainfall in Southeast Asia based on CORDEX-SEA multi-model simulations. Clim Dyn. 2020;55(5):1247–67. doi:10.1007/s00382-020-05322-2. [Google Scholar] [CrossRef]
79. Linder Z, Holzkämper A, Zappa M. Climate change impacts on irrigation water resource in Switzerland. In: Proceedings of the EGU General Assembly 2021; 2021 Apr 19–30; Online. doi:10.5194/egusphere-egu21-14990. [Google Scholar] [CrossRef]
80. Allani M, Mezzi R, Zouabi A, Béji R, Joumade-Mansouri F, Hamza ME, et al. Impact of future climate change on water supply and irrigation demand in a small Mediterranean catchment. Case study: nebhana dam system, Tunisia. J Water Clim Change. 2020;11(4):1724–47. doi:10.2166/wcc.2019.131. [Google Scholar] [CrossRef]
81. Lei Y, Chen J, Xiong L. A comparison of CMIP5 and CMIP6 climate model projections for hydrological impacts in China. Hydrol Res. 2023;54(3):330–47. doi:10.2166/nh.2023.108. [Google Scholar] [CrossRef]
82. Sobie SR, Zwiers FW, Curry CL. Climate model projections for Canada: a comparison of CMIP5 and CMIP6. Atmos Ocean. 2021;59(4–5):269–84. doi:10.1080/07055900.2021.2011103. [Google Scholar] [CrossRef]
83. Ma D, Bai Z, Xu YP, Gu H, Gao C. Assessing streamflow and sediment responses to future climate change over the Upper Mekong River Basin: a comparison between CMIP5 and CMIP6 models. J Hydrol Reg Stud. 2024;52(1):101685. doi:10.1016/j.ejrh.2024.101685. [Google Scholar] [CrossRef]
84. Hamed MM, Nashwan MS, Shahid S, bin Ismail T, Wang XJ, Dewan A, et al. Inconsistency in historical simulations and future projections of temperature and rainfall: a comparison of CMIP5 and CMIP6 models over Southeast Asia. Atmos Res. 2022;265(9):105927. doi:10.1016/j.atmosres.2021.105927. [Google Scholar] [CrossRef]
Cite This Article
 Copyright © 2025 The Author(s). Published by Tech Science Press.
This work is licensed under a Creative Commons Attribution 4.0 International License , which permits unrestricted use, distribution, and reproduction in any medium, provided the original work is properly cited.
 Downloads
 Citation Tools