
 Submit a Paper
 Propose a Special lssue
 Open Access
ARTICLE

Forecasting LULC Dynamics of Soran under Future Climate Scenarios Using Machine Learning
1 Department of Petroleum Geosciences, Faculty of Science, Soran University, Soran, Erbil, 44008, Iraq
2 Department of Environmental Science, College of Science, University of Zakho, Zakho, 42002, Iraq
3 Department of Environmental Engineering, College of Engineering, Knowledge University, Erbil, 44001, Iraq
4 Applied Remote Sensing & GIS Center, University of Zakho, Zakho, 42002, Iraq
5 Faculty of Research Centre, Soran University, Soran, Erbil, 44008, Iraq
* Corresponding Author: Abdulqadeer Rash. Email:
Revue Internationale de Géomatique 2025, 34, 381-414. https://doi.org/10.32604/rig.2025.065870
Received 24 March 2025; Accepted 26 June 2025; Issue published 29 July 2025
 View Full Text
 Download PDF
Abstract
Changes in land use/land cover (LULC) are a substantial environmental subject with considerable consequences for human well-being, climate, and ecosystems. Innovative investigations for predicting LULC changes are essential for effective land management and sustainable development. This study used Landsat images and supplementary spatial factors to evaluate spatiotemporal LULC changes in Erbil Province, Kurdistan Region-Iraq. It predicts future changes in 2040 using four climates scenario-based Shared Socioeconomic Pathways (SSPs). The Random Forest (RF) model was used to classify and forecast LULC changes, which are crucial for effective land management and sustainable development. The RF model was assessed using performance metrics, such as the overall accuracy, F1-score, and kappa coefficient. The simulated LULC outcomes demonstrated the efficiency of the selected model, achieving an overall accuracy of 94.34%, a perfect agreement in the kappa statistic of 0.92, and a high F1-score between 0.71 and 0.93. The study revealed that agricultural land declines under SSP126 but increases under other scenarios, with SSP585 showing the highest gain (+209.98 sq. km, 23.32%). Barren land increased across all scenarios, whereas built-up areas consistently increased. Forest gains in SSP126 but declined in all other scenarios, with the most significant loss in SSP585 (−101.20 sq. km, −5.31%). The riparian zone gains in SSP126 but declines in all the other scenarios. Snow remained stable, but minor losses were observed in SSP245, SSP370, and SSP585. Water showed a slight increase in SSP126 but declined in all other scenarios. SSP126 showed minor changes, whereas SSP scenarios 370 and 585 show severe land transformations, forest loss, rangeland degradation, and urban expansion, indicating increased deforestation and degradation. This study highlights the importance of integrating a scenario-based RF model with hyperparameter tuning in remote sensing applications to improve LULC dynamics predictions, benefiting land-use planning, environmental management, and rational decision-making.Keywords
Land use/land cover (LULC) change is critical to global environmental change and profoundly influences ecological processes, climate dynamics, and socioeconomic systems [1]. Studying and predicting future LULC changes have gained prominence in recent decades because of their significant implications for biodiversity conservation, resource management, and sustainable development [2]. As human activities continue to reshape the Earth’s surface, predicting LULC change is essential for informed policy-making and effective land management strategies. By anticipating future scenarios, stakeholders can mitigate adverse impacts, adapt to environmental changes, and promote sustainable development goals [3,4].
One of the primary motivations for predicting LULC change is its role in addressing global and local environmental challenges, such as deforestation, urbanization, and agricultural expansion. For instance, deforestation driven by agrarian demands leads to soil erosion, landslides, and biodiversity loss, thereby impacting natural landforms [5,6]. Likewise, rapid urbanization modifies landforms through construction, roadways, and interference with natural drainage patterns, significantly affecting hydrology, air quality, and ecosystem services [7].
However, LULC change prediction is intrinsically complicated. This involves various interacting drivers, including natural and socioeconomic factors [8]. It is difficult to make forecasts because these factors change over different temporal and spatial scales. Predictions are already complicated, and feedback interactions between climatic systems and changes in land cover further exacerbate this situation [9]. The dynamic nature of LULC change necessitates the integration of advanced methodologies and tools, such as remote sensing (RS), geographic information systems (GIS), and spatial modeling, to identify patterns and forecast future changes [10].
Over the past two decades, many regions of the world have experienced an increased intensity and frequency of extreme climate events. These extreme events have been attributed to climate change [11,12]. The effects of climate change on the world’s natural landscapes are far-reaching and among the most critical environmental problems we face today. Changes in precipitation patterns, melting glaciers, increasing sea levels, and more intense weather events are all consequences of global warming and substantially impact the surrounding world [13]. Moreover, alterations in precipitation patterns can result in droughts or floods, which may modify the river flow dynamics and reconfigure river valleys. Extreme weather events with heightened frequency and severity, including hurricanes, storms, and wildfires, may harm natural landforms and ecosystems [14,15].
In this manner, advanced modeling tools have been established to predict LULC changes, including statistical models, machine learning (ML) approaches, and process-based simulations [16]. Statistical models, such as logistic regression and cellular automata, utilize prior information to discern trends and forecast future alterations [17,18]. ML methods, such as Random Forest (RF) and Artificial Neural Network (ANN), have become prominent because of their capacity to manage intricate, non-linear interactions among variables [19,20]. Land Change Modeler (LCM) and Conversion of Land Use and its Effects (CLUE) are two process-based models that use biophysical and socioeconomic variables to simulate changes in land use [21,22]. These models are frequently combined with spatial data from the RS and GIS to enhance their precision and relevance.
LULC change predictions commonly employ scenario-based approaches to explore the potential outcomes of different policy and management strategies. These scenarios are typically constructed based on assumptions regarding future climate, socioeconomic, and environmental trends [23–25]. For example, the shared socioeconomic pathways (SSPs) framework has been utilized to connect LULC change forecasts with global climate scenarios, allowing researchers to evaluate the interaction between land use and climate change [26]. A new scenario framework with SSPs has been created by climate change researchers to assist with a full analysis of future climate effects, vulnerabilities, adaptation and mitigation [27,28]. Scenario-based modeling offers critical insights into the consequences of competing land uses and helps identify pathways for sustainable development.
With the escalation of future climate data, the dynamics of future LULC are changing and vice versa [29]. Recent studies have investigated the impact of climate-based scenarios on future land cover and environmental development. Verniest et al. [30] highlighted the increasing pressure on biodiversity from human activities, including habitat destruction and climate change in the Mediterranean area, which is a biodiversity hotspot especially susceptible to these issues. A scenario analysis study by Li and Xu [31] examined the combined impact of climate change and land-use modifications on ecosystem services (ES) in the Qiangui Karst mountainous region in southwest China. M’Barek et al. [32] inspected the shared effects of climate and land-use changes on water resources in a semi-arid region in Morocco.
The motivation to proactively address the future and enhance present decision-making is essential for sustainable development and climate change mitigation. However, examining the spatial patterns of LULC under climate change conditions is crucial to achieving sustainable development objectives [4]. The significance of this study is that it is considered the first effort to incorporate climate-based scenarios for the future prediction of LULC changes using the ML approach in the Soran area in the northeastern part of Erbil province, Kurdistan region of Iraq. However, a few previous studies have been performed in the region using different tools in the field of LULC change predictions. For instance, Khwarahm et al. [33] utilized the CA–Markov model and geospatial methods to quantify past, current, and predict future changes in LULC in Erbil, Iraq.
The soran region exhibits a unique set of physical and socioeconomic characteristics that distinguish it from the predominantly flat or arid regions commonly studied in LULC change research [34–36]. Geographically, Soran is part of the Zagros mountain range and is characterized by complex topography, including steep slopes, deep valleys, and significant elevation variation. This rugged terrain creates diverse microclimatic conditions and ecological zones, ranging from semi-arid lowlands to temperate highland forests. Such heterogeneity presents both challenges and opportunities for land use, influencing settlement patterns, agricultural practices, and resource distribution.
In recent years, Soran has undergone rapid socioeconomic development, which has been marked by urban expansion, infrastructure construction, and increased agricultural activity. However, this development has occurred largely in the absence of formal land use planning, resulting in unregulated land transformation and environmental degradation. This area, which is faced with a post-conflict governance structure and limited historical land use data, presents a novel and challenging setting for predictive modeling.
Previous research on land use and land cover (LULC) dynamics has predominantly focused on lowland areas, with limited attention to mountainous and geopolitically sensitive regions such as Soran. This study addresses this gap by highlighting the need for machine learning approaches tailored to complex terrains, where conventional LULC modeling techniques often underperform due to spatial heterogeneity and data limitations.
Over the past three decades, there has been considerable change in LULC due to population growth and economic development. For instance, 11.33% of rangelands have declined and are used for agricultural land and urban expansion [37]. By identifying and predicting LULC changes, this study evaluates the effectiveness of ML approaches and proposes future changes for better land management. Thus, the key objectives of this study are: (1) To assess spatiotemporal LULC changes in the northeast of Erbil Province, Kurdistan Region-Iraq, using Landsat imagery and supplementary spatial factors. (2) To forecast future LULC transformations under different climate scenario-based SSPs for 2040. (3) To investigate how different SSP scenarios influence the changes in each LULC category.
The study area encompasses the districts of Soran, Choman, and Rwanduz, located in the northeastern part of the Kurdistan region-Iraq, with a total area of 3547.5 km2. This area serves as a commercial and tourist hub strategically located near the borders of Iran and Turkey and is a key point for cross-border trade. Fig. 1 illustrates several spatial and color composite Landsat OLI image (2021) within the study area. This region features a rugged mountainous terrain, profound valleys, and picturesque landscapes. Geologically, it consists of a highly folded zone and is an integral component of the Zagros mountain range, which dominates topography [38]. The mountains in these districts are among the highest in Iraq, often exceeding 3000 m above sea level. The area also includes discrete forests, rangelands, and fast-flowing rivers such as the Great Zab River, which plays a vital role in the hydrology of the region.

Figure 1: The geographical location of the study area, Landsat OLI image (2021) with color composite
The climate is predominantly continental, with cold, snowy winters and hot, dry summers. High-altitude areas, especially in Choman and parts of Soran, receive significant snowfall, contributing to the region’s water resources. The area is ecologically significant owing to its biodiversity and water resources. Forests and rangelands host several kinds of wildlife, some of which are prevalent in the Zagros range. Riparian trees, agriculture, and drinking water are vital sources of rivers and streams in these mountains.
The population comprises a mix of urban and rural communities engaged in agriculture, animal husbandry, and small-scale commerce. The economy of the studied region predominantly depends on agriculture, tourism, and commerce. In addition, the study area has exceptionally high potential and appropriateness for ecotourism [39]. The districts have witnessed infrastructural development in recent years, particularly in Soran, which has undergone rapid urban expansion over the past two decades owing to its economic and social appeal [40]. However, this development is accompanied by environmental challenges, such as deforestation and climate change, which threaten natural ecosystems. Moreover, unrestricted deforestation has led to reductions in both the extent and quality of forests. Land changes that were not sustainable were causing soil erosion and habitat degradation and lowering the amount of carbon that could be stored above-and-below ground [41].
To accurately capture LULC dynamics over a two-decade period, a minimum of three temporal datasets is recommended, which representing a baseline, an intermediate period, and the most recent state; to ensure robust trend analysis and model training. Accordingly, the years 2001, 2010, and 2021 were selected, following standard practices in LULC change studies [42,43]. This study employed Landsat satellite images obtained from the USGS Earth Explorer (https://earthexplorer.usgs.gov/, accessed on 05 May 2022) as primary data to examine historical and contemporary LULC trends for 2001, 2010, and 2021. The SRTM 30 m DEM was employed to derive the elevation and slope, while vector data were applied to ascertain proximity to roads and streams. The roads and streams data were obtained from the Ministry of Planning, Kurdistan Regional Government (KRG), Iraq. The datasets represent the infrastructure status as of the year 2021, aligning with the reference year for LULC classification.
In addition to the climatic parameters (maximum and minimum temperatures and precipitation), raster data were obtained from the WorldClim 2.1 dataset [44]. WorldClim is a dependable repository that provides historical and predicted long-term average data with a resolution of 1 km for temperature, precipitation, and many bioclimatic variables from 1970 to 2100 [11]. The spatial resolution of supplemental datasets and satellite images was meticulously selected and unified to 30 m for relevant mapping and forecasting of future scenarios. The selected climatic variables such as temperature (maximum and minimum) and precipitation are widely recognized in the literature [45–47] as key drivers of vegetation dynamics and LULC changes, particularly in mountainous and semi-arid ecosystems similar to the Soran region. Their strong influence on land surface processes makes them essential inputs for reliable LULC modeling.
Data preprocessing was performed using ENVI 5.3 software to guarantee quality and consistency among the datasets. Radiometric calibration was initially performed to convert digital numbers (DN) in the raw image into physical units, such as radiance or reflectance [48]. After that, image surface reflectance values were derived using atmospheric correction methods, such as ‘The Fast Line-of-sight Atmospheric Analysis of Spectral Hypercubes’ (FLAASH), which is designed to correct for atmospheric effects such as scattering and absorption by gases and aerosols to retrieve surface reflectance values [49]. Specifying the parameters on the Mid-Latitude atmospheric, a tropospheric aerosol model, and appropriate water-based retrieval content. Geometric correction and adjusted pixel resizing were then applied using ArcMap 10.8.2 version and R programming language V4.1.3. All datasets, including Landsat images and geospatial and climate data, were projected to the same coordinate reference system WGS84 UTM 38N and resampled to a uniform spatial resolution. Finally, image sub-setting was conducted to clip and focus the analysis on the area of interest using a study area bounding shapefile. It typically refers to the process of extracting a specific area of interest (AOI) from a larger image or dataset using extract by mask tool.
The methodological framework presented in Fig. 2 integrates the spatial, climatic, and temporal data to project future LULC changes. This framework uses historical LULC maps (2001, 2010, 2021), along with ancillary data (elevation, slope, and proximity to streams and roads), as well as climate data (temperature and precipitation) as inputs. Change detection analysis identifies past LULC transitions, which, along with spatial and climatic variables, serve as inputs for the RF model used for LULC prediction. The trained RF model underwent an initial validation by comparing its outputs with the 2021 LULC classified map. If the model’s performance is considered reasonable, it proceeds to the next step; otherwise, adjustments and enhancements are made, and the model is reassessed after optimizations have been implemented in the model hyperparameters. A single RF model was trained using historical LULC and climate data. Future climate projections under different SSPs were subsequently input into this model to generate separate LULC predictions for each scenario. Once the model is verified, it generates LULC projections for 2040 under the SSP scenarios, offering valuable insight for planning and environmental management.

Figure 2: Methodological flowchart (Source: *[37], **WorldClim (https://www.worldclim.org/data/index.html, accessed on 15 October 2024))
2.3.1 LULC Image Classification and Future Change Detection
Mapping of the LULC of the study area was performed on the data interpreted from both RS images and field observations. Multispectral Landsat images from different sensors (TM and OLI) were utilized for supervised classification using the RF model (Table 1). LULC was divided into eight classes: agricultural land, barren land, built-up area, forest, rangeland, riparian zone, snow, and water bodies, which are adapted from Anderson [50] classification scheme with local background adjustments. These classes were selected to align with regional land management policies and to capture key ecological characteristics relevant to the Soran region. From these data, 70% of the samples were allocated for training, while the remaining 30% were reserved for validation. The samples were randomly chosen to ascertain accuracy across all LULC classes. The LULC classification maps for 2001, 2010, and 2021 were derived from [37], and the obtained accuracy exceeded 97%. Post-classification change detection was performed using the open-source software QGIS to quantify LULC transitions across different periods. Additionally, transition matrices were created to illustrate conversions among classes.

2.3.2 Random Forest (RF) Model for LULC Prediction
Predicting LULC changes is a valuable tool for using enhanced climatic data in applications such as the estimation of LULC shifts, ecosystem management, climate change mitigation, policy decisions, and achieving sustainable goals [2]. The complex interaction of natural and human-induced elements, such as climate change, urbanization, and agricultural methods, influences LULC changes. Traditional methods for predicting LULC often rely on the opinions of experts and simple statistical models that might not fully capture the complex ways that driving factors and LULC dynamics interact with each other. Therefore, researchers have developed several classification techniques to map LULC patterns and dynamics from remotely sensed imagery. In recent years, the application of ML algorithms has become one of the most popular approaches [51]. ML algorithms, such as RF, provide a data-driven methodology that uses extensive datasets to enhance predictive accuracy [52].
The RF is an ensemble learning method that constructs multiple decision trees and aggregates their predictions. RF is a commonly used ML algorithm developed by Breiman [53] that combines the output of multiple decision trees to obtain a single result. RF modeling is recognized as one of the most accurate algorithms for preventing overfitting, representing the intricacies of input variables, handling high-dimensional data, effectively addressing noise, and providing feature importance measures [54,55]. Moreover, based on the RF algorithm, it outperformed other classifiers, as shown in earlier studies [36,37,56]. Furthermore, this algorithm first describes a collection of predictors for a forest, where each tree’s prediction is based on the values of a random vector sampled from an identical distribution [53].
The aforementioned advantages of the RF model have the potential for engagement in the current study for the LULC simulation process and future predictions. Hence, geospatial, topographic, and climatic factors were employed to simulate 2021 LULC data based on historical conditions from the 2001 and 2010 LULC maps. The simulation of the 2021 LULC image was executed using the Python-based RF model. With its extensive libraries and community support, Python offers a versatile platform for implementing RF models in this domain [57].
Thereafter, 2010 and 2021 LULC maps with the used factors were designated for the 2040 future prediction of the chosen study area under four combined climate scenarios and SSPs: SSP126, SSP245, SSP370, and SSP585. For this purpose, the most recent ‘WorldClim’ climate dataset was downloaded and examined along with spatial factors using the RF model to forecast future LULC changes under climatic scenarios. Open-source Python libraries (Numpy, Rasterio, and Scikit-learn) were utilized for LULC simulations and predictions using the RF model.
This classifier was trained using the training dataset and taking advantage of the Python script by using ‘class_weight_dict’ in ‘RandomForestClassifier’, the number of decision trees (ntree = 500), and other hyperparameters (maximum depth, minimum samples per split, minimum samples leaf, and maximum features) were optimized through grid search and cross-validation. Specifically, a 5-fold cross-validation approach was employed for model validation. The hyperparameter grid search explored the following ranges: ‘mtry’ values of 2, 4, and 6; ‘ntree’ values of 100, 300, and 500; and ‘nodesize’ values of 1, 5, and 10. It is worth noticing that a compelling run of the model requires computers with high specifications. All processing was conducted on an Intel Xeon Platinum 2.90 GHz 48-core (two processors) server equipped with 256 GB of RAM and operating on Windows 10 Pro 64-bit.
2.3.3 The SSP Future Scenarios
Shared Socioeconomic Pathways (SSPs) outline potential future trajectories for humanity, specifically when it comes to using fossil fuels and the socioeconomic factors that affect this consumption. These routes examine various technical, socioeconomic, and policy scenarios while addressing difficulties in mitigation and adaptation [27]. The SSPs used in this study represent a range of potential futures, with SSP126 depicting an environmentally sustainable trajectory, SSP245 reflecting moderate pathways, and SSP370 and SSP585 highlighting the consequences of weak environmental governance and high resource demand [26]. These scenarios are vital for guiding policymakers, researchers, and stakeholders in crafting strategies to mitigate the adverse effects on LULC. Additionally, the results of this study can assist authorities in proactive preservation planning.
SSPs provide a wide range of futures driven by different assumptions about population, economic growth, consumption and production patterns, and technology development [58]. In the lead-up to the “Intergovernmental Panel on Climate Change-Sixth Assessment Report” (IPCC AR6), a new set of emissions scenarios was developed based on different socioeconomic assumptions. Several SSP scenarios have been selected to drive climate models for the 6th “Coupled Model Inter-comparison Projects” CMIP6 [27].
This study simulated future LULC scenarios using the RF model in conjunction with driving factors such as elevation, slope, road proximity, stream proximity, and climatic data. The climatic variables incorporated from the CMIP6 Global Climate Model (GCM) include mean maximum temperature, mean minimum temperature, and total annual precipitation. These variables were selected due to their significant influence on vegetation dynamics and land use suitability, particularly in mountainous ecosystems like the Soran region. For the 2040 scenario, only climatic variables were projected to change based on the GCM outputs, whereas topographic and infrastructure-related variables (elevation, slope, distance to roads and streams) were assumed to remain static due to a lack of reliable future projections for these features. Moreover, the SSP scenarios used in this study are based on four narratives describing alternative socioeconomic developments, including “sustainable development, middle-of-the-road development, regional rivalry, and fossil-fueled development”. For this purpose, ACCESS-CM2 (Australian Community Climate and Earth System Simulator) GCM was used to project the climate under four SSPs (126, 245, 370, and 585).
These four global SSPs, originally provided at a coarse resolution of 1 km from WorldClim climate data, were downloaded and spatially downscaled to 30 m. Raster resampling was performed using the ‘resample ()’ function in R. The ‘resample ()’ function in the raster package employs bilinear interpolation by default unless specified otherwise. The obtained raster was clipped to fit the selected study area using R package [59]. In line with the methodologies outlined by O’Neill et al. [26], Riahi et al. [27], and the sixth assessment report [13], a brief description of each SSP scenario is provided below.
SSP126
This scenario visualizes a world that makes considerable progress toward sustainable development, with few challenges to mitigation and adaptation. It highlights inclusive development, reduced inequalities, and a shift toward sustainable consumption and production patterns. Moreover, the implications of LULC include strong environmental policies that lead to reduced deforestation rates, increased afforestation, and managed urban expansion with minimal encroachment into natural habitats. Sustainable agricultural intensification minimizes cropland expansion into natural ecosystems and preserves biodiversity. In addition, well-planned urban development limits urban sprawl, protecting surrounding natural landscapes.
SSP126 is a climatic scenario that signifies the future in which the globe adheres to a sustainable growth trajectory while attaining substantial greenhouse gas (GHG) reduction. This scenario is in line with the lower range of expected emissions and is related to maintaining global warming below 2°C (Fig. 3) by the end of the 21st century.

Figure 3: A representation of the trend of the changes in global surface temperature under the four SSP-based scenarios adopted from (https://climatedata.ca/resource/understanding-shared-socio-economic-pathways-ssps/, accessed on 23 January 2025)
SSP245
This trajectory signifies an extension of existing tendencies, accompanied by modest challenges in mitigation and adaptation. It encompasses gradual development and a combination of technological innovations and environmental regulations. The consequences of LULC dynamics manifest at modest rates, with certain regions undergoing deforestation owing to agricultural growth, whereas others engage in conservation initiatives. Urban areas increase modestly, exhibiting diverse levels of planning and effects on adjacent land covers. Ongoing stress on ecosystems is less intense than in high-impact scenarios. The effectiveness of governance and institutions is moderate, leading to delays in climate policy implementation. Global warming projections under this pathway are approximately 2.7°C–3.0°C warming by 2100 (Fig. 3) compared to pre-industrial levels. Moderate but insufficient climate policies lead to a higher risk of extreme weather events. This pathway reflects a world where climate action is reserved but not at the scale or urgency needed to prevent significant climate change impacts.
SSP370
This scenario represents a disconnected world facing significant issues in terms of mitigation and adaptation. It is characterized by regional conflicts, inadequate global cooperation, and slow economic development. Inferences for LULC change due to limited environmental regulations and regional resource competition result in high deforestation rates. Elevated agricultural and resource extraction demand and low agrarian productivity have led to habitat loss. From the perspective of urbanization, uncontrolled urban expansion exacerbates land degradation and intrusion into natural areas. GHG emissions continue to rise throughout the 21st century, peaking late. This increase has been driven by agriculture, LULC changes, and dependence on fossil fuels. Under this pathway, global warming projections are approximately 3.5°C–4.0°C warming by 2100 (Fig. 3) compared to pre-industrial levels.
This upsurge substantially increases extreme weather events, including droughts, heatwaves, hurricanes, and floods. Additionally, the consequences of this scenario include a weak global response to climate-related disasters and worsening humanitarian crises. Fossil fuels remain dominant, with limited investment in renewables. This pathway greatly exceeds the safe climate limits, making it one of the most dangerous climate futures regarding environmental, economic, and social impacts.
SSP585
This trajectory anticipates swift economic expansion propelled by fossil fuels, accompanied by significant difficulties in mitigation and adaptation. It underscores energy-intensive lifestyles, few environmental considerations, and elevated demand for land and resources, which results in substantial forest loss and the deterioration of natural ecosystems. Intensive agricultural growth occurs to satisfy global food and bioenergy requirements, frequently at the cost of forests and grasslands. Accelerated and extensive urban development has led to substantial LULC alterations, including the depletion of cultivable land and natural ecosystems.
Moreover, SSP585 represents rapid technological progress and globalization but relies heavily on fossil fuels, the continued growth of heavy industries, and transportation, resulting in extremely high GHG emissions and severe climate impacts. Average warming will rise close to 4.4°C by 2100 (Fig. 3), and the likely range of 3.3°C–5.7°C will cause extreme heatwaves, prolonged droughts, severe storms, flooding, and displacement to become widespread.
2.3.4 Model Performance Metrics for LULC Prediction
This study evaluated the accuracy of simulated and predicted LULC maps by calculating the confusion matrix to extract the user accuracy (precision), producer accuracy (recall), F1-score, overall accuracy (OA), and kappa coefficient (Kc) for each LULC estimation. These validation parameters were derived using the 2021 reference maps, both simulated and classified, and all metrics were generated by comparing the maps to measure the performance of the model. The confusion matrix provides a detailed comparison between the known reference data and predicted classification results. It analyzes their connection as a matrix class by class, consequently facilitating a comprehensive understanding of the model’s performance [60]. The equations for these metrics are given in Eqs. (1)–(5).
where N is the total number of observations included in the error matrix, r is the number of rows, xii is the number of observations in a row ‘i’ and column ‘i’, xi+ is the total of observations in a row ‘i’, x+i is a total of observations in column ‘i’.
The user’s accuracy (precision) represents the proportion of actual positive predictions among all positive forecasts. The producer’s accuracy (recall) measures the number of accurately forecasted actual positives. The F1-score is a performance indicator for assessing ML models, integrating precision and recall into a single metric. It ranges from 0 to 1, with higher values indicating higher accuracy [61]. The overall accuracy (Eq. (4)) quantifies the accuracy of the model for correctly classifying each pixel. The Kc “kappa” statistic quantifies the variation between observed and expected agreement between reference data and an automated classifier [62]. The average Kc value from the study was used to select the best outcomes for the RF model. Models with a K average below 0.60 showed weak levels, while those over 0.60 showed fair agreement. Ranges of 0.80–0.89 indicated strong agreement, while values beyond 0.90 represented nearly perfect levels [63].
3.1 LULC Simulation and Model Accuracy
In this study, Table 2 presents the accuracy of various LULC maps for the classified and simulated 2021 years and predicted maps under various SSP projections for 2040. The primary evaluation metric was OA, which assesses the percentage of accurately classified pixels in the LULC map concerning ground truth/reference data. Kc serves as a statistical metric that assesses classification accuracy by comparing observed and expected accuracy. A Kc value of 1 signifies a perfect agreement between the classified map and reference data.

The 2021 LULC historical map recorded the highest OA and Kc value, indicating excellent and exceptionally reliable classification quality. The high accuracy of LULC classification can be attributed to the integration of high-quality input data, advanced processing techniques, and the use of robust classification methods [64]. The OA and Kc values of simulated 2021 were 94.34% and 0.92, respectively. Although the OA and Kc of the simulated 2021 are less than those of the classified 2021, they still demonstrate high accuracy and are deemed acceptable, as conferred by [63].
The last four rows of Table 2 indicate future predictions for 2040 under the SSP scenarios, which are the climate and socioeconomic development scenarios used in the LULC modeling. The accuracy for all 2040 SSP predictions ranged between 92.78% and 93.13%, slightly lower than the simulated 2021 map, which suggests increasing LULC complexity and potential classification challenges in future scenarios. The close range of prediction accuracies for 2040 (92.78% and 93.13%) may indicate a limited sensitivity of the model to variations among the input scenarios. However, it can also reflect the model’s robustness and stability in maintaining high performance across differing climatic projections. The classification models exhibit continuously high accuracy, rendering LULC predictions dependable. The small reduction in accuracy may result from heightened terrain complexity and difficulties in RS categorization. Mountainous terrains often contribute to reduced classification accuracy due to shadow effects and elevation-induced spectral variation [65]. The 2040 SSP forecasts exhibit comparable accuracy levels, indicating that LULC alterations across various scenarios do not significantly affect classification quality. These findings suggest the reliability of the RF model in forecasting LULC and underscore potential LULC dynamics across various socioeconomic scenarios [66–68].
The essence of the Python-based RF model is to predict future conditions based on the current state or historical data, as well as the probability of state transitions. We forecast 2040 LULC configurations based on the specified scenarios, providing insights into the socioeconomic and environmental consequences. Other researchers have applied this model in various areas on different platforms for LULC classification and achieved high-accuracy assessment [52,67,69,70]. These studies provide predictions for future land cover scenarios utilizing Landsat data and ancillary information, aiding sustainable resource management and urban planning.
Our study adheres to the recommendation of Prestele et al. [71] of employing ML models to enhance LULC forecasts based on climatic and socioeconomic data. Therefore, this study used the RF model and selected topographic and geographical variables liable for LULC changes: elevation, slope gradient, Euclidean stream proximity, and Euclidean road proximity. Additionally, climate variables such as maximum and minimum temperatures and precipitation were utilized based on prior studies [25,70,72]. As shown in Fig. 4, relevant variables were used to create the factor maps. Geometry correction and downscaling processes were conducted, including image dimension and raster cell size, at 30 m resolution for all spatial variables.

Figure 4: Spatial distribution of various topographic and environmental parameters over the study area. Panels represent the following datasets: (a) elevation values (m), (b) slope in degrees, (c) stream proximity (m), (d) ROAD proximity (m), (e) maximum temperature (°C), (f) minimum temperature (°C), and (g) precipitation (mm)
This study predicted a simulated map of 2021 using a Python-based RF model after involving the topographic and environmental factors and LULC images of 2001 and 2010 as the initial and final maps, respectively. Fig. 5 depicts maps of both the classified LULC 2021 and simulated LULC 2021. The LULC categories include agricultural land (yellow), barren land (brown), built-up area (red), forest (green), rangeland (pink), riparian zone (light green), snow (light blue), and water bodies (blue). The figure presents a comparative analysis of the LULC classification and simulation for the year 2021. The left panel (a) represents the classified LULC derived from actual land cover data, whereas the panel (b) displays the simulated LULC generated using predictive modeling techniques.

Figure 5: Assessment of LULC maps for 2021. (a) LULC classified map based on actual data for 2021. (b) LULC simulated map for 2021
Moreover, the two maps exhibited a visible similarity in the geographical distribution of the various land cover categories. Nonetheless, several differences exist between the categorized and simulated outcomes, as shown in Table 3. The classified LULC map displays a slightly more varied land cover distribution. However, the simulated map presented a more generalized pattern, which is a common trait of predictive models used for forecasting LULC changes [72]. The simulation model effectively captured the urban expansion patterns, agricultural land, and rangeland in the two maps. However, it slightly underrepresented the barren land and forest coverage compared to the classified map. The portrayal of riparian zones showed variability, with the simulated map tending to predict a more fragmented distribution.

These discrepancies may stem from the constraints of the model, which may not comprehensively encompass all variations in a heterogeneous study area. The observed misclassifications, including the overestimation of forest cover and underestimation of water bodies, can be attributed to several factors such as model complexity, cloud cover interference, input data quality, and spatial resolution limitations. Complex class boundaries, residual cloud contamination, and inconsistencies in input datasets may lead to inaccuracies in class discrimination. Additionally, the spatial resolution used can cause generalization errors, making it challenging to accurately delineate small or fragmented land cover types, thereby contributing to misclassification [73,74].
A proportional analysis of the historical and simulated LULC changes over time, specifically focusing on the years 2001, 2010, and 2021, is quantified in Table 3. It provides classified and simulated LULC areas for 2021, along with the change in area between the classified (C) and simulated (S) data, percentage change, F1-score, and model accuracy for each class.
As recorded in Table 3, agricultural land declined substantially from 813.94 km2 in 2001 to 531.56 km2 in 2010 but experienced a modest increase to 617.20 km2 by 2021. The simulated model overestimates agricultural land at 654.14 km2, exceeding the observed value by 36.94 km2 (1.04% change). Barren land reached its highest extent in 2010 (839.69 km2) before decreasing to 537.96 km2 in 2021. The model slightly overestimates this category at 560.94 km2, with a 22.98 km2 discrepancy (0.65% difference). Built-up areas have steadily expanded from 34.87 km2 in 2001 to 50.52 km2 in 2021. However, the model predicts a larger extent of 72.16 km2, overestimating by 21.64 km2 (0.61% change). Forest area declined sharply from 447.99 km2 in 2001 to 243.28 km2 in 2010, followed by partial recovery to 289.48 km2 in 2021. The model overestimated forest area at 364.51 km2, with a difference of 75.03 km2 (2.12% change).
The extent of rangeland has consistently increased from 1435.68 km2 in 2001 to 1967.99 km2 in 2021. However, the simulation underestimates this value, projecting 1790.12 km2, with a shortfall of 177.87 km2 (–5.02% change). The riparian zone has experienced a slight expansion, reaching 57.38 km2 in 2021, while the simulation significantly overestimates it at 91.46 km2, exceeding the actual value by 34.08 km2 difference (0.96% change). Snow cover has declined from 10.72 km2 in 2001 to 5.18 km2 in 2021, yet the simulation overestimated it at 9.35 km2, with a discrepancy of 4.17 km2 (0.11% change). Similarly, water areas have shrunk from 28.29 km2 in 2001 to 21.80 km2 in 2021, but the simulation drastically underestimates this category, predicting only 4.83 km2, with a considerable shortfall of −16.97 km2 (−0.47% change).
The highest F1-score value was observed for rangeland (0.93), while the lower F1-score values were recorded for riparian zones (0.75) and snow (0.71). This is likely due to the complexity and dynamic nature of these categories. The model’s OA was reported to be 94.34%, with a Kc of 0.92, indicating a high level of agreement between the classified and simulated LULC data. These findings underscore the possibility of enhancing simulation approaches, including integrating higher spatial resolution data and refining transition probabilities to increase forecast accuracy [75].
3.2 Model’s Variable Importance
RF are ensemble learning methods that aggregate multiple decision trees to enhance predictive accuracy and reduce overfitting [53]. A significant advantage of RF models is their ability to evaluate variable importance, which quantifies the contribution of each feature to the model’s predictive performance. Two widely used measures are the Gini impurity-based importance and permutation importance. Higher values in both measures indicate that a variable substantially influences the LULC classification [76].
Fig. 6 illustrates the variable importance results. In Fig. 6a, variables are ranked according to their Gini index values, with precipitation emerging as the most influential predictor, followed by maximum temperature and elevation. These variables notably reduce impurity during the decision-making process, underscoring their critical role in the model’s performance.

Figure 6: Variable importance (a) Gini impurity (b) permutation importance
In Fig. 6b, permutation importance identifies elevation as the leading predictor, contributing the highest percentage to model accuracy, followed closely by precipitation. Maximum temperature also demonstrates considerable importance, though slightly lower than the aforementioned variables. Overall, these results highlight that precipitation, elevation, and temperature are the key drivers influencing LULC transitions, reinforcing the substantial role of climatic and topographic factors in shaping future LULC dynamics in the Soran region.
3.3 LULC Future Predictions and Change Analysis
Fig. 7 depicts the LULC projections for 2040 under four SSPs: SSP126, SSP245, SSP370, and SSP585. These SSPs represent alternative futures based on socioeconomic development and climate change mitigation efforts, with SSP126 being the most sustainable and SSP585 representing the most fossil fuel-dependent, high-emission scenario. The spatial distribution of different land cover classes, such as agricultural land, built-up areas, forests, rangelands, barren land, riparian zones, water bodies, and snow cover, illustrates possible changes driven by climate policies and socioeconomic trends [77].
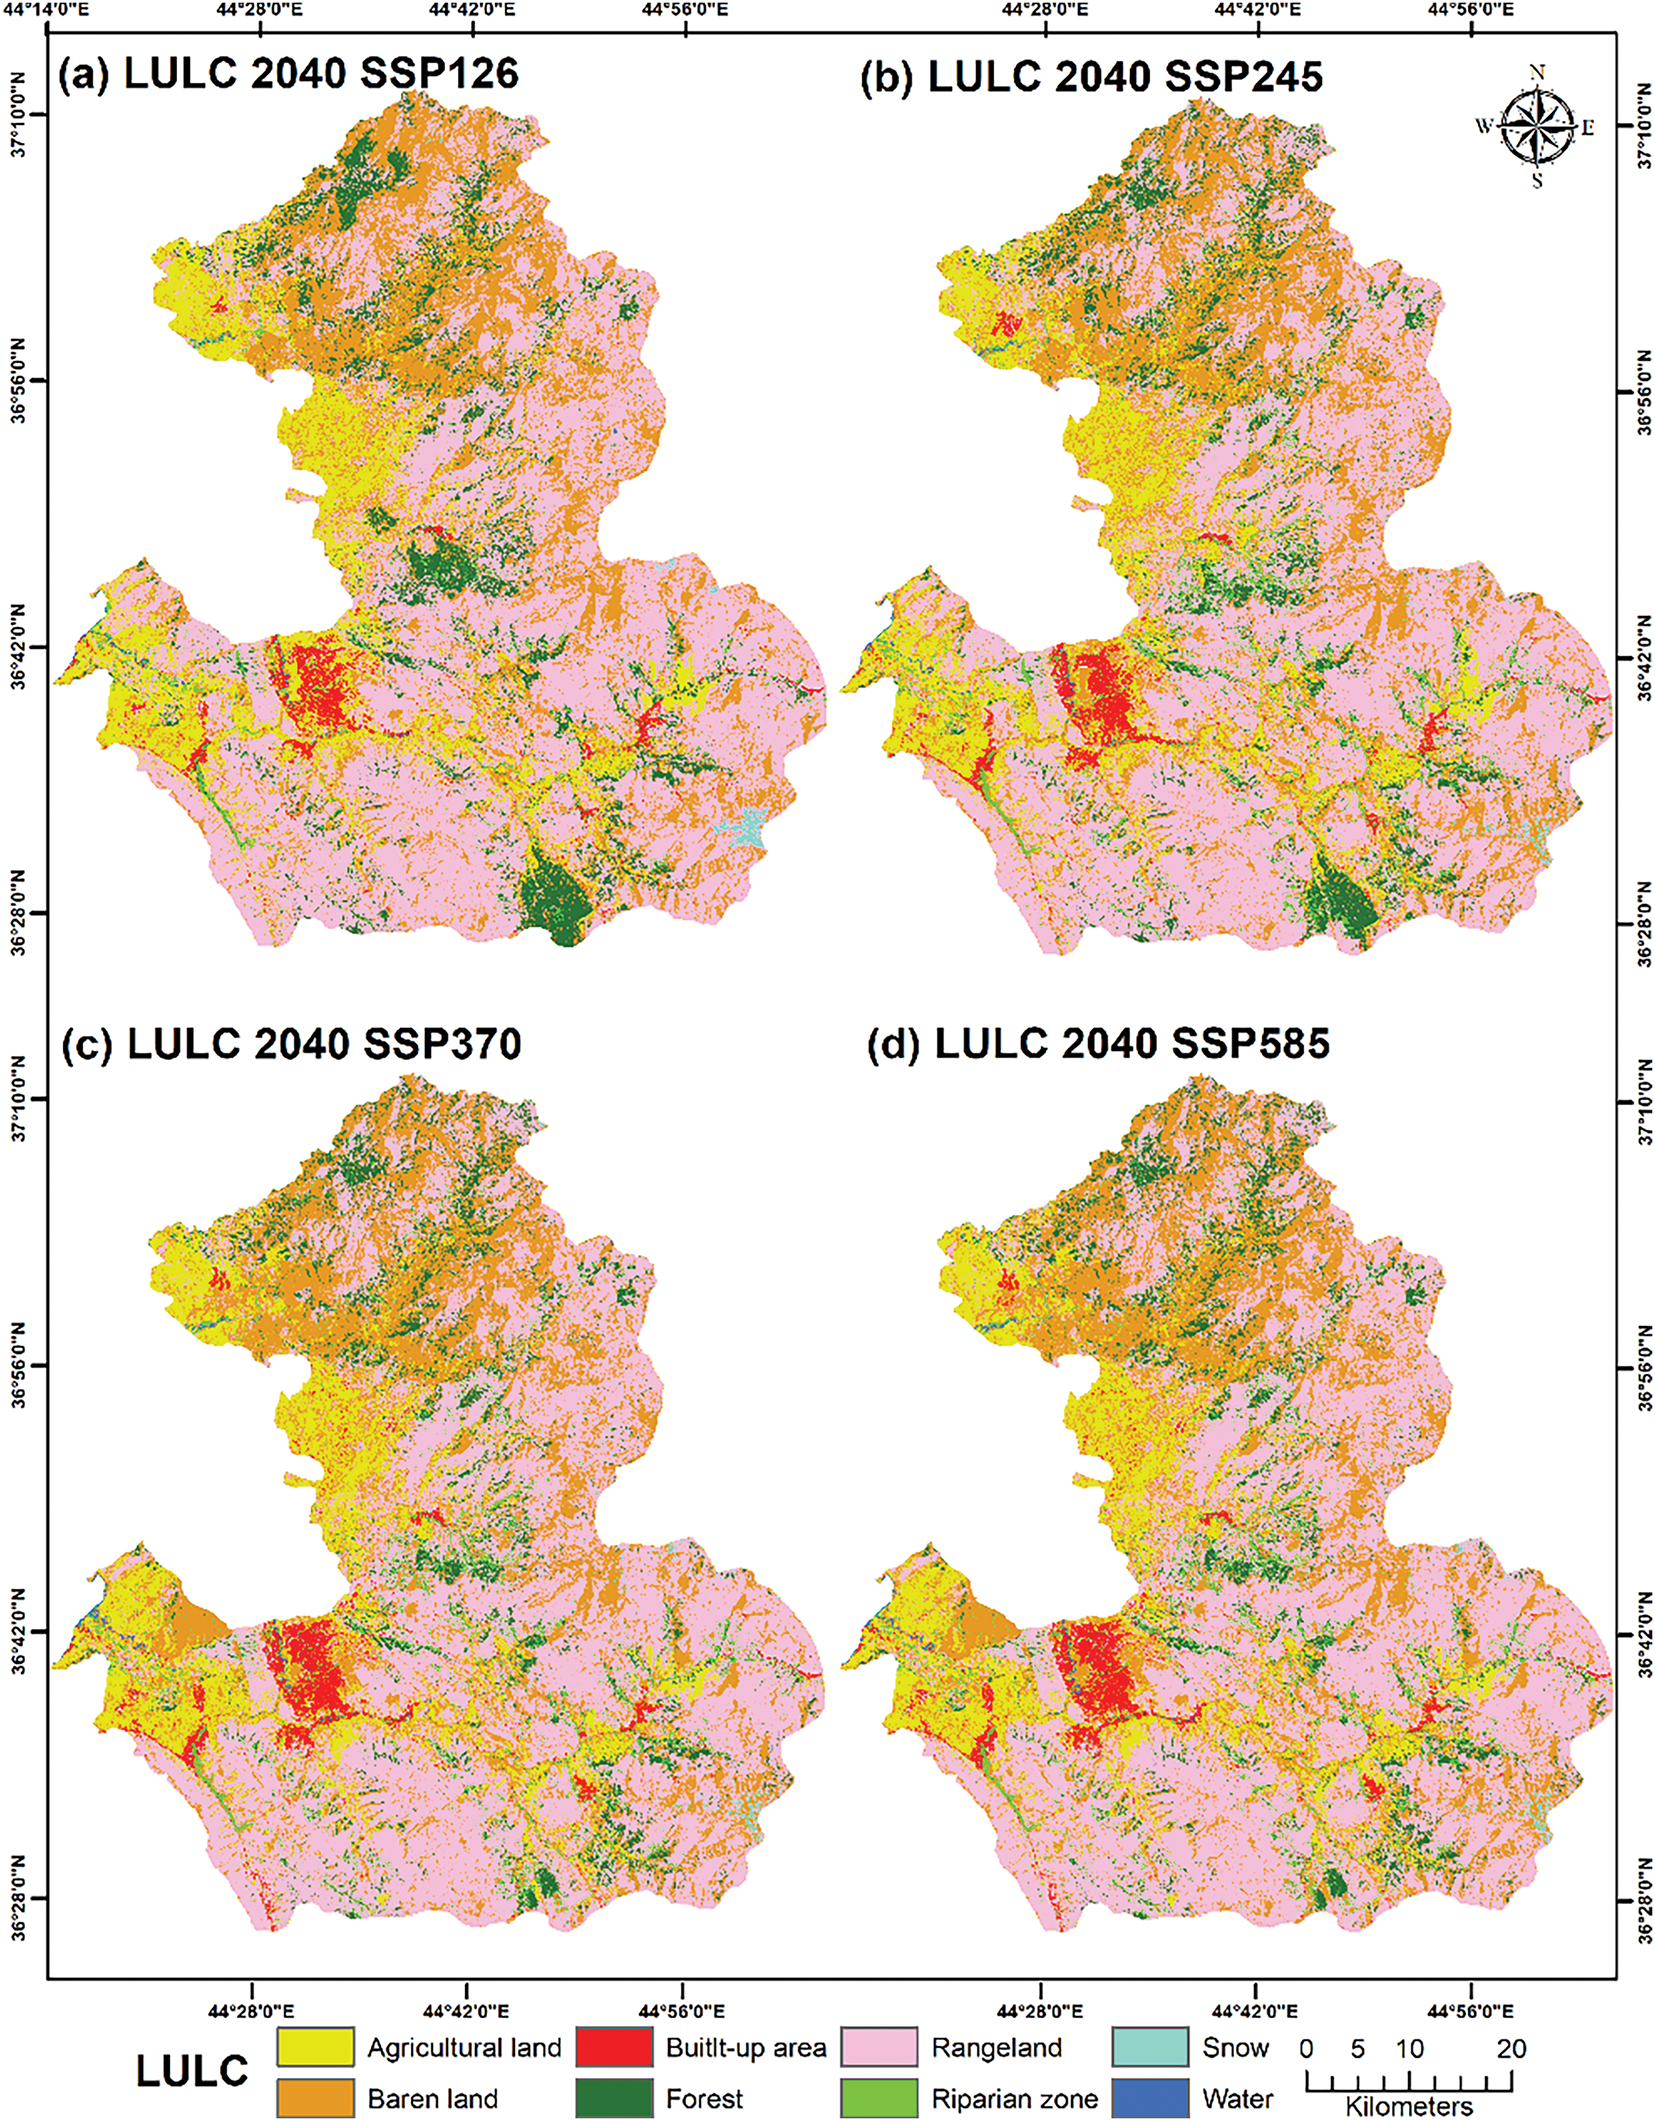
Figure 7: LULC projections for 2040 under different SSPs. The maps illustrate the spatial distribution of various LULC classes for (a) SSP126, (b) SSP245, (c) SSP370, and (d) SSP585 scenarios
Across all four scenarios, agricultural land predominated the landscape, highlighting its continued significance in the region’s economy. However, there are discrepancies in their growth and intensity. In SSP126, the agricultural footprint remains stable, aligning with its sustainability-oriented policies that prioritize climate adaptation and food security initiatives [27]. In contrast, SSP370 and SSP585 experienced substantial agricultural growth driven by rapid population growth, rising food demand, and deforestation in the study area. Urbanization is particularly evident in SSP370 and SSP585, reflecting the rapid expansion of built-up areas due to weak environmental policies and high dependency on fossil fuels [7]. Urban expansion challenges environmental stability, biodiversity, and water supply.
Forests were better preserved under SSP126 and SSP245 due to sustainable land management strategies practiced that help curb excessive deforestation. In contrast, SSP370 and SSP585 show significate forest degradation driven mainly by agricultural expansion, urbanization, and climate-induced alterations in land cover. Studies suggest that high-emission scenarios accelerate deforestation and habitat loss, leading to greater carbon emissions and biodiversity decline [78]. The reduction in forest cover under these scenarios aligns with global deforestation hotspots, where economic growth frequently takes precedence over conservation initiatives. Rangelands are widespread across all scenarios but experience varying degrees of deterioration.
In SSP126 and SSP245, rangelands remain more stable, likely due to improved land management practices and controlled grazing practices. In contrast, SSP370 and SSP585 show greater degradation, desertification, and soil erosion, all exacerbated by climate change [2]. Riparian zones and water bodies exhibit minimal alteration across all scenarios, though SSP585 suggests increased water stress due to climatic variability. High-emission pathways often reduce water availability, increase evapotranspiration, and alter precipitation patterns, disrupting hydrological cycles. This highlights the significance of integrated water resource management in alleviating future water scarcity amid harsh climatic circum-stances [79].
The implications of LULC forecasts underscore the essential significance of LULC policies, climate initiatives, and sustainable development in influencing future landscapes. SSP126 emphasizes the advantages of sustainable land management, whereas SSP370 and SSP585 demonstrate the hazards linked to deforestation, urban sprawl, and land degradation. These results align with global assessments, indicating that balancing growth with conservation is crucial for ensuring long-term environmental sustainability [13]. Additionally, the maps show variations in LULC distribution across various scenarios, reflecting the impact of diverse socioeconomic and ecological factors on LULC alterations. Armed conflict and political conflict have profoundly impacted this region over the last four decades, adversely affecting the social welfare of the population and hindering agricultural development [80].
Notably, the predicted maps illustrate a new wave of suburban development near the area in the western part of the study during the following decades. Moreover, positive forest extent was observed distinctly evident in the northern, southern, and central regions of the projected maps in SSP126 specifically. By 2040, the distribution of various LULC types within the study region, in comparison to the baseline year 2021, demonstrates that under the SSP126 scenario, forested areas expand while agricultural land declines. This trend aligns with the findings of Wu et al. [81]. A more detailed representation of these projected changes is provided in Table 4, which outlines future LULC transitions under four SSP scenarios for the period 2021–2040.

Table 4 presents a comparative analysis of observed LULC data from 2021 and projected alterations in 2040 under four SSPs (SSP126, SSP245, SSP370, and SSP585). These SSP scenarios encapsulate a range of possible climate and socioeconomic trajectories, spanning from a sustainable-oriented future (SSP126) to a scenario characterized by fossil-fuel-dependent economic expansion (SSP585). The table provides insights into the implications of these scenarios on different LULC categories, highlighting potential shifts in land cover distribution.
In 2021, agricultural land covered 617.20 km2. Projections for 2040 indicate an overall increase across all SSP scenarios, with the most substantial expansion under SSP585 (827.18 km2, a 33.9% increase). In contrast, SSP126 projects a slight decrease to 603.08 km2, reflecting a focus on environmental conservation. These findings suggest that higher economic growth pathways (SSP 245, SSP 370, SSP 585) drive agricultural expansion, potentially leading to the conversion of natural landscapes such as forests and rangelands [82]. This trend is consistent with Zabel et al. [83], who found that the high-emission scenarios intensify agricultural growth due to increased food demand, land conversion, and deforestation.
Similarly, the barren land category is anticipated to increase from 537.96 km2 in 2021 to a maximum of 716.83 km2 under SSP585. This increase proposes worsening land degradation and desertification risks under high-emission scenarios. Even in SSP126 (617.24 km2), barren land still increases, though slower, highlighting ongoing land degradation concerns. A study by Lal [84] confirms that the growth of barren land is frequently associated with unsustainable land management practices, excessive grazing, and desertification driven by climate change.
Urban or built-up areas are expected to increase across all scenarios, from 50.52 km2 in 2021 to a maximum of 84.17 km2 under SSP585. The lowest urban expansion is under SSP126 (71.97 km2), reflecting slower urbanization due to sustainable development priorities. This advocates that urban expansion might contribute to land conversion from agriculture or rangelands under high-growth scenarios. This expansion is consistent with projections by [7], who estimated that urban land cover will persist in its global growth, resulting in habitat fragmentation, heightened carbon emissions, and land-use disputes.
A significant trend is the consistent decline in forested areas across all SSPs, with the most severe reduction occurring under SSP585 (188.28 km2), followed by SSP370 (224.33 km2). In contrast, SSP126 shows the smallest decline (346.02 km2), indicating climate-friendly policies could help preserve forests. This decline aligns with global deforestation trends driven by agricultural expansion, urbanization, and land degradation [13,78].
Rangelands, the largest land cover category in 2021 (1967.99 km2), are projected to shrink under all scenarios. The most significant reduction occurs under SSP585 (1678.36 km2, a loss of 289.63 km2 or 14.7%). Even in SSP 126, rangelands decline to 1796.92 km2, implying pressure from competing land uses. This proposes intensified land conversion for agriculture and urban expansion under high-emission pathways. The degradation of rangelands aligns with research by Lal [84], who highlighted that rangeland ecosystems are especially susceptible to desertification, overgrazing, and climatic fluctuations.
Riparian zones also exhibit declines across all SSPs, with SSP585 showing the most severe reduction (38.2 km2). This decline is attributed to land encroachment, deforestation, and changes in hydrological regimes due to climate change [79]. The depletion of riparian zones is alarming, as these ecosystems are vital for biodiversity and water management [85].
Slight changes are observed in snow and water cover. Snow cover remains relatively stable, but SSP585 shows the most significant reduction in water bodies (10.45 km2 from 21.8 km2 in 2021), reflecting a growing risk of water scarcity and possible climate-induced drying of natural ponds and rivers. This decline correlates with findings by IPCC [13], which indicate that high-emission scenarios (SSP370 and SSP585) will lead to greater evapotranspiration, declining groundwater levels, and intensified drought conditions.
The model demonstrates consistently high accuracy across all projections, ranging from 92.78% to 93.13%, indicating strong predictive reliability. The Kc (0.89–0.90) further supports the model’s robustness in capturing LULC transitions. Under SSP126, the sustainability-focused approach mitigates deforestation and urban sprawl, contributing to forest and water body conservation. In contrast, higher-emission scenarios (SSP370 and SSP585) exhibit significant forest loss, barren land expansion, and water body reduction, raising concerns about desertification, biodiversity loss, and climate change impacts [13].
The LULC projections underscore forecasts the necessity of policy interventions to counteract environmental degradation in high-emission scenarios. SSP126 represents a more sustainable trajectory characterized by reduced deforestation, lower land degradation, and improved water resource protection. This aligns with the recommendations of van Vuuren et al. [58], advocating for policies such as reforestation, sustainable agriculture, and urban planning to mitigate adverse LULC changes.
Table 5 presents projected LULC changes from 2021 to 2040 under four varied SSP scenarios. Each scenario reflects varying socioeconomic and climate change influences on different land categories. The findings indicate that agricultural land declines under SSP126 but significantly increases under other scenarios, with the highest gain observed in SSP585 (+209.98 sq. km, 23.32%). Barren land expands across all scenarios, with SSP585 showing the highest gain (+178.87 sq. km, 20.21%).

Built-up areas exhibit moderate growth (~2%) in all scenarios, while forest cover increases in SSP126 but declines in all other scenarios, with the largest loss in SSP585 (−101.20 sq. km, −5.31%). Rangeland consistently decreases, with the most significant reduction in SSP585 (−289.63 sq. km, −47.31%). The riparian zone expands under SSP126 but contracts in other scenarios. Snow remains relatively stable but sees minor losses in SSP245, SSP370, and SSP585. Finally, water had a slight gain in SSP126 but declined in all other scenarios, with the most significant loss in SSP585 (−11.35 sq. km, −0.29%).
The findings suggest that under high-emission and rapid socioeconomic growth scenarios (SSP245, SSP370, and SSP585), agricultural and barren land will expand at the expense of forest, rangeland, and water bodies, indicating intensified land use driven by urbanization and agricultural expansion. Such shifts could have significant environmental implications.
Fig. 8 demonstrates the projected gains and losses in LULC between 2021 and 2040 under different SSPs. Various levels of land alteration can be seen in each SSP scenario, highlighting the influence of climatic and socioeconomic changes on landscape dynamics.

Figure 8: Gains and losses of future scenarios explain projected LULC changes across distinct categories under various SSPs from 2021 to 2040
Starting with agricultural land change, which varies between scenarios, SSP126 exhibited a minor reduction, while SSP245, SSP370, and SSP585 demonstrated significant increases. The growth is notably considerable under SSP585, where agricultural land usage increases significantly due to rising food demand and augmented land clearing for agriculture. This finding corresponds with research demonstrating that the development of global food production is the primary driver for deforestation and habitat degradation, especially in high-emission scenarios [86]. Correspondingly, barren land rises significantly across all scenarios, particularly SSP585, presumably due to land degradation, desertification, and soil erosion intensified by climate change.
Built-up areas expand in all scenarios but at a slower pace than other LULC categories. The most significant urban expansion is in SSP585, where fast urbanization is associated with population increase, economic development, and industrialization. These trends align with projections [2,87] that global urban land cover will increase dramatically by 2050, particularly in developing regions where infrastructure development accelerates under high-emission scenarios.
Forests face net losses in most scenarios, with SSP126 exhibiting a divergence. This pattern underscores the deforestation pressures associated with agricultural development, urban growth, and land degradation. The decline in forest cover aligns with the study by Hansen et al. [78], indicating that deforestation contributes considerably to carbon emissions and biodiversity decline, especially in areas under considerable population pressure. A notable pattern is the substantial loss of rangelands across all SSPs, with SSP126 demonstrating a lesser drop and SSP585 reflecting the most pronounced reduction. Rangelands are particularly vulnerable to land conversion, overgrazing, and degradation caused by climate change. The significant decline in SSP370 and SSP585 indicates increased desertification, soil degradation, and pressures from land-use change.
Riparian zones deteriorate in all scenarios, with SSP585 demonstrating the most significant deterioration. This may be linked to climate change-induced changes in river flow, land-use interference, and deforestation adjacent to water bodies [79]. Ending with the changes in snow and water body alterations are insignificant across all scenarios, indicating that regional hydrological changes may not be as substantial during this period. Nonetheless, under high-emission scenarios (SSP585), even minor declines in water bodies may signify the first indicators of prolonged hydrological stress, including diminishing groundwater levels and increased evaporation from elevated temperatures.
The projected LULC changes for 2040 emphasize the critical importance of climate policy, land management, and conservation strategies. SSP126 represents a sustainable development pathway with reduced deforestation, land degradation, and ecosystem loss, while SSP585 indicates substantial environmental decline due to unregulated land conversion and climatic stress. These findings highlight the need for integrated land-use planning, reforestation, sustainable agricultural practices, and urban resilience measures to mitigate future hazards and improve ecosystem sustainability [13].
3.4 Transition Matrix of Scenario-Based LULC Prediction
This study categorizes future LULC changes into four distinct scenarios based on SSP, providing insights into the projected LULC dynamics in the Soran area. The methodological framework includes SSP126 (sustainability), SSP245 (middle-of-the-road), SSP370 (regional rivalry), and SSP585 (fossil-fueled development). Table 6 presents the transition matrix, which quantifies the probabilities of LULC shifts between categories over the period 2021–2040. Each row represents an initial LULC type, while columns indicate the likelihood of transition to other categories, with diagonal values reflecting stability. These probabilities offer a detailed assessment of landscape dynamics, identifying both stable land classes and those undergoing substantial change [68].

Transition probability matrices use colors to indicate the likelihood of a specific Land Use and Land Cover (LULC) category persisting or transitioning over a specific timeframe. Red cells indicate elevated transition probability, diagonal cells indicate the likelihood of a class remaining constant, and deeper red hues indicate greater stability. Dark red cells indicate that most area in a category is expected to remain unchanged. Off-diagonal cells show substantial transitions between multiple LULC classes, suggesting a segment of land may transition into another. The intensity of red helps visualize dominant or steady transitions within each scenario.
In the first scenario (SSP126), notable LULC changes were observed (Table 6a). Agricultural land remains moderately stabile, with a 51% retention rate, though 46% transitions to barren land, indicating degradation or abandonment. Minor shifts occur to built-up areas (2%) and riparian zones (1%), possibly due to urban expansion and proximity to water bodies. Barren land exhibits the highest stability (97%), with minimal conversion to agricultural land (2%) and snow (1%), likely influenced by seasonal or climatic factors. Its negligible conversion into other land classes suggests resilience to transformation.
The built-up area retains 79% of its coverage, but 20% converts to barren land, possibly due to abandonment or infrastructure decay. A small shift (1% each) to riparian zones and water bodies may indicate encroachment or flooding. Forest cover remains relatively stable (74%) but shows conversion to barren land (18%) and rangeland (7%). This is likely due to deforestation or land degradation caused by human activities. The loss of forest to barren land signals severe environmental stress. Rangelands exhibit strong persistence (91% retention), with limited conversion to agricultural land (6%) and forest (2%). This suggests minor afforestation or agricultural expansion. Its overall stability indicates sustainability.
Riparian zones display moderate stability (61% retention), though 32% transition to forests. This is likely due to natural succession or conservation efforts. Minor losses to barren land (2%) and rangeland (4%) suggest some degradation or encroachment. Snow cover is relatively dynamic, with only 27% retention. A sizable portion (51%) transitions to rangeland due to seasonal melting and vegetation growth. Meanwhile, 22% convert to barren land, potentially reflecting glacial retreat or climate-induced snow cover changes. Water bodies are quite stable, with 91% retention, though 8% transition to barren land, possibly due to drying up or sediment deposition. A small fraction (1%) transitions into riparian zones, suggesting possible hydrological changes or expansion of wetland vegetation.
In the second scenario (SSP245), significant LULC transitions were observed (Table 6b). Agricultural land undergoes substantial degradation, with 54% converting to barren land, likely due to soil degradation, overgrazing, or climate change. A smaller portion (3%) transitions to built-up areas, reflecting urban expansion. However, there is no significant transition of agricultural land into forest, rangeland, riparian zones, snow, or water bodies, suggesting minimal ecological recovery or reforestation. Barren land remains highly stable (98%), with only 2% converting to agricultural land, possibly due to reclamation efforts. Its minimal transformation into other classes highlights its persistence and the challenges of restoring productivity.
Built-up areas exhibit strong stability, with a 77% probability, though 22% transition to barren land, suggesting urban decline or abandonment. Additionally, a minor fraction (1%) transitions to agricultural land, likely for repurposing, while another 1% transitions to water bodies, possibly due to infrastructure changes. Forest cover remains relatively stable (79%) but experiences some conversion to barren land (7%). This is likely due to deforestation or natural effects. Small shifts to rangeland (3%) and riparian zones (11%) may indicate land fragmentation or changes in ecological functions.
Rangelands maintain high stability (90%) with limited transitions to agricultural land (8%) and forest (1%), indicating potential afforestation efforts or natural regeneration. Riparian zones show strong retention (95%), with minor conversions to agricultural land (1%), built-up areas (1%), and rangelands (2%). These slight changes may be due to overtaking, infrastructure development, or hydrological conditions affecting these sensitive ecosystems. Snow cover undergoes significant transformation, with 36% converting to barren land and 35% to rangeland. This is likely due to climate-induced melting or shifting land use. Only 29% remains unchanged, highlighting the impact of environmental changes on high-altitude regions. Water bodies show a high degree of stability (88%), though minor losses to agricultural land (5%) and barren land (6%). These alterations may be recognized as the reduction of water bodies resulting from sedimentation, climate change, or anthropogenic activities.
In the third scenario (SSP370), significant LULC transitions were observed (Table 6c). Agricultural land undergoes extensive degradation, with 55% converting to barren land due to erosion, overgrazing, or desertion. However, 39% remains stable, indicating ongoing agricultural activities, while 5% transitions to built-up areas, reflecting urban expansion or infrastructure development. Barren land exhibits strong persistence (98%), with only (2%) converting to agricultural land, possibly due to land reclamation efforts.
Built-up areas remain relatively stable (72%), though 26% transition to barren land, suggesting abandonment or structure degradation. Minor shifts occur toward agricultural land (1%), possibly representing urban farming or land conversion efforts. Moreover, 1% of the built-up areas convert to water bodies, suggesting changes in hydrological conditions. Forest cover remains relatively stable (75%) but experiences notable losses to barren land (9%), likely due to deforestation and riparian zones (13%), suggesting afforestation or natural succession near water bodies. A small fraction (2%) transitions to rangeland.
Rangeland remains stable mainly (90%), with slight conversions to agricultural land (8%) and barren land (1%). This is likely due to grazing changes or land development practices. Riparian zones also exhibit high stability (90%), with minor transitions to barren land (4%) and agricultural land (3%). This shift may be linked to human activities such as irrigation, land encroachment, or natural processes like sediment deposition and erosion.
Snow cover is highly dynamic, with only 39% retention. A substantial portion transitions to barren land (24%), possibly due to melting and climate-induced glacial withdrawal. Meanwhile, 38% convert to rangeland, likely due to seasonal variations in vegetation exposure. Water bodies remain highly stable (93%), with a minor transition (7%) to barren land. This reduction in water cover could be attributed to drought, reduced precipitation, or human activities like water extraction for farming.
In the worst-case scenario (SSP585), significant LULC transitions were detected (Table 6d). Agricultural land demonstrates significant instability, with only 38% retention. The majority (56%) convert to barren land due to soil degradation, desertification, or land abandonment. Meanwhile, 5% of the transition to built-up areas reflects urban expansion. Barren land remains largely unchanged (98%), with minimal conversion (2%) to agricultural land, possibly through land reclamation or improved soil management. Its resistance to transformation highlights the difficulty of restoring productivity.
The built-up area retains 72% stability, though 26% transition to barren land, indicating land degradation or abandonment of built-up areas. Small shifts occur toward agricultural land (1%) and water bodies (1%), suggesting limited urban-to-agriculture restoration efforts or waterbody advances. Forest cover remains relatively stable (75%) but experiences moderate losses to barren land (10%), which could indicate deforestation due to land clearing or climate-induced degradation. Additionally, 13% convert to the riparian zone, possibly due to hydrological influences or ecosystem shifts. Minimal transitions to agricultural land and rangeland occur. Rangeland exhibits strong stability (90%), with minor conversions to agricultural land (8%), likely for crop cultivation or grazing and barren land (1%), suggesting localized degradation.
The riparian zone also shows significant stability (90%), with minor transitions to barren land (5%) and agricultural land (3%). These changes may result from human-induced modifications, such as land reclamation or degradation due to reduced water availability. Snow cover exhibits substantial variability, with only 39% of it persisting. Significant portions transition to rangeland (38%), likely due to seasonal snowmelt or climate-induced glacial retreat. Additionally, 24% transition into barren land, signifying exposure of previously snow-covered areas due to warming temperatures. Water is relatively stable (90%), though small losses to agricultural land (3%) and barren land (7%) may result from reductions in water availability, land reclamation, or sedimentation.
Overall, these transitions highlight agricultural degradation, deforestation, and snow cover decline as significant landscape changes [13]. The considerable conversion of forest and agricultural land to barren land and rangeland indicates severe environmental stress and anthropogenic alterations. While riparian zones and water bodies exhibit moderate stability, they need meticulous management to avoid additional invasion or deterioration across the region. A comparative analysis across the scenarios reveals consistent trends, such as the expansion of built-up areas and the contraction of agricultural land. However, scenario-specific variations are evident in forest and barren land transitions, reflecting the differential impacts of climatic projections under each SSP scenario. These LULC transitions elucidate landscape alterations throughout time, emphasizing urban growth, deforestation, soil degradation, and climate-induced transformations [88].
3.5 Trends of Future LULC Changes
Future alterations in LULC are shaped by urbanization, climate change, demographic expansion, and policy determinations. The trends can be classified according to primary drivers and their effects on sustainability, biodiversity, and resource management [2]. These trends primarily reflect urban expansion, agricultural intensification, forest cover fluctuations, and transformations in aquatic environments [89].
Fig. 9 illustrates LULC changes from 2001 to 2040 under different SSP scenarios, represented by colored dashed lines. These scenarios range from a sustainability-focused future (SSP126) to a high-emission, fossil-fuel-dependent future (SSP585). These projections provide insights into how LULC is expected to evolve under different climate and socioeconomic conditions.
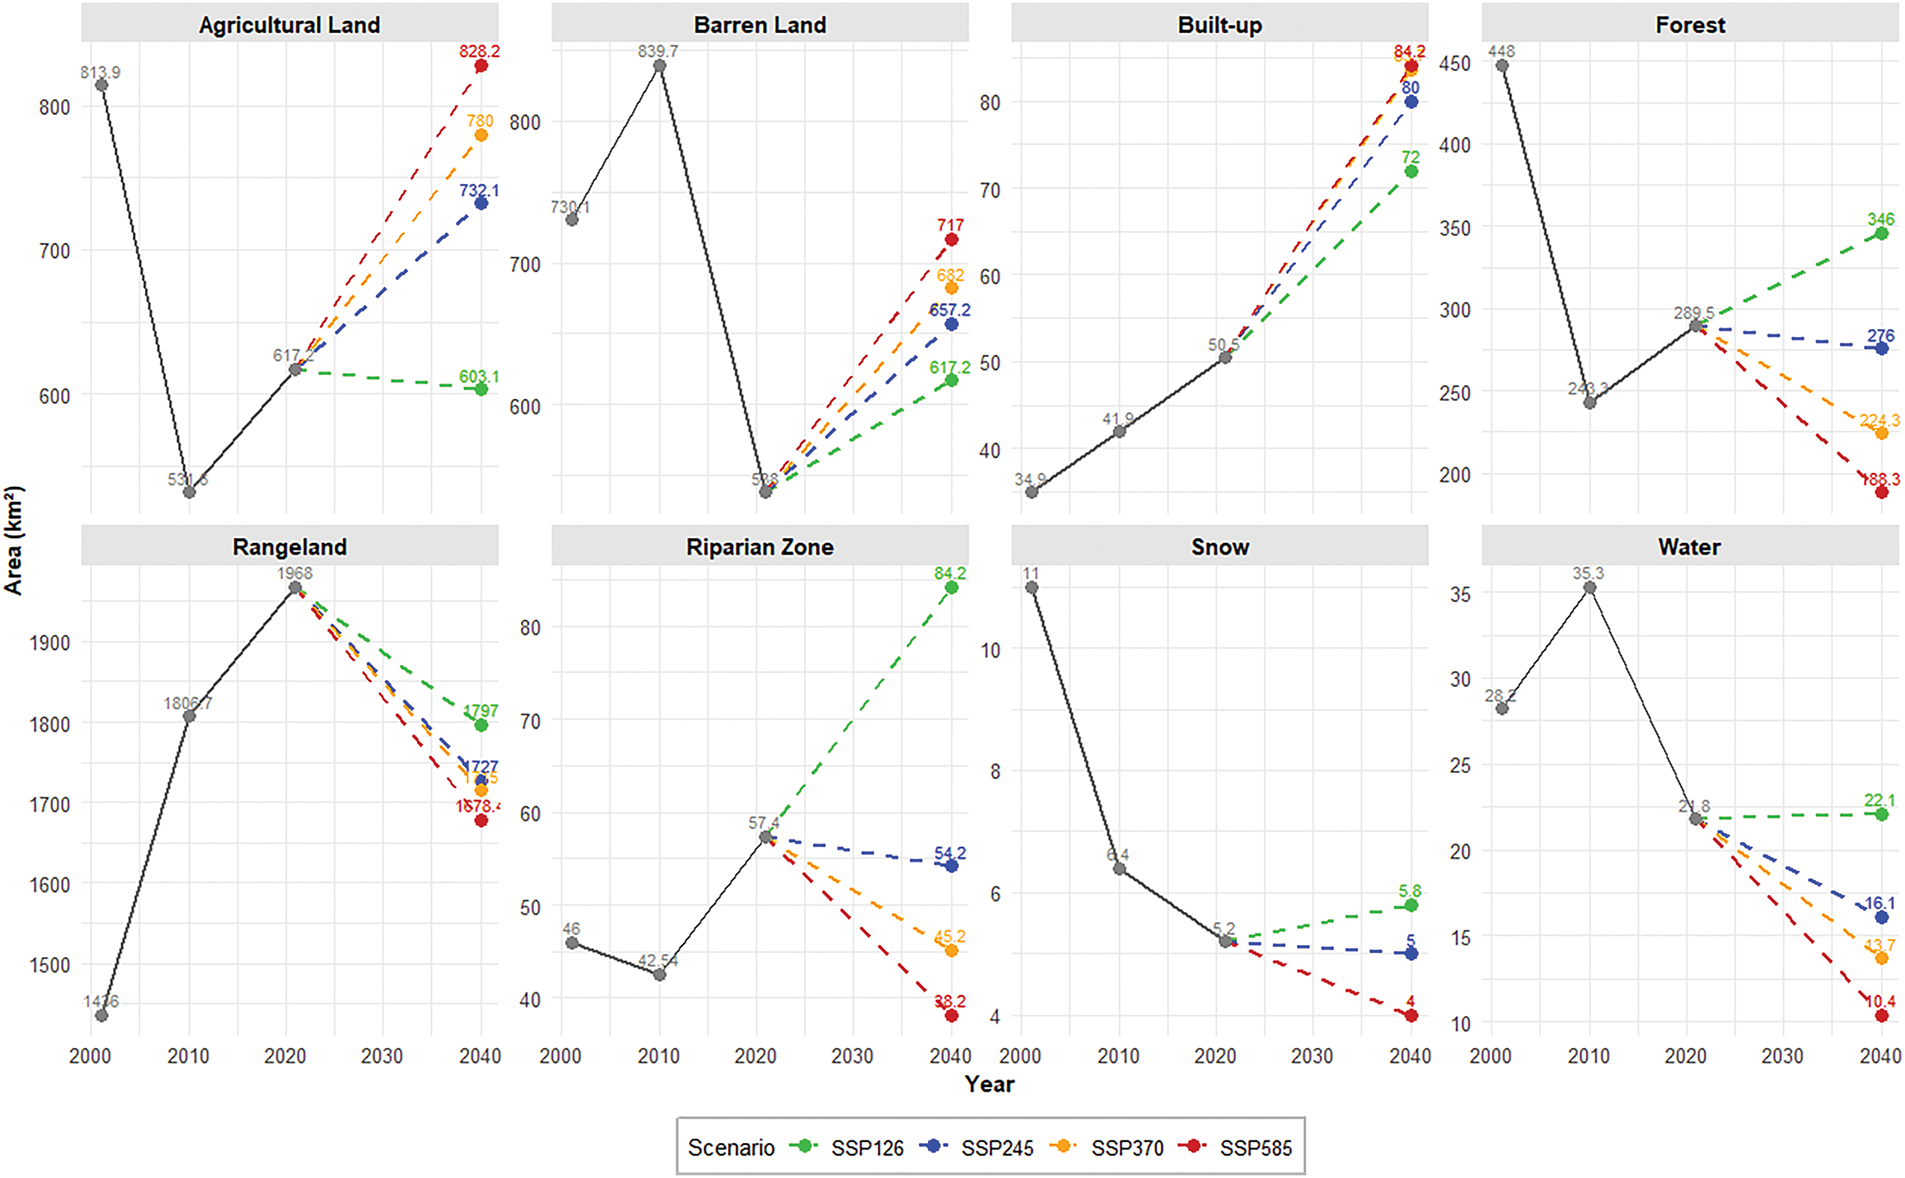
Figure 9: LULC change trajectories and projections, historical trends (2010–2021), and SSP scenario projections (2040)
Agricultural land initially declined (2001–2010) before increasing through 2040 across all SSP scenarios. The greatest expansion occurs under SSP585 (828.2 km2), followed by SSP370 (780 km2) and SSP245 (732.1 km2), while SSP126 shows the smallest increase (603.1 km2). This pattern suggests early land abandonment or conversion, potentially due to urbanization or policy changes [90]. This is also followed by recovery driven by population growth and food demand [91].
Barren land peaks around 2010 before declining sharply and stabilizing. The most significant increase is observed under SSP585 (717 km2), while SSP126 shows the lowest recovery (617.2 km2). The decline may indicate afforestation efforts, soil conservation, or increased land productivity [92,93]. However, its later stabilization suggests the perseverance of some degraded lands due to climate change and anthropogenic pressures [13].
Urbanization follows a continuous upward trend, aligning with global urbanization trends driven by population increase, economic development, and rural-to-urban migration [94]. The SSP scenarios project a sustained rise; the highest growth occurs under SSP585 (84.2 km2), while the lowest is observed in SSP126 (72 km2), highlighting the need for sustainable urban planning to mitigate land conflicts.
Forest cover declines between 2001 and 2010, briefly recovers, and then decreases again by 2040. SSP126 projects a net increase (346 km2), whereas SSP585 shows a significant loss (188.3 km2). The initial decline may result from agricultural expansion and urbanization [95]. The recovery phase recommends afforestation or conservation policies, but the long-term trend indicates deforestation pressures outweighing restoration efforts.
Rangeland expanded in 2021 before stabilizing and slightly declining. The steepest loss occurs under SSP585 (1678 km2), while SSP126 retains more rangeland (1797 km2). The initial growth may stem from agriculture to grazing land, while the deterioration suggests land degradation, desertification, or conversion to other uses [96]. Future scenarios indicate a balance between competing land uses.
Riparian zones remain stable but exhibit a sharp increase around 2021 before declining. Under SSP126, the area continues to expand (84.2 km2), while under SSP585, it declines (38.2 km2). This fluctuation could be attributed to conservation measures, land-use policies, and climate variability affecting riverine ecosystems [97]. The projected decline suggests increasing human impact, including agricultural runoff and urban encroachment.
Snow cover exhibits a consistent decline, with the sharpest reduction under SSP585 (4 km2), reflecting climate change effects. The trend aligns with global warming-derived hydrological shifts, impacting water availability and biodiversity [13]. Similarly, water decline with SSP126 maintaining a relatively stable area (22.1 km2), while SSP585 experiences significant loss (10.4 km2). The short-term increase may be due to seasonal variations, while the deterioration suggests prolonged droughts, land use alterations, and climate change impacts on hydrological systems, as discussed in the research by Wang and Liu [98].
From the perspective of urban expansion and land conflicts, the increase in built-up areas will likely put pressure on agricultural lands, forests, and riparian zones, requiring better land management strategies [87]. These trends align with global patterns of agricultural expansion and urbanization at the expense of natural ecosystems [69]. Expanded cultivated land poses sustainability challenges, including soil erosion, deforestation, and biodiversity loss.
Overall, the most significant LULC expansions occur in agricultural land, barren land, and built-up areas, while forests, riparian zones, rangelands, snow cover, and water bodies decline. These findings align with studies by Belay et al. [99] and Badshah et al. [52], which highlight urban expansion-driven reductions in vegetation and forests. In high-emission scenarios (SSP370, SSP585), unregulated urban growth, industrialization, and infrastructure expansion exacerbate land-use conflicts, underscoring the urgent need for sustainable agricultural and conservation strategies [100].
Socioeconomic and climate policies play a crucial role in shaping LULC changes. Sustainable scenarios (SSP126) support the conservation of forest, water, and riparian zones while controlling urban expansion and deforestation. In contrast, high-emission scenarios (SSP370 and SSP585) result in substantial land degradation, heightened agricultural and urban growth, and considerable losses in forests, snow, and water supplies. These estimates highlight the essential role of policy actions in influencing future land cover changes.
Although SSP scenarios provide a significant framework for long-term LULC forecasts, the SSP scenarios can serve as a valuable foundation for quantifying pathways toward the Sustainable Development Goals. Nonetheless, prevailing uncertainties, insufficient regional specificity, inadequate integration of climatic feedback, and inflexibility pose considerable limitations [27,101]. Future enhancements should concentrate on local governance and the improved integration of biophysical elements to improve forecast accuracy.
SSP-based projections rely on broad socioeconomic narratives, introducing significant uncertainty. Various socioeconomic factors, including population increase, economic development, and government quality, interact in complicated and unpredictable manners [26,102]. The inability to consider unexpected legislative changes, technical advancements, or economic downturns limits their dependability in LULC modeling.
On the other hand, LULC predictions in mountainous areas face limitations due to the complex terrain and dynamic environmental factors. The lack of high-resolution spatial and temporal data in remote mountain regions and limited ground truth data for validation in inaccessible areas affects model accuracy.
RF is a promising algorithm for predicting LULC change, offering a data-driven and accurate approach [103]. Continued research is needed to address the challenges associated with data availability, model interpretability, and uncertainty quantification. By integrating RF with other modeling techniques and incorporating expert knowledge, we can further improve our ability to predict and manage LULC change. However, enhancing future forecasts of LULC is essential in developing advanced deep-learning approaches for improved outcomes and accuracy [51,104].
Further research is needed to address uncertainties related to data sources, modeling approaches, and underlying assumptions that remain unresolved [105,106]. Strengthening these aspects will contribute to more reliable and refined LULC projections.
This study represents an initial attempt to examine and predict LULC changes using RS and ML techniques in the Soran area of the Kurdistan Region, Iraq. The study utilized an integrated RF model within Python programming to simulate changes in LULC in 2021 and forecast the changes from future prediction scenarios of LULC for 2040, depending on the historical data. This methodology offers a systematic framework for forecasting LULC changes utilizing the RF model. It emphasizes integrating robust preprocessing, rigorous model training, and validation to ensure reliable predictions. Further, the RF model effectively captures LULC spatial and temporal dynamics. This model can be tailored to different regions and scales, making it versatile for various applications.
Depending on the results, the model’s F1-score showed the highest accuracy in rangeland (0.93), with a lower score in riparian zones (0.75) and snow (0.71). The model’s overall accuracy (OA) is 94.34%, with a kappa of 0.92, indicating high agreement between classified and simulated 2021 LULC data. The study reveals that agricultural land declines under SSP126 but increases under other scenarios, with SSP585 showing the highest gain (23.32%). The built-up area consistently increases, while the forest cover gains in SSP126 but declines in all other scenarios. Rangeland experiences significant loss with the highest decrease in SSP585 (−47.31%) and riparian zone gains in SSP126 but declines in all other scenarios. Snow remains stable but sees minor losses.
Furthermore, this study recommends concentrating on future growth based on the path from scenario SSP126 and achieving sustainable development goals, promoting sustainable land management, and accelerating the conservation and restoration of natural ecosystems. Future research should focus on region-specific drivers, policy interventions, and adaptation strategies to balance development and environmental sustainability.
In sum, predicting future LULC change is a vital area of research with comprehensive implications for environmental sustainability, climate change mitigation, and socioeconomic development. By leveraging advanced modeling techniques, integrating diverse data sources, and adopting scenario-based approaches, researchers can provide valuable insights into LULC dynamics. This motivates relevant authorities and organizations to collaborate and facilitate evidence-based decision-making concerning future environmental challenges in designated study areas. However, addressing the challenges of uncertainty, data integration, and ethical considerations remains crucial for advancing the field and achieving sustainable land management outcomes.
Acknowledgement: The authors gratefully acknowledge the National Aeronautics and Space Administration (NASA) and the United States Geological Survey (USGS) for providing free access to satellite imagery data, which was essential for this study. We also extend our thanks to the WorldClim project for making future climate forecasts available, which greatly contributed to climate-related analyses.
Funding Statement: The authors received no specific funding for this study.
Author Contributions: The authors confirm contribution to the paper as follows: Conceptualization, Abdulqadeer Rash; methodology, Abdulqadeer Rash; software, Abdulqadeer Rash; formal analysis, Abdulqadeer Rash; resources, Yaseen T. Mustafa and Rahel Hamad; writing—original draft preparation, Abdulqadeer Rash; writing—review and editing, Abdulqadeer Rash, Yaseen T. Mustafa and Rahel Hamad; supervision, Yaseen T. Mustafa and Rahel Hamad. All authors reviewed the results and approved the final version of the manuscript.
Availability of Data and Materials: The data supporting this study’s findings are available from the corresponding author upon reasonable request.
Ethics Approval: Not applicable.
Conflicts of Interest: The authors declare no conflicts of interest to report regarding the present study.
References
1. Sisay G, Gessesse B, Fürst C, Kassie M, Kebede B. Modeling of land use/land cover dynamics using artificial neural network and cellular automata Markov chain algorithms in Goang watershed. Ethiopia Heliyon. 2023;9(9):e20088. doi:10.1016/j.heliyon.2023.e20088. [Google Scholar] [PubMed] [CrossRef]
2. Afuye GA, Nduku L, Kalumba AM, Santos CAG, Orimoloye IR, Ojeh VN, et al. Global trend assessment of land use and land cover changes: a systematic approach to future research development and planning. J King Saud Univ-Sci. 2024;36(7):103262. doi:10.1016/j.jksus.2024.103262. [Google Scholar] [CrossRef]
3. Lambin EF, Geist HJ. Land-use and land-cover change: local processes and global impacts. Berlin/Heidelberg, Germany: Springer; 2008. 222 p. [Google Scholar]
4. Richter I, Gabe-Thomas E, Queiros AM, Sheppard SR, Pahl S. Advancing the potential impact of future scenarios by integrating psychological principles. Environ Sci Policy. 2023;140(2):68–79. doi:10.1016/j.envsci.2022.11.015. [Google Scholar] [CrossRef]
5. Geist HJ, Lambin EF. Proximate causes and underlying driving forces of tropical deforestation: tropical forests are disappearing as the result of many pressures, both local and regional, acting in various combinations in different geographical locations. BioScience. 2002;52(2):143–50. doi:10.1641/0006-3568(2002)052[0143:pcaudf]2.0.co;2. [Google Scholar] [CrossRef]
6. Dembélé F, Guuroh RT, Ansah PB, Asare DCBM, Da SS, Aryee JN, et al. Land use land cover change and intensity analysis of land transformation in and around a moist semi-deciduous forest in Ghana. Trees People. 2024;15(9):100507. doi:10.1016/j.tfp.2024.100507. [Google Scholar] [CrossRef]
7. Seto KC, Güneralp B, Hutyra LR. Global forecasts of urban expansion to 2030 and direct impacts on biodiversity and carbon pools. Proc Natl Acad Sci U S A. 2012;109(40):16083–8. doi:10.1073/pnas.1211658109. [Google Scholar] [PubMed] [CrossRef]
8. Li K, Feng M, Biswas A, Su H, Niu Y, Cao J. Driving factors and future prediction of land use and cover change based on satellite remote sensing data by the LCM model: a case study from Gansu province. China Sensors. 2020;20(10):2757. doi:10.3390/s20102757. [Google Scholar] [PubMed] [CrossRef]
9. Addae B, Dragićević S, Zickfeld K, Hall P. Projecting multiclass global land-use and land-cover change using deep learning and spherical geographic automata model. Big Earth Data. 2025;9(1):1–28. doi:10.1080/20964471.2024.2386091. [Google Scholar] [CrossRef]
10. Foley JA, DeFries R, Asner GP, Barford C, Bonan G, Carpenter SR, et al. Global consequences of land use. Science. 2005;309(5734):570–4. doi:10.1126/science.1111772. [Google Scholar] [PubMed] [CrossRef]
11. Poggio L, Simonetti E, Gimona A. Enhancing the WorldClim data set for national and regional applications. Sci Total Environ. 2018;625(5):1628–43. doi:10.1016/j.scitotenv.2017.12.258. [Google Scholar] [PubMed] [CrossRef]
12. Adeyeri OE, Zhou W, Wang X, Zhang R, Laux P, Ishola KA, et al. The trend and spatial spread of multisectoral climate extremes in CMIP6 models. Sci Rep. 2022;12(1):21000. doi:10.1038/s41598-023-28115-z. [Google Scholar] [PubMed] [CrossRef]
13. IPCC. Climate change 2021—the physical science basis: working group I contribution to the sixth assessment report of the intergovernmental panel on climate change. Cambridge, UK: Cambridge University Press; 2023. [Google Scholar]
14. Seneviratne SI, Zhang X, Adnan M, Badi W, Dereczynski C, Luca AD, et al. Weather and climate extreme events in a changing climate [Internet]; 2021 [cited 2024 Dec 16]. Available from: https://www.ipcc.ch/report/ar6/wg1/chapter/chapter-11/. [Google Scholar]
15. Dharmarathne G, Waduge A, Bogahawaththa M, Rathnayake U, Meddage D. Adapting cities to the surge: a comprehensive review of climate-induced urban flooding. Results Eng. 2024;22(19):102123. doi:10.1016/j.rineng.2024.102123. [Google Scholar] [CrossRef]
16. Ren Y, Lü Y, Comber A, Fu B, Harris P, Wu L. Spatially explicit simulation of land use/land cover changes: current coverage and future prospects. Earth-Sci Rev. 2019;190:398–415. doi:10.1016/j.earscirev.2019.01.001. [Google Scholar] [CrossRef]
17. Xu X, Du Z, Zhang H. Integrating the system dynamic and cellular automata models to predict land use and land cover change. Int J Appl Earth Obs Geoinf. 2016;52:568–79. doi:10.1016/j.jag.2016.07.022. [Google Scholar] [CrossRef]
18. Islam K, Rahman MF, Jashimuddin M. Modeling land use change using cellular automata and artificial neural network: the case of Chunati wildlife sanctuary, Bangladesh. Ecol Indic. 2018;88(4):439–53. doi:10.1016/j.ecolind.2018.01.047. [Google Scholar] [CrossRef]
19. Talukdar S, Singha P, Mahato S, Shahfahad , Pal S, Liou YA, et al. Land-use land-cover classification by machine learning classifiers for satellite observations—a review. Remote Sens. 2020;12(7):1135. doi:10.3390/rs12071135. [Google Scholar] [CrossRef]
20. Amin G, Imtiaz I, Haroon E, Saqib N, Shahzad MI, Nazeer M. Assessment of machine learning algorithms for land cover classification in a complex mountainous landscape. J Geovis Spat Anal. 2024;8(2):34. doi:10.1007/s41651-024-00195-z. [Google Scholar] [CrossRef]
21. Mas J-F, Kolb M, Paegelow M, Camacho Olmedo MT, Houet T. Inductive pattern-based land use/cover change models: a comparison of four software packages. Environ Model Softw. 2014;51(19):94–111. doi:10.1016/j.envsoft.2013.09.010. [Google Scholar] [CrossRef]
22. Chen M, Samat N, Maghsoodi Tilaki MJ, Duan L. Land use/cover change simulation research: a system literature review based on bibliometric analyses. Ecol Indic. 2025;170(4):112991. doi:10.1016/j.ecolind.2024.112991. [Google Scholar] [CrossRef]
23. Liu X, Liang X, Li X, Xu X, Ou J, Chen Y, et al. A future land use simulation model (FLUS) for simulating multiple land use scenarios by coupling human and natural effects. Landsc Urban Plan. 2017;168(2):94–116. doi:10.1016/j.landurbplan.2017.09.019. [Google Scholar] [CrossRef]
24. Souza JM, Morgado P, Costa EM, Vianna LFN. Predictive scenarios of LULC changes supporting public policies: the case of Chapecó River ecological corridor, Santa Catarina/Brazil. Land. 2023;12(1):181. doi:10.3390/land12010181. [Google Scholar] [CrossRef]
25. Mutale B, Qiang F. Modeling future land use and land cover under different scenarios using patch-generating land use simulation model. A case study of Ndola district. Front Environ Sci. 2024;12:1362666. doi:10.3389/fenvs.2024.1362666. [Google Scholar] [CrossRef]
26. O’Neill BC, Kriegler E, Ebi KL, Kemp-Benedict E, Riahi K, Rothman DS, et al. The roads ahead: narratives for shared socioeconomic pathways describing world futures in the 21st century. Glob Environ Change. 2017;42(2):169–80. doi:10.1016/j.gloenvcha.2015.01.004. [Google Scholar] [CrossRef]
27. Riahi K, Van Vuuren DP, Kriegler E, Edmonds J, O’neill BC, Fujimori S, et al. The shared socioeconomic pathways and their energy, land use, and greenhouse gas emissions implications: an overview. Glob Environ Change. 2017;42:153–68. [Google Scholar]
28. Daigneault A, Johnston C, Korosuo A, Baker JS, Forsell N, Prestemon JP, et al. Developing detailed shared socioeconomic pathway (SSP) narratives for the global forest sector. J For Econ. 2019;34(1–2):7–45. doi:10.1561/112.00000441. [Google Scholar] [CrossRef]
29. Boysen LR, Brovkin V, Pongratz J, Lawrence DM, Lawrence P, Vuichard N, et al. Global climate response to idealized deforestation in CMIP6 models. Biogeosciences. 2020;17(22):5615–38. doi:10.5194/bg-17-5615-2020. [Google Scholar] [CrossRef]
30. Verniest F, Galewski T, Julliard R, Guelmami A, Le Viol I. Coupling future climate and land-use projections reveals where to strengthen the protection of Mediterranean key biodiversity areas. Conserv Sci Pract. 2022;4(11):e12807. doi:10.1111/csp2.12807. [Google Scholar] [CrossRef]
31. Li L, Xu E. Scenario analysis and relative importance indicators for combined impact of climate and land-use change on annual ecosystem services in the Karst mountainous region. Ecol Indic. 2023;147:109991. doi:10.1016/j.ecolind.2023.109991. [Google Scholar] [CrossRef]
32. M’Barek SA, Bouslihim Y, Rochdi A, Miftah A, Beroho M. The combined impact of climate change scenarios and land use changes on water resources in a semi-arid watershed. Sci Afr. 2024;25(1):e02319. doi:10.1016/j.sciaf.2024.e02319. [Google Scholar] [CrossRef]
33. Khwarahm NR, Qader S, Ararat K, Fadhil Al-Quraishi AM. Predicting and mapping land cover/land use changes in Erbil/Iraq using CA-Markov synergy model. Earth Sci Inform. 2021;14(1):393–406. doi:10.1007/s12145-020-00541-x. [Google Scholar] [CrossRef]
34. Wang Q, Guan Q, Lin J, Luo H, Tan Z, Ma Y. Simulating land use/land cover change in an arid region with the coupling models. Ecol Indic. 2021;122(3–4):107231. doi:10.1016/j.ecolind.2020.107231. [Google Scholar] [CrossRef]
35. Bao Q, Ding J, Han L, Li J, Ge X. Predicting land change trends and water consumption in typical arid regions using multi-models and multiple perspectives. Ecol Indic. 2022;141(7713):109110. doi:10.1016/j.ecolind.2022.109110. [Google Scholar] [CrossRef]
36. Al-Dousari AE, Mishra A, Singh S. Land use land cover change detection and urban sprawl prediction for Kuwait metropolitan region, using multi-layer perceptron neural networks (MLPNN). Egypt J Remote Sens Space Sci. 2023;26(2):381–92. doi:10.1016/j.ejrs.2023.05.003. [Google Scholar] [CrossRef]
37. Rash A, Mustafa Y, Hamad R. Quantitative assessment of land use/land cover changes in a developing region using machine learning algorithms: a case study in the Kurdistan Region. Iraq Heliyon. 2023;9(11):e21253. doi:10.1016/j.heliyon.2023.e21253. [Google Scholar] [PubMed] [CrossRef]
38. Zebari M, Balling P, Grützner C, Navabpour P, Witte J, Ustaszewski K. Structural style of the NW Zagros mountains and the role of basement thrusting for its mountain Front Flexure, Kurdistan region of Iraq. J Struct Geol. 2020;141(4):104206. doi:10.1016/j.jsg.2020.104206. [Google Scholar] [CrossRef]
39. Mohammed MW, Feizizadeh B, Klug H, Ghanbari A, Blaschke T. Ecotourism sustainability assessment using geospatial multiple approach in the Kurdistan region of Iraq. GeoJournal. 2023;88(3):3283–306. doi:10.1007/s10708-022-10807-0. [Google Scholar] [CrossRef]
40. Hamad R. A remote sensing and GIS-based analysis of urban sprawl in Soran District, Iraqi Kurdistan. SN Appl Sci. 2020;2(1):1–9. doi:10.1007/s42452-019-1806-4. [Google Scholar] [CrossRef]
41. Wang S, He S, Wang J, Li J, Zhong X, Cole J, et al. Analysis of land use/cover changes and driving forces in a typical subtropical region of South Africa. Remote Sens. 2023;15(19):4823. doi:10.3390/rs15194823. [Google Scholar] [CrossRef]
42. Leta MK, Demissie TA, Tränckner J. Modeling and prediction of land use land cover change dynamics based on land change modeler (LCM) in nashe watershed, upper blue nile basin. Ethiopia Sustain. 2021;13(7):3740. doi:10.3390/su13073740. [Google Scholar] [CrossRef]
43. Tahir Z, Haseeb M, Mahmood SA, Batool S, Abdullah-Al-Wadud M, Ullah S, et al. Predicting land use and land cover changes for sustainable land management using CA-Markov modelling and GIS techniques. Sci Rep. 2025;15(1):3271. doi:10.1038/s41598-025-87796-w. [Google Scholar] [PubMed] [CrossRef]
44. Fick SE, Hijmans RJ. WorldClim 2: new 1-km spatial resolution climate surfaces for global land areas. Int J Climatol. 2017;37(12):4302–15. doi:10.1002/joc.5086. [Google Scholar] [CrossRef]
45. Zhang P, Cai Y, Yang W, Yi Y, Yang Z, Fu Q. Contributions of climatic and anthropogenic drivers to vegetation dynamics indicated by NDVI in a large dam-reservoir-river system. J Clean Prod. 2020;256(4):120477. doi:10.1016/j.jclepro.2020.120477. [Google Scholar] [CrossRef]
46. Yang L, Shi L, Li J, Kong H. Spatio-temporal pattern change of LULC and its response to climate in the Loess plateau. China Sci Rep. 2024;14(1):23202. doi:10.21203/rs.3.rs-4230644/v1. [Google Scholar] [CrossRef]
47. da Silva LAP, Sano EE, Parreiras TC, Bolfe ÉL, Espírito-Santo MM, Filgueiras R, et al. Climate change effects on land use and land cover suitability in the southern Brazilian semiarid region. Land. 2024;13(12):1–20. doi:10.3390/land13122008. [Google Scholar] [CrossRef]
48. Chander G, Markham BL, Helder DL. Summary of current radiometric calibration coefficients for Landsat MSS, TM, ETM+, and EO-1 ALI sensors. Remote Sens Environ. 2009;113(5):893–903. doi:10.1016/j.rse.2009.01.007. [Google Scholar] [CrossRef]
49. Cooley T, Anderson GP, Felde GW, Hoke ML, Ratkowski AJ, Chetwynd JH, et al. FLAASH, a MODTRAN4-based atmospheric correction algorithm, its application and validation. In: Proceedings of the IEEE International Geoscience and Remote Sensing Symposium; 2002 Jun 24–28; Toronto, ON, Canada. doi:10.1109/IGARSS.2002.1026134. [Google Scholar] [CrossRef]
50. Anderson JR. A land use and land cover classification system for use with remote sensor data. Washington, DC, USA: U.S. Government Printing Office; 1976. 28 p. [Google Scholar]
51. Habeeb HN, Mustafa YT. Deep learning approaches for estimating forest vegetation cover and exploring influential ecosystem factors. Earth Sci Inform. 2024;17(4):3379–96. doi:10.1007/s12145-024-01346-y. [Google Scholar] [CrossRef]
52. Badshah MT, Hussain K, Rehman AU, Mehmood K, Muhammad B, Wiarta R, et al. The role of random forest and markov chain models in understanding metropolitan urban growth trajectory. Front For Glob Change. 2024;7:1345047. doi:10.3389/ffgc.2024.1345047. [Google Scholar] [CrossRef]
53. Breiman L. Random forests. Mach Learn. 2001;45:5–32. [Google Scholar]
54. Ghosh D, Cabrera J. Enriched random forest for high dimensional genomic data. IEEE ACM Trans Comput Biol Bioinform. 2021;19(5):2817–28. doi:10.1109/tcbb.2021.3089417. [Google Scholar] [PubMed] [CrossRef]
55. Haq MA. Planetscope nanosatellites image classification using machine learning. Comput Syst Sci Eng. 2022;42(3):1031–46. doi:10.32604/csse.2022.023221. [Google Scholar] [CrossRef]
56. Adugna T, Xu W, Fan J. Comparison of random forest and support vector machine classifiers for regional land cover mapping using coarse resolution FY-3C images. Remote Sens. 2022;14(3):574. doi:10.3390/rs14030574. [Google Scholar] [CrossRef]
57. Saabith AS, Vinothraj T, Fareez M. Popular python libraries and their application domains. Int J Adv Eng Res Dev. 2020;7(11):18–26. [Google Scholar]
58. van Vuuren DP, Riahi K, Calvin K, Dellink R, Emmerling J, Fujimori S, et al. The shared socio-economic pathways: trajectories for human development and global environmental change. Glob Environ Change. 2017;42:148–52. doi:10.1016/j.gloenvcha.2016.10.009. [Google Scholar] [CrossRef]
59. R Core Team. R: a language and environment for statistical computing. Vienna, Austria: R Foundation for Statistical Computing; 2022 [cited 2024 Nov 10]. Available from: https://www.R-project.org/. [Google Scholar]
60. Sabins FFJr, Ellis JM. Remote sensing: principles, interpretation, and applications. Long Grove, IL, USA: Waveland Press; 2020. 524 p. [Google Scholar]
61. Chundu ML, Banda K, Lyoba C, Tembo G, Sichingabula HM, Nyambe IA. Modeling land use/land cover changes using quad hybrid machine learning model in Bangweulu wetland and surrounding areas, Zambia. Environ Chall. 2024;14(1):100866. doi:10.1016/j.envc.2024.100866. [Google Scholar] [CrossRef]
62. Congalton RG, Green K. Assessing the accuracy of remotely sensed data: principles and practices. 3rd ed. Boca Raton, FL, USA: CRC Press; 2019. 346 p. [Google Scholar]
63. McHugh ML. Interrater reliability: the kappa statistic. Biochem Medica. 2012;22(3):276–82. doi:10.11613/bm.2012.031. [Google Scholar] [CrossRef]
64. Dash P, Sanders SL, Parajuli P, Ouyang Y. Improving the accuracy of land use and land cover classification of Landsat data in an agricultural watershed. Remote Sens. 2023;15(16):4020. doi:10.3390/rs15164020. [Google Scholar] [CrossRef]
65. Zhu X, Wang T, Skidmore AK, Lee SJ, Duporge I. Mitigating terrain shadows in very high-resolution satellite imagery for accurate evergreen conifer detection using bi-temporal image fusion. Int J Appl Earth Obs Geoinf. 2024;134:104244. doi:10.1016/j.jag.2024.104244. [Google Scholar] [CrossRef]
66. Wahdatyar R, Khokhar MF, Ahmad S, Rahil MU, Stanikzai MA, Khan JA. Exploring the dynamics and future projections of land use land cover changes by exploiting geospatial techniques; a case study of the Kabul river basin. Heliyon. 2024;10(20):e39020. doi:10.1016/j.heliyon.2024.e39020. [Google Scholar] [PubMed] [CrossRef]
67. Pande CB, Srivastava A, Moharir KN, Radwan N, Mohd Sidek L, Alshehri F, et al. Characterizing land use/land cover change dynamics by an enhanced random forest machine learning model: a Google earth engine implementation. Environ Sci Eur. 2024;36(1):84. doi:10.1186/s12302-024-00901-0. [Google Scholar] [CrossRef]
68. Mutale B, Withanage NC, Mishra PK, Shen J, Abdelrahman K, Fnais MS. A performance evaluation of random forest, artificial neural network, and support vector machine learning algorithms to predict spatio-temporal land use-land cover dynamics: a case from lusaka and colombo. Front Environ Sci. 2024;12:1431645. doi:10.3389/fenvs.2024.1431645. [Google Scholar] [CrossRef]
69. Tikuye BG, Rusnak M, Manjunatha BR, Jose J. Land use and land cover change detection using the random forest approach: the case of the Upper Blue Nile River basin. Ethiopia Glob Chall. 2023;7(10):2300155. doi:10.1002/gch2.202300155. [Google Scholar] [PubMed] [CrossRef]
70. Asif M, Kazmi JH, Tariq A, Zhao N, Guluzade R, Soufan W, et al. Modelling of land use and land cover changes and prediction using CA-Markov and Random Forest. Geocarto Int. 2023;38(1):2210532. doi:10.1080/10106049.2023.2210532. [Google Scholar] [CrossRef]
71. Prestele R, Alexander P, Rounsevell MD, Arneth A, Calvin K, Doelman J, et al. Hotspots of uncertainty in land-use and land-cover change projections: a global-scale model comparison. Glob Change Biol. 2016;22(12):3967–83. doi:10.1111/gcb.13337. [Google Scholar] [PubMed] [CrossRef]
72. Hasan S, Shi W, Zhu X, Abbas S, Khan HUA. Future simulation of land use changes in rapidly urbanizing south China based on land change modeler and remote sensing data. Sustainability. 2020;12(11):4350. doi:10.3390/su12114350. [Google Scholar] [CrossRef]
73. Salhab M, Basiri A. Spatial data quality evaluation for land cover classification approaches. ISPRS Ann Photogramm Remote Sens Spat Inf Sci. 2020;3:681–7. doi:10.5194/isprs-annals-v-3-2020-681-2020. [Google Scholar] [CrossRef]
74. Wang Y, Tan L, Wang G, Sun X, Xu Y. Study on the impact of spatial resolution on fractional vegetation cover extraction with single-scene and time-series remote sensing data. Remote Sens. 2022;14(17):4165. doi:10.3390/rs14174165. [Google Scholar] [CrossRef]
75. Marey A, Wang L, Goubran S, Gaur A, Lu H, Leroyer S, et al. Forecasting urban land use dynamics through patch-generating land use simulation and markov chain integration: a multi-scenario predictive framework. Sustainability. 2024;16(23):10255. doi:10.3390/su162310255. [Google Scholar] [CrossRef]
76. Zhang F, Yang X. Improving land cover classification in an urbanized coastal area by random forests: the role of variable selection. Remote Sens Environ. 2020;251(10):112105. doi:10.1016/j.rse.2020.112105. [Google Scholar] [CrossRef]
77. Virtriana R, Deanova MA, Safitri S, Anggraini TS, Ihsan KTN, Deliar A, et al. Identification of land cover change and spatial distribution based on topographic variations in Java island. Ecol Front. 2024;44(1):129–42. doi:10.1016/j.chnaes.2023.08.002. [Google Scholar] [CrossRef]
78. Hansen MC, Potapov PV, Moore R, Hancher M, Turubanova SA, Tyukavina A, et al. High-resolution global maps of 21st-century forest cover change. Science. 2013;342(6160):850–3. doi:10.1126/science.1244693. [Google Scholar] [PubMed] [CrossRef]
79. Palmer MA, Lettenmaier DP, Poff NL, Postel SL, Richter B, Warner R. Climate change and river ecosystems: protection and adaptation options. Environ Manag. 2009;44(6):1053–68. doi:10.1007/s00267-009-9329-1. [Google Scholar] [PubMed] [CrossRef]
80. Eklund L, Abdi A, Islar M. From producers to consumers: the challenges and opportunities of agricultural development in Iraqi Kurdistan. Land. 2017;6(2):44. doi:10.3390/land6020044. [Google Scholar] [CrossRef]
81. Wu X, Zhao X, Chen P, Zhu B, Cai W, Wu W, et al. Assessing the effects of combined future climate and land use/cover changes on streamflow in the Upper Fen river basin. China J Hydrol Reg Stud. 2024;53(12):101853. doi:10.1016/j.ejrh.2024.101853. [Google Scholar] [CrossRef]
82. Popp A, Calvin K, Fujimori S, Havlik P, Humpenöder F, Stehfest E, et al. Land-use futures in the shared socio-economic pathways. Glob Environ Change. 2017;42:331–45. [Google Scholar]
83. Zabel F, Putzenlechner B, Mauser W. Global agricultural land resources-a high resolution suitability evaluation and its perspectives until 2100 under climate change conditions. PLoS One. 2014;9(9):e107522. doi:10.1371/journal.pone.0107522. [Google Scholar] [PubMed] [CrossRef]
84. Lal R. Climate change and soil degradation mitigation by sustainable management of soils and other natural resources. Agric Res. 2012;1(3):199–212. doi:10.1007/s40003-012-0031-9. [Google Scholar] [CrossRef]
85. Lind L, Hasselquist EM, Laudon H. Towards ecologically functional riparian zones: a meta-analysis to develop guidelines for protecting ecosystem functions and biodiversity in agricultural landscapes. J Environ Manag. 2019;249:109391. doi:10.1016/j.jenvman.2019.109391. [Google Scholar] [PubMed] [CrossRef]
86. Boakes EH, Dalin C, Etard A, Newbold T. Impacts of the global food system on terrestrial biodiversity from land use and climate change. Nat Commun. 2024;15(1):5750. doi:10.1038/s41467-024-49999-z. [Google Scholar] [PubMed] [CrossRef]
87. Angel S, Parent J, Civco DL, Blei A, Potere D. The dimensions of global urban expansion: estimates and projections for all countries, 2000–2050. Prog Plan. 2011;75(2):53–107. doi:10.1016/j.progress.2011.04.001. [Google Scholar] [CrossRef]
88. Krivoguz D. Geo-spatial analysis of urbanization and environmental changes with deep neural networks: insights from a three-decade study in Kerch peninsula. Ecol Inform. 2024;80:102513. doi:10.1016/j.ecoinf.2024.102513. [Google Scholar] [CrossRef]
89. Daba MH, You S. Quantitatively assessing the future land-use/land-cover changes and their driving factors in the upper stream of the Awash river based on the CA-markov model and their implications for water resources management. Sustainability. 2022;14(3):1538. doi:10.3390/su14031538. [Google Scholar] [CrossRef]
90. Akinyemi FO, Ifejika Speranza C. Agricultural landscape change impact on the quality of land: an African continent-wide assessment in gained and displaced agricultural lands. Int J Appl Earth Obs Geoinf. 2022;106:102644. doi:10.1016/j.jag.2021.102644. [Google Scholar] [CrossRef]
91. Food and Agriculture Organization of the United Nations. The state of the world’s land and water resources for food and agriculture—systems at breaking point: synthesis report. Rome, Italy: Food and Agriculture Organization of the United Nations; 2021. [Google Scholar]
92. Wairiu M. Land degradation and sustainable land management practices in Pacific island countries. Reg Environ Change. 2017;17(4):1053–64. doi:10.1007/s10113-016-1041-0. [Google Scholar] [CrossRef]
93. Wang F, An P, Huang C, Zhang Z, Hao J. Is afforestation-induced land use change the main contributor to vegetation dynamics in the semiarid region of North China? Ecol Indic. 2018;88:282–91. doi:10.1016/j.ecolind.2017.12.061. [Google Scholar] [CrossRef]
94. Mahtta R, Fragkias M, Güneralp B, Mahendra A, Reba M, Wentz EA, et al. Urban land expansion: the role of population and economic growth for 300+ cities. npj Urban Sustain. 2022;2(1):5. doi:10.1038/s42949-022-00048-y. [Google Scholar] [CrossRef]
95. Curtis PG, Slay CM, Harris NL, Tyukavina A, Hansen MC. Classifying drivers of global forest loss. Science. 2018;361(6407):1108–11. doi:10.1126/science.aau3445. [Google Scholar] [PubMed] [CrossRef]
96. AbdelRahman MAE. An overview of land degradation, desertification and sustainable land management using GIS and remote sensing applications. Rend Lincei Sci Fis E Nat. 2023;34(3):767–808. doi:10.1007/s12210-023-01155-3. [Google Scholar] [CrossRef]
97. Vörösmarty CJ, McIntyre PB, Gessner MO, Dudgeon D, Prusevich A, Green P, et al. Global threats to human water security and river biodiversity. Nature. 2010;467(7315):555–61. doi:10.1038/nature09440. [Google Scholar] [PubMed] [CrossRef]
98. Wang X, Liu L. The impacts of climate change on the hydrological cycle and water resource management. Water. 2023;15(13):2342. doi:10.3390/w15132342. [Google Scholar] [CrossRef]
99. Belay T, Melese T, Senamaw A. Impacts of land use and land cover change on ecosystem service values in the Afroalpine area of Guna mountain, northwest Ethiopia. Heliyon. 2022;8(12):e12246. doi:10.1016/j.heliyon.2022.e12246. [Google Scholar] [PubMed] [CrossRef]
100. Haghverdi K, Kooch Y. Long-term afforestation effect and help to optimize degraded forest lands and reducing climate changes. Ecol Eng. 2020;142(8):105656. doi:10.1016/j.ecoleng.2019.105656. [Google Scholar] [CrossRef]
101. Yang S, Cui X. Building regional sustainable development scenarios with the SSP framework. Sustainability. 2019;11(20):5712. doi:10.3390/su11205712. [Google Scholar] [CrossRef]
102. O’Neill BC, Carter TR, Ebi K, Harrison PA, Kemp-Benedict E, Kok K, et al. Achievements and needs for the climate change scenario framework. Nat Clim Change. 2020;10(12):1074–84. doi:10.1038/s41558-020-00952-0. [Google Scholar] [PubMed] [CrossRef]
103. Kasahun M, Legesse A. Machine learning for urban land use/cover mapping: comparison of artificial neural network, random forest and support vector machine, a case study of Dilla town. Heliyon. 2024;10(20):e39146. doi:10.1016/j.heliyon.2024.e39146. [Google Scholar] [PubMed] [CrossRef]
104. Li Z, Chen B, Wu S, Su M, Chen JM, Xu B. Deep learning for urban land use category classification: a review and experimental assessment. Remote Sens Environ. 2024;311:114290. doi:10.1016/j.rse.2024.114290. [Google Scholar] [CrossRef]
105. Uusitalo L, Lehikoinen A, Helle I, Myrberg K. An overview of methods to evaluate uncertainty of deterministic models in decision support. Environ Model Softw. 2015;63:24–31. doi:10.1016/j.envsoft.2014.09.017. [Google Scholar] [CrossRef]
106. Simmonds EG, Adjei KP, Andersen CW, Hetle Aspheim JC, Battistin C, Bulso N, et al. Insights into the quantification and reporting of model-related uncertainty across different disciplines. iScience. 2022;25(12):105512. doi:10.1016/j.isci.2022.105512. [Google Scholar] [PubMed] [CrossRef]
Cite This Article
 Copyright © 2025 The Author(s). Published by Tech Science Press.
This work is licensed under a Creative Commons Attribution 4.0 International License , which permits unrestricted use, distribution, and reproduction in any medium, provided the original work is properly cited.
 Downloads
 Citation Tools