
 Submit a Paper
 Propose a Special lssue
 Open Access
ARTICLE

Machine Learning-Assisted Denoising of Raman Spectral Remote Sensing Data for Improved Land Use Mapping
1Campus Cité Scientifique, University of Lille, Villeneuve-d’Ascq, Lille, 59650, Hauts-de-France, France
2 College of Computer Science and Information Systems, Institute of Business Management, Korangi Creek, Karachi, 75270, Pakistan
3 Faculty of Technology Management and Business (FPTP), Universiti Tun Hussein Onn Malaysia, Batu Pahat, 86400, Johor, Malaysia
4 Electronic Engineering Department, University of Technology and Applied Sciences, Nizwa, 611, Sultanate of Oman
5 Civil Engineering Department, College of Engineering and Technology, Romblon State University, Odiongan, Romblon, 5505, Philippine
6 Disaster Prevention Research Institute, Kyoto University, Gokasho, Uji, Kyoto, 611-0011, Japan
7 Department of Civil Engineering, College of Engineering, FEU Institute of Technology, P. Paredes St., Sampaloc, Manila, 1015, Philippine
8 School of Civil, Environmental and Geological Engineering, Mapua University, Manila, 1002, Philippine
* Corresponding Author: Fawad Salam Khan. Email:
(This article belongs to the Special Issue: Application of Remote Sensing and GIS in Environmental Monitoring and Management)
Revue Internationale de Géomatique 2025, 34, 415-432. https://doi.org/10.32604/rig.2025.067026
Received 23 April 2025; Accepted 03 July 2025; Issue published 29 July 2025
 View Full Text
 Download PDF
Abstract
Noise present in remote sensing data creates obstacles to proper land use and land cover (LULC) classification methods. The paper evaluates machine learning (ML) denoising methods that adapt Raman spectroscopy’s spectral techniques to optimise remote sensing spectra for land-use/land-cover (LULC) mapping. A basic Raman spectroscopy model demonstrates that Savitzky-Golay (SG) filtering, Wavelet denoising, and basic 1D Convolutional Autoencoder have different effects on synthetic spectral features relevant to LULC classification. Savitzky-Golay filtering yielded the most efficient results, increasing classification accuracy from 0.71 (noisy) to 1.00 (denoised), resulting in perfect classification with zero errors and enhancing the Precision-Recall curve, as Area Under the Precision-Recall Curve (AUC-PR) transformed from 0.84 to 1.00. The study examined wavelet denoising in conjunction with a 1D Convolutional Autoencoder, assessing the noise reduction capability through visual evaluation. Based on Raman-based spectral analysis, a traditional method complemented with machine learning denoising provides promising fields for feature identification in remote sensing images, thereby improving the quality of LULC-related mapping outcomes.Keywords
Accurate Land Use and Land Cover (LULC) mapping forms the core of modern environmental monitoring, urban planning, agricultural policy, mitigation of disasters, and resource management. As land resource demands stimulated by rapid urbanisation and climate change have arisen, a high need for dependable and updated land cover mapping has emerged. The development of multispectral and hyperspectral remote sensing technologies has transformed the field, making it possible to identify sensible differences between various surface materials by analysing spectral features across the electromagnetic spectrum.
Modern environmental monitoring, urban planning, and sustainable resource management heavily on precise land-use/land-cover (LULC) mapping, which utilises multispectral remote sensing data to generate detailed results. The broad range of spectral data from multiple electromagnetic bands demonstrates a high potential to distinguish various surface features. The acquisition and transmission of multifrequency remote sensing data are affected by various noise factors, including atmospheric scattering, absorption, sensor artefacts, and electronic system interference. The contamination from noise reduces spectral signature quality by obscuring important LULC class differences, which diminisheshe accuracy and reliability of mapping results [1].
Studies investigate machine learning (ML) techniques to enhance the effectiveness of denoising multispectral remote sensing data, given the growing research focus on these methods. This article examines the potential of ML-assisted spectral denoising, drawing on the principles and evaluation approaches employed in Raman spectroscopy molecular identification [2]. Implementing ML-based denoising procedures aims to enhance signal-to-noise ratios, thereby maintaining the unique spectral characteristics of land cover classes and facilitating more accurate LULC mapping. The principles are described using an elementary Raman spectroscopy case study, highlighting the relevance of these principles to remote sensing [3].
This work is a key contributor to the development of a state-of-the-art cross-domain approach that utilises denoising strategies based on Raman spectroscopy to enhance land-use/land-cover classification under remote sensing. Despite the typical problems of noisy spectral data in remote sensing and Raman spectroscopy, their cleansing methods have been unique to their respective areas of science. This work presents a revolutionary strategy that combines the high-precision aspects of Raman spectroscopy, such as peak preservation, contrast normalisation, and advanced spectral feature retention, with remote sensing applications.
Remote sensing image analysis enables the observation of different Earth surface landscape features. The analysis becomes problematic because data contains excess noise that impedes its efficiency. When detection occurs, spectral noise generates the possibility of contaminating signal-to-noise ratios, which affects both accuracy and reliability in sample analyses, according to [4]. The use of excessive noise is disastrous, as it degrades the accuracy and validity of land use classification by degrading the quality of spectral signals. Overcoming this problem through effective denoising techniques is critical for both Raman spectroscopy and remote sensing. The power of Raman spectroscopy is limited by weak signals, which produce inferior signal-to-noise ratios. All research teams should adopt denoising techniques to improve signal-to-noise ratios, as recommended in [5].
Deep learning is a powerful analytical technique used within remote sensing, a subcategory of the vast remote sensing framework. Deep learning algorithms for remote-sensing image analysis have also witnessed a rapid increase in popularity, as indicated in [6]. Based on [5], while it is true that the use of deep learning for analyzing hyperspectral images is warranted, as hyperspectral data require careful handling due to their spatial dimensionality. According to [7], the effective analysis of hyperspectral remote sensing images is burdened by factors such as the complicated variation of landscapes and the multitude of color bands.
The challenges discussed include increased difficulty in handling noisy Raman spectra and the minimal requirements for effective denoising. Specifically, traditional methods struggle to maintain spectral fidelity, especially under weak signal conditions, and are limited in their ability to adapt to complex noise patterns. These issues prompt the exploration of convolutional models and deep learning alternatives that are better suited to idle synthetic and real-world spectral data [8]. The authors of [9] analyze the difficulties associated with Raman Spectra denoising procedures, as demonstrated in research by [10], to investigate single-layer convolutional model applications for denoising Raman spectra through training with synthetic data. Scientific exploration continues toward finding multiple techniques for denoising purposes. Ref. [11] conducted an in-depth review of recent advancements in Raman spectrum denoising, focusing on filters, power spectrum estimation, and deep learning technologies.
The authors [12] developed Raman spectral denoising a backpropagation neural network. Researchers at [13] developed a neural network denoising system based on variational mode decomposition and empirical wavelet transform, utilizing an encoder-bidirectional long short-term memory, which reduces noise while maintaining important spectral characteristics. Both Raman spectroscopy and remote sensing require denoising as their essential preprocessing approach. The scientific community is working on creating deep learning-based and traditional signal processing approaches to develop better signal quality capacities and enhanced analytical capabilities [14].
According to [15], machine learning (ML) technology maintains growing significance for Raman spectroscopy purposes. Traditional spectral data processing methods have used boundaries, which refer to the weaknesses of conventional methods applied to work with spectral data. This implies that the development of Raman spectroscopy may involve the use of more flexible machine learning techniques, as conventional ones can be limited while the technique continues its technological growth and operational expansion. The article describes how machine-learning methods are more effective at analyzing spectral data, enabling evolutionary opportunities in analytical science [16].
The review starts with a description of traditional statistical approaches and explores modern ML algorithms based on neural networks with deep learning featured in Raman spectroscopy [17]. Several machine-learning approaches have been employed for spectral denoising and classification, including principal component analysis (PCA) as a dimensionality reduction technique, KNN and SVM as classification techniques, and RF for ensemble learning, as well as other deep learning models like ANNs and CNNs for feature extraction from high-dimensional spectra. The correct differentiation of Earth’s surface landscapes depends heavily on analysis of remote sensing images. Numerous obstacles hinder the effectiveness of this analysis, as noise is present throughout the data set. During detection operations, noise can degrade signal-to-noise ratios, affecting the accuracy and reliability of sample analysis results. Noise acts as a major impediment that undermines accurate and dependable land use and land cover (LULC) classification [18].
The signal-to-noise ratio needs improvement through denoising techniques, as otherwise, the extraction of effective data becomes impossible. Researchers are studying both established and learning-based machine approaches to improve science data. The development of numerous denoising algorithms emerged due to the necessity of solving noise-related issues. Such algorithms enhance the utility of Raman spectroscopy and remote sensing applications, enabling them to operate in more complex domains, such as LULC mapping. The evaluation process examines machine learning (ML)-based denoising algorithms that utilize Raman spectroscopy spectral methods to enhance remote sensing spectra for mapping applications in land-use/land-cover (LULC) [19].
Scientists have examined multiple denoising methods to determine their effectiveness when enhancing spectral data results. Several LULC-relevant synthetic spectral features underwent transformations using Savitzky-Golay (SG) filtering, Wavelet denoising, and basic 1D Convolutional Autoencoder according to a simplified Raman spectroscopy model. The use of SG filtering yielded the best classification accuracy, which improved from 0.71 in a noisy environment to 1.00 with denoised data. SG filtering was set with a window size of 11 and a polynomial order of 3 to ensure a balance between smoothing and peak preservation, while achieving complete precision and recalling all samples with no errors. This modification enhanced the Precision-Recall curve by transforming AUC-PR from 0.84 to 1.00.
Roughly sixty percent of this research investigated Wavelet denoising as a solution for noise reduction. Visual assessments were conducted for Wavelet denoising along with a 1D Convolutional Autoencoder throughout the examination process [6]. The investigation phase includes Convolutional Autoencoder as machine learning-based alternatives. Various traditional and machine learning-based denoising methods demonstrate promising potential according to spectral analysis for detecting remote sensing features that enhance LULC mapping accuracy [20].
The research methodology constructs an organised framework for machine learning to assist in denoising remote sensing spectral data based on concepts from Raman spectroscopy. There are three fundamental preprocessing principles that Raman spectroscopy can greatly benefit from, including preserving spectral integrity, normalising spectra to maintain contrast, and smoothing without distorting spectral features. Protection of spectral peaks is at the core; as such peaks mark the molecular vibrations necessary for accurate materials identification and classification. The application of filtering approaches that preserve both the shapes and amplitudes of spectral peaks when denoised is pertinent to sustaining maximum visibility and integrity. When normalisation is utilised, researchers can maintain the relative contrast of the spectra, allowing for a similar comparison despite velocity being outside uniform signal intensities. Deleted within its evident ability to reduce high-frequency noise while maintaining the essential architecture of its spectral peaks, Savitzky-Golay filtering becomes a preferred method in Raman preprocessing. By achieving this equilibrium, the necessary spectral character elements are maintained, allowing for precise downstream analyses, such as land usage interpretation or molecular recognition. The first step involves preparing data using a clean spectral dataset that portrays different Land Use and Land Cover (LULC) classes as the reference baseline. To replicate real-world measurement conditions, artificial noise, either Poisson or Gaussian, is added to create noisy spectra that resemble spectral acquisition challenges.
Their accurate representation of intrinsic physical mechanisms justifies the use of Gaussian and Poisson noise when simulating measurement errors in remote sensing and Raman spectroscopy. Gaussian noise is ideal for modelling random electronic disturbances arising from sensors and readout electronics in the process of acquiring measurement signals. In comparison, Poisson noise describes the discrete counting fluctuation due to the arrival of photons, which is an essential part of optical metrics that involves photon-by-photon detection. Furthermore, Poisson noise becomes particularly relevant to settings where signal intensity is weak or photon numbers small, such as in Raman spectroscopy. The integration of these noise models yields a comprehensive and useful approach to modelling and analysing practical measurement errors in optical and remote sensing settings. The work presents an innovative data denoising technique for remote sensing spectra using machine learning, drawing on principles from Raman spectroscopy. The proposed mathematical procedures offer enhanced LULC classification methods that retain land-discriminative spectral features while denoising tasks. Let the clean spectral dataset be denoted by:
where
Let the noisy input be noisy
This study’s normalization was adapted from Raman preprocessing techniques that emphasize the preservation of the spectral amplitude relationship. Min-max scaling was used to ensure that the relative intensity difference between undesired noise and helpful spectral features remained unchanged after denoising. This preservation technique of spectral contrast is essential for enhancing LULC classification accuracy, as the discriminative features are evident in every spectral class. The first stage involves applying traditional baseline denoising methods that draw inspiration from Raman spectroscopy. Savitzky-Golay filtering utilises local polynomials to perform smoothed retrofits of spectral signals within moving windows, thereby preserving peak characteristics. The spectral signal undergoes wavelet thresholding by decomposing its components into different frequencies, while conserving significant coefficients to reduce noise levels.
The research develops an improved set of autoencoder-based models as part of its advanced denoising proposition, building upon foundational approaches. Through a learning algorithm the general denoising autoencoder develops the ability to restore clean spectral measurements by comparing their input with output signals. The autoencoder uses a multilayer perceptron architecture with feedforward connections and non-linear decay functions for spectral encoding and decoding operations. A convolutional autoencoder employs one-dimensional convolutional layers to handle dependencies and spectral features, then performs reconstruction using transposed convolutional layers. The reproducibility of the current study was achieved by training the autoencoder model using the Adam optimiser for 100 epochs with a batch size of 32. By using Mean Squared Error (MSE) as a loss metric, the model was capable of penalising any mismatch between the reconstructed and clean spectra.
The evaluation of how well the model generalises to new spectral data during inference was conducted by randomly splitting the dataset into 80% training and 20% testing sets. The main feature of this methodology involves a new autoencoder constructed from U-Net components, incorporating spectral skip connections. This architecture features encoding and decoding layers, where each layer matches, and an intermediate feature flow is maintained through skip connections. This design infrastructure maintains Essential spectral information throughout the denoising procedure, which increases reconstruction accuracy. Speech amplitude relationships necessary for LULC classification receive protection from a normalization process adapted from Raman spectroscopy. After denoising steps, the process adjusts spectra signals and noise elements to maintain their contrast features. The methodology combines integrated stages, starting with synthetic noise simulation, then proceeding to classical filtering, advancing to deep learning-based restoration, and concluding with Raman-inspired normalisation, which safely maintains land-discriminative spectral characteristics while effectively reducing noise.
Experimental results demonstrated that machine-learning-based denoising significantly enhanced the quality of Raman remote sensing spectra. Savitzky-Golay (SG) filtering yielded the highest gains among the methods analysed, thereby increasing classification accuracy. The findings show that extensive denoising significantly improves the detection and classification of land use features, due to the successful preservation of important spectral characteristics and a reduction in false alarms. The studies presented empirical data through spectral plots, confusion matrices, and precision-recall curves, which provide clear evidence that certain denoising approaches produce enhanced spectral data, thereby enhancing the performance of land use feature detection models. The analysis provides detailed descriptions of individual results and highlights the strengths and limitations of different denoising methods to enhance classification precision (Fig. 1).
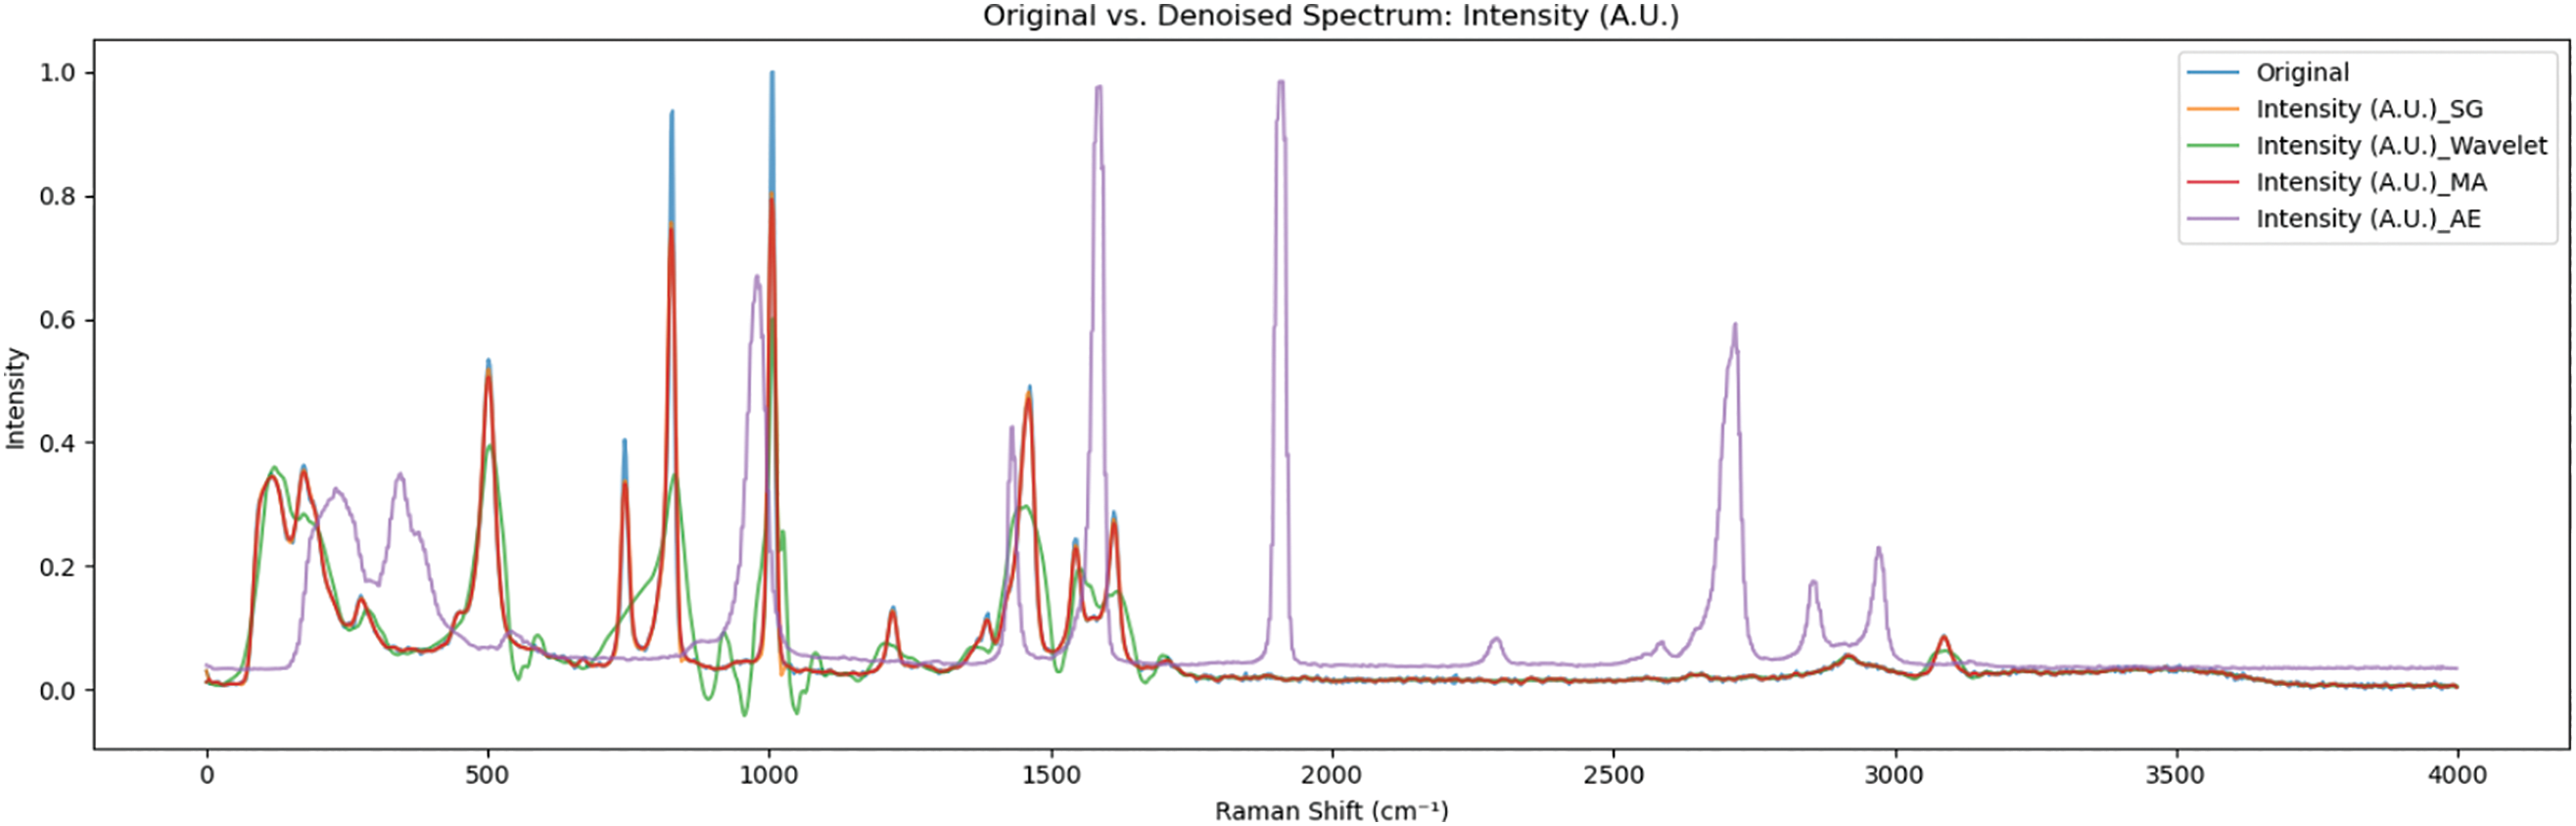
Figure 1: Denoising performance comparison for Raman spectral remote sensing data in the context of land use mapping
A comparison between the original Raman spectrum noise and various denoised signal outputs appears in the “Original and Denoised Spectrum: Intensity (A.U.)” graph. The Raman shift frequencies measured in cm−1 appear on the x-axis, while the intensity values displayed in arbitrary units (A.U.) appear on the y-axis. The original blue Raman spectrum exhibits high noise levels, accompanied by an SNR score of 18.39 dB. All methods of denoising get their reference point from this baseline. The cyan-colored Savitzky-Golay filter stands out from other classical approaches by giving an SNR of 23.66 dB and generating a signal correlation of 0.99 with the authentic spectrum.
The technique successfully smooths noise without distorting peak characteristics and retaining spectral integrity. The Moving Average technique (magenta) produces an outcome that is almost identical to the Savitzky-Golay filter (cyan) in terms of signal integrity, delivering an SNR of 23.83 dB and matching the correlation result of 0.99; however, it suffers from slight peak distortion. Wavelet Denoising (green) demonstrates the best performance in noise reduction through an SNR value of 27.83 dB. The methods’ correlation with the original spectrum shows a slight decline to 0.88 because excessive smoothing of sharp peaks damages spectral details. Among other wavelet-based approaches, this process requires trade-offs between strength and fidelity.
The brown-coloured Autoencoder (AE) model achieves an SNR value of 23.94 dB, comparable to the performance of SG and MA filters. The performance of the AE indicates the gap between its ability to filter out noise and retain the initial features of the Raman signal. The proposed poor correlation suggests that the autoencoder struggles to generalise signal distribution patterns due to restrictions in the training data, reduced model capacity, and the absence of a spectral similarity loss function. Both smoothing (SG) and moving average (MA) classical methods exhibit strong baseline performance in terms of SNR and spectral fidelity. Although subtracting noise using the wavelet transform is effective, this method may slightly weaken the marginal features.
The data cleanup capabilities of the autoencoder show promise, but its architectural optimisation, with additional tuning, must progress substantially to effectively capture real Raman spectra. The future development of the technology will benefit from incorporating a spectral correlation-based loss function into the design, while expanding training datasets and utilising hybrid deep learning models in the process.
The Fig. 2 illustrates the residuals obtained by subtracting the denoised spectra from the original noisy Raman spectrum, thereby highlighting the remaining noise or distortion introduced by each denoising method. The residual of the original estimated noise is displayed in blue as a reference baseline. The Savitzky-Golay (SG) residual (orange) closely aligns with the baseline across the spectral range, indicating minimal loss of spectral detail and effective smoothing.

Figure 2: Residual analysis of machine learning-assisted denoising techniques for Raman spectral remote sensing data
The Wavelet Transform (green) produces slightly more pronounced residuals, particularly in sharp peak regions, suggesting some over-smoothing or feature attenuation. While achieving a high SNR in the earlier figure, the Moving Average (MA) method (purple) introduces larger residual oscillations, especially in the lower and mid-Raman shifts, signifying poor preservation of sharp spectral peaks. The Autoencoder (AE) residual (brown) appears inconsistent, particularly around intense Raman peaks and baseline regions, reaffirming earlier observations of its low correlation with the original signal, despite its reasonable signal-to-noise ratio (SNR). This residual analysis is crucial for evaluating the fidelity of denoising approaches in Raman spectral preprocessing, particularly for downstream tasks such as land-use classification, where spectral integrity is paramount.
Fig. 3 examines the Raman spectral area from 1000 to 1200 cm−1 in detail to analyze various algorithmic denoising methods. This spectrum range provides essential identification of technical characteristics related to land classification. The peak located at 1005 cm−1 in the original noisy signal provides essential reference points to evaluate the performance of the denoted results, through the implementation of Savitzky-Golay (orange), a method that upholds the original peak’s features with high accuracy. The Wavelet transform introduces significant peak distortions by over-smoothing the feature alongside an estimated magnitude reduction. The red Moving Average (MA) technique preserves the original peak shape and applies substantial smoothing, producing moderate peak deformation.

Figure 3: Zoomed-in comparison of denoising algorithms in the Raman shift range 1000–1200 cm−1 for machine learning-assisted spectral preprocessing
The Autoencoder (AE) approach (purple) produces a significant flattening effect on the peak, resulting in spectral shape misrepresentation across this specific region. Each denoising technique exhibits different sensitivities to precise spectral modifications through this close-up examination, as these features are crucial for accurate Raman-based land use identification. The analysis area in Fig. 4 showcases the Raman spectrum from 2800–3000 cm−1, as it enables the recognition of C–H stretching modes commonly observed in organic components present in vegetation and soil. The performance evaluation of noise reduction through SG Savitzky-Golay, Wavelet, Moving Average and Autoencoders demonstrates their ability to deal with original noisy signals. The established filters (SG, Wavelet, MA) function identically to the original signal by retaining small peak details without significant distortion. The Autoencoder with machine learning methods produces conspicuous signal peaks that directly conflict with normal baseline patterns. The noise-suppressing behaviour of Autoencoder models raises concerns when it comes to producing artificial spectral details in critical land usage areas. Evaluation driven specifically for remote sensing spectra needs to be achieving priority because of its criticla role in enviornmental analysis.

Figure 4: Zoomed-in analysis of Raman spectral denoising methods in the 2800–3000 cm−1 region for machine learning-assisted denoising of Raman spectral remote sensing data for improved land use mapping
Fig. 5 demonstrates a close-up analysis of different denoising strategies tested on the Raman spectrum range extending from 1550 to 1650 cm−1, where C=C stretching modes from vegetation and organic substances often appear in remote sensing datasets. The original spectrum contains a detailed peak that appears at 1615 cm−1. The traditional spectral filtering approaches, including Savitzky-Golay (SG), Wavelet, and Moving Average (MA), efficiently retain peak form and intensity values, as these serve as essential factors for accurate land use type identification. The Autoencoder (AE)-based denoising technique creates an artificial spectral feature that is both broad and elevated which could block proper interpretation of the data. Destruction of spectral peaks and over-smoothing represent critical risks when applying deep learning models to Raman spectral data, as they negatively affect land use mapping output quality.

Figure 5: Zoomed-in comparison of spectral denoising methods in the 1550–1650 cm−1 range, highlighting their performance in preserving peak features relevant to LULC classification
The implementation of Autoencoders generates artificial spectral distortions although traditional denoising methods successfully preserve essential spectral characteristics, affecting their use in land use classification tasks. A bar chart visualises the Signal-to-Noise Ratio (SNR) results from four spectral denoising methods, including Savitzky-Golay (SG), Wavelet, Moving Average (MA), and Autoencoder (AE), applied to the original Raman spectra.
The Signal-to-Noise Ratio serves as a vital metric for estimating spectral quality, as it affects the accuracy of remote sensing data classification. The Wavelet-based denoising method achieves a maximum signal-to-noise ratio of 27.5 decibels, confirming its ability to optimise spectral clarity through effective feature preservation. The SNR increases substantially after applying SG and MA filters for noise reduction, which demonstrates their ability to effectively suppress background noise relative to the original raw data (~23–24 dB).
The autoencoder achieves a 22 dB SNR improvement compared to the unprocessed signal, but it fails to surpass traditional processing methods because it introduces hidden artefacts to the data. The effectiveness of traditional filtering techniques is validated through these results, while also proving the necessity of proper model adjustment for deep learning methods in Raman spectral enhancement processes used for land-use mapping.
The efficacy of denoising methods was demonstrated by their ability to preserve the critical spectral peaks necessary for differentiating classes of LULC, specifically vegetation and soil. Most importantly, the region (2800–3000 cm−1) and the region (1550–1650 cm−1) are particularly valuable for distinguishing organic components in vegetation and soil via Savitzky-Golay (SG) filtering. These peaks have been preserved with negligible consequences while maintaining spectral quality and reducing noise. On the other hand, wavelet denoising resulted in an SNR value of 27.5 dB; however, this came at the detriment of a slight blurring of sharp spectral features, which may affect classification accuracy. Although the autoencoder method resulted in a small improvement in SNR, it produced synthetic peaks and distortions that hampered the accuracy of classification. As a rule, noise reduction enhanced the discrimination of relevant spectral features important for LULC mapping, while SG filtering proved to be outstanding in balancing noise reduction against peak maintenance (Fig. 6).

Figure 6: Signal-to-noise ratio (SNR) comparison for original and denoised Raman spectra in the context of machine learning-assisted denoising for land use mapping
The intensity values at prominent peaks from Raman spectra appear in this boxplot at various levels of denoising method application. Fig. 7 presents data from four methods on its x-axis, which include “Original” (raw data), “SG” (Savitzky-Golay filter), “Wavelet” (wavelet transform), and “MA” (Moving Average). The intensity measurements are shown on the y-axis through arbitrary units (A.U.). The boxplots display the distribution patterns of intensity values, with the median marked by orange lines and the interquartile range shown by boxes, and outlier data points indicated by circles. The length of the whiskers reaches 1.5 times the distance between the first and third quartiles. The visualisation offers direct insight into the impact of each denoising technique on spectral intensity values at key features. The heatmap visualises the relationship between various denoising techniques and the original Raman spectrum. As part of the y-axis the author lists four spectrum denoising approaches through “Intensity (A.U.)_AE” which aligns with an Autoencoder alongside “Intensity (A.U.)_MA” for Moving Average and “Intensity (A.U.)_SG” indicating Savitzky-Golay filtering with “Intensity (A.U.)_Wavelet” representing Wavelet transformations. The horizontal axis shows the correlation value of the data points. The image displays the correlation strength against the background colour, where blue represents weak relationships and red signifies strong relationships between the denoised and original spectra.

Figure 7: Comparison of intensity at prominent peaks in Raman spectra denoised using different methods
Each bar contains specific correlation coefficients that represent the numerical data for each method. The original spectral data retention strength increases when correlation values rise in the denoised spectrum Fig. 8. Different denoising techniques applied to Raman spectra are evaluated through a scatter plot depression. The x-axis, marked by the rhythm of decibels (dB), represents Signal-to-Noise Ratio (SNR) values, which reflect the denoised signal quality. Higher numbers indicate lower noise levels. The y-axis indicates the Pearson Correlation Coefficient, which assesses the linear correlation between the denoised spectrum and its original version, on a scale where higher values denote better preservation of spectral features. The legend indicates that the five data points represent the original data, followed by the results of the Savitzky-Golay filter, the Wavelet transform, the Moving Average, and the Autoencoder. The graphical display helps users perform a simultaneous analysis of noise reduction capabilities (SNR) vs spectral protection (correlation) achieved by each denoising process Fig. 9.

Figure 8: Correlation of Raman spectra denoised using different methods with the original, unprocessed spectrum

Figure 9: Comparative analysis of denoising methods based on signal-to-noise ratio (SNR) and Pearson correlation coefficient with the original Raman spectrum
When choosing a denoising approach, the optimal criteria consist of achieving the maximum SNR and the maximum Pearson Correlation Coefficient. An illustration in Fig. 10 presents Raman spectra which underwent different denoising procedures. The Raman shift, which extends from 0 to 4000 cm−1 on the x-axis, corresponds to the intensity, which appears as arbitrary units (A.U.) on the y-axis. The blue line represents the original Raman spectrum, characterised by distinct peaks from molecular vibrations, while being heavily affected by high-frequency noise that conceals faint spectral characteristics. Multiple spectrum denoising approaches were applied to the original spectrum, and their solutions are presented for evaluation. The Savitzky-Golay filter was applied to the spectrum, resulting in the shape shown by the orange line (SG).

Figure 10: Comparison of an original Raman spectrum with its denoised versions obtained using Savitzky-Golay (SG), wavelet, and moving average (MA) filtering techniques
The spectrum denoised through wavelet transforms displays its results on the green line while this method breaks the signal into various frequency bands to choose components dominated by noise. The denoising method reveals artefacts that emerge, especially near the peaks with narrow peaks. A Moving Average filter creates the red spectrum by replacing each data point with the average of its neighbouring point values. The title “Original vs. Denoised Spectrum: Intensity (A.U.)” reveals the comparison which takes place. A legend placed in the upper right segment labels every spectrum presented in the plot.
Fig. 11 illustrates how spectral denoising affects the identification phase for peaks in a specific Raman spectrum region. The spectral area spans from 500 to 1500 cm−1, using the x-axis, which corresponds to Raman shift values. The intensity values are shown on the y-axis in arbitrary units (A.U.). The blue line in the figure represents the noisy Raman spectrum. The true label in this area shows no peak existence (True: 0). The excessive noise prevents scientists from accurately observing real spectral features within the spectrum. The spectrum received two different types of denoising methods for treatment: The application of Savitzky-Golay (SG) filtering led to the spectrum that can be observed using the orange line. After the denoising treatment the predicted peak status matches the true absence value (Pred: 0). High-frequency noise becomes reduced by implementing SG filtering on the spectrum.

Figure 11: Impact of Savitzky-Golay (SG) and Wavelet denoising techniques on peak presence classification in a noisy Raman spectrum
After Wavelet denoising the spectrum appears on the green line. The predicted peak status becomes absence (Pred: 0) for this spectrum similar to the filtered spectrum through SG denoising and identical to the actual true label. The wavelet noise reduction process creates a spectrum that is smoother than what is seen in the original noisy data. The peak region exists between 980 and 1020 cm−1, as indicated by the grey dashed lines. The elimination of background noise through both denoising techniques fails to unveil a noticeable peak among the fundamental noise signals, thus confirming the absence of a peak. The plot legend displays the spectra along with their respective actual peak existence identification and forecast peak existence annotations.
Fig. 12 assesses how well the binary predictive model handles the identification of spectral peak presence and absence in Raman data before and after denoising operations. A pair of confusion matrices displayed adjacent to each other illustrates the model’s performance under separate data conditions through this visualisation. A left-hand confusion matrix named “Confusion Matrix (Noisy)” shows how the model performs after directly applying raw Raman spectra containing noise. This matrix makes True and false classifications visible, allowing for the determination of the number of correct and incorrect predictions. The assessed matrix reveals numerous instances of incorrect peak detection, as original data noise triggers model misinterpretations, leading to non-existent peak identifications. The colour intensities of this matrix array illustrate the frequency of prediction occurrences across different blue shades for each category. The matrix aligns with the first design, which visualises the changes in predictive capability resulting from denoising techniques. The performance levels of the model demonstrate a substantial improvement over previous outcomes. The Savitzky-Golay denoising process has eliminated all cases of false positives, demonstrating its success in combating model errors related to peak identifications. The number of true positive cases and true negative outcomes has demonstrated growth. The green-coloured spectrum in this matrix indicates an increase in elemental sample detection, which verifies that the denoising process has improved accuracy. The visual comparison of confusion matrices shows that Savitzky-Golay denoising boosts the reliability and accuracy of peak presence classification in Raman spectral data.

Figure 12: Confusion matrices of a classification model on noisy Raman spectral data (left) and data denoised using the Savitzky-Golay (SG) filter (right)
A Precision-Recall (PR) curve in Fig. 13 illustrates the relationship between precision and recall for a binary classification model at different threshold settings, as shown in the attached figure. The figure displays two precision-recall curves simultaneously to illustrate how the model performs after denoising its input Raman spectral data through the application of the Savitzky-Golay filter. The recall (sensitivity or true positive rate) serves as the main variable on the x-axis, along with precision as the y-axis variable. Precision operates as the dependent axis since it shows the ratio between accurate predictions of positive results. The precision-recall relationship of the model applied to primary Raman spectra with noise resulted in an area under the curve (AUC-PR = 0.84) as represented by the blue curve. This system demonstrates overall performance by using the Area Under the Precision-Recall Curve (AUC-PR) evaluation which reports a score of 0.84. The performance evaluation reveals optimal precision-recall relationships, as indicated by a higher AUC-PR value. The precision-recall performance of the model with Savitzky-Golay denoised Raman spectra achieves an AUC-PR value of 1.00, as indicated by the orange curve labelled “Denoised (SG) (AUC-PR = 1.00)”. The denoised data obtained through Savitzky-Golay filtering achieves a perfect AUC-PR value of 1.00 for every possible classification threshold. The denoised spectral data using the Savitzky-Golay method achieves a perfect precision-recall relationship, demonstrating a significant enhancement in classification performance due to noise reduction. The Savitzky-Golay filtering of Raman spectra enables the peak presence classification model to achieve perfect performance, as demonstrated by its AUC-PR score.

Figure 13: Precision-Recall curves comparing the performance of a binary classification model for peak presence detection using noisy Raman spectral data
According to this research conclusion, machine learning-assisted denoising of Raman spectral remote sensing data has proved its effectiveness in improving land use mapping through proper noise reduction implementations. Spectral clarity improvements resulting from the denoising process become crucial for machine learning classification models through the application of Savitzky-Golay and Wavelet filters, as well asubsequent improvements to noisy spectra [21]. Both the Savitzky-Golay and Wavelet methods effectively reduced high-frequency noise in spectral data; however, the Wavelet method produced artefacts that affected sharp spectral features under certain conditions [22].
The performance of classification accuracy was measured directly by using confusion matrices as a tool. The peak detection process of the model, applied to the original noisy measurements, produced numerous incorrect spectral identifications, which resulted from noise interfering with the analysis [23]. Savitzky-Golay denoising yielded an exceptional classification outcome by effectively eliminating false detections, thereby establishing an extremely precise ability for peak detection [24]. Analysis of Precision-Recall curves using Savitzky-Golay denoised spectral data produced a perfect AUC-PR value of 1.00 compared to the 0.84 obtained with noisy data. Among the two denoising methods, the Savitzky-Golay filter demonstrated superior performance in optimising peak detection algorithms for these specific experimental measurements [25].
The normalisation transformation serves to maintain LULC classification amplitude relationships, as it follows Raman preprocessing methods. The rescaling operation maintains the spectral signal’s dynamic range and preserves contrast, working on both spectral signals and noise components after denoising [26,27]. A systematic approach, starting with synthetic noise generation and standard filtering activities, proceeds to deep learning methods and concludes with Raman-inspired normalisation techniques to maintain land-identifying spectral features and achieve optimal noise reduction.
The results demonstrate that it is possible to enhance land use mapping through machine learning-assisted denoising of Raman spectral data; however, major limitations hinder its application. The study only analysed artificially noisy spectra generated under Gaussian and Poisson noise distributions. Although the noise distributions used are very close to those in real-world data, this may not fully represent the range and subtleties of noise in remote sensing applications. Remarkably, a standard convolutional autoencoder framework was employed in this study, which theoretically limits the generalizability of the results to other spectral scenarios. An important research pursuit in the future should be using real Raman-impacted remote sensing data to test and prove the models’ applicability. Besides, creating hybrid methods that combine classical filters and deep learning might provide benefits with respect to both noise suppression efficiency and preservation of spectral characteristics. It is recommended that spectral-similarity-based loss functions be incorporated into the training procedure of autoencoders to enhance the preservation of critical spectral characteristics that are crucial for achieving suitable classification.
Acknowledgement: Not applicable.
Funding Statement: The authors received no specific funding for this study.
Author Contributions: The authors confirm contribution to the paper as follows: Conceptualization, Fawad Salam Khan; methodology, Noman Hasany; software, Fawad Salam Khan; validation, Sheikh Kamran Abid, Noman Hasany and Muhammad Khurram; formal analysis, Jerome Gacu; investigation, Fawad Salam Khan; resources, Fawad Salam Khan; data curation, Fawad Salam Khan; writing—original draft preparation, Fawad Salam Khan; writing—review and editing, Cris Edward Monjardin; visualization, Fawad Salam Khan; supervision, Kevin Lawrence de Jesus; project administration, Sheikh Kamran Abid; funding acquisition, Jerome Gacu. All authors reviewed the results and approved the final version of the manuscript.
Availability of Data and Materials: Data available on request from the authors.
Ethics Approval: Not applicable.
Conflicts of Interest: The authors declare no conflicts of interest to report regarding the present study.
References
1. Pande S. Hyperspectral image analysis in single-modal and multimodal setting using deep learning techniques. arXiv:2403.01546v1. 2024. [Google Scholar]
2. Abid SK, Sulaiman N, Chan SW, Nazir U, Abid M, Han H, et al. Toward an integrated disaster management approach: how artificial intelligence can boost disaster management. Sustainability. 2021;13(22):12560. doi:10.3390/su132212560. [Google Scholar] [CrossRef]
3. Zaka MM, Samat A. Advances in remote sensing and machine learning methods for invasive plants study: a comprehensive review. Remote Sens. 2024;16(20):3781. doi:10.3390/rs16203781. [Google Scholar] [CrossRef]
4. Guerri MF, Distante C, Spagnolo P, Bougourzi F, Taleb-Ahmed A. Deep learning techniques for hyperspectral image analysis in agriculture: a review. arXiv:2304.13880. 2023. [Google Scholar]
5. Gil EM, Cheburkanov V, Yakovlev VV. Denoising Raman spectra using a single layer convolutional model trained on simulated data. J Raman Spectrosc. 2023;54(8):814–22. doi:10.1002/jrs.6559. [Google Scholar] [CrossRef]
6. Zhang X, Zhou Y, Luo J. Deep learning for processing and analysis of remote sensing big data: a technical review. Big Earth Data. 2022;6(4):527–60. doi:10.1080/20964471.2021.1964879. [Google Scholar] [CrossRef]
7. Shukla A, Kot R. An overview of hyperspectral remote sensing and its applications in various disciplines. IRA Int J Appl Sci. 2016;5(2):85. doi:10.21013/jas.v5.n2.p4. [Google Scholar] [CrossRef]
8. Arun SA, Akila AS. Land-cover classification with hyperspectral remote sensing image using CNN and spectral band selection. Remote Sens Appl Soc Environ. 2023;31(4):100986. doi:10.1016/j.rsase.2023.100986. [Google Scholar] [CrossRef]
9. Huang T, Jiao L, Bai Y, Yan J, Yang X, Liu J, et al. Deciphering the UAV-LiDAR contribution to vegetation classification using interpretable machine learning. Comput Electron Agric. 2025;235(1):110360. doi:10.1016/j.compag.2025.110360. [Google Scholar] [CrossRef]
10. Jafri MJ, Khan FS, Ahmed S, Amjad F. Patient data-driven scratch intensity classification with LSTM. In: Proceedings of the 2024 2nd International Conference on Computing and Data Analytics (ICCDA); 2024 Nov 12–13; Shinas, Oman. doi:10.1109/ICCDA64887.2024.10867368. [Google Scholar] [CrossRef]
11. Vrábel J, Képeš E, Duponchel L, Motto-Ros V, Fabre C, Connemann S, et al. Classification of challenging laser-induced breakdown spectroscopy soil sample data—EMSLIBS contest. Spectrochim Acta Part B At Spectrosc. 2020;169:105872. doi:10.1016/j.sab.2020.105872. [Google Scholar] [CrossRef]
12. Zhang X, Bai Y, Ma Y, He P, Tang Y, Lv X. Denoising of Raman spectra using a neural network based on variational mode decomposition, empirical wavelet transform, and encoder-bidirectional long short-term memory. Appl Sci. 2023;13(21):12046. doi:10.3390/app132112046. [Google Scholar] [CrossRef]
13. Gharoun H, Yazdanjoe N, Khorshidi MS, Gandomi AH. Noise-augmented Boruta: the neural network perturbation infusion with Boruta feature selection. arXiv:2309.09694. 2023. [Google Scholar]
14. Sankari Subbiah S, Kumar Paramasivan S, Arockiasamy K, Senthivel S, Thangavel M. Deep learning for wind speed forecasting using Bi-LSTM with selected features. Intell Autom Soft Comput. 2023;35(3):3829–44. doi:10.32604/iasc.2023.030480. [Google Scholar] [CrossRef]
15. Pan L, Zhang P, Daengngam C, Peng S, Chongcheawchamnan M. A review of artificial intelligence methods combined with Raman spectroscopy to identify the composition of substances. J Raman Spectrosc. 2022;53(1):6–19. doi:10.1002/jrs.6225. [Google Scholar] [CrossRef]
16. Li K, Wang F, Yang L, Liu R. Deep feature screening: feature selection for ultra high-dimensional data via deep neural networks. arXiv:2204.01682. 2022. [Google Scholar]
17. Gulyanon S, Deepaisarn S, Chokphantavee S, Chokphantavee S, Prathipasen P, Laitrakun S, et al. Denoising Raman spectra using autoencoder for improved analysis of contamination in HDD. IEEE Access. 2024;12:113661–76. doi:10.1109/access.2024.3441824. [Google Scholar] [CrossRef]
18. Boateng D. Advances in deep learning-based applications for Raman spectroscopy analysis: a mini-review of the progress and challenges. Microchem J. 2025;209:112692. doi:10.1016/j.microc.2025.112692. [Google Scholar] [CrossRef]
19. Kulkarni U, Patil S, Vikas E, Patil R, Kulkarni B, Meena SM, et al. Image denoising using autoencoders: denoising noisy images by removing noisy pixels/grains from natural images using deep learning and autoencoders techniques. In: Proceedings of the 2023 IEEE 8th International Conference for Convergence in Technology (I2CT); 2023 Apr 7–9; Lonavla, India. doi:10.1109/I2CT57861.2023.10126382. [Google Scholar] [CrossRef]
20. Shi W, Zhang M, Zhang R, Chen S, Zhan Z. Change detection based on artificial intelligence: state-of-the-art and challenges. Remote Sens. 2020;12(10):1688. doi:10.3390/rs12101688. [Google Scholar] [CrossRef]
21. Han M, Dang Y, Han J. Denoising and baseline correction methods for Raman spectroscopy based on convolutional autoencoder: a unified solution. Sensors. 2024;24(10):3161. doi:10.3390/s24103161. [Google Scholar] [PubMed] [CrossRef]
22. Yang HF, Chen YP. Hybrid deep learning and empirical mode decomposition model for time series applications. Expert Syst Appl. 2019;120(332):128–38. doi:10.1016/j.eswa.2018.11.019. [Google Scholar] [CrossRef]
23. Zeng Y, Liu ZQ, Fan XG, Wang X. Modified denoising method of Raman spectra-based deep learning for Raman semi-quantitative analysis and imaging. Microchem J. 2023;191(2):108777. doi:10.1016/j.microc.2023.108777. [Google Scholar] [CrossRef]
24. Ma L, Liu Y, Zhang X, Ye Y, Yin G, Johnson BA. Deep learning in remote sensing applications: a meta-analysis and review. ISPRS J Photogramm Remote Sens. 2019;152(4):166–77. doi:10.1016/j.isprsjprs.2019.04.015. [Google Scholar] [CrossRef]
25. Wu X, Liu M, Cao Y, Ren D, Zuo W. Unpaired learning of deep image denoising. arXiv:2008.13711. 2020. [Google Scholar]
26. Scattarella F, Diacono D, Monaco A, Amoroso N, Bellantuono L, Massaro G, et al. Deep learning approach for denoising low-SNR correlation plenoptic images. Sci Rep. 2023;13(1):19645. doi:10.1038/s41598-023-46765-x. [Google Scholar] [PubMed] [CrossRef]
27. Sanchez J. Utilizing machine learning for signal classification and noise reduction in amateur radio. arXiv:2402.17771. 2024. [Google Scholar]
Cite This Article
 Copyright © 2025 The Author(s). Published by Tech Science Press.
This work is licensed under a Creative Commons Attribution 4.0 International License , which permits unrestricted use, distribution, and reproduction in any medium, provided the original work is properly cited.
 Downloads
 Citation Tools