
 Submit a Paper
 Propose a Special lssue
 Open Access
REVIEW

Earth Observation for Comprehensive Soil Health Assessment and Monitoring
1 Department of Remote Sensing and GIS, Space Research and Technology Institute, Bulgarian Academy of Sciences, Sofia, 1113, Bulgaria
2 Department of Geography, St Cyril and St Methodius University of Veliko Tarnovo, Veliko Tarnovo, 5000, Bulgaria
* Corresponding Author: Lachezar Filchev. Email:
(This article belongs to the Special Issue: Resource and Environmental Information Modeling)
Revue Internationale de Géomatique 2025, 34, 513-533. https://doi.org/10.32604/rig.2025.064280
Received 11 February 2025; Accepted 24 June 2025; Issue published 06 August 2025
 View Full Text
 Download PDF
Abstract
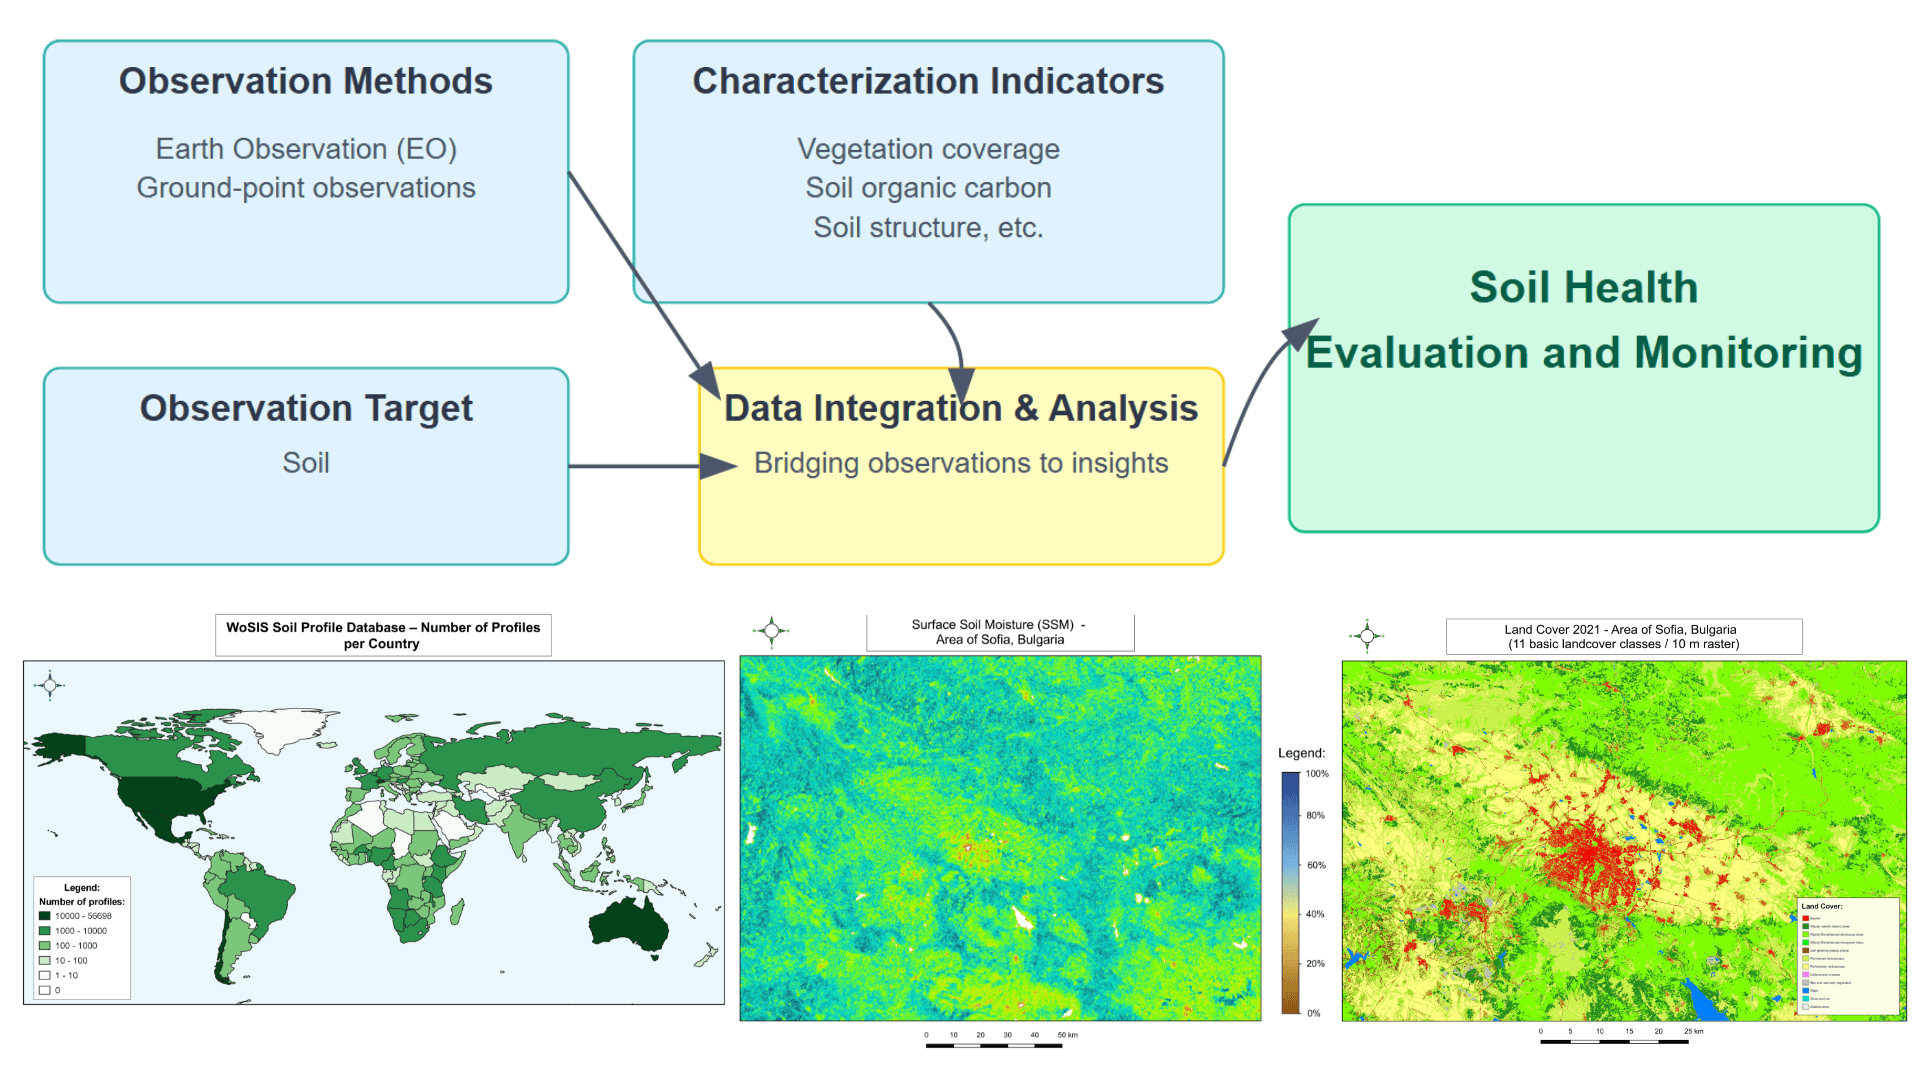
This review article provides a comprehensive analysis of Earth Observation (EO) applications for soil health assessment in Europe and abroad. The study explores the effectiveness of EO in capturing contextual information about various soil properties and conditions, as well as its role in monitoring soil health over time. The authors examine the current state of operational, semi-operational, and developing EO products and services relevant to soil health indicators. These include vegetation cover, forest cover, soil organic carbon, soil structure, landscape heterogeneity, and the presence of soil pollutants, excess nutrients, and salts. The review identifies gaps in existing knowledge and highlights potential areas for future research, such as improving spatial and temporal resolutions of EO products, developing better models for soil biodiversity assessment, and integrating EO data with ground-based measurements. The article discusses how contextual information derived from EO can contribute to sustainable soil management practices and policies in Europe. It also addresses technical challenges associated with EO applications in soil health assessment, including limitations in detecting subsurface soil properties and the need for improved data processing techniques. The authors conclude that while EO offers significant potential for soil health monitoring, further research and development are needed to fully leverage its capabilities for comprehensive and accurate soil health assessment across Europe.Graphic Abstract
Keywords
The application of conventional practices in agriculture for food production leads to a deterioration in soil quality. Also, this type of agriculture reduces the resistance of the soil and a decrease in its fertility due to the loss of organic matter and the deterioration of its physical parameters due to embodiment water erosion [1]. Improvement of soil health can be achieved through the implementation of appropriate agrotechnical measures, taking into account, in particular, the type of soil and climatic conditions of the farm. Such activities are the application of reduced soil treatments, cover crops, selection of suitable crops and varieties, etc. Application of appropriate forms of agriculture, such as organic farming, regenerative agriculture, and biodynamic farming [2–4]. In order to improve soil health, a number of sustainable practices in agriculture-related practices are envisaged, as remote sensing methods provide a very good opportunity for the assessment of the new practices applied. For this purpose, it is necessary to use up-to-date data with high temporal, resolution and spectral capacity to monitor agricultural areas and apply sustainable practices [5]. Data obtained from satellites can very successfully replace laboratory tests. This type of data is distinguished by a number of advantages, as laboratory studies are time-consuming, laborious and too expensive. It is for these reasons that more efforts need to be concentrated in this area [6]. Another advantage of using satellite data for soil health monitoring is that it provides the opportunity to monitor large areas and evaluate them while reducing the cost and effort of such monitoring [7].
The innovative contribution of this paper is its comprehensive review of Earth Observation (EO) applications for soil health assessment, emphasizing novel methodologies and data integration techniques. Unlike previous studies that primarily focus on individual soil properties or specific monitoring approaches, this paper uniquely synthesizes a broad range of EO products, spanning operational, semi-operational, and developing technologies. Furthermore, it underscores the need for enhanced spatial and temporal resolution in soil monitoring and introduces promising research directions, such as integrating EO data with in-situ soil biodiversity assessments. By systematically identifying gaps and proposing advancements, this review serves as a critical resource for policymakers, researchers, and practitioners aiming to optimize EO-based soil health monitoring frameworks.
1.1 Most Soil Properties Are Largely Sensed in the Optical Domain
The soil properties, as well as other earth objects, can be evaluated by the spectral signature of the reflected/transmitted incident solar energy. Since the soil medium is vastly non-transparent, the effective measurements in this domain of the electromagnetic spectrum are reflectance. Soil spectral signature is a distinct one, and so are the different soil types. However, despite this is strongly dependent on the soil physical-chemical properties of the soil, one of the main key players is the water content. It’s widely changing quantities and conditions in time make the comparability of soil samples a difficult, if not impossible, task. The present-day satellite systems that carry on-board hyperspectral sensors that can help provide the spectral signatures of the topsoil are just a few and not yet operational, such as EO-1/Hyperion, CHRIS-PROBA, DESIS, PRISMA, etc., to name but a few. The airborne analogs that have existed since the late 1970s are by no means comparable to their satellite counterparts in terms of coverage. Even after a successful operationalisation of space hyperspectral instruments, the images will be hindered by various environmental phenomena and obstacles such as vegetation, clouds, snow, dust and haze, litter (after harvesting), etc. These further complicate the complex task of deriving soil properties from the EO hyperspectral measurements. The radar measurements of soil moisture and salinity are due to the fact that each object has a dielectric constant and reacts differently to the microwave radiation beamed from the radar. It is a more robust method to derive information despite solar illumination or meteorological conditions. Yet, the radar signal is affected by the atmospheric condition.
1.2 Remote Sensing (EO) Problems Are Ill-Posed
In remote sensing, the problems are typically ill-posed as there is not enough data to result in unique solutions. Therefore, we need additional information to solve the problem. It is natural to consider measurements as random variables [8]. Most of the time, in order to assess a certain parameter, we need to invert a model to receive the desired result. This is related to the fact remote sensing measurements are typically non-direct ones.
1.3 Spatial, Temporal and Radiometric Resolution
The temporal resolution of the EO data issue is more or less pronounced for the EO data before the Sentinel’s era of Copernicus. Since 2014, the EO optical data, which most of the soil indicators are derived from, are supplied by Sentinel-2 data with 3 to 5 days temporal resolution (revisit time) [9]. That means that each area in the EU is imaged once every 3 to 5 days, depending on the latitude. Concerning the temporal resolution of the components of the future soil monitoring system, their temporal resolution is sufficient. Furthermore, the Copernicus Sentinels-1 and -2 have a history of the past 5 years, which can already be used for developing change indicators.
Although not yet for systemic monitoring, the hyperspectral/imaging spectrometer solutions are now available. They can provide even more spectral details about the soil. The two European missions include DESIS (URL: https://www.dlr.de/content/en/articles/news/2018/4/20181002_first-processed-images-desis.html, accessed on 22 May 2025) and EnMap (URL: https://www.enmap.org/mission, accessed on 22 May 2025). Such novel instruments will further help to improve the mapping of objects and processes together with the information from the Copernicus Sentinel (EuroGEO LC AG).
Due to the fact that radiometric resolution, which is the ability of the sensor to discern different grey-scale values and is measured in bits, is different from an EO platform, to an EO platform we might have different assessments of the parameter in question. This issue is, to an extent, resolved by the normalisation of data, typically introducing various indices. However, the level of detail cannot be compensated by the radiometry normalisation nor indices.
The Copernicus data is free to use but disseminated through various channels and user groups [10]. The main entry to the Sentinel and contributing missions’ data is the Copernicus Space Component Data Access portal (URL: https://spacedata.copernicus.eu/, accessed on 22 May 2025). Additional layers of functionality, apart from the Sentinel archives, are provided to the end-user through 5 Data and Information Access Services (DIAS) using different pricing schemes for each DIAS (URL: https://www.copernicus.eu/en/access-data/dias, accessed on 22 May 2025). Horizon Europe projects are eligible to use Copernicus data and services for free. The Copernicus has a wide range of sensors to be chosen from, which operate as a contributing mission to the programme. Most of this data is free for the EC institutions but can have a certain quota limitation due to agreement specifics. It is expected that a need for renewal of negotiations with data providers will emerge once the new monitoring demands for EO data are negotiated.
Remote sensing data is not used in a straightforward manner to resolve a particular issue—rather, the way we use data is changing according to the scientific question or problem we have to solve. Soil health indicators make no exception, as each of them should be approached individually through a more or less complicated methodology or modeling.
The primary aim of this review is to comprehensively analyze and synthesize existing research on the application of Earth Observation (EO) for obtaining contextual information pertinent to soil health in Europe. This includes evaluating the effectiveness of various EO techniques in assessing different soil properties and conditions, understanding the role of EO in monitoring soil health over time, and identifying gaps in current knowledge and potential areas for future research. The review will also seek to understand how this contextual information can contribute to sustainable soil management practices and policies in Europe. Ultimately, the goal is to provide a holistic understanding of the state of the art in this field and offer insights that can guide future research and practice.
The study is based on a literature review from articles available at Scopus, Web of Science, and Google Scholar, see Fig. 1. This work is partially based on the work performed during the Call for Evidence (CoE) issued by the Working Group (WG4) of Mission Board Soil Health and Food. It was collected at the best possible effort—a list of all contacted parties in the CoE is in the Acknowledgement section.
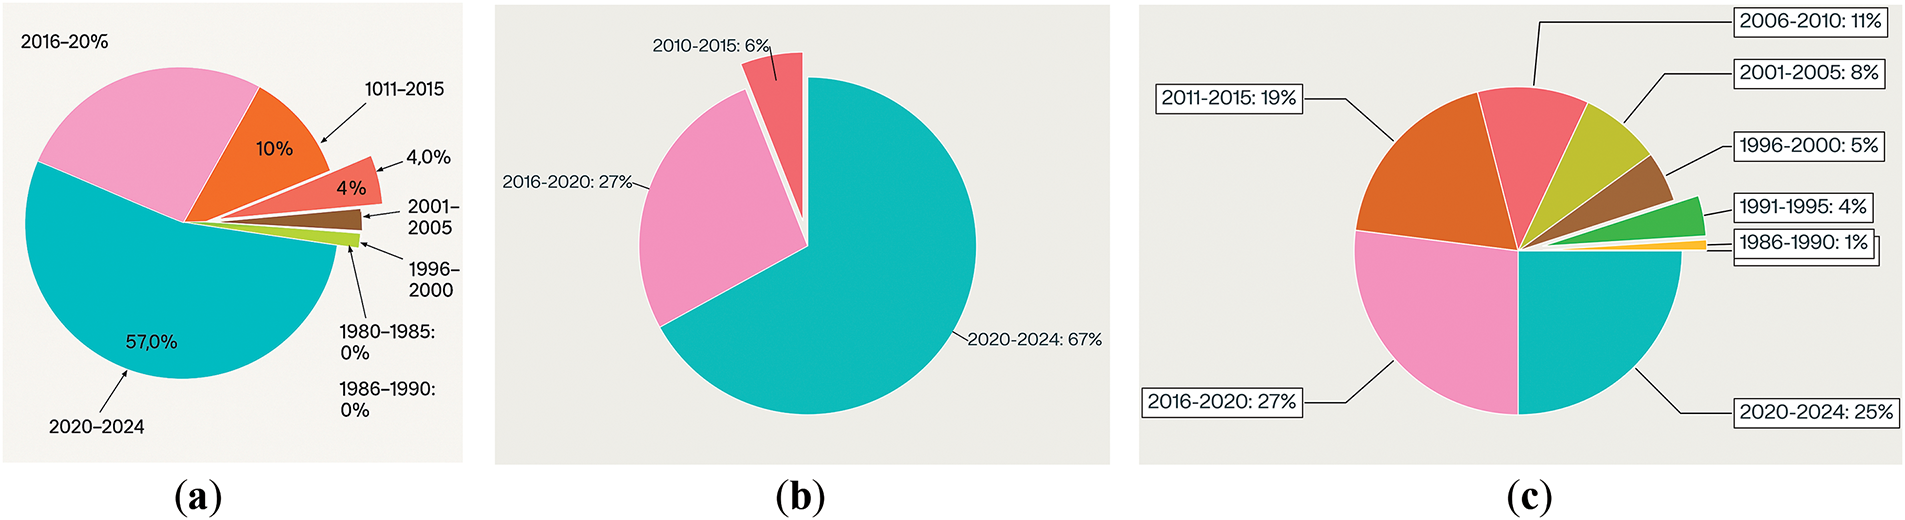
Figure 1: Percentage of publications in different public scholarly content databases returned after a boolean query on “Soil health”, “Europe”, and “remote sensing” by pentads, i.e., 1985–1990, 1991–1995, 1996–2000, 2001–2005, 2006–2010, 2011–2015, 2016–2020, 2020–2024: (a) Google Scholar; (b) Scopus; (c) Web of Science
The input summarized has been identifying what is already available and operational, semi-operational and under development, as well as the Risks and Scale of using EO for monitoring each of the eight soil health indicators [11]. The outline of the present review reflects these in the following sections.
There is a close relationship between vegetation cover and soil degradation. It is for this reason that changes in vegetation are widely used in assessing soil status and soil health [12,13]. Vegetation surveys through EO data, in addition to showing us changes in land cover, show us the time a given land cover type occupies a certain space with which the risk of soil degradation can be assessed [14]. Satellite EO is ideal for the monitoring of vegetation cover from local to global scales. Copernicus Sentinels-1, -2, and -3 are the current state-of-the-art systems to deliver a variety of products and services that can identify vegetative cover types as well as changes in vegetation due to a number of processes (EuroGEO LC AG).
Some of the available products already in the Global component of Copernicus are: Copernicus Global Land Service Burnt Area (300 m), FAPAR (300 m), FCOVER (300 m), Leaf Area Index (300 m), Land Cover (100 m), NDVI (300 m), etc. Some third-party, i.e., non-EU products, are produced on an annual basis by ESA Climate Change Initiative (CCI, https://climate.esa.int/, accessed on 22 May 2025), NASA MODIS Land Cover, https://modis.gsfc.nasa.gov/data/dataprod/mod12.php (accessed on 22 May 2025) and semi-operational high-res LC (various sources—S2GLC of ESA—http://s2glc.cbk.waw.pl, accessed on 22 May 2025). The ESA WorldCover 10 m 2021 V200 product consists of 2651 tiles, each a 3 × 3 degree Cloud Optimized GeoTIFF (COG) in EPSG:4326 projection. These tiles are grouped into 60 × 60 degree tiles and contain two layers: a land cover map with 11 classes, totaling approximately 120 GB, see Fig. 2 [15].
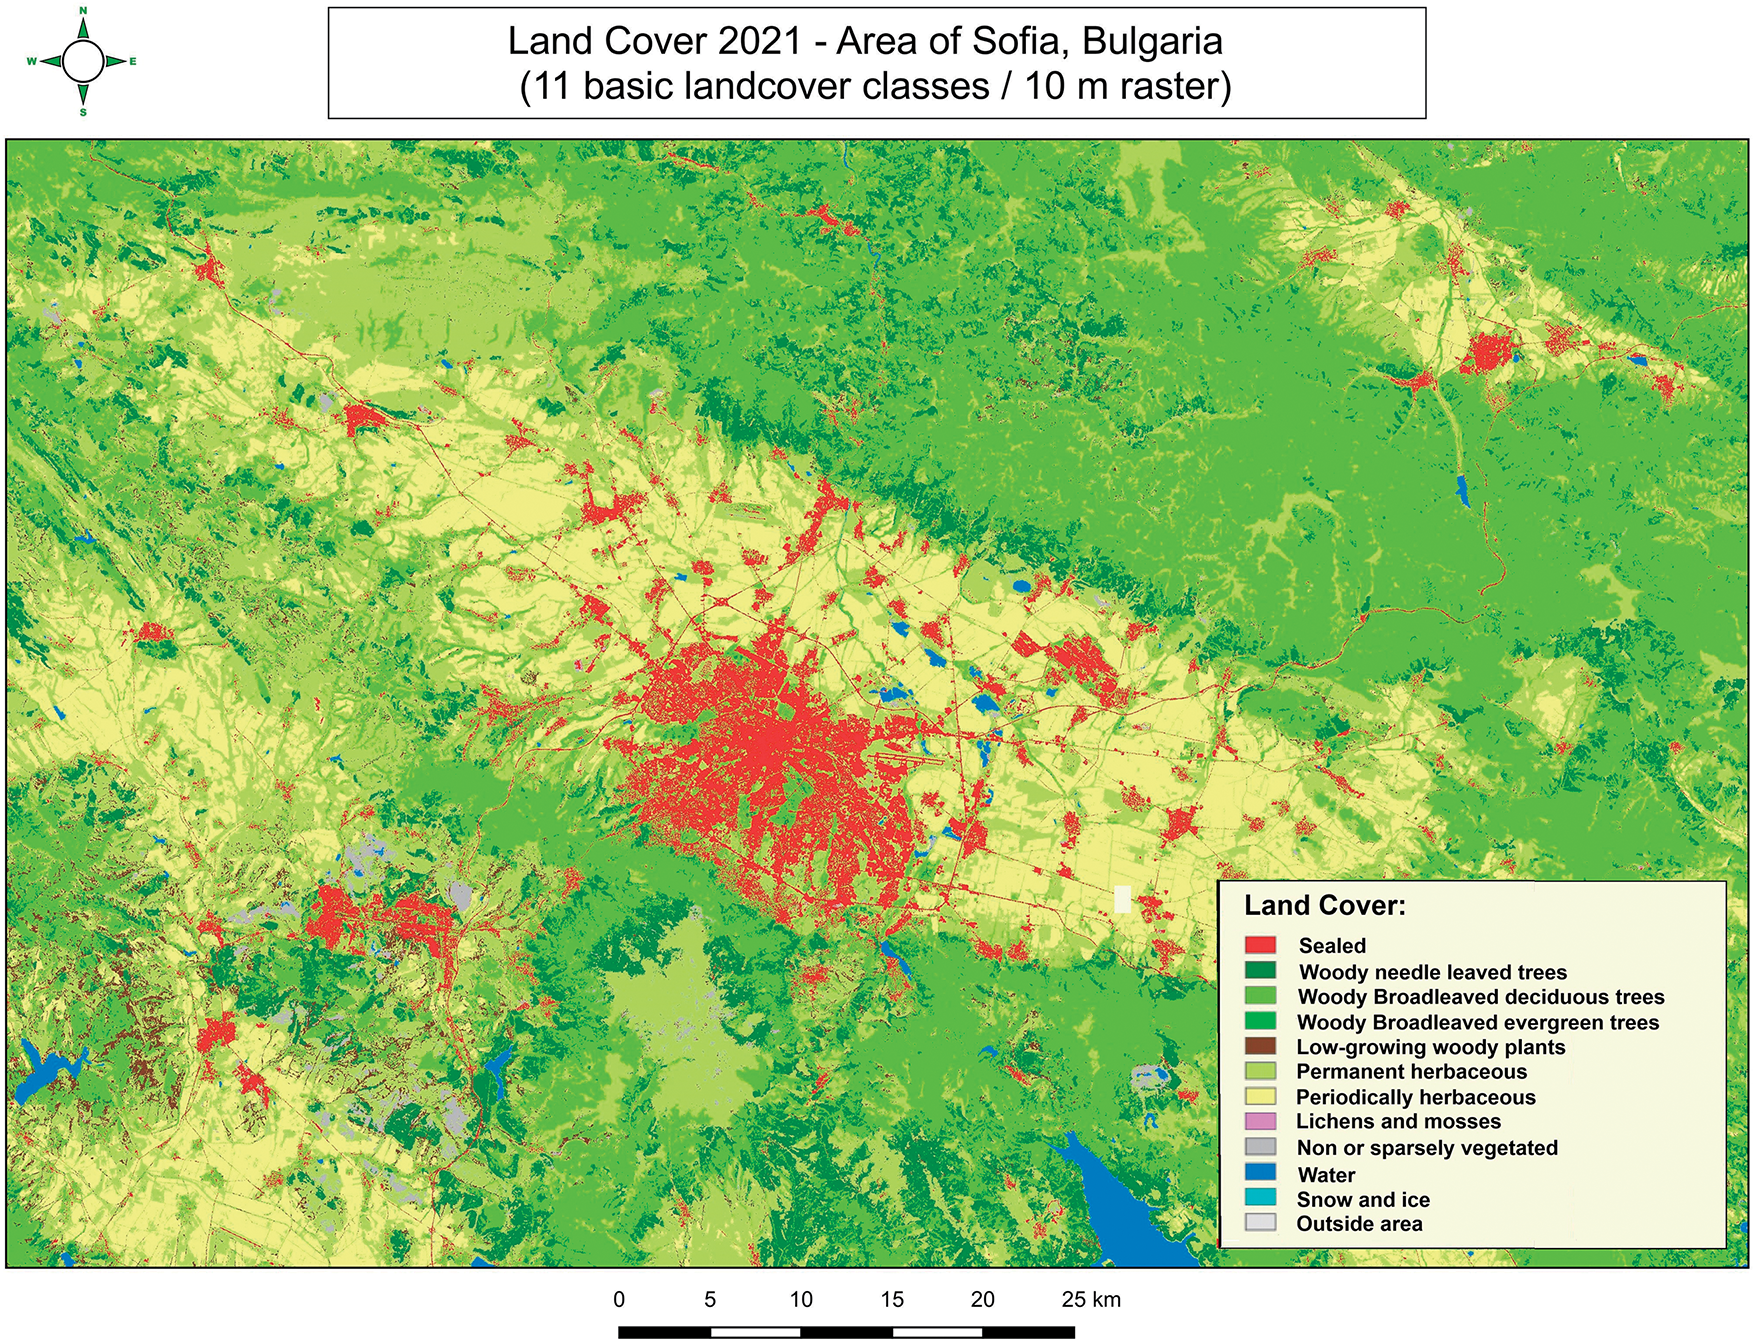
Figure 2: Land cover 2021—Sofia-Bulgaria. Source: https://worldcover2021.esa.int/download (accessed on 22 May 2025)
Reflectance composites, which capture bare soil pixels from multispectral image data, are increasingly analyzed to model soil constituents, such as soil organic carbon. These temporal composites are preferred over single-date multispectral images to account for the frequent vegetation cover of soils, thereby achieving wider spatial coverage of bare soil pixels. This study introduces a novel HIstogram SEparation Threshold (HISET) methodology that derives spectral index thresholds and tests them on a Sentinel-2 time-series data stack. This technique is spectral index-independent, data-driven, and can be evaluated based on a quality score. HISET was tested for constructing six soil reflectance composites (SRC) using NDVI, NBR2, and a new index that combines the NDVI and a short-wave infrared (SWIR) band (PV+IR2). A thorough analysis of the spectral and spatial performance and accuracy of the resulting SRCs demonstrates the flexibility and validity of HISET. The NBR2-based SRC spectra exhibited the highest similarity with LUCAS spectra, the widest spatial coverage of bare soil pixels, and the fewest number of valid observations per pixel. The spatial coverage of bare soil pixels is validated against the database of the Integrated Administration and Control System (IACS) of the European Commission. Validation results indicate that PV+IR2-based SRCs outperform the other two indices, particularly in spectrally mixed areas of bare soil, photosynthetic-active vegetation, and NPV. The NDVI-based SRCs displayed the lowest confidence values (95%) across all bands [16].
3.1.2 SoilGridsTM—Digital Soil Mapping System
It is a system that provides soil information around the world based on computer-aided soil mapping. For this purpose, global data for 230,000 soil profiles are used. The data were collected from the global soil database of the World Soil Information Service (WoSIS). This number of data collected provides a good level of soil profile information with which global models can be calibrated. In addition, different ecological layers were used in the data for which they were collected using satellite Earth observation. The data are processed using machine learning, mapping soil properties worldwide. The product provides soil profile information at six depths and reaches up to 200 cm with a spatial resolution of 250 m, see Fig. 3. Maps are accessible for the subsequent soil attributes: pH level, content of soil organic carbon, bulk density, content of coarse fragments, sand content, silt content, clay content, cation exchange capacity (CEC), and total nitrogen, in addition to the density and stock of soil organic carbon. In terms of soil profile data, Europe and North America are distinguished by the greatest density. As far as soil properties are concerned, the data vary essentially with biogeographical region and depth. Another feature is that data were collected with greater density for agricultural regions. The main gaps are related to places that are difficult to access and are geographically distant. The time range in which most data was collected was between 1960–2020.
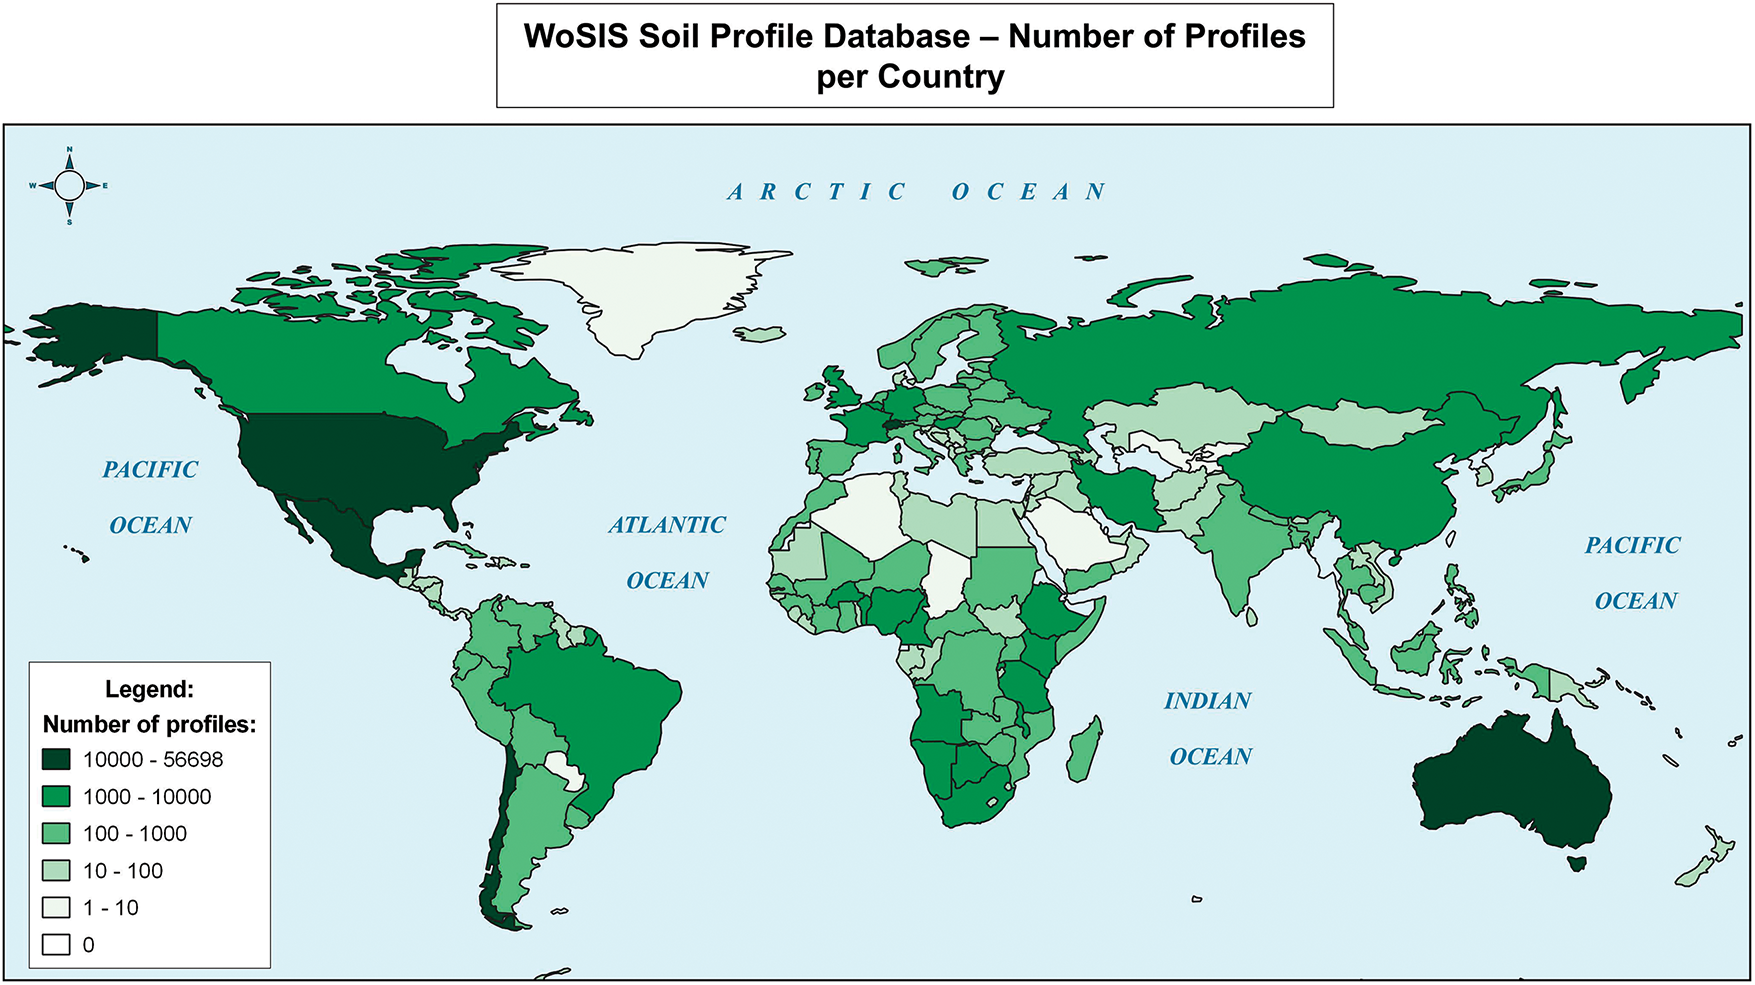
Figure 3: WoSIS profile database—number of profiles per country
There are a number of agricultural practices that have a very good effect on the structure of the soil and, hence, on its health. Some of these practices, such as forestry and agroforestry, also have additional effects, which are expressed in increasing organic matter and carbon sequestration, which leads to climate mitigation, which, on the other hand, contributes to the reduction of the carbon footprint associated with food cultivation activities. In this regard, the integration of different precision farming technologies, such as EO, to better control agricultural processes and support decision-making, as well as assess their impact on soil health, is essential [17]. With the help of spectral images obtained from satellite platforms, some soil properties can be determined using statistical analysis. This type of data can improve erodibility by helping to map soil chemical properties [13]. Optical images with the wavelength of visible (VIS), near-infrared (NIR) and shortwave infrared (SWIR) find great application in soil research. They allow a lot of data to be extracted about the soil, including its structure [18].
Another semi-operational product provided by the Copernicus Land Monitoring Service—High-Resolution Layers is the Imperviousness product with 100 m spatial resolution, last updated in 2015 (EC CLMS; EEA). The data from the JRC Global Human Settlement layer Sentinel-2 10 m resolution, last update 2018, can also be used as a proxy for soil sealing. JRC European Settlement Map based on Copernicus Very High-Resolution optical coverage for the reference year 2015 (VHR_IMAGE_2015), which consists of images from Pleiades, Deimos-02, WorldView-2, WorldView-3, GeoEye-01 and Spot 6/7 2–10 m resolution, Last update 2015, see Fig. 4.
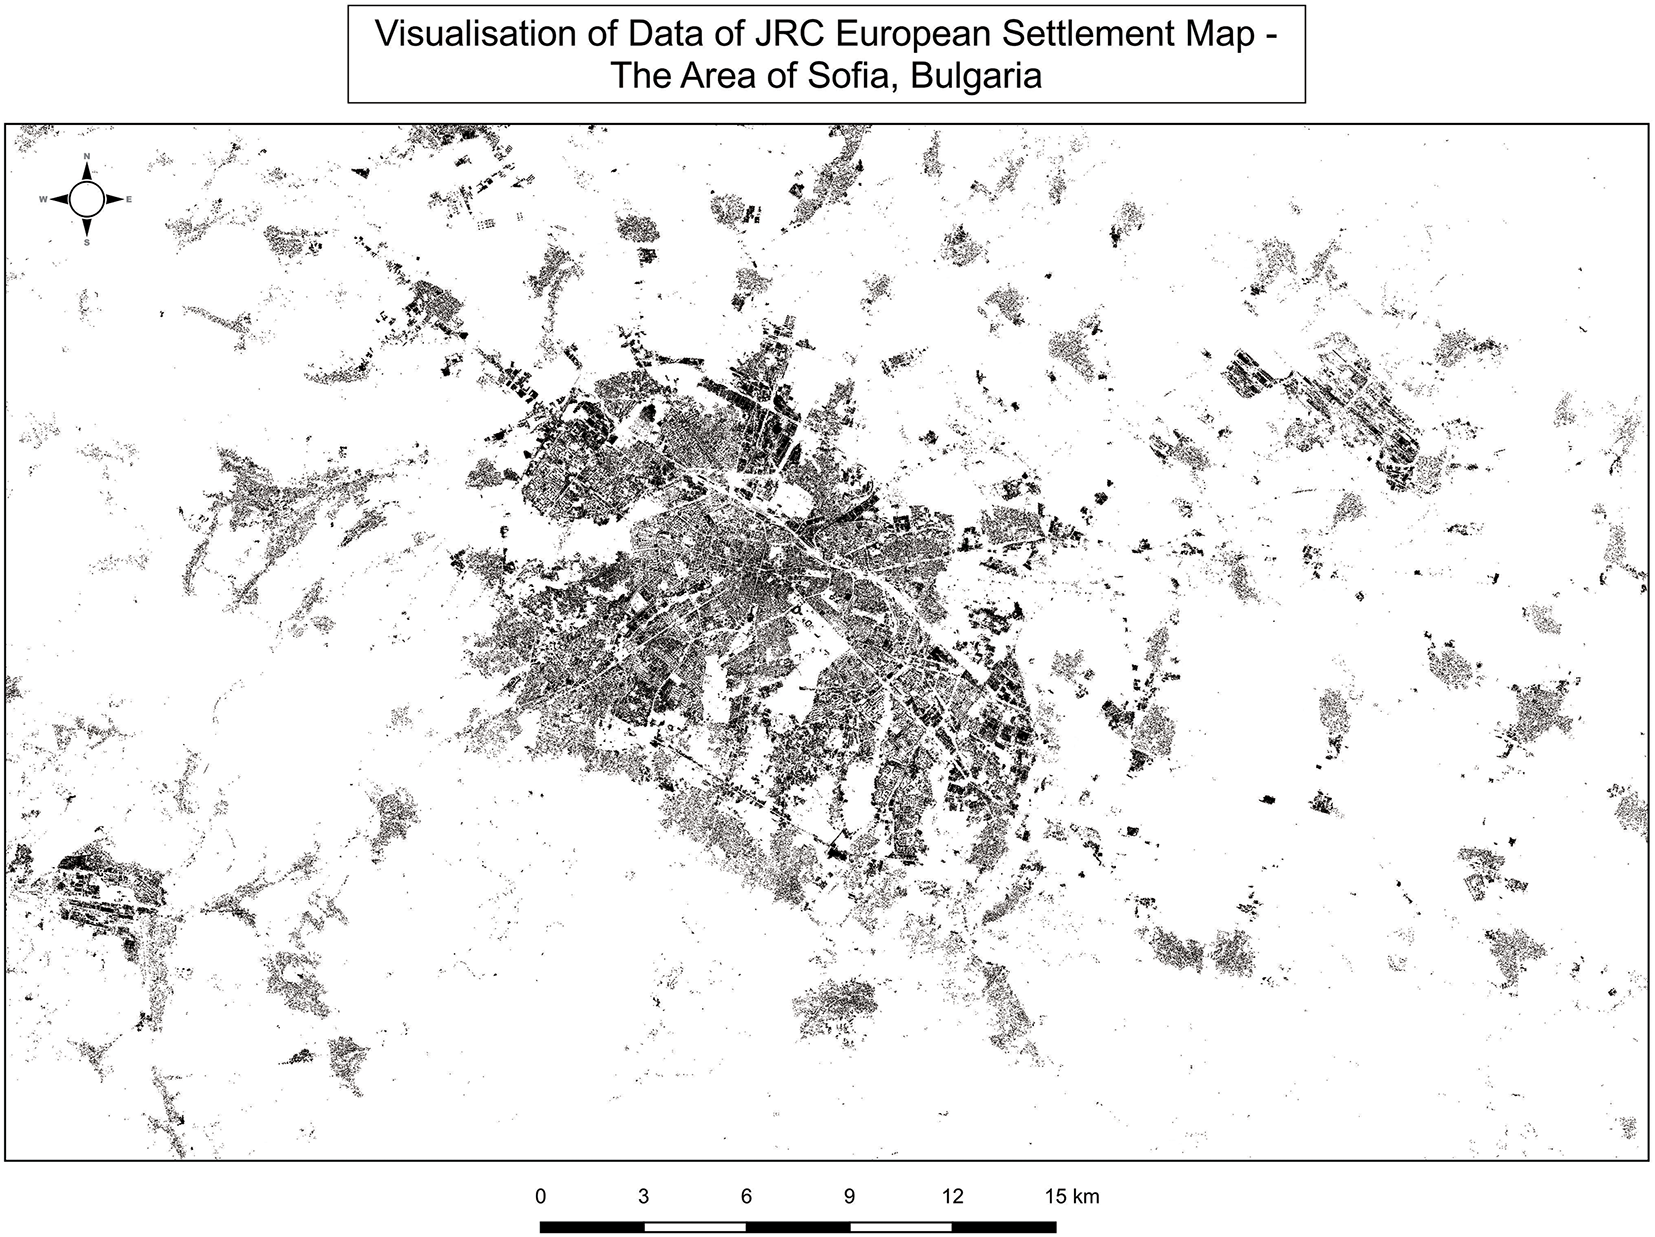
Figure 4: Visualization of JRC European settlement land map, Sofia-Bulgaria
The soil erosion is assessed through various physical, empirical, or, recently, AI models. In EU, a soil erosion model G2 developed for the monthly production of soil erosion maps at the regional scale was introduced by a team from Aristotle University of Thessaloniki and DG JRC within GEOLAND 2 project is included in JRC, see Fig. 5 [19]. The G2 model proposes innovative techniques for the estimation of vegetation and protection factors. It is a complete, empirical model for soil erosion rates and has evolved with time into a quantitative model mapping soil loss and sediment yield on month-time intervals, designed to run in a GIS environment. A detailed description in [20] is presented where the model adopts fundamental equations from RUSLE and the Erosion Potential Method (EPM). It aimed to develop an equation to estimate water erosion and to put up a service for regional soil erosion monitoring across Europe [21–24]. The G2 model was tested with the use of satellite data in a few regions of Europe, such as Cyprus and Greece [22,23], Poland [25], and Italy [26].
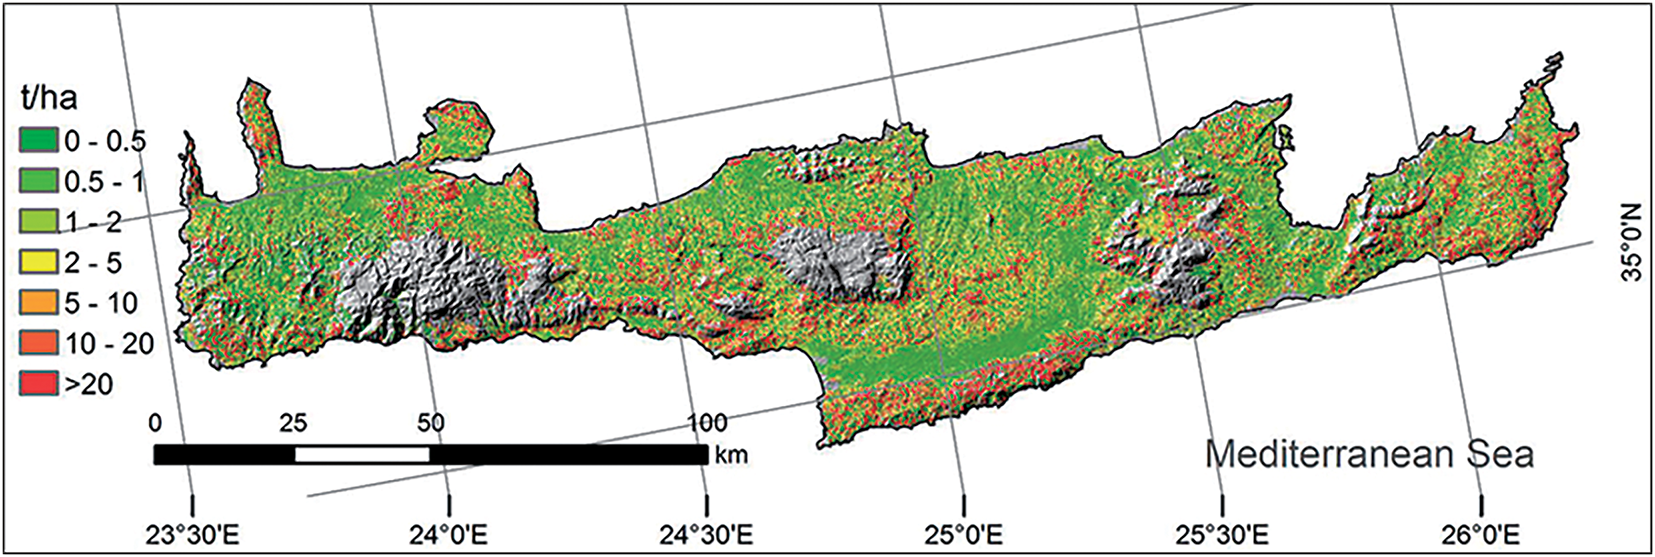
Figure 5: G2 model—Crete Island, Greece, The annual erosion map (t ha–1) derived from monthly erosion outputs. Source: https://esdac.jrc.ec.europa.eu/themes/g2-model (accessed on 22 May 2025)
Very similar to landscape heterogeneity, Earth observations can be used to determine a number of forest-specific characteristics. Forests can be monitored seasonally for changes, and there are a number of sub-domains that can be used to determine ground properties from the species and potentially from the spectral signature if particular chemicals are being ingested by the plant. For example, geobotanical prospecting involves analysing plants and vegetation for trace chemicals coming up from the soil. Some of these can be observed/measured through remote sensing techniques (EuroGEO LC AG). The monitoring of forest areas is successfully carried out in the combination of forest change data, combined with EO data and using an algorithm to fill gaps. The methodology has been found to be suitable for monitoring the structure of forests in Europe, and it is suitable to be applied to areas where forest taxation data are missing [26]. EO data is used to establish the exact mechanism for carbon sequestration by forest ecosystems and how this affects climate change. The compilation of annual forest growth maps based on tree-ring width (TRW) brings great progress in this area [27]. EO provides data related to forest characteristics based on its specific spectral signature, which has the potential to improve the accuracy of TRW-based forest growth models [28]. EO has emerged as a leading technology in the scientific field while showing great opportunities to cover the operational needs of forest administrations managing forests in Europe [29]. The main reason for this is that EO, in combination with Geographic Information Systems (GIS), provides easy access to forest area data in Europe at minimal financial cost, while the method saves time [30].
There are already semi-operational products, with a three-year gap in production, distributed by the Copernicus Land Monitoring Services: Forest Cover Hi-Res layers of CLMS—Tree Cover Density (2012, 2015, and 2018), see Fig. 6. Third-party Forest Cover products are also available—Global Forest Cover Change Tree Cover Multi-Year Global 30 m V003 (1999–2015), see Fig. 7 [31]; Global PALSAR-2/PALSAR/JERS-1 Mosaic and Forest/Non-Forest map (PALSAR 2007–2018, JERS-1 SAR 1993–1998) (JAXA, https://www.eorc.jaxa.jp/ALOS/en/palsar_fnf/fnf_index.htm, accessed on 22 May 2025). Changes in humid tropical forests are provided by DG-JRC, https://forobs.jrc.ec.europa.eu/TMF/ (accessed on 22 May 2025). The same approach can be applied to Europe. Annual Land Cover mapping at 100 m is provided by the CLMS of Copernicus through: (https://land.copernicus.eu/global/content/annual-100m-global-land-cover-maps-available, accessed on 22 May 2025).
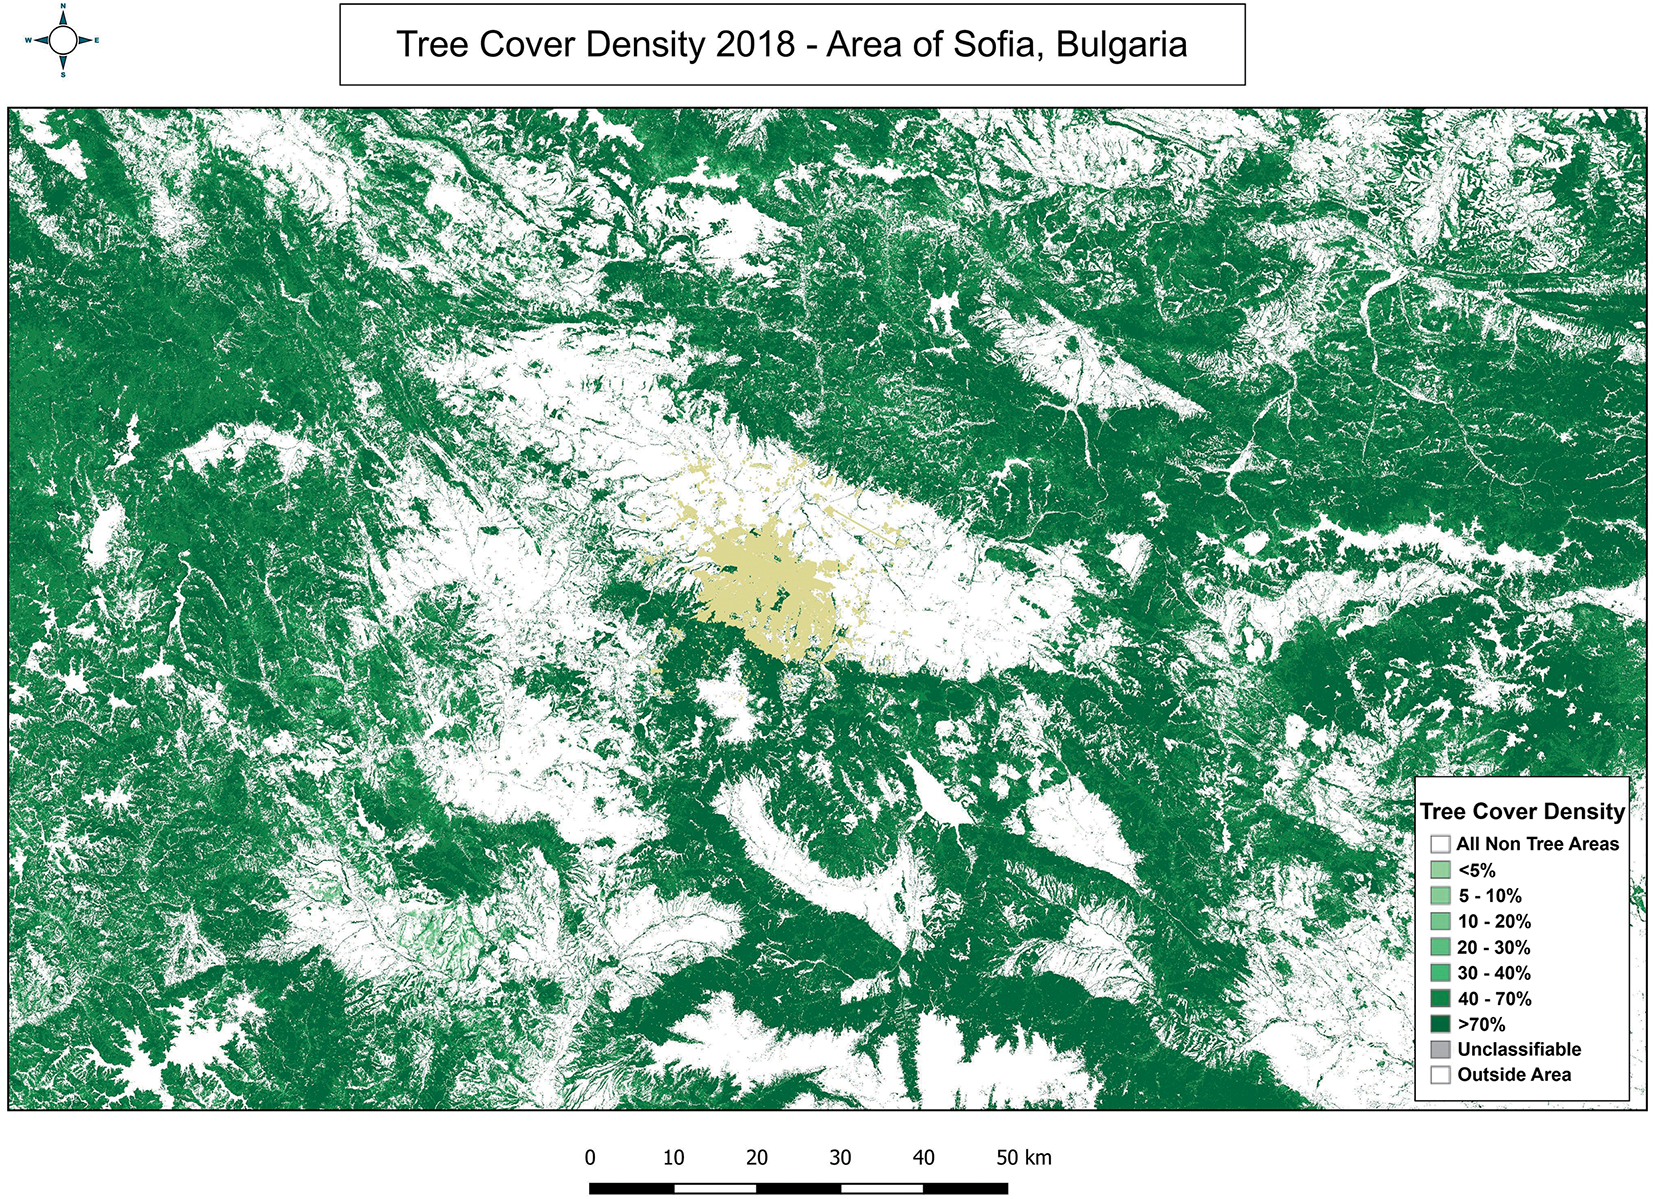
Figure 6: Tree cover density 2018—Sofia, Bulgaria. Image courtesy Forest Cover Hi-Res layers by the CLMS (accessed on 22 May 2025)
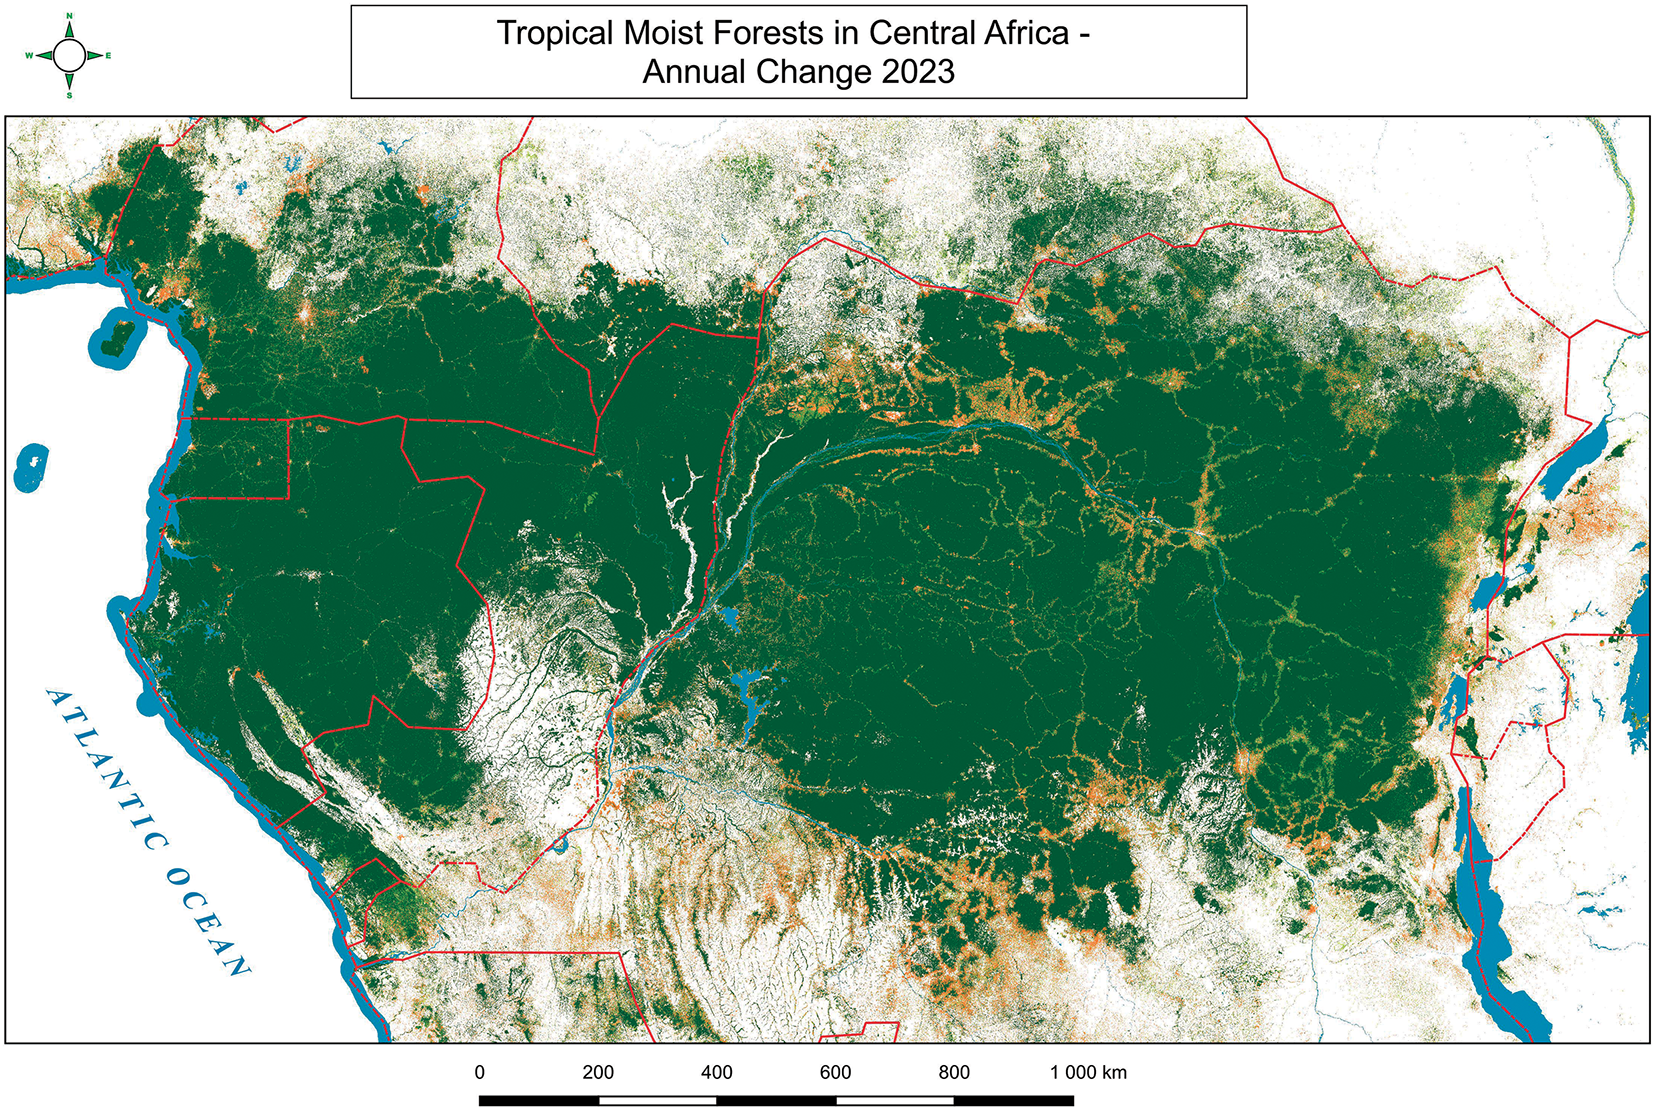
Figure 7: Tropical moist forest in Central Africa—Annual change 2023
The advent of free satellite data with a better spatial resolution allowed the mapping of soils and compiling an assessment of changes in them (Richer-de-Forges et al., 2023). The use of this type of data in combination with GIS helps to establish the efficiency of soil organic carbon capture in various forms of soil cultivation in the Mediterranean regions of Spain, France and Italy [32].
Semi-operational examples include but are not limited to Continuous forest cover, cover crops, tillage and mowing/harvesting events and detection of markers for compliancy check of Ecological Focus Areas (EFA) practices according to the Common Agriculture Policy (CAP)—Sen4CAP pilot countries (http://esa-sen4cap.org/, accessed on 22 May 2025). With regard to forest management practices, the Global Forest Watch platform (https://www.globalforestwatch.org/, accessed on 22 May 2025), developed by the World Resources Institute (WRI), is an attempt to address the issues with deforestation, i.e., mostly illegal clear-cuts. This platform’s purpose is to serve mainly as a tool that enables non-profits and policy-makers, as well as citizens, through an open-science model to monitor the forest cover changes through the Dashboard.
3.3 EO Soil Indicators under Development
3.3.1 Presence of Soil Pollutants, Excess Nutrients and Salts
European Soil Database Derived data contains processed and modelled data up to 2013 (2001, 2006, 2013) [33]. European Soil Database v2 Raster Library is INSPIRE compliant and contains raster (grid) data files with cell sizes of both 1 km × 1 km and 10 km × 10 km for a large number of soil-related parameters. The 10 km × 10 km rasters are in the public domain access and allow expert users to use the data, for instance, to run soil, water and air-related models, whereas the 1 km × 1 km rasters are available after a prior registration [33]. The Geological Surveys in Europe maintain extensive information about the properties of rocks and derived material close to the surface, including soils. The first version of EGDI serves as a map of soil regions in Europe on a scale of 1:5M (EUSR5000). The mission of the Soil Resources—Superficial Deposits Task Force under EuroGeoSurveys is to compile and harmonise data about the surface-close parent material for soil development and other process such as ground water production, which will be included in EGDI in the future [34].
Soil pollutants—DG JRC (EC) is currently assessing the Soil contamination mainly through LUCAS—https://esdac.jrc.ec.europa.eu/themes/soil-contamination (accessed on 22 May 2025). LUCAS is one of the main remote sensing in-situ components of Coperncius programme [35]. However, it takes some time (for some datasets it accounts for few years) after the database is published for the results to be modelled and published. Satellite data is yet to be more readily utilised in these assessments. An EU-wide review on the soil pollutants based on LUCAS data is published by [36]. The JRC has conducted several assessments on the presence of heavy metals in EU topsoils. These include Zinc, Cadmium and Mercury assessment in EU Topsoils. The JRC made available the first pan-European high-resolution datasets and analyzed the reasons for the distribution [37].
EU Soil Observatory: The EUSO dashboard, developed and maintained by the JRC’s soil team (JRC.D3), supports the policy case for an EU Soil Health Law and the EU Soil Strategy for 2030 by providing evidence about the extent of soil degradation in the EU [33].
The EGDI site also hosts the results from the Geochemical Mapping of Agricultural and Grazing Land Soil (GEMAS) project by EuroGeoSurveys one product of which is the map of the Arsenic distribution in Europe (http://www.europe-geology.eu/geochemistry/geochemistry-map/arsenic-distribution/, accessed on 22 May 2025). However, as the project name suggests, the coverage of this map is only in agricultural areas.
Soil Salinity—In areas that suffer from drought, salinization of soils is the most common process of soil degradation. This is because evaporation exceeds the amount of rainfall, which is why dissolved salts accumulate, thus affecting the properties of the soil and its fertility, respectively, on crop yields [38]. An excess of soluble salts in the soil horizon was found to negatively affect soil structure and yields [39]. For this reason, their mapping is of great importance in order to be able to apply sustainable practices in the management of these territories. EO appears to be a better method for mapping and monitoring these territories compared to laboratory methods, as it is a faster and more informative method [38]. EO provides a good opportunity for timely monitoring and accurate mapping of salinization processes, especially in regions where climate aridification leads to major changes [40]. The use of EO data in the visible and near-infrared (VIS-NIR) range enables us to make spectroscopic analysis of large areas and to assess their salinization rate [41]. Maps of Soil Chemical properties at European scale 2009/2012 topsoil data and Soil pH in Europe (2009) are also based on LUCAS assessments (DG-JRC, ESDAC). A study on Saline and Sodic Soils in the European Union was performed and published in 2008 (DG-JRC, EC) [42].
Excess Nutrients—Some semi-operational national pilots, such as the measure of excess, nutrients—N-excess are available to the farmers and policy-makers through the Belgium EO agricultural system (http://belcam.info/, accessed on 22 May 2025). Another more complex example is the Compilation of Global Soil Microbial Biomass Carbon, Nitrogen, and Phosphorus Data’ (1977–2012) which is available in NASA EarthData Search and distributed by ORNL DAAC [43]. The data were compiled from a comprehensive survey of publications from the late 1970s to 2012 and included 3422 data points from 315 papers. Although similar to the DG-JRC ESDAC assessments, these modeled results, despite geospatial, do not yet harness the potential of EO data.
Part of Copernicus Land Monitoring Service (CLMS) is the European Ground Motion Service—recently in development as part of Copernicus 2.0 (URL: https://land.copernicus.eu/pan-european/european-ground-motion-service, accessed on 22 May 2025). The service provides mainly ground deformation products based on Sentinel-1 radar data. The set of products was defined after a wider consultation with 13 member states representatives, and the results are placed in a white paper Document (URL: https://land.copernicus.eu/user-corner/technical-library/egms-white-paper, accessed on 22 May 2025). They are targeted towards the subsidence of the ground with regard to monitoring the critical infrastructure and residential areas affected. However, the Ground motion service can serve as a proxy to assess the soil structure in places where this data is scarce or missing. According to the CLMS website, the EGMS production phase was kicked-off in January 2021.
Globally, a product on Copernicus Soil Moisture Index & Surface Soil Moisture (both 1 km) are available through CLMS, see Fig. 8. Some indicators, i.e., 2015 data based on LUCAS (such as Clay (%), Sand (%), Silt (%), Coarse Fragments (%), Bulk Density, Available Water Capacity, and USDA Texture), are already available.
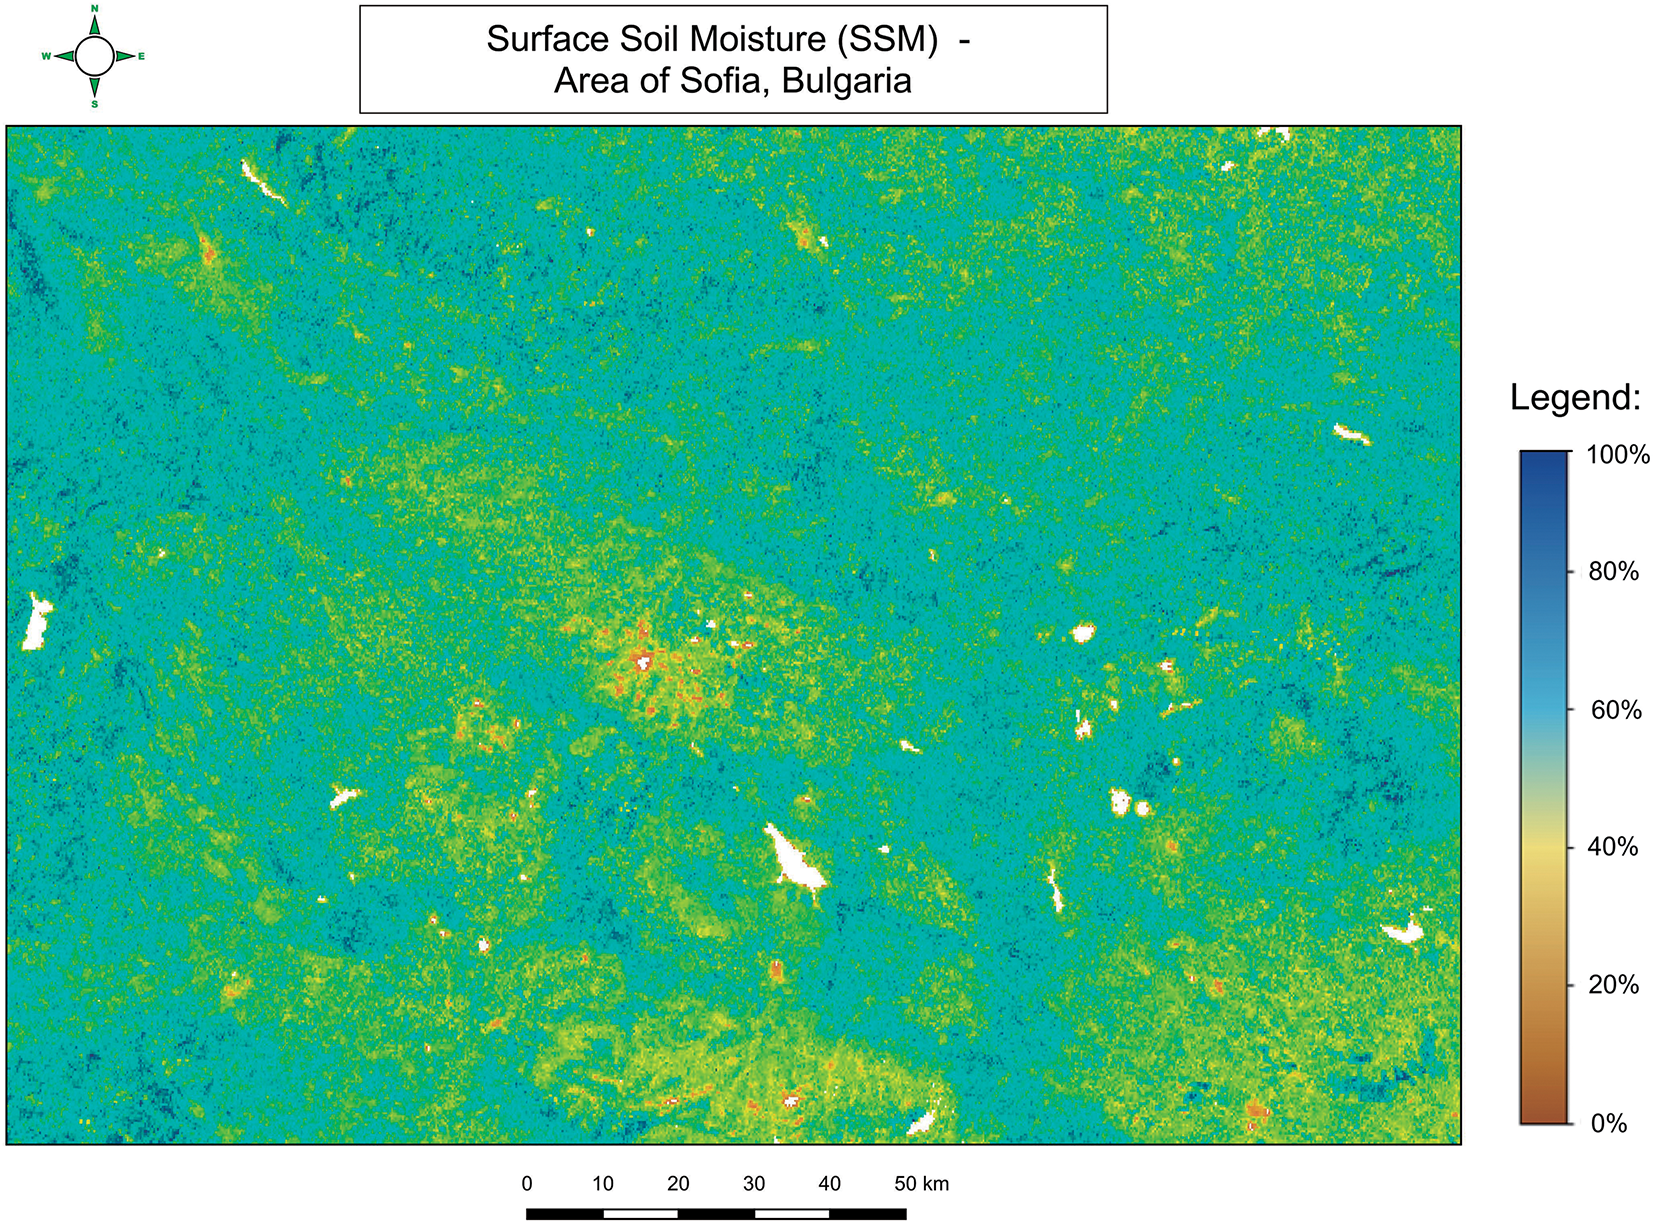
Figure 8: Surface soil moisture (SSM)—Sofia, Bulgaria
Zhang et al. [44] explore the use of Spire Global’s GNSS-R (Global Navigation Satellite System Reflectometry) signals captured by LEO satellites for soil moisture assessment. The study highlights the potential of GNSS reflections to provide continuous soil moisture data at a global scale. Shi et al. [45] enhance soil moisture estimations by integrating ESA CCI and SMAP satellite data using a conditional variational autoencoder (CVAE) model. This approach significantly improves soil moisture predictions, particularly in areas with limited ground-based measurements. Pinnepalli et al. [46] introduce the TIRAMISU project, which combines thermal infrared observations from LEO satellites with ground measurements to analyze soil background effects and improve soil health assessments.
A third-party product such as Global Soil Texture and Derived Water-Holding Capacities 1950–1996 is distributed by ORNL DAAC [47]. Soil Organic Carbon (SOC) stock—SOC serves as an indicator of soil degradation from there and of its health, which is widely used for monitoring in arable areas. EO provides very good data on a basis on which to establish uncovered areas, making it possible to quantify SOC content [48]. The images we receive on Sentinel-2 provide us with an exceptional opportunity to establish and map SOC, and if multi-date images are included in the mapping, this will enable us to map not only the spatial but the temporal variability of SOC, see Fig. 9 [49].
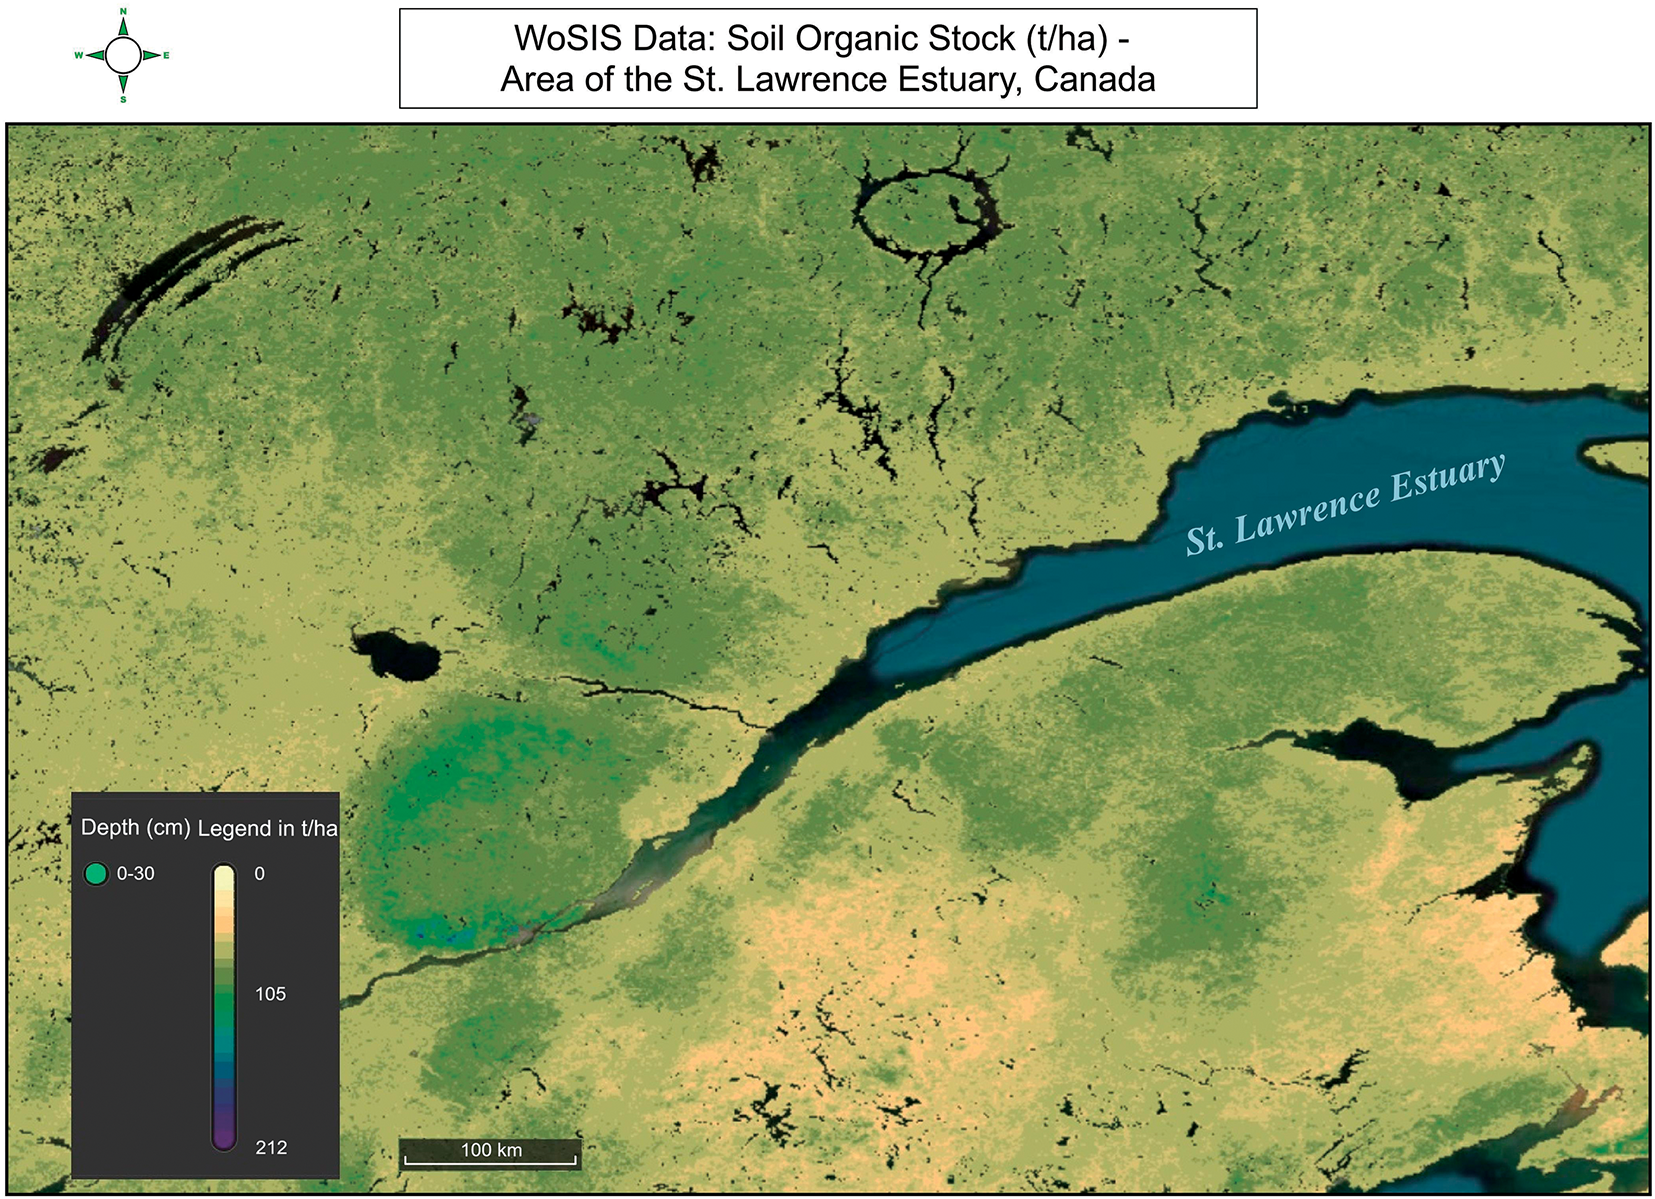
Figure 9: Soil organic stock (t/ha) in the topsoil horizon (0–30 cm), source WoSIS data
Recently, an ESA project, WorldSoils, “Monitoring global topsoil using space-borne EO data” (URL: https://www.world-soils.com/, accessed on 22 May 2025), was completed. Some of its findings and prototype products are expected to contribute to the soil health indicators assessment, such as SOC, through EO data.
Soil Organic Carbon Mapping Using LUCAS Topsoil Database and Sentinel-2 Data concept and methodology was developed as part of the PROSOIL project “The evaluation of forthcoming satellites for mapping topsoil organic carbon in croplands” funded by the Belgian Federal Science Policy Office (BELSPO) and published by [50]. The study was published in a special issue of Remote Sensing entitled ‘High Spectral Resolution SOC Dynamics’. The approach is promising, yet to be applied to the entire EU continent. Other non-EU assessments of the SOC are available through ORNL DAAC, such as Global Organic Soil Carbon and Nitrogen 1940–1986 [51] based on 3500 profiles; Compilation of Global Soil Microbial Biomass Carbon, Nitrogen, and Phosphorus Data and Arctic Circumpolar Distribution and Soil Carbon of Thermokarst Landscapes, 2015 (NASA EarthData Search). Although non-EO SOC estimates, these are serving as a basis to make use of EO data based on covariates.
EO is by far the best solution for landscape heterogeneity because the system is capable of acquiring imagery at a variety of scales and producing products at a variety of extents. Most often, it is the users that define the requirements for assessing ‘heterogeneity’ and, together with the remote sensing experts, can define which landscape elements are the most important. EO-based data products and information for such studies are available globally, and there are many different products available to choose from. Furthermore, the global data can go back as far as 50 years (EuroGEO LC AG). EU agricultural lands based on Sentinel-1 (S1) data were produced lately by a team of Joint Research Centre DG-JRC, European Commission (EC). The EU Crop Map combines Copernicus Sentinel-1 satellite observations and in-situ LUCAS 2018 Copernicus data using machine learning and cloud computing. The EU crop map covers 91 million hectares of cropland and consists of more than 9 billion 10-m pixels. The map is based on Eurostat LUCAS in-situ data and Sentinel-1 (S1) Synthetic Aperture Radar (SAR) observations, see Fig. 10 [52].
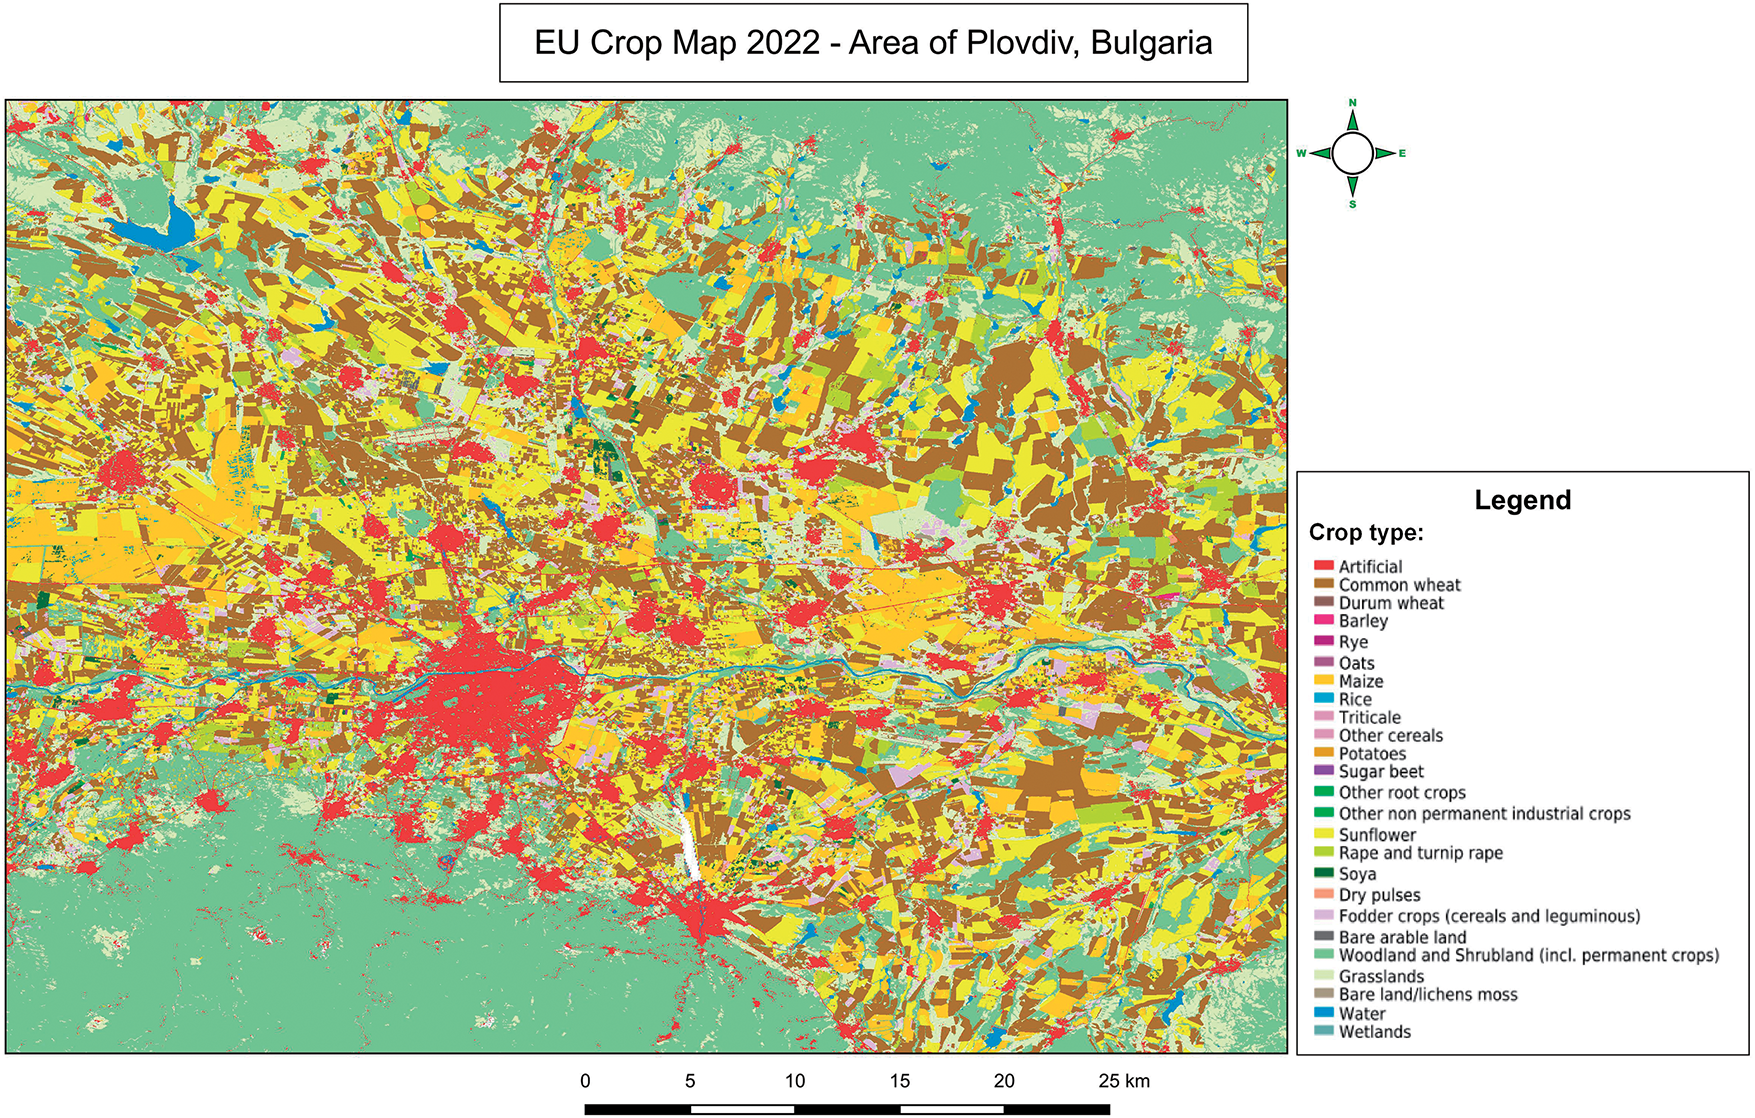
Figure 10: EU crop map 2022—Area of Plovdiv, Bulgaria
Their pattern and heterogeneity can then be assessed through landscape metrics for which software packages, such as FRAGSTATS [53], are freely available to the EO community.
The compilation of maps of the main vegetation for a region based on satellite image data is crucial in the management of areas at risk [54]. EO data from which we can derive the spectral feature for a given territory helps us to establish the degree of heterogeneity in landscapes. Furthermore, this type of data has proven to be superior for these tasks compared to classified land cover data [55]. Another advantage of this type of data is obtaining information about landscapes in remote and hard-to-reach regions [56]. They provide us with a very good opportunity to quickly assess the degree of heterogeneity of landscapes and their diversity in areas of different scales. Which enables us to quickly and effectively implement appropriate conservation methods [57]. EO data help to assess the heterogeneity of forest landscapes and how it has contributed to addressing drought in Central Europe and what is related to attacks on them by bark beetles. Landscapes of spruce forests located on flat terrain where the soil is wetter are found to be less stable than those located on slopes with high slopes and soils with low humidity [58]. Apart from establishing the heterogeneity of landscapes, EO data help us to calculate the degree of competition between different landscape types: agrarian, urbanised and natural. This actually allows us to assess the degree of sustainable use of the territory, as well as the degree of anthropogenization. This will allow countries wishing to have sustainable development in a rapid and effective way to monitor the governance processes of their territory [59].
3.4 Issues Limiting EO Potential for Other Indicators
Plant production depends on many management activities, such as agriculture and forestry. We came to realise that the sustainable management of our lands is the only way for sustainable growth through the prism of global challenges such as climate change, global pandemic which disrupts the agricultural production chain and supply, and population and urbanisation growth to name but a few. However, the management activities themselves cannot directly affect the EO implementation as it naturally adapts itself according to the demands. The change in management practices from business as usual to sustainable, however, will be challenging and will require new approaches, one of which is the wider implementation of EO data into the assessments and monitoring of soil health resulting from those changes.
One of the main issues with EO, underlined by many, is that EO platforms only “see” the surface of soil (a few microns for visible/IR, 3–10 cm for microwave, but it depends on the soil texture, vegetation cover and moisture). This is further complicated by the fact that satellite systems are limited by the meteorological factors further exacerbated by the atmospheric aerosol conditions (haze, dust, etc.). These issues have been tackled by the EO community since the onset of satellite remote sensing with a great deal of improvement. However, they will be ever persistent due to the nature of EO.
The soil-biodiversity research is yet to be performed globally. However, a need for EU-wide baseline assessment as well as monitoring should be developed in order to provide for assessment and monitoring of the political commitments made in the Green Deal, Farm to Fork, Soil and Biodiversity strategies. At present with regard to the soil biodiversity only the threats to soil biodiversity [60] as well as the soil microbial biomass (SMB) were attempted to be mapped in EU scale [61].
3.5 Research Requirements to Develop Better Capacity to Use EO
A more regular update, as well as improved EO detection (models), is needed to support soil health monitoring. World initiatives such as Joint Experiment for Crop Assessment and Monitoring—JECAM—http://jecam.org/ (accessed on 22 May 2025) by GEOGLAM, NASA Harvest (https://nasaharvest.org, accessed on 22 May 2025) has their own portfolio of initiatives and projects worldwide. What is common for them is that they focus mostly on agriculture. Further, efforts are needed to leverage the potential of EO data in the forestry sector and urban areas.
With regard to the Presence of soil pollutants, excess nutrients and salts, more development work is needed for expanding and operationalization of N-excess, soil pollution and salted soils. Development work is needed for soil acidity and nutrients on an operational basis, perhaps linked to crop productivity assessment. The difference between the Presence of soil pollutants, excess nutrients and salts indicator is for production systems only. SoilGrids (ISRIC) is a good starting point (would need updates in the RS products used) [62,63].
For the SOC concentration, development work is underway [64]. ESA—World Soil Project—Soil carbon concentration is an input to model soil carbon stocks together with bulk density, coarse fragments and soil thickness; additional ground truth data is welcome in time and depth (ISRIC). Similarly, for the SOC stock, further development is needed, especially to assess changes. The existing models (IPCC/UNCCD) rely on land cover as a proxy (ISRIC).
To better assess the Bulk density and soil structure, further development is needed, and ground truth data collection is needed. Further research and development are also needed for integration in erosion modelling of more climate and management data.
Likewise, development work is needed for soil biodiversity assessment/modelling—developing pilots first. This could be done through the to-be-established network of Living Labs and Lighthouse Farms during the Mission implementation.
Improvements are yet needed for the operationalization of the vegetation cover at the maximum allowed spatial and temporal resolution based on the combined use of Sentinel-2 and Landsat-8 data. In the near future, it is possible to make use of other public-private partnership schemes to develop downstream applications based on private companies’ data and infrastructure to upscale the vegetation cover product to finer spatial and temporal resolutions. This is already technically achievable but needs some development to bring it into existence. The Copernicus LMS hi-res layers on tree-cover density product should intensify its production to a yearly product as well as utilize contributing missions data more readily. This would improve the spatial resolution of the end product and/or gap-filling for areas that are obscured by clouds throughout the year. North latitudes typically have an issue with temporal coverage of the satellite data, so this combined approach would potentially reap its benefits.
Management activities to improve soil health for early reporting: they need more development but need to be defined/specified for each land-use category. The approaches to derive EO-based products vary greatly on a case-by-case basis due to the nature of the practices themselves and the indirect nature of EO estimations.
Five Most Important Take-Aways on Remote Sensing for Soil Health Assessment in Europe.
Remote sensing is transforming soil health assessment in Europe, but its full potential will only be realized through continued technological innovation, harmonization of data and methods, investment in on-board AI, and targeted capacity building across the soil management community. The key moments and developments in recent soil health monitoring and assessment systems with the aid of remote sensing can be summarized to the following take-away:
• Remote Sensing Greatly Enhances Soil Health Monitoring but Faces Key Technical Barriers
Remote sensing, particularly through Earth Observation (EO) technologies, offers a non-invasive, efficient, and scalable method for assessing soil health across Europe. It enables monitoring of critical surface characteristics such as vegetation cover, soil moisture, salinity, and organic carbon, supporting applications from precision agriculture to climate resilience. However, significant challenges remain, especially in accurately measuring subsurface soil properties, dealing with cloud cover, and harmonizing satellite data with ground-based measurements.
• Integration of Advanced Sensors and Data Processing Broadens Applications
Modern EO systems employ a range of sensors-radar, multispectral, hyperspectral, LiDAR, and microwave-combined with advanced data processing (including machine learning and deep learning). This integration allows for detailed mapping of soil properties, early detection of degradation, and improved prediction of soil health trends, supporting sustainable land management and policy decisions.
• On-Board AI Processing Is Emerging but Not Yet Widespread
Recent advancements are shifting some data analysis from ground stations to on-board satellite AI processing. This development reduces data latency, optimizes bandwidth, and enables near-real-time decision-making for soil health management. However, most current EO applications still rely heavily on ground-based processing due to computational and energy constraints on satellites. Further investment in on-board, soil-specific AI systems is needed to fully realize the benefits of real-time monitoring.
• Upscaling and Harmonisation Are Critical for Policy and Practice
EO data is instrumental in upscaling field-scale soil measurements to create national and European maps of soil health indicators. Nevertheless, integrating satellite-derived data with national soil monitoring programs and ensuring consistency across different regions and user groups remain significant hurdles. Addressing these requires improved training for end-users, harmonized data standards, and stronger collaboration between scientists, policymakers, and land managers.
• Ongoing Research and Capacity Building are Essential for Wider Adoption
To overcome technical, operational, and knowledge barriers, ongoing research is focusing on improving spatial and temporal resolution, developing better proxies for soil properties, and advancing multi-sensor data fusion. Simultaneously, there is an urgent need to build capacity among policymakers and practitioners through training and awareness initiatives, ensuring that EO technologies can be effectively used to guide sustainable soil management and achieve EU soil health targets.
Acknowledgement: The following respondents partake the Call for Evidence (CoE) issued by the Working Group 4 of the Mission Board “Soil Health and Food”: ISRIC—International Soil Reference and Information Centre, EuroGEO Land-Cover Action Group Partner List (Space Research Center, Polish Academy of Sciences = CBK (http://cbkpan.pl/en/, http://zoz.cbk.waw.pl/en/), International Institute for Applied Systems Analysis = IIASA (https://iiasa.ac.at/), Deimos Elecnor Group = Deimos (https://elecnor-deimos.com/), EOXPLORE = EOX (http://www.eoxplore.com/), Institute of Agrophysics Polish Academy of Sciences = IA_PAS (https://www.ipan.lublin.pl/en/), Bundesamt für Kartographie und Geodäsie = BKG (https://www.bkg.bund.de/DE/Home/home.html), TerraNIS = (http://www.terranis.fr)). The authors are acknowledged and appreciated to all the active members of Working Group 4 for the Mission Board “Soil Health and Food” who participated in the CoE, namely: Bridget Emmett, Arwyn Jones, and Annette Schneegans.
Funding Statement: The authors received no specific funding for this study.
Author Contributions: Conceptualization, Lachezar Filchev; methodology, Lachezar Filchev; software, Lachezar Filchev and Milen Chanev; investigation, Lachezar Filchev, Galin Petrov and Milen Chanev; resources, Lachezar Filchev; data curation, Lachezar Filchev, Galin Petrov and Milen Chanev; writing—original draft preparation, Lachezar Filchev; writing—review and editing, Lachezar Filchev and Milen Chanev; visualization, Milen Chanev and Galin Petrov; supervision, Lachezar Filchev. All authors reviewed the results and approved the final version of the manuscript.
Availability of Data and Materials: Data available on request from the authors.
Ethics Approval: Not applicable.
Conflicts of Interest: The authors declare no conflicts of interest to report regarding the present study.
Abbreviations
| CLMS | Copernicus Land Monitoring Service |
| CEC | Cation Exchange Capacity |
| DIAS | Data and Information Access Services |
| EGMS | European Ground Motion Service |
| EO | Earth Observation |
| ESDAC | European Soil Data Centre |
| EUSO | EU Soil Observatory |
| FAPAR | Fraction of Absorbed Photosynthetically Active Radiation |
| FCOVER | Fraction of Vegetation Cover |
| GEMAS | Geochemical Mapping of Agricultural and Grazing land Soil |
| GIS | Geographic Information Systems |
| HISET | Histogram Separation Threshold |
| IACS | Integrated Administration and Control System |
| LAI | Leaf Area Index |
| LUCAS | Land Use/Cover Area frame Survey |
| NDVI | Normalized Difference Vegetation Index |
| NIR | Near-Infrared |
| SAR | Synthetic Aperture Radar |
| SOC | Soil Organic Carbon |
| SRC | Soil Reflectance Composite |
| SWIR | Short-Wave Infrared |
| TRW | Tree-Ring Width |
| WoSIS | World Soil Information Service |
References
1. Cárceles Rodríguez B, Durán-Zuazo VH, Soriano Rodríguez M, García-Tejero IF, Gálvez Ruiz B, Cuadros Tavira S. Conservation agriculture as a sustainable system for soil health: a review. Soil Syst. 2022;6(4):87. doi:10.3390/soilsystems6040087. [Google Scholar] [CrossRef]
2. Chanev M. Problems and perspectives in organic cultivation of cereals-overview. Ecol Eng Environ Prot. 2021;2(2021):66–75. doi:10.32006/eeep.2021.2.6675. [Google Scholar] [CrossRef]
3. Khangura R, Ferris D, Wagg C, Bowyer J. Regenerative agriculture—a literature review on the practices and mechanisms used to improve soil health. Sustainability. 2023;15(3):2338. doi:10.3390/su15032338. [Google Scholar] [CrossRef]
4. Wijesinghe J, Botheju SM, Nallaperuma B, Kanuwana N. Organic farming: the influence on soil health. In: One health: human, animal, and environment triad. Hoboken, NJ, USA: John Wiley & Sons, Inc.; 2023. p. 185–97. doi:10.1002/9781119867333.ch14. [Google Scholar] [CrossRef]
5. Das S, Panday D. Soil health assessment and spatial characterization using remote sensing. In: Remote sensing of soils. Amsterdam, The Netherlands: Elsevier; 2024. p. 455–67. doi:10.1016/b978-0-443-18773-5.00034-x. [Google Scholar] [CrossRef]
6. Bouma J, de Haan J, Dekkers MS. Exploring operational procedures to assess ecosystem services at farm level, including the role of soil health. Soil Syst. 2022;6(2):34. doi:10.3390/soilsystems6020034. [Google Scholar] [CrossRef]
7. Khosravi Aqdam K, Rezapour S, Asadzadeh F, Nouri A. An integrated approach for estimating soil health: incorporating digital elevation models and remote sensing of vegetation. Comput Electron Agric. 2023;210(6):107922. doi:10.1016/j.compag.2023.107922. [Google Scholar] [CrossRef]
8. Tamminen J. Inverse problems and uncertainty quantification in remote sensing. Frascati, Italy: ESA Earth Observation Summer School on Earth System Monitoring and Modelling; 2012 Jul 30–Aug 11 [cited 2024 Apr 3]. Available from: https://earth.esa.int/documents/973910/1002056/JT1.pdf. [Google Scholar]
9. Sentinel Online. Resolutions. Paris, France: ESA; 2021 [cited 2024 Apr 3]. Available from: https://sentinels.copernicus.eu/web/sentinel/user-guides/sentinel-2-msi/resolutions. [Google Scholar]
10. Ottavianelli G. Copernicus space component data access portfolio: data warehouse 2014–2022. Paris, France: ESA; 2021. 91 p. Report No.: COPE-PMAN-EOPG-TN-15-0004. [cited 2024 Apr 3]. Available from: https://spacedata.copernicus.eu/documents/20126/0/DAP+Release+phase2+V2_8.pdf. [Google Scholar]
11. Veerman C, Pinto Correia T, Bastioli C, Biro B, Bouma J, Cienciala E, et al. Caring for soil is caring for life—ensure 75% of soils are healthy by 2030 for healthy food, people, nature and climate—interim report of the mission board for soil health and food. Brussels, Belgium: European Commission, Directorate-General for Research and Innovation, EU Publications Office; 2020 [cited 2024 Apr 3]. Available from: https://data.europa.eu/doi/10.2777/918775. [Google Scholar]
12. Lizaga I, Quijano L, Gaspar L, Ramos MC, Navas A. Linking land use changes to variation in soil properties in a Mediterranean mountain agroecosystem. Catena. 2019;172(3):516–27. doi:10.1016/j.catena.2018.09.019. [Google Scholar] [CrossRef]
13. Wang J, Zhen J, Hu W, Chen S, Lizaga I, Zeraatpisheh M, et al. Remote sensing of soil degradation: progress and perspective. Int Soil Water Conserv Res. 2023;11(3):429–54. doi:10.1016/j.iswcr.2023.03.002. [Google Scholar] [CrossRef]
14. Richer-de-Forges AC, Chen Q, Baghdadi N, Chen S, Gomez C, Jacquemoud S, et al. Remote sensing data for digital soil mapping in French research—a review. Remote Sens. 2023;15(12):3070. doi:10.3390/rs15123070. [Google Scholar] [CrossRef]
15. Zanaga D, Van De Kerchove R, Daems D, De Keersmaecker W, Brockmann C, Kirches G, et al. ESA WorldCover 10 m 2021 v200. Genève, Switzerland: European Organization for Nuclear Research; 2022. doi:10.5281/zenodo.7254221. [Google Scholar] [CrossRef]
16. Heiden U, D’Angelo P, Schwind P, Karlshöfer P, Müller R, Zepp S, et al. Soil reflectance composites—improved thresholding and performance evaluation. Remote Sens. 2022;14(18):4526. doi:10.3390/rs14184526. [Google Scholar] [CrossRef]
17. Khongsai L. Enhancing soil health for sustainable agriculture practices. Int J Agro Stud Life Sci. 2022;1(1):13–8. doi:10.56614/ijasls1113-18. [Google Scholar] [CrossRef]
18. Pradipta A, Soupios P, Kourgialas N, Doula M, Dokou Z, Makkawi M, et al. Remote sensing, geophysics, and modeling to support precision agriculture: part 1: soil applications. Water. 2022;14(7):1158. doi:10.3390/w14071158. [Google Scholar] [CrossRef]
19. G2. Brussels, Belgium: ESDAC, DG-JRC; 2013 [cited 2024 Apr 3]. Available from: https://esdac.jrc.ec.europa.eu/themes/g2-model. [Google Scholar]
20. Karydas CG, Panagos P. The G2 erosion model: an algorithm for month-time step assessments. Environ Res. 2018;161(3):256–67. doi:10.1016/j.envres.2017.11.010. [Google Scholar] [PubMed] [CrossRef]
21. Karydas CG, Panagos P, Gitas IZ. A classification of water erosion models according to their geospatial characteristics. Int J Digit Earth. 2014;7(3):229–50. doi:10.1080/17538947.2012.671380. [Google Scholar] [CrossRef]
22. Panagos P, Christos K, Cristiano B, Ioannis G. Seasonal monitoring of soil erosion at regional scale: an application of the G2 model in Crete focusing on agricultural land uses. Int J Appl Earth Obs Geoinf. 2014;27(3):147–55. doi:10.1016/j.jag.2013.09.012. [Google Scholar] [CrossRef]
23. Panagos P, Karydas C, Borrelli P, Ballabio C, Meusburger K. Advances in soil erosion modelling through remote sensing data availability at European scale. In: Second International Conference on Remote Sensing and Geoinformation of the Environment (RSCy2014); 2014 Apr 7–10; Paphos, Cyprus. doi:10.1117/12.2066383. [Google Scholar] [CrossRef]
24. Panagos P, Borrelli P, Poesen J, Ballabio C, Lugato E, Meusburger K, et al. The new assessment of soil loss by water erosion in Europe. Environ Sci Policy. 2015;54(6):438–47. doi:10.1016/j.envsci.2015.08.012. [Google Scholar] [CrossRef]
25. Halecki W, Kruk E, Ryczek M. Evaluation of water erosion at a mountain catchment in Poland using the G2 model. Catena. 2018;164(8):116–24. doi:10.1016/j.catena.2018.01.014. [Google Scholar] [CrossRef]
26. Karydas C, Bouarour O, Zdruli P. Mapping spatio-temporal soil erosion patterns in the candelaro river basin, Italy, using the G2 model with Sentinel2 imagery. Geosciences. 2020;10(3):89. doi:10.3390/geosciences10030089. [Google Scholar] [CrossRef]
27. Pucher C, Neumann M, Hasenauer H. An improved forest structure data set for Europe. Remote Sens. 2022;14(2):395. doi:10.3390/rs14020395. [Google Scholar] [CrossRef]
28. Jevšenak J, Klisz M, Mašek J, Čada V, Janda P, Svoboda M, et al. Incorporating high-resolution climate, remote sensing and topographic data to map annual forest growth in central and eastern Europe. Sci Total Environ. 2024;913:169692. doi:10.1016/j.scitotenv.2023.169692. [Google Scholar] [PubMed] [CrossRef]
29. Fassnacht FE, White JC, Wulder MA, Næsset E. Remote sensing in forestry: current challenges, considerations and directions. Forestry. 2024;97(1):11–37. doi:10.1093/forestry/cpad024. [Google Scholar] [CrossRef]
30. Blaga L, Ilie DC, Wendt JA, Rus I, Zhu K, Dávid LD. Monitoring forest cover dynamics using orthophotos and satellite imagery. Remote Sens. 2023;15(12):3168. doi:10.3390/rs15123168. [Google Scholar] [CrossRef]
31. Hansen MC, Potapov PV, Moore R, Hancher M, Turubanova SA, Tyukavina A, et al. High-resolution global maps of 21st-century forest cover change. Science. 2013;342(6160):850–3. doi:10.1126/science.1244693. [Google Scholar] [PubMed] [CrossRef]
32. Baiamonte G, Gristina L, Orlando S, Palermo SS, Minacapilli M. No-till soil organic carbon sequestration patterns as affected by climate and soil erosion in the arable land of Mediterranean Europe. Remote Sens. 2022;14(16):4064. doi:10.3390/rs14164064. [Google Scholar] [CrossRef]
33. European Soil Database (ESDB) & soil properties. Brussels, Belgium: European Soil Data Centre (ESDACJoint Research Centre (JRCEC; 2024 [cited 2024 Apr 3]. Available from: https://esdac.jrc.ec.europa.eu/resource-type/european-soil-database-soil-properties. [Google Scholar]
34. Presence of soil pollutants, excess nutrients and salts soil. Brussels, Belgium: EGDI; 2024 [cited 2024 Apr 3]. Available from: http://www.europe-geology.eu/soil/. [Google Scholar]
35. d’Andrimont R, Yordanov M, Martinez-Sanchez L, Eiselt B, Palmieri A, Dominici P, et al. Harmonised LUCAS in situ land cover and use database for field surveys from 2006 to 2018 in the European Union. Sci Data. 2020;7(1):352. doi:10.1038/s41597-020-00675-z. [Google Scholar] [PubMed] [CrossRef]
36. Tóth G, Hermann T, Szatmári G, Pásztor L. Maps of heavy metals in the soils of the European Union and proposed priority areas for detailed assessment. Sci Total Environ. 2016;565(9):1054–62. doi:10.1016/j.scitotenv.2016.05.115. [Google Scholar] [PubMed] [CrossRef]
37. European Soil Data Centre (ESDAC). Soil Contamination. Soil Contamination. Brussels, Belgium: ESDAC—European Commission; 2024 [cited 2024 Apr 3]. Available from: https://esdac.jrc.ec.europa.eu/themes/soil-contamination. [Google Scholar]
38. Srinivasan R, Lalitha M, Chandrakala M, Dharumarajan S, Hegde R. Application of remote sensing and GIS techniques in assessment of salt affected soils for management in large scale soil survey. In: Shit PK, Adhikary PP, Bhunia GS, Sengupta D, editors. Soil health and environmental sustainability. Cham, Switzerland: Springer; 2022. p. 131–61. doi:10.1007/978-3-031-09270-1_7. [Google Scholar] [CrossRef]
39. Ulfa F, Orton TG, Dang YP, Menzies NW. Are climate-dependent impacts of soil constraints on crop growth evident in remote-sensing data? Remote Sens. 2022;14(21):5401. doi:10.3390/rs14215401. [Google Scholar] [CrossRef]
40. Sahbeni G, Ngabire M, Musyimi PK, Székely B. Challenges and opportunities in remote sensing for soil salinization mapping and monitoring: a review. Remote Sens. 2023;15(10):2540. doi:10.3390/rs15102540. [Google Scholar] [CrossRef]
41. Zhou Y, Chen S, Hu B, Ji W, Li S, Hong Y, et al. Global soil salinity prediction by open soil vis-NIR spectral library. Remote Sens. 2022;14(21):5627. doi:10.3390/rs14215627. [Google Scholar] [CrossRef]
42. Saline and sodic soils in European Union, 2008. Brussels, Belgium: IES-EC; 2008 [cited 2024 Apr 3]. Available from: https://esdac.jrc.ec.europa.eu/images/eusoils_old/Library/Themes/Salinization/Resources/salinisation.pdf. [Google Scholar]
43. Xu X, Thornton PE, Potapov P. A compilation of global soil microbial biomass carbon, nitrogen, and phosphorus data. Oak Ridge, TN, USA: ORNL DAAC; 2014. doi:10.3334/ORNLDAAC/1264. [Google Scholar] [CrossRef]
44. Zhang J, Weiss JP, Braun J. Exploring spire GNSS reflections for global soil moisture monitoring. In: IGARSS 2024—2024 IEEE International Geoscience and Remote Sensing Symposium; 2024 Jul 7–12; Athens, Greece. p. 5187–90. doi:10.1109/IGARSS53475.2024.10642541. [Google Scholar] [CrossRef]
45. Shi C, Zhang Z, Xiong S, Zhang W. Enhancing global surface soil moisture estimation from ESA CCI and SMAP product with a conditional variational autoencoder. IEEE J Sel Top Appl Earth Obs Remote Sens. 2024;17(1):9337–59. doi:10.1109/jstars.2024.3393828. [Google Scholar] [CrossRef]
46. Pinnepalli C, Roujean JL, Irvine M. Measuring and modelling directional effects in the frame of TIRAMISU (Thermal InfraRed Anisotropy Measurements in India and Southern EUrope). In: ISPRS TC III Mid-Term Symposium—Beyond the Canopy: Technologies and Applications of Remote Sensing; 2024 Nov 4–8; Belem, Brazil. p. 325–30. doi:10.5194/isprs-annals-x-3-2024-325-2024. [Google Scholar] [CrossRef]
47. Webb R, Rosenzweig CE, Levine ER. Global soil texture and derived water-holding capacities. Oak Ridge, TN, USA: ORNL DAAC; 2000. doi:10.3334/ORNLDAAC/548. [Google Scholar] [CrossRef]
48. Zepp S, Heiden U, Bachmann M, Möller M, Wiesmeier M, van Wesemael B. Optimized bare soil compositing for soil organic carbon prediction of topsoil croplands in Bavaria using Landsat. ISPRS J Photogramm Remote Sens. 2023;202(4):287–302. doi:10.1016/j.isprsjprs.2023.06.003. [Google Scholar] [CrossRef]
49. Shi P, Six J, Sila A, Vanlauwe B, Van Oost K. Towards spatially continuous mapping of soil organic carbon in croplands using multitemporal Sentinel-2 remote sensing. ISPRS J Photogramm Remote Sens. 2022;193:187–99. doi:10.1016/j.isprsjprs.2022.09.013. [Google Scholar] [CrossRef]
50. Castaldi F, Chabrillat S, Don A, van Wesemael B. Soil organic carbon mapping using LUCAS topsoil database and sentinel-2 data: an approach to reduce soil moisture and crop residue effects. Remote Sens. 2019;11(18):2121. doi:10.3390/rs11182121. [Google Scholar] [CrossRef]
51. Zinke PJ, Stangenberger AG, Post WM, Emanuel WR, Olson JS. Global organic soil carbon and nitrogen. Oak Ridge, TN, USA: ORNL DAAC; 1998. doi:10.3334/ORNLDAAC/221. [Google Scholar] [CrossRef]
52. d'Andrimont R, Verhegghen A, Lemoine G, Kempeneers P, Meroni M, van der Velde M. EUCROPMAP 2018 [Dataset]. Brussels, Belgium: European Commission, Joint Research Centre (JRC); 2021 [cited 2024 Apr 3]. Available from: http://data.europa.eu/89h/15f86c84-eae1-4723-8e00-c1b35c8f56b9. [Google Scholar]
53. The EU crop map—European Commission—EU Science Hub. [cited 2024 Apr 3]. Available from: https://joint-research-centre.ec.europa.eu/jrc-news-and-updates/eu-crop-map-2021-10-18_en. [Google Scholar]
54. McGarigal K, Cushman SA, Ene E. FRAGSTATS v4: spatial pattern analysis program for categorical and continuous maps: computer software program. Amherst, MA, USA: University of Massachusetts; 2012 [cited 2024 Apr 3]. Available from: http://www.umass.edu/landeco/research/fragstats/fragstats.html. [Google Scholar]
55. Applestein C, Germino MJ. How do accuracy and model agreement vary with versioning, scale, and landscape heterogeneity for satellite-derived vegetation maps in sagebrush steppe? Ecol Indic. 2022;139(5):108935. doi:10.1016/j.ecolind.2022.108935. [Google Scholar] [CrossRef]
56. Prajzlerová D, Barták V, Keil P, Moudrý V, Zikmundová M, Balej P, et al. The relationship between remotely-sensed spectral heterogeneity and bird diversity is modulated by landscape type. Int J Appl Earth Obs Geoinf. 2024;128(6):103763. doi:10.1016/j.jag.2024.103763. [Google Scholar] [PubMed] [CrossRef]
57. Naethe P, De Sanctis A, Burkart A, Campbell PKE, Colombo R, Di Mauro B, et al. Towards a standardized, ground-based network of hyperspectral measurements: combining time series from autonomous field spectrometers with Sentinel-2. Remote Sens Environ. 2024;303:114013. doi:10.1016/j.rse.2024.114013. [Google Scholar] [CrossRef]
58. Liccari F, Sigura M, Bacaro G. Use of remote sensing techniques to estimate plant diversity within ecological networks: a worked example. Remote Sens. 2022;14(19):4933. doi:10.3390/rs14194933. [Google Scholar] [CrossRef]
59. Nardi D, Jactel H, Pagot E, Samalens JC, Marini L. Drought and stand susceptibility to attacks by the European spruce bark beetle: a remote sensing approach. Agric For Entomol. 2023;25(1):119–29. doi:10.1111/afe.12536. [Google Scholar] [CrossRef]
60. Li H, Fang C, Xia Y, Liu Z, Wang W. Multi-scenario simulation of production-living-ecological space in the Poyang Lake area based on remote sensing and RF-Markov-FLUS model. Remote Sens. 2022;14(12):2830. doi:10.3390/rs14122830. [Google Scholar] [CrossRef]
61. Orgiazzi A, Panagos P, Yigini Y, Dunbar MB, Gardi C, Montanarella L, et al. A knowledge-based approach to estimating the magnitude and spatial patterns of potential threats to soil biodiversity. Sci Total Environ. 2016;545:11–20. doi:10.1016/j.scitotenv.2015.12.092. [Google Scholar] [PubMed] [CrossRef]
62. European Commission. Mapping and assessment of ecosystems and their services soil ecosystems, 2018. Brussels, Belgium: EC; 2018. 141 p. [Google Scholar]
63. Poggio L, de Sousa LM, Batjes NH, Heuvelink GBM, Kempen B, Ribeiro E, et al. SoilGrids 2.0: producing soil information for the globe with quantified spatial uncertainty. Soil. 2021;7(1):217–40. doi:10.5194/soil-7-217-2021. [Google Scholar] [CrossRef]
64. Turek ME, Poggio L, Batjes NH, Armindo RA, de Jong van Lier Q, de Sousa L, et al. Global mapping of volumetric water retention at 100, 330 and 15 000 cm suction using the WoSIS database. Int Soil Water Conserv Res. 2023;11(2):225–39. doi:10.1016/j.iswcr.2022.08.001. [Google Scholar] [CrossRef]
Cite This Article
 Copyright © 2025 The Author(s). Published by Tech Science Press.
This work is licensed under a Creative Commons Attribution 4.0 International License , which permits unrestricted use, distribution, and reproduction in any medium, provided the original work is properly cited.
 Downloads
 Citation Tools