
 Submit a Paper
 Propose a Special lssue
 Open Access
ARTICLE

Mapping Access to Green Space in Penang, Malaysia: A GIS-Based Study
1 School of Housing, Building and Planning, Universiti Sains Malaysia, Minden, 11800, Penang, Malaysia
2 May Design Sdn Bhd, Cinta Sayang Resort, Persiaran Cinta Sayang, Sungai Petani, 08000, Kedah, Malaysia
* Corresponding Author: Massoomeh Hedayati Marzbali. Email:
(This article belongs to the Special Issue: Advancements in Geospatial Methods and Technologies for Sustainable Built Environment and Engineering)
Revue Internationale de Géomatique 2025, 34, 553-567. https://doi.org/10.32604/rig.2025.066073
Received 28 March 2025; Accepted 14 July 2025; Issue published 06 August 2025
 View Full Text
 Download PDF
Abstract
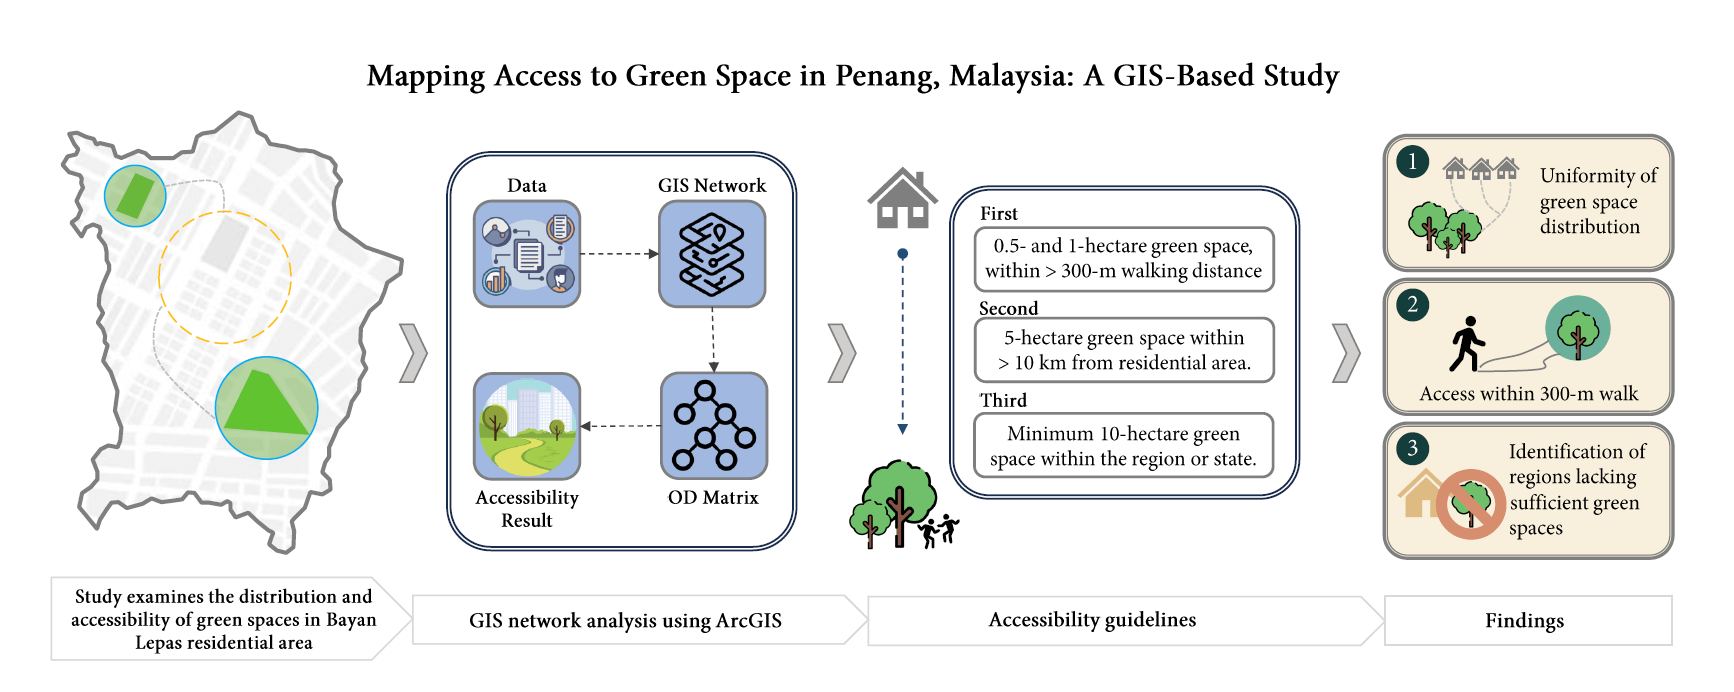
Urban green spaces play a crucial role in improving the well-being of city dwellers, offering recreational benefits that contribute to physical health. However, challenges remain in ensuring these spaces are distributed equitably and are accessible to all. This research examines the distribution and accessibility of green spaces in Bayan Lepas, Penang, Malaysia. The study focuses on evaluating three key factors: (1) the uniformity of green space distribution in the area, (2) the proportion of residents who can access green spaces within a 300-m walk, and (3) the identification of regions that lack sufficient green spaces, such as parks and recreational areas. To assess accessibility, the study uses a distance-based impedance method within a Geographic Information System (GIS) network analysis framework. Network distance rather than Euclidean distance is used to simulate actual walking paths along roads and pedestrian routes. ArcGIS software is employed to construct service areas and compute origin-destination cost paths between residential zones and green spaces of various sizes. The findings reveal that 82.32% of Bayan Lepas residents have access to green spaces ranging from 0.5 to 1 hectare within a 300-m walking distance. Additionally, 72.93% are served by green spaces of at least 5 hectares within a 10-km radius. At the regional scale, 100% of residents have access to green spaces of 10 hectares or more. These results provide valuable insights for urban planners and policymakers, highlighting the importance of enhancing spatial equity in green space distribution. The study offers a transferable methodology that can be adapted to other urban contexts with available GIS data and localized accessibility standards.Graphic Abstract
Keywords
Green spaces contribute significantly to residents’ quality of life by supporting local economies, improving environmental conditions, fostering social interaction, and preserving cultural values. Green spaces are vegetated areas that exist within cities and may be open to the public or restricted to private use. According to the World Health Organization report, green spaces are broadly defined as public parks, gardens, open spaces, sports facilities, and vegetable plots of land separating residential or industrial use areas [1]. In this study, however, the term “green spaces” is specifically used to refer to publicly accessible urban green areas, such as parks and communal gardens that are open at no cost to the public. This narrower definition aligns with the aim of evaluating equitable access to green infrastructure that directly benefits the broader population.
Well-designed green spaces contribute significantly to sustainable urban development and improve the overall quality of life for residents. Such spaces are defined as “fit for purpose”, indicating that they are accessible, safe, welcoming, and effectively serve their intended role [2]. As a result, how easily people can access green spaces is a crucial factor in determining their overall quality.
Green space accessibility refers to how easily green spaces can be reached or accessed [3]. Accessibility, in this context, means the ease with which individuals can reach green spaces from their homes using existing travel routes, not merely their physical presence. The availability and accessibility of green spaces may influence how frequently people use them. Studies suggest that people tend to visit green spaces more often when they are conveniently located and offer a high-quality environment. People who live closer to well-maintained green spaces tend to use them more often, which in turn is associated with improved health outcomes, such as enhanced mental well-being and lower stress levels [4]. Additionally, the accessibility and quality of green spaces, rather than merely their presence, play a crucial role in encouraging frequent use and are key factors that influence levels of physical activity [5]. By 2030, a key focus of the United Nations’ Sustainable Development Goal (SDG) 11, especially target 11.7, is to ensure that all individuals have access to safe, inclusive, and well-designed green and public spaces.
Several studies have addressed the uneven distribution of green spaces in urban areas [6,7]. The use of Geographic Information Systems (GIS) techniques has grown in assessing accessibility to green spaces. As discussed in prior research, one standard method is buffer analysis [8,9]. While this approach is intuitive and straightforward [10], it has limitations due to its reliance on Euclidean distances, which do not accurately reflect the actual travel distances encountered in real-life situations. In contrast, other studies have preferred GIS network analysis [11–13], which provides greater accuracy by considering existing road networks and realistic walking routes, leading to more precise accessibility assessments.
Recognizing the significant role of high-quality green spaces in enhancing human health, well-being, and quality of life, it is equally important to assess their accessibility. Understanding how easily urban residents can reach these spaces provides valuable insights for urban planners and policymakers, enabling them to address challenges and create opportunities for improved access. This study addresses this gap by employing GIS-based network analysis to evaluate access to public green spaces in Bayan Lepas, Penang. The approach used in this study, though localized, is transferable and can serve as a replicable framework for other urban areas with access to spatial datasets and road networks.
2 Measuring Accessibility to Green Spaces
A wide variety of methods was developed to measure urban green space accessibility (UGSA), each with its own advantages and limitations. These approaches have evolved over time, reflecting both advancements in spatial analysis techniques and the growing complexity of urban environments. A comparison of these methods is presented in Table 1. The approaches are:

This method emphasizes two core elements: (1) the attractiveness of green spaces and the concentration of nearby residents, which assist in distinguishing different green areas based on their features, and (2) spatial interaction patterns, typically examined using a distance decay function to demonstrate how the strength of interactions decreases as distance increases. The connection between residential zones and green spaces is largely shaped by the green space’s appeal and the size of the surrounding population [14,15]. Moreover, this relationship tends to weaken as the distance between green spaces and residential areas increases [16]. While this method has been widely applied in urban research to evaluate green space accessibility for several decades [17], studies suggest that identifying an ideal distance between urban residents and green spaces continues to be a complex task [18].
The counter approach, also referred to as the opportunity-based measure, is a method for evaluating access to green spaces. Instead of prioritizing distance or travel time, this approach assesses accessibility based on the overall availability of green spaces within a specific geographic region. By emphasizing the concentration of opportunities for residents, it offers a broader perspective on accessibility.
The counter approach measurement for assessing access to green spaces is favoured by planners and services due to its simplicity and efficiency in utilizing a limited number of variables [19]. The counter approach faces a limitation which it assumes that green spaces within a defined boundary are only accessible to residents within that area and are not accessible to those outside it [20]. This assumption is unrealistic, as people living nearby or outside the designated area may still access these green spaces. Such oversights can lead to misrepresentations of actual accessibility and usage patterns in urban environments. The modified approach to green space accessibility acknowledges that people who live farther from green spaces are less likely to visit them frequently, leading to lower levels of satisfaction [21].
The ratio-based approach in urban green space accessibility has been explored extensively in recent research. It focuses on balancing the supply of green spaces with the demand created by the surrounding population, giving insight into how much green space is available per person in a specific area [22,23]. While this approach offers users a comprehensive understanding by accounting for both supply and demand factors, it is unsuitable for small administrative regions like postal code zones [23], as it fails to account for cross-boundary behaviours. Moreover, it lacks consideration of key variables such as time and distance in assessing accessibility.
The utility-based approach offers an alternative method for developing accessibility measures by incorporating users’ perceptions or behavioural preferences [24,25]. This methodology is grounded in the random utility theory [26], which evaluates decision-making within a given set of choices.
The utility-based approach assumes that people make decisions based on a set of alternatives, each of which has a measurable “utility” or benefit to the individual. Utility, in this context, refers to the perceived value or satisfaction someone gets from choosing a particular option. However, one limitation of this approach is that it often relies on complex theories and mathematical models to calculate and compare utilities for different alternatives. This complexity can make it hard for planners, policymakers, and decision-makers to understand or apply the model in real-world situations [24].
To enhance accuracy in measuring accessibility to green spaces, this approach incorporates factors like travel distance, cost, and time, areas where prior methods have faced limitations.
The travel distance method, as outlined by [27], focuses on calculating the minimum distance from each residential site to the nearest green space access point. This model’s strength lies in its use of the distance variable, a widely employed factor in contemporary accessibility studies. Urban planners often leverage this variable to delineate service areas for various purposes [22]. Travel distance can be calculated using different methods, including Euclidean distance, Manhattan distance, and network distance.
The second method of measuring impedance is travelling time, which is more intricate than travel distance. This is because it incorporates various demographic, social, and economic aspects when assessing accessibility. Travel time between locations can differ greatly based on the mode of transportation, such as walking, cycling, or driving. Moreover, individual factors like age and physical fitness can also affect how long a journey takes.
The third impedance-based approach is the travel cost model, which calculates the costs associated with traveling from a residential area (often represented by its central point) to a green space access point, either on average or in total.
The study focuses on using impedance-based methods, particularly the calculation of travel distance, to measure how easily green spaces can be accessed. These methods are applied within a GIS platform and analyzed with different tools available in the GIS system.
This study aims to evaluate the distribution and accessibility of green spaces on Penang Island, Malaysia, with a specific focus on the Bayan Lepas sub-district. Bayan Lepas, located in the southwest region of Penang Island (see Fig. 1), is a rapidly urbanizing area with a population of 130,455 as of the 2020 Malaysia e-Census, spanning approximately 3190 hectares. Known as the second-largest urban settlement on the island, it serves as a major industrial, residential, and commercial hub, housing the Bayan Lepas Free Industrial Zone, one of Malaysia’s oldest and most important electronics manufacturing clusters.

Figure 1: The study area, Bayan Lepas, Malaysia
The selection of Bayan Lepas as the study site is driven by several interrelated urban planning and environmental considerations. As a high-density, mixed-use area, it exemplifies the pressures of rapid urban development commonly seen in many Malaysian cities, where competition for land often results in reduced green coverage. Only about 194 hectares or 6% of the total land area in Bayan Lepas is designated as public green space. This is significantly below the National Urbanisation Policy (NUP) standard, which recommends at least two hectares of green space per 1000 residents [28].
Bayan Lepas presents a socioeconomically diverse landscape, encompassing low, middle, and high-income neighbourhoods, including high-rise apartments, landed properties, and traditional villages (kampungs). These variations influence not only green space provision but also residents’ access to and use of such spaces. In addition, the uneven spatial distribution of green areas across different zones including industrial zones, commercial centers, and dense residential pockets makes it a compelling case study for examining spatial equity in green infrastructure.
Industrial development often leads to the transformation of green open spaces into urbanized areas. According to [29], the reduced vegetation cover increases the land surface temperature and creates unsafe environments for exercise, active transport, and simply being outdoors [30]. Study indicates that green spaces have been increasingly evidenced to not only improve human health (both body and mind) and wellbeing but also promote a sustainable way of living for citizens as well as cities [31]. In this study, the Geographic Information System (GIS) approach was utilized to collect and analyses the data.
A network dataset (ND) is a framework that represents interconnected elements, such as transportation systems, enabling the analysis of movement and connectivity. It primarily consists of lines that depict the flow paths within the network. A network dataset typically consists of edges (e.g., streets) and junctions (e.g., intersections) that enable the modelling of paths and costs (such as distance, time, or impedance) associated with traveling through the network.
A network dataset is constructed using secondary data, including land-use maps from the Geospatial Information Management Unit (PeGIS) in Penang and open street map data, which already outlines the existing road network in the Bayan Lepas area. This dataset includes various types of roads such as primary, secondary, minor roads, urban collectors, and local streets. Subsequently, GIS tools are used to generate service areas and origin-destination paths to evaluate green space accessibility. Service areas are defined as follows:
A service area is defined as a zone surrounding a particular location, within which all areas are reachable by a set distance or travel time. For instance, a 400-m service area includes all streets that are accessible within a 400-m walking radius from a designated point on a road or pedestrian path. Service area is used in network analysis to model accessibility, typically for services or facilities such as parks, schools, clinics, recreational areas, and shops.
3.1.3 Origin-Destination Distance Path
An origin-destination (OD) distance path refers to the measurement of the distance or route between two specific locations: the origin (starting point) and the destination (endpoint). In this study, network distance ways are used. For example, the distance between the residential area and the park might be 1 km. However, due to the layout of roads, intersections, and pedestrian walkways, the actual network distance to the nearest green space is approximately 1.5 km. Network distance is used in network analysis to provide a deeper and more accurate understanding of how people access green spaces.
3.1.4 Green Space Accessibility Guidelines
In this study, green space accessibility standards are established based on both global and local guidelines, including those from the World Health Organization, the Green Neighbourhood Guidelines (Malaysia), and the Open Area Planning Guidelines (Malaysia). These standards define the minimum distance people must travel to access the nearest green space and are summarized in Table 2.

Evaluating green space accessibility involves integrating various factors related to the study area, such as the locations of existing green spaces, access points to green spaces, existing road network, the boundaries of Bayan Lepas, as well as the data zone boundaries representing local residentials within Bayan Lepas. Additionally, demographic information 2020 of Bayan Lepas census is considered. The necessary data for this analysis are publicly available and sourced from four primary sources:
• Geospatial Information Management Unit, Penang;
• OpenStreetMap (https://www.openstreetmap.org);
• BBBike extract OpenStreetMap (https://extract.bbbike.org);
• Malaysia’s census (https://hub.worldpop.org).
At this stage, the collected data were processed and organized for subsequent GIS network analysis. The datasets were structured into feature datasets within a file geodatabase to ensure seamless integration, consistency, and reproducibility. Features specific to Bayan Lepas were extracted from broader datasets such as green space and data zone boundaries originally covering the entirety of Penang Island. This extraction was carried out using ArcGIS tools, to generate new layers representing a geographically focused subset of the original sources. Each dataset played a distinct role in the analysis and was prepared as follows:
1. Green space polygons were obtained from PeGIS and represent public parks and vegetated public areas. These features were clipped to the boundary of Bayan Leaps using the ArcGIS “Clip” tool and stored in a dedicated feature dataset labelled “Green_Space”.
2. Road network data were sourced from both OpenStreetMap and BBBike extracts to enhance spatial coverage and cross-validate network accuracy. The linear features were merged and cleaned to remove duplicates, then organized into a “Road_Network” feature dataset, which was later used to construct the network dataset for impedance-based analysis.
3. Administrative boundaries and residential data zones were acquired from PeGIS. These layers were used to delineate analysis zones. A separate feature dataset named “Data_Zones” was created to store these polygons, which served as the base for spatial aggregation and accessibility calculations.
4. Population data for the year 2020 were sourced from WorldPop, which provides high resolution raster estimates of population distribution. Using ArcGIS “Zonal Statistics” and “Spatial Join” tools, raster cell values were aggregated and linked to their corresponding data zone polygons to calculate total population per zone. The resulting attribute was then used in subsequent accessibility analysis.
Once the collected data were structured into a file geodatabase, a network dataset was utilized for conducting network analysis and evaluating the connectivity of various pedestrian pathways, such as primary, secondary, and minor roads, urban collectors, and local streets. The network dataset is built with specific settings, such as configuring the connectivity model to ensure that all streets are connected at their endpoints and opting to exclude elevation fields. A point feature class is included in the network dataset to represent junctions where pedestrian roads intersect, along with other feature classes that store the network’s attributes.
Fig. 2 presents a flowchart summarizing the analytical workflow, from data pre-processing to final population-based accessibility computation. This visual representation complements the steps described below and enhance methodological transparency.

Figure 2: Analytical workflow, from data preprocessing to final population-based accessibility computation
To assess green space accessibility in accordance with the Green Space Accessibility Standards, this study adapted the analytical approaches proposed by Vilcea and Sosea [9], Cetin [32], and Kmail and Onyango [33] to suit its specific context. The following analytical steps were carried out:
1. Define Origins and Destination: Origins were assigned to centroids of residential data zones, while destinations were based on access points of mapped green spaces categorized by size (0.5–1 ha, 5 ha, ≥10 ha).
2. Generate Origin-Destination (OD) Cost Matrix: The least-cost walking distance between multiple origins and destinations was calculated using the OD Cost Matrix tool in ArcGIS. This produced a table identifying the closest destination for each origin based on the shortest network travel distance.
3. Apply Accessibility Thresholds: Based on the Green Space Accessibility Standards, the results were filtered to determine which origins met specific accessibility criteria, e.g., within 300 m for small green spaces, 10,000 m for district-level parks, and broader thresholds for regional-scale green areas.
4. Join Population Data: The filtered OD results were joined to the data zone population layer using a relational database structure. This step enabled the association of each origin’s accessibility outcome with its corresponding population count.
5. Calculate Accessibility Statistics: The final table was processed using ArcGIS Summary Statistics tools to compute the total number of individuals with access to each tier of green space. The accessibility rate was determined by dividing the number of people with access by the total population of Bayan Lepas.
This approach allowed for a detailed spatial analysis of green space accessibility based on actual travel distance through pedestrian networks. The methods employed here are transferable and can be applied to other urban contexts where similar geospatial dataset are available.
This section presents the findings from the analysis of green space accessibility in Bayan Lepas, Penang. The study area was segmented into residential data zones, which were delineated to reflect the geographic distribution of the local population within the selected region. Each data zone functions as a spatial unit, with an estimated population ranging between 500 and 1000 individuals, based on the 2020 Malaysia census for Bayan Lepas. Only data zones located within the study boundaries were included, totaling 128 zones, with population sizes varying from 540 to 1720 residents. To assess accessibility to green spaces, a GIS-based network analysis was conducted. Several tools are available for such assessments, including ArcGIS, the Service Area Analysis feature in Open Route Service via QGIS3, and the Java Network Analyzer, which provides multiple algorithms rooted in graph theory and social network analysis. ArcGIS was selected for this study due to its proven efficiency, user-friendliness, and frequent application in related research (Delgado-Mellado et al., 2019). The analysis was carried out using ArcGIS software version 10.6.1 on a PC equipped with a Core i5 processor (2.1 GHz), 4 GB of RAM, and operating on Windows 10. The results quantify the number and percentage of residents who live within acceptable walking distances to green spaces of various sizes. Figs. 3–5 present maps that illustrate accessibility outcomes, not merely locations of green spaces. Each figure visualized which data zones meet the required accessibility standard for a specific tier of green space (i.e., 0.5–1 hectare within 300 m; 5 hectares within 10 km; and ≥10 hectares at the regional level). These maps are direct outputs of the GIS network analysis, and the shaded zones represent areas where residents can reach the nearest qualifying green space within the specified distance thresholds. This visual representation helps identify underserved residential areas and informs decisions about where new green spaces may be needed.

Figure 3: Data zones that have access to green spaces based on the first requirement

Figure 4: Data zones that have access to green spaces based on the second requirement

Figure 5: Data zones that have access to green spaces based on the third requirement
4.1 Data Zones with Access to Green Spaces according to the First Green Space Accessibility Standards Guidelines
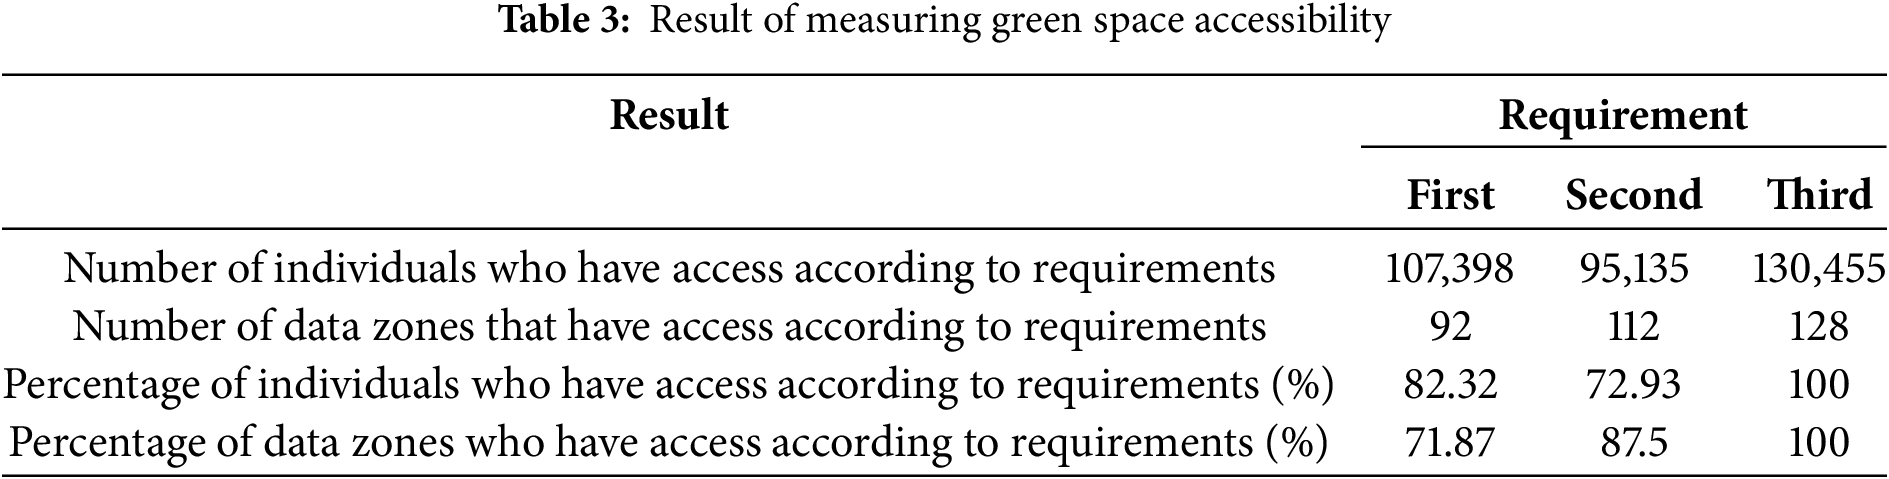
As shown in Fig. 3, 92 data out of 128 data zones have access to green spaces ranging from 0.5 to 1 hectare within 300-m walking distance. This indicates that approximately 71.87% of the data zones meet the first requirement of the Green Space Accessibility Standards. Notably, most of these zones are concentrated in the north and southwest areas of Bayan Lepas, while data zones at the centre and east of Bayan Lepas need to enhance accessibility to 0.5–1-hectare green spaces within 300 m distance.
The total population residing in the 92 data zones with green spaces amounts to 107,398, based on data integration between data zones and Bayan Lepas census information through a database linking process.
4.2 Data Zones with Access to Green Spaces according to the Second Green Space Accessibility Standards Guidelines
As shown in Fig. 4, 112 data zones have access to green spaces ranging from 5 to 9 hectares within a 5000-m distance. This indicates that 87.5% of all data zones meet the second requirement of the Green Space Accessibility Standards, while majority situated in north and west areas Bayan Lepas. Most data zones in the centre and east areas of Bayan Lepas lack such access due to the absence of green spaces of 5 to 9 hectares in these regions.
Approximately 95,135 residents of Bayan Lepas live in the 112 data zones that have access to these green spaces.
4.3 Data Zones with Access to Green Spaces according to the Third Green Space Accessibility Standards Guidelines
In relation to green space accessibility as per the third requirement of the Green Space Accessibility standard, Fig. 5 indicates that all data zones have access to green spaces ranging between 10 hectares above within the region distance. This accounts for 100% of the total data zones, with the majority situated in the Bayan Lepas neighbourhood. Approximately 130,455 people reside in these 128 data zones.
Based on the results presented and summarized in Table 3, approximately two-thirds of Bayan Lepas’s population have access to urban green spaces when considering only the first requirement of the Green Space Accessibility Standards. However, nearly half of the population has access when applying the second Green Space Accessibility Standards requirement. According to the third requirement, the whole Bayan Lepas neighbourhood has access to green space of 10 hectares and above. Therefore, it is essential to improve accessibility to green spaces in Bayan Lepas by identifying existing barriers and exploring opportunities for enhancement through the urban planning process.
This study aimed to explore the spatial distribution and accessibility of green spaces within Penang’s Bayan Lepas neighbourhood. Using Geographic Information System (GIS) tools, the study examined the distribution of these spaces, assessed how much of the population had access to them within a 300-m walking radius, and identified areas lacking sufficient green spaces that could benefit from new parks or recreational facilities based on GIS network analysis.
The findings suggest that certain areas of Bayan Lepas are well-connected to green spaces, meeting the Green Space Accessibility Standards. Specifically, most areas in the northern and southwestern parts of Bayan Lepas are within a 300-m walking distance from green spaces ranging from 0.5 to 1 hectare in size. Additionally, most areas in the northern and western parts of Bayan Lepas also have access to 5-hectare green spaces within a 10,000-m radius. However, when considering larger green spaces (10 hectares or more), all areas of Bayan Lepas are well-served, while the south part lacks sufficient accessibility to these larger green spaces. This indicates that although a significant portion of the population enjoys adequate access, there are underserved areas, particularly in the east, that require attention in future urban planning efforts. Residential areas near industrial hubs should be provided with more green spaces to mitigate the effects of urbanization on residents’ well-being.
The findings are consistent with broader research on green space equity. For example, Refs. [32–36] emphasized that access to proximate green spaces significantly contributes to mental and physical health outcomes, particularly in urban peripheries and industrialized areas. In line with these studies, our results confirm that green space provision in rapidly urbanizing districts like Bayan Lepas remains spatially uneven, with certain zones, particularly in the central and eastern areas, falling below established accessibility thresholds.
The policy implications of this analysis are substantial. By identifying priority zones with insufficient green space access, such as the residential-industrial edges of Bayan Lepas, local governments and urban planners are better positioned to implement equitable green infrastructure strategies. These may include the development of pocket parks, improved pedestrian linkages to existing green spaces, or the retrofitting of underutilized land parcels. In doing so, urban development in Penang can be better aligned with SDG 11.7 objectives and national planning guidelines promoting health, well-being, and environmental equity. This study may be subject to methodological constraints, including potential inaccuracies in demographic data processing, georeferencing, and vectorization. Specifically, the road network data used for network analysis was sourced from publicly available platforms such as OpenStreetMap, which may contain outdated or incomplete segments. Similarly, demographic data obtained from older census boundary zones may not reflect the current distribution of population density. In addition, while green space boundaries were derived from existing shapefiles, they may not perfectly align with actual on-ground extents due to inconsistencies in georeferencing. To mitigate these limitations, cross-validation techniques were applied. These included comparing and reconciling data across multiple platforms such as OpenStreetMap, Google Earth, and PeGIS (Penang Geographic Information System Centre). Manual verification and vectorization using orthophotos improved the spatial precision of green space boundaries. These strategies enhance the reliability of the findings and offer a reasonable degree of confidence in the results, though the presence of a small margin of error cannot be entirely ruled out.
As urbanization in Penang continues to accelerate, the methods and results of this study are critical in advocating for the recognition of green spaces as a fundamental right for all urban residents, irrespective of location. Special consideration should be given to the peripheral areas of metropolitan regions to ensure that their green space accessibility standards are on par with, or exceed, those of older, established urban centres. Ensuring equitable access to green spaces is vital for promoting community well-being, and ongoing efforts are required to address existing disparities.
Importantly, the methodology presented in this study is designed to be replicable and transferable to other urban contexts. The GIS-based workflow comprising spatial data collection, building of a network dataset, and the application of service area and origin-destination cost matrix tools can be applied in other cities or regions, provided that basic geospatial data (e.g., road networks, green space boundaries, and population information) are available. Urban planners, researchers, and policy-makers are encouraged to adopt this framework, tailoring the distance thresholds and green space standards to local contexts in order to assess and improve green space accessibility in their own urban environments.
Acknowledgement: The authors would like to thank Universiti Sains Malaysia and the Ministry of Higher Education Malaysia for providing financial support.
Funding Statement: This research was funded by Universiti Sains Malaysia and the Ministry of Higher Education Malaysia under the FRGS grant (No. 203/PPBGN/6712098 with a Reference Code of FRGS/1/2022/SSI02/USM/02/3).
Author Contributions: The authors confirm contribution to the paper as follows: material preparation, data collection, analysis, and interpretation of results: Nurfarahin Roslan. The first draft of the manuscript was written by: Nurfarahin Roslan, Massoomeh Hedayati Marzbali, Aldrin Abdullah and Ang See May. All authors commented on previous version of the manuscripts. All authors reviewed the results and approved the final version of the manuscript.
Availability of Data and Materials: The data used in this study can be assessed.
Ethics Approval: Not applicable.
Conflicts of Interest: The authors declare no conflicts of interest to report regarding the present study.
References
1. WHO Regional Office for Europe. Urban Green Spaces and Health [Internet]. 2016 [cited 2025 Jul 13]. 92 p. Available from: https://www.who.int/europe/publications/i/item/WHO-EURO-2016-3352-43111-60341. [Google Scholar]
2. WHO Regional Office for Europe. Urban Green Space and Health: Intervention Impacts and Effectiveness [Internet]. 2017 [cited 2025 Jul 13]. Available from: https://www.who.int/europe/publications/m/item/urban-green-space-and-health–intervention-impacts-and-effectiveness. [Google Scholar]
3. Farfán Gutiérrez M, Boni Noguez A, Flamenco-Sandoval A, Martínez Serrano A, Flores-Torres A, Godínez Ramírez AK, et al. Availability and accessibility of urban green spaces: the case of the urban zone of Queretaro Metropolitan Area. Mexico J Maps. 2021;17(1):101–5. doi:10.1080/17445647.2021.1927867. [Google Scholar] [CrossRef]
4. Holt EW, Lombard QK, Best N, Smiley-Smith S, Quinn JE. Active and passive use of green space, health, and well-being amongst university students. Int J Environ Res Public Health. 2019;16(3):424. doi:10.3390/ijerph16030424. [Google Scholar] [PubMed] [CrossRef]
5. Carter M, Horwitz P. Beyond proximity: the importance of green space useability to self-reported health. Ecohealth. 2014;11(3):322–32. doi:10.1007/s10393-014-0952-9. [Google Scholar] [PubMed] [CrossRef]
6. Anwar MM, Hashim M, Aziz A, Stocco A, Abdo HG, Almohamad H, et al. Urban green spaces distribution and disparities in congested populated areas: a geographical assessment from Pakistan. Sustainability. 2023;15(10):8059. doi:10.3390/su15108059. [Google Scholar] [CrossRef]
7. Pallathadka A, Pallathadka L, Rao S, Chang H, Van Dommelen D. Using GIS-based spatial analysis to determine urban greenspace accessibility for different racial groups in the backdrop of COVID-19: a case study of four US cities. GeoJournal. 2022;87(6):4879–99. doi:10.1007/s10708-021-10538-8. [Google Scholar] [PubMed] [CrossRef]
8. Garg V, Sharma A. Urban sprawl analysis using GIS applications for Jabalpur City. Int Res J Eng Technol. 2018;5(5):4171–6. [Google Scholar]
9. Vîlcea C, Şoşea C. A GIS-based analysis of the urban green space accessibility in Craiova city. Romania Geogr Tidsskr—Danish J Geogr. 2020;120(1):19–34. doi:10.1080/00167223.2020.1766365. [Google Scholar] [CrossRef]
10. Coutts C, Chapin T, Horner M, Taylor C. County-level effects of green space access on physical activity on physical activity. J Phys Act Health. 2013;10(2):232–40. doi:10.1123/jpah.10.2.232. [Google Scholar] [PubMed] [CrossRef]
11. Kang S, Lee G, Kim J, Park D. Identifying the spatial structure of the tourist attraction system in South Korea using GIS and network analysis: an application of anchor-point theory. J Destin Mark Manag. 2018;9(6):358–70. doi:10.1016/j.jdmm.2018.04.001. [Google Scholar] [CrossRef]
12. Ojiako JC, Igbokwe EC, Ossai EN. Application of GIS and remote sensing approach for the analysis of Asaba Urban Street Network of Delta State. Nigeria J Impact Factor. 2018;3:96. doi:10.7324/ijasre.2018.32592. [Google Scholar] [CrossRef]
13. Kuta AA, Odumosu JO, Gbenga Ajayi O, Zitta NZ, Samail-Ija HA, Adesina AE. Using a GIS-based network analysis to determine urban greenspace accessibility for different socio economic groups, specifically related to deprivation in Leicester. UK Civ Environ Res. 2014;6(9):12–21. doi:10.1016/j.landurbplan.2008.01.002. [Google Scholar] [CrossRef]
14. Hoang SD, Pham TP, Tučková Z. Tourist motivation as an antecedent of destination and ecotourism loyalty. Emerg Sci J. 2022;6(5):1114–33. doi:10.28991/esj-2022-06-05-014. [Google Scholar] [CrossRef]
15. Schindler M, Le Texier M, Caruso G. How far do people travel to use urban green space? A comparison of three European cities. Appl Geogr. 2022;141:102673. doi:10.1016/j.apgeog.2022.102673. [Google Scholar] [CrossRef]
16. Laan CM, Piersma N. Accessibility of green areas for local residents. Environ Sustain Indic. 2021;10(3):100114. doi:10.1016/j.indic.2021.100114. [Google Scholar] [CrossRef]
17. Chen P, Wang W, Qian C, Cao M, Yang T. Gravity-based models for evaluating urban park accessibility: why does localized selection of attractiveness factors and travel modes matter? Environ Plan B Urban Anal City Sci. 2024;51(4):904–22. doi:10.1177/23998083231206168. [Google Scholar] [CrossRef]
18. Chen Y, Yue W, La Rosa D. Which communities have better accessibility to green space? An investigation into environmental inequality using big data. Landsc Urban Plan. 2020;204(2):103919. doi:10.1016/j.landurbplan.2020.103919. [Google Scholar] [CrossRef]
19. Battiston A, Schifanella R. On the need to move from a single indicator to a multi-dimensional framework to measure accessibility to urban green. arXiv:2308.05538. 2023. [Google Scholar]
20. Liu D, Kwan MP, Kan Z, Wang J. Toward a healthy urban living environment: assessing 15-min green-blue space accessibility. Sustain. 2022;14(24):1–12. doi:10.3390/su142416914. [Google Scholar] [CrossRef]
21. Atiqul Haq SM, Islam MN, Siddhanta A, Ahmed KJ, Chowdhury MTA. Public perceptions of urban green spaces: convergences and divergences. Front Sustain Cities. 2021;3:1–15. doi:10.3389/frsc.2021.755313. [Google Scholar] [CrossRef]
22. Hao Z. Accessibility to green space in the Melbourne metropolitan area [dissertation]. Melbourne, Australia: Royal Melbourne Institute of Technology; 2013. [Google Scholar]
23. Dong Y, Chen X, Lv D, Wang Q. Evaluation of urban green space supply and demand based on mobile signal data: taking the central area of Shenyang City as an example. Land. 2023;12(9):1–20. doi:10.3390/land12091742. [Google Scholar] [CrossRef]
24. Lucas K, Marsden G, Brooks M, Kimble M. Assessment of capabilities for examining long-term social sustainability of transport and land use strategies. Transp Res Rec. 2007;2013(1):30–7. doi:10.3141/2013-05. [Google Scholar] [CrossRef]
25. Geurs KT, van Wee B. Accessibility evaluation of land-use and transport strategies: review and research directions. J Transp Geogr. 2004;12(2):127–40. doi:10.1016/j.jtrangeo.2003.10.005. [Google Scholar] [CrossRef]
26. Ben-akiva M, Bierlaire M. Discrete choice methods and their applications to short-term travel decisions. In: Hall RW, editor. Handbook of transportation science. International series in operations research & management science. Boston, MA, USA: Springer; 1999. Vol. 23, p. 5–34. doi:10.1007/978-1-4615-5203-1_2. [Google Scholar] [CrossRef]
27. Talen E, Anselin L. Assessing spatial equity: an evaluation of measures of accessibility to public playgrounds. Environ Plan A. 1998;30(4):595–613. doi:10.1068/a300595. [Google Scholar] [CrossRef]
28. Deen T. US National urban policy. Urban Policy Res. 1983;1(2):31–3. doi:10.1080/08111148308523122. [Google Scholar] [CrossRef]
29. Ferguson T, Curtis R, Fraysse F, Olds T, Dumuid D, Brown W, et al. Weather associations with physical activity, sedentary behaviour and sleep patterns of Australian adults: a longitudinal study with implications for climate change. Int J Behav Nutr Phys Act. 2023;20(1):1–11. doi:10.1186/s12966-023-01414-4. [Google Scholar] [PubMed] [CrossRef]
30. Jatmiko RH. Penggunaan citra saluran inframerah termal untuk studi perubahan liputan lahan dan suhu sebagai indikator perubahan iklim perkotaan di Yogyakarta [dissertation]. Yogyakarta, Indonesia: Universitas Gadjah Mada; 2016. (In Indonesian). [Google Scholar]
31. Selanon P, Chuangchai W. The importance of urban green spaces in enhancing holistic health and sustainable well-being for people with disabilities: a narrative review. Buildings. 2023;13(8):2100. doi:10.3390/buildings13082100. [Google Scholar] [CrossRef]
32. Cetin M. Using GIS analysis to assess urban green space in terms of accessibility: case study in Kutahya. Int J Sustain Dev World Ecol. 2015;22(5):420–4. doi:10.1080/13504509.2015.1061066. [Google Scholar] [CrossRef]
33. Kmail AB, Onyango V. A GIS-based assessment of green space accessibility: case study of Dundee. Appl Geomatics. 2020;12(4):491–9. doi:10.1007/s12518-020-00314-7. [Google Scholar] [CrossRef]
34. Roberts H, van Lissa C, Hagedoorn P, Kellar I, Helbich M. The effect of short-term exposure to the natural environment on depressive mood: a systematic review and meta-analysis. Environ Res. 2019;177(2):108606. doi:10.1016/j.envres.2019.108606. [Google Scholar] [PubMed] [CrossRef]
35. Jimenez MP, Deville NV, Elliott EG, Schiff JE, Wilt GE, Hart JE, et al. Associations between nature exposure and health: a review of the evidence. Int J Environ Res Public Health. 2021;18(9):4790. doi:10.3390/ijerph18094790; [Google Scholar] [CrossRef]
36. Xu Z, Marini S, Mauro M, Maietta Latessa P, Grigoletto A, Toselli S. Associations between urban green space quality and mental wellbeing: systematic review. Land. 2025;14(2):1–23. doi:10.3390/land14020381. [Google Scholar] [CrossRef]
Cite This Article
 Copyright © 2025 The Author(s). Published by Tech Science Press.
This work is licensed under a Creative Commons Attribution 4.0 International License , which permits unrestricted use, distribution, and reproduction in any medium, provided the original work is properly cited.
 Downloads
 Citation Tools