
 Submit a Paper
 Propose a Special lssue
 Open Access
ARTICLE

Optimizing Sea-Spike Detection and Removal in Bathymetric Data: A Case Study of Bintulu, Sarawak
1 Faculty of Built Environment and Surveying, Universiti Teknologi Malaysia, Johor Bahru, 81310, Malaysia
2 Geomatic Innovation Research Group (GnG), Universiti Teknologi Malaysia, Johor Bahru, 81310, Malaysia
3 Faculty of Geomatics, Sabaragamuwa Universiti of Sri Lanka, P.O. Box 02, Belihuloya, 70140, Sri Lanka
* Corresponding Author: Kelvin Kang Wee Tang. Email:
(This article belongs to the Special Issue: Advancements in Geospatial Methods and Technologies for Sustainable Built Environment and Engineering)
Revue Internationale de Géomatique 2025, 34, 569-585. https://doi.org/10.32604/rig.2025.066200
Received 01 April 2025; Accepted 09 July 2025; Issue published 06 August 2025
 View Full Text
 Download PDF
Abstract
Single-beam echo sounders remain popular for seabed mapping because they possess an affordable cost and user-friendly design, delivering essential services for marine navigation, coastal management and resource conservation. High-amplitude echoes known as sea-spikes can severely harm depth measurement precision by disrupting readings, thus lowering the overall data accuracy. The manual processing method for outliers produces subjective results and demands excessive labor, which makes it difficult to accomplish trustworthy data processing. The study presents the Sea-Spike Filtering System (SSFS) as a semi-automatic system that utilizes mean absolute deviation (MAD) together with median filter (MF) techniques to efficiently find and eliminate false data in sea observations. The SSFS system showed reliable noise reduction abilities when tested with actual bathymetric data from Bintulu, Sarawak, thus delivering data quality upgrades that fulfilled 59.39% of International Hydrographic Organization (IHO) Order 2 Total Vertical Uncertainty (TVU) guidelines. The Mean Absolute Deviation value decreased substantially from 1.0618 to 0.4314, which enhanced noise reduction without influencing the Residual Mean Square Error or Mean Absolute Error statistics of 1.4188 and 0.9663 m, respectively. The successful elimination of sea-spike outliers through the system leads to general-purpose survey accuracy, yet more system improvements are required to meet the demanding safety standards in shallow water applications.Graphic Abstract
Keywords
Underwater mapping operations and bathymetric data acquisition rely fundamentally on acoustic echo sounder technology, which includes SBES and MBES systems. The devices send acoustic pulses toward the seafloor and then process echo data to obtain water depth measurements as well as create underwater terrain maps. Acoustic sounding methods using vessels continue to be the dominant survey approach because they efficiently monitor extended areas. Alternative direct measurement methods, like rulers and plumb lines, exist. Bathymetric data accuracy suffers substantially when sea spikes appear due to their impact on incorrect depth reading measurements [1]. Manual processing of bathymetric data is labor-intensive and prone to inconsistencies, often requiring substantial operator input and time, as demonstrated by comparisons with automated methods in a real-time environment [2]. Acoustic sounding data containing sea spikes creates confusion about seabed features and transient disturbances, which makes the received data questionable for interpretation. SBES data processing must incorporate a strong sea-spike filtering system that provides reliable performance. The necessary system requires a successful approach that removes sea spikes to maintain authentic depth information, leading to improved accuracy of bathymetric data used across navigation and research activities, along with surveying operations [3].
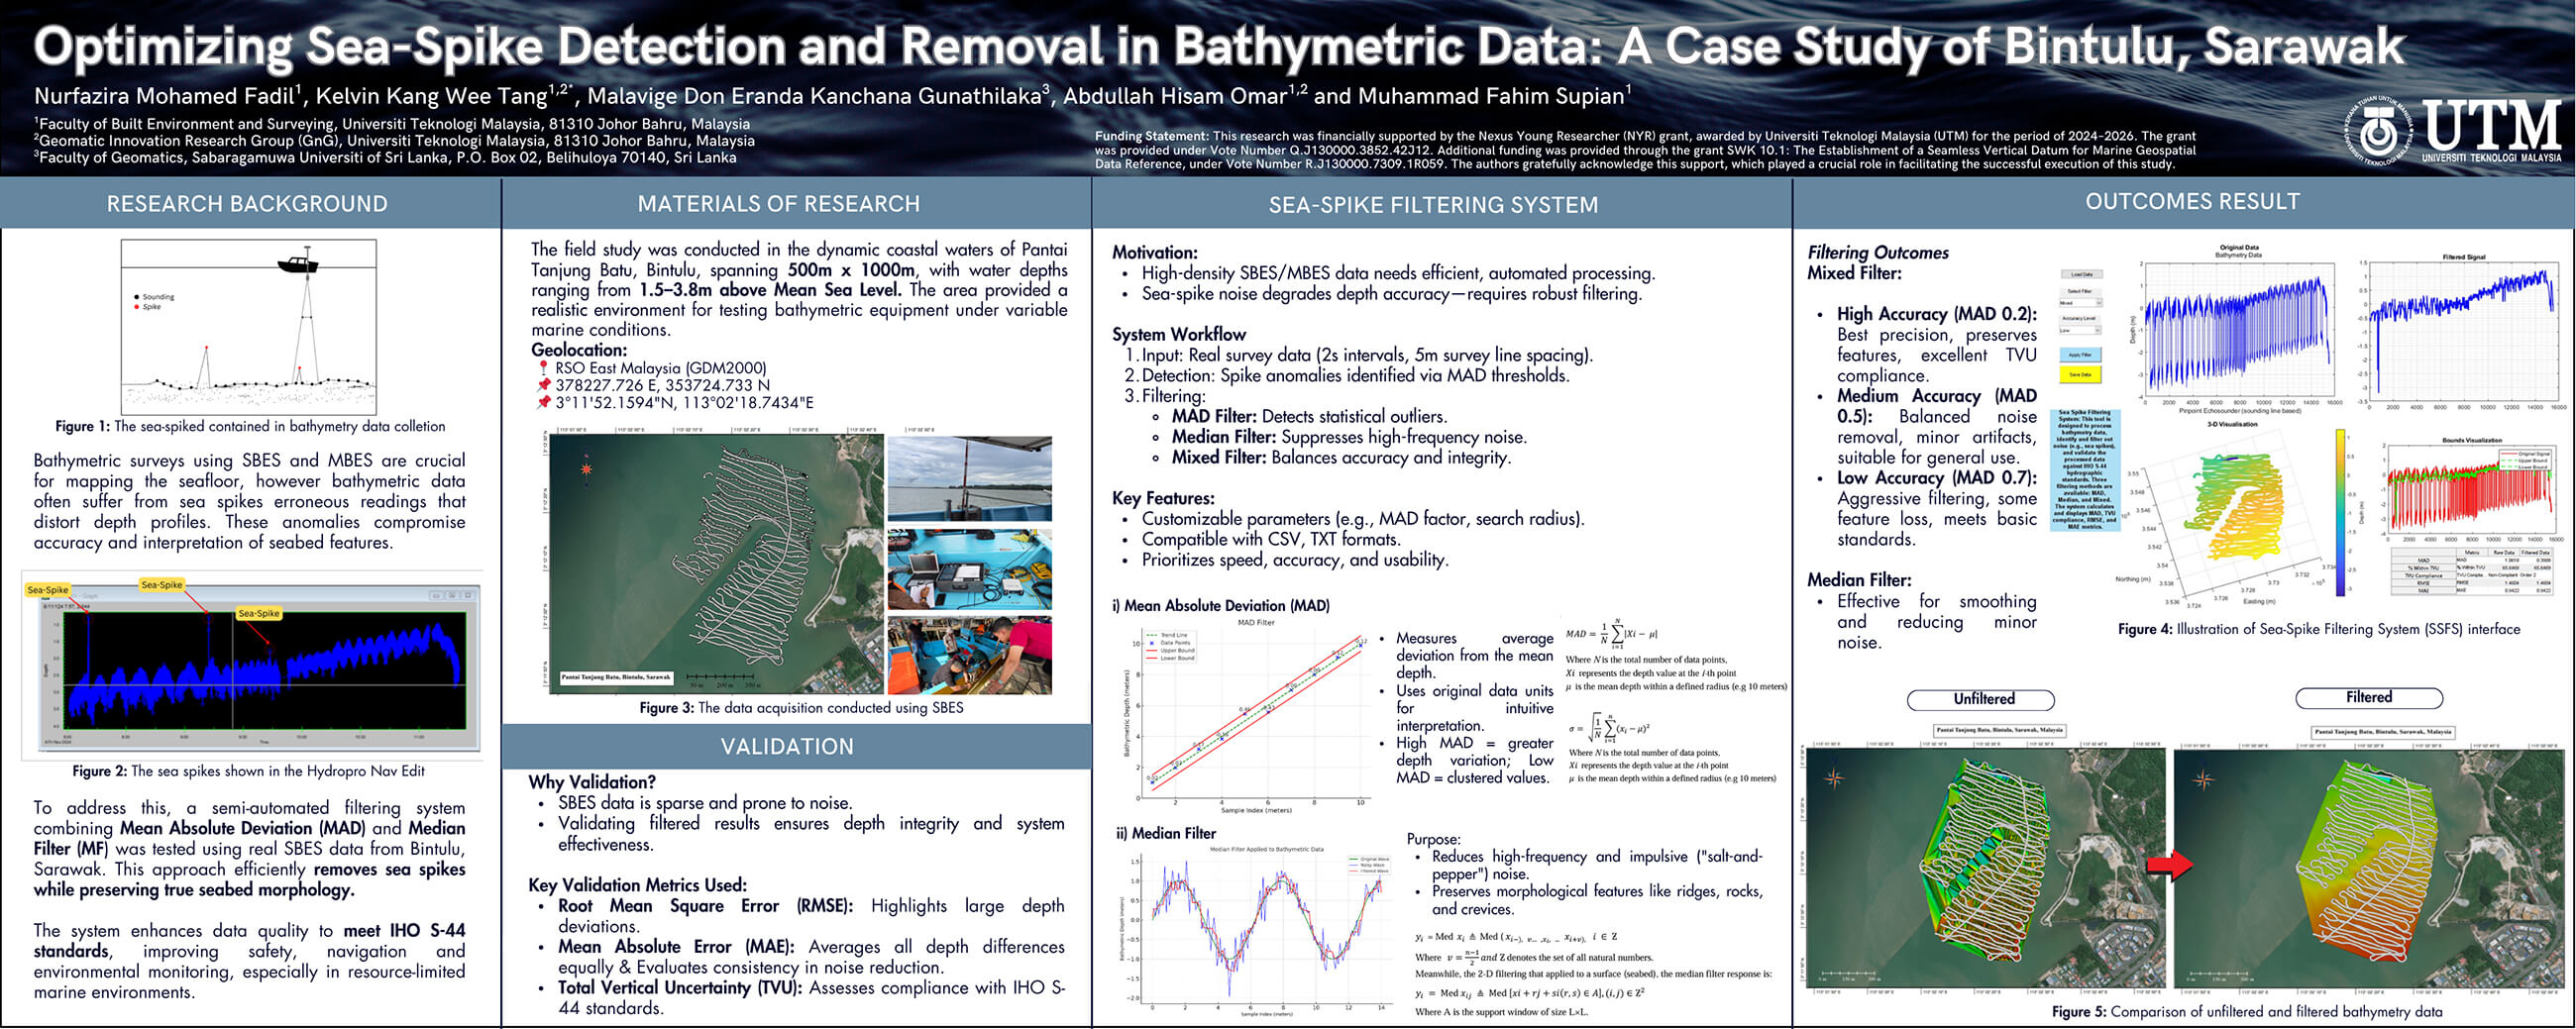
A semi-automated filtering algorithm that unites mean absolute deviation (MAD) with median filter (MF) methods achieves major progress in this field. The MAD method shows excellence in measuring data variability while resisting outlier distortions [4], but the MF rotates each data point to its adjacent median value to maintain vital seabed features. The performance test of this filtering system utilized authentic datasets generated from Bintulu, Sarawak, which represent demanding maritime conditions. The main objective of outlier detection work focuses on improving bathymetric data quality to satisfy S-44 Edition 6.2.0 standards from the International Hydrographic Organization. This research delivers an applicable solution to enhance SBES data precision, which enables the production of high-quality bathymetric mapping results and profiles. Innovative, easy-to-implement techniques demonstrate their ability to address hydrographic survey problems especially when used in challenging marine environments requiring limited resources. The application of MAD and MF during SBES data processing creates an effective solution for reducing sea spike artifacts to enhance the quality of measured bathymetric data. Underwater mapping accuracy increases through this advancement, and at the same time, supports safety and environmental monitoring work in marine areas (Fig. 1).
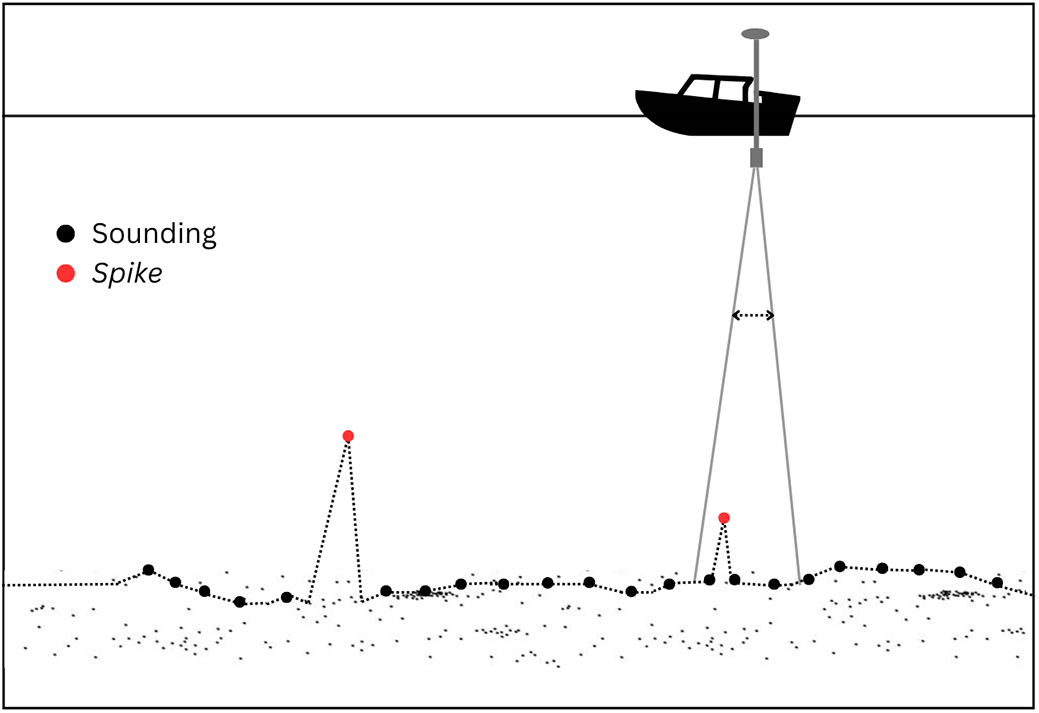
Figure 1: The sea-spikes contained in the bathymetry data collection
The field research took place in Pantai Tanjung Batu’s Bintulu coastal waters covering an area of 500 m width by 1000 m length in Sarawak Malaysia. The study site offered an optimal environment for assessing bathymetric equipment performance since it had dynamic marine conditions that simulated testing under various sea conditions. Surveyed area measurements extended from 1.5 to 3.8 m in depth above the Mean Sea Level (MSL). The surveyed area obtained its geographical coordinates in Rectified Skew Orthomorphic (RSO) East Malaysia (Borneo) based on Geodetic Datum of Malaysia 2000 (GDM2000) at Easting: 378,227.726, Northing: 353,724.733 m with 3°11′52.1594″ N, 113°02′18.7434″ E as the approximate coordinate. The site location appears in Fig. 2. Bathymetric Data survey data included measurements of northing, easting and depth values. A complete SBES system gained momentum through the dominant function of the Hydro Trac Echo Sounder for seabed profiling operations. A single-frequency transducer mounted on a boat required bar plate and bracket fixtures for stability during data collection. The Trimble DSM212H mobile receiver along with a Trimble DGPS antenna delivered sub-meter accurate positioning data for high precision georeferencing during data collection.
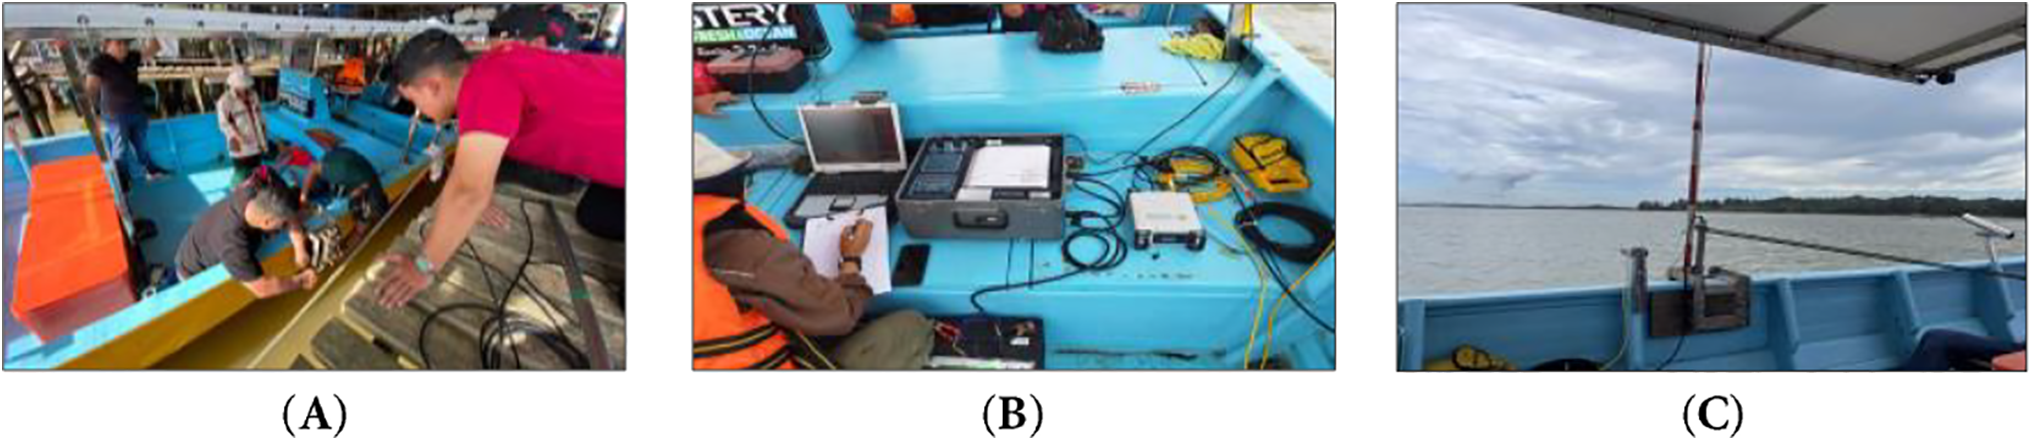
Figure 2: The data collection conducted using Single-Beam Echo Sounder (SBES) (A–C)
The study employs genuine survey data which measures depth variations in both space and time across the observed coastal region. The survey area received high-density point mapping through spatial data collection at 2-s intervals, with approximately 5 m spacing between points at a vessel speed of 5 knots and 25 m spacing between survey lines, to ensure complete documentation of the underwater topography, as demonstrated in Fig. 3. The dataset includes sea-spikes that produce sharp sudden variations in depth measurements which appear as shown in Fig. 4. The measurement errors primarily stem from external factors during data collection or instrument or surface reflection interference. When unresolved sea spikes exist in data, their effect substantially distorts depth measurements which compromises the dataset reliability for marine resource management, navigation and seabed analysis.
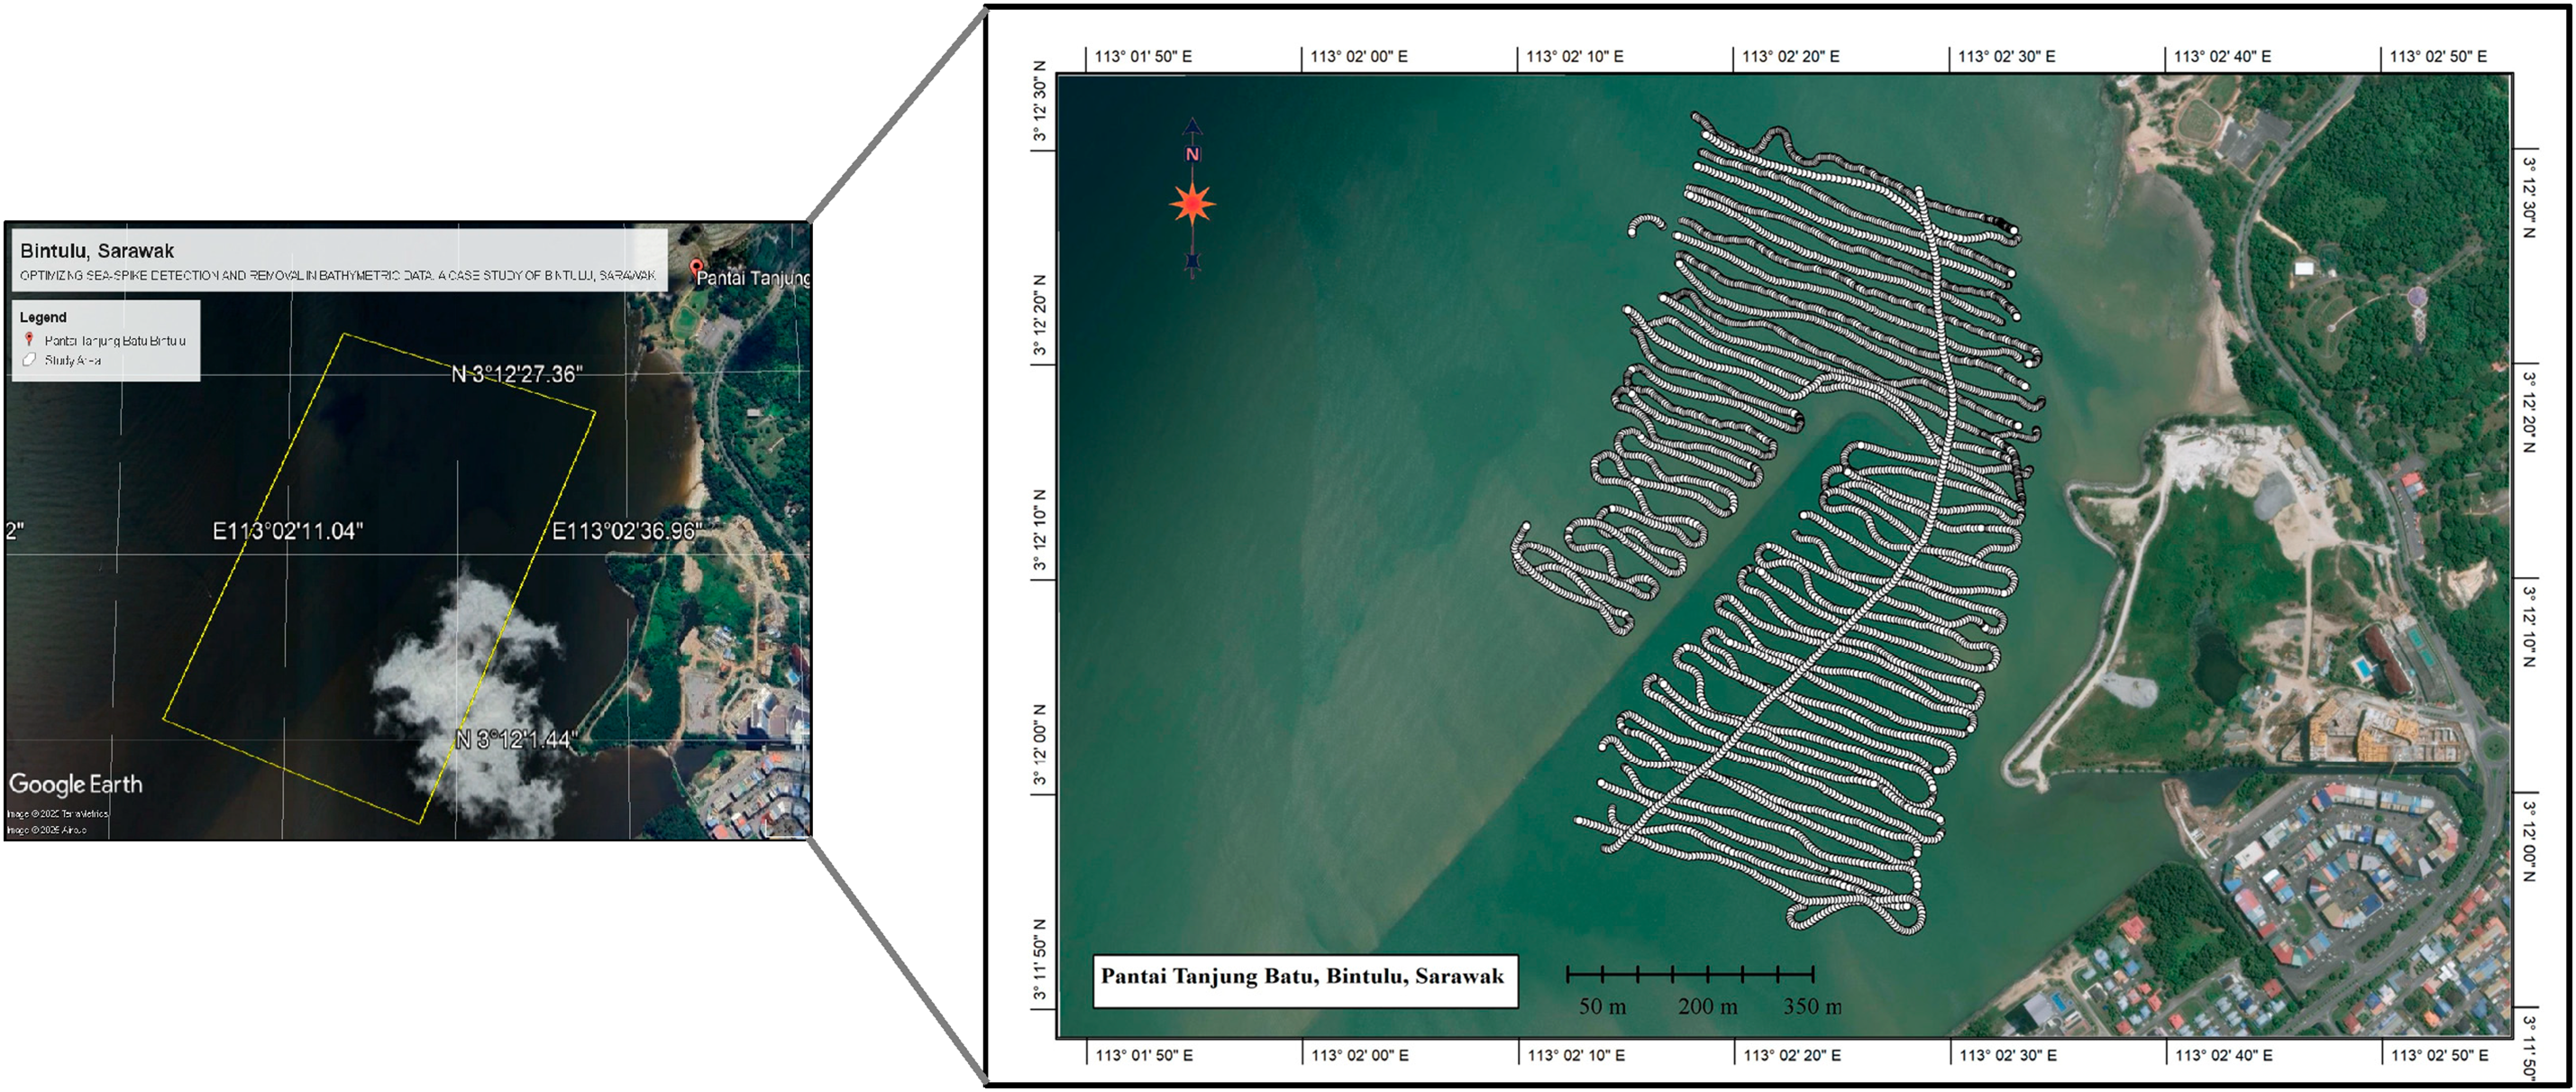
Figure 3: The study located in the Pantai Tanjung Batu, Bintulu, Sarawak referenced to the satellite image in Global Mapper
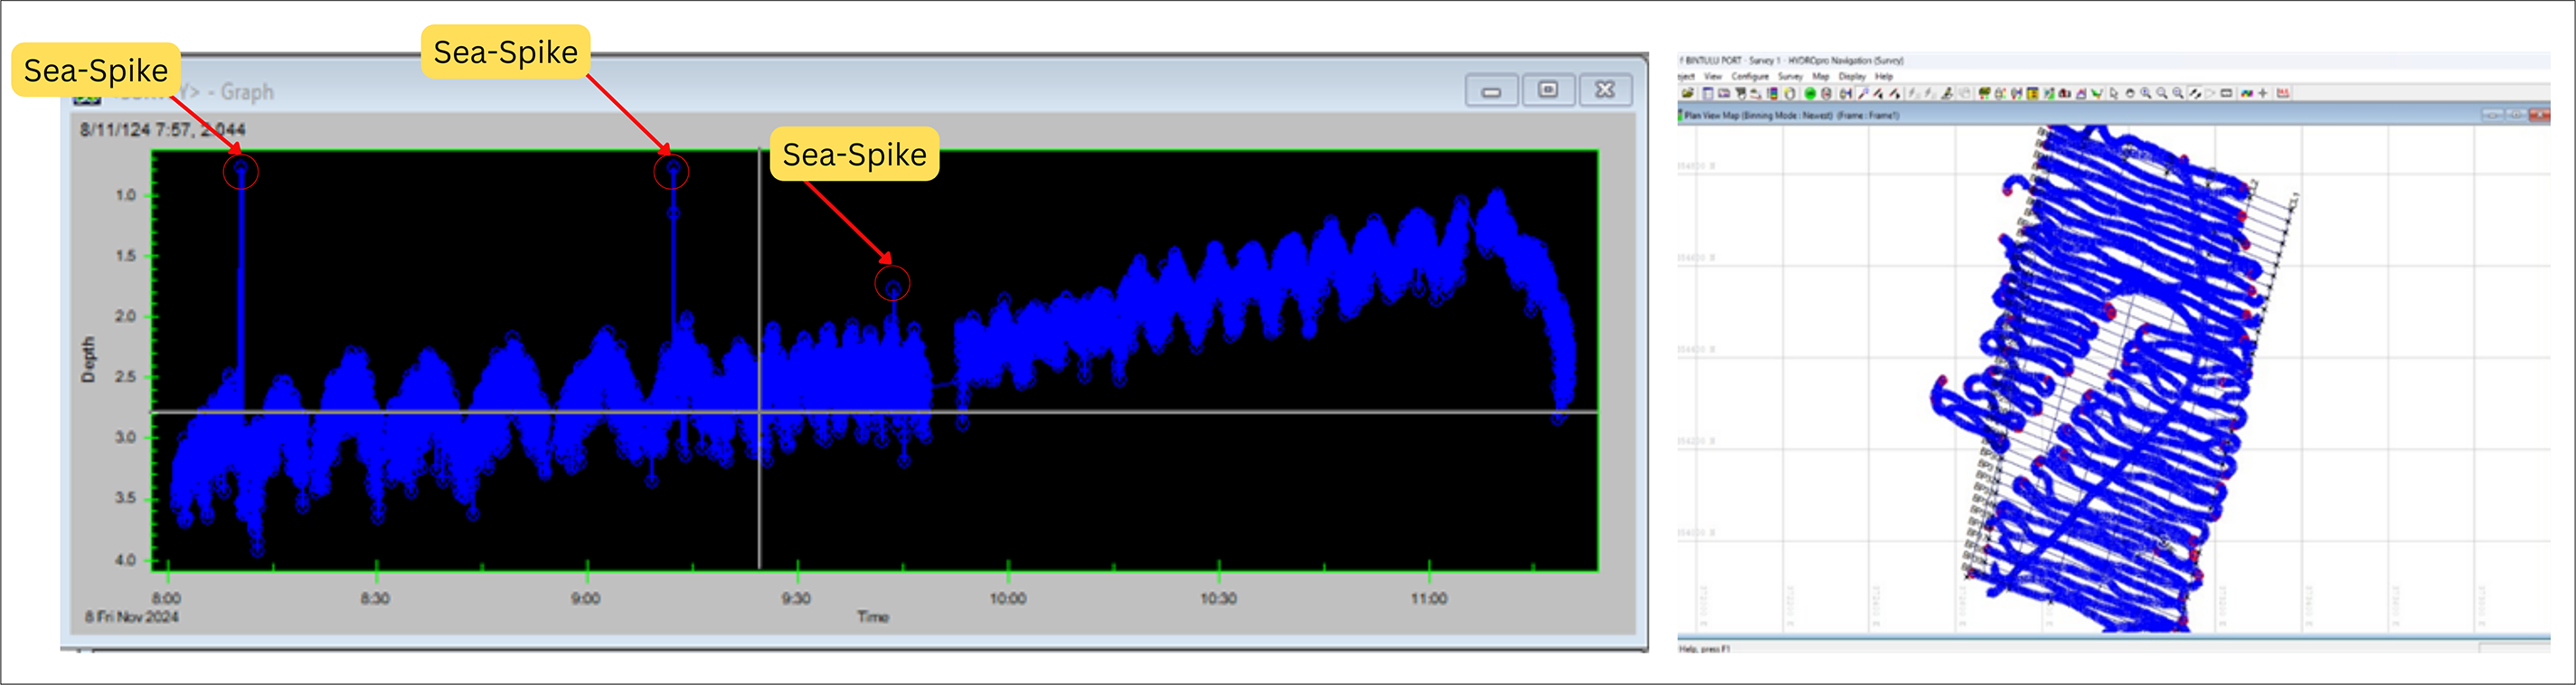
Figure 4: The bathymetry data that contained spikes shown in Hydropro Nav Edit
2.2 The System Development Framework
Automated bathymetric processing has shown substantial promise in managing high-density data streams, particularly within the context of multibeam echo sounder applications [5]. This capability has prompted the development of semi-automated filtering systems such as SSFS, where methodology and system development adopt a systematic approach to ensure the accuracy and reliability of bathymetric data, as demonstrated in Fig. 5. The spike detection algorithm identifies anomalies, and an outlier removal algorithm eliminates erroneous data points. The integrated approach results in a filtered and refined dataset, supporting accurate bathymetric analysis and informed decision-making. In Phase 1, the study employs genuine survey data which measures depth variations in both space and time across the observed coastal region. The survey area received high-density point mapping through spatial data collection at 2-s intervals between survey lines spaced 5 m for complete underwater topography. The dataset includes sea-spikes that produce sharp sudden variations in external factors during data collection or instrument or surface reflection interference.
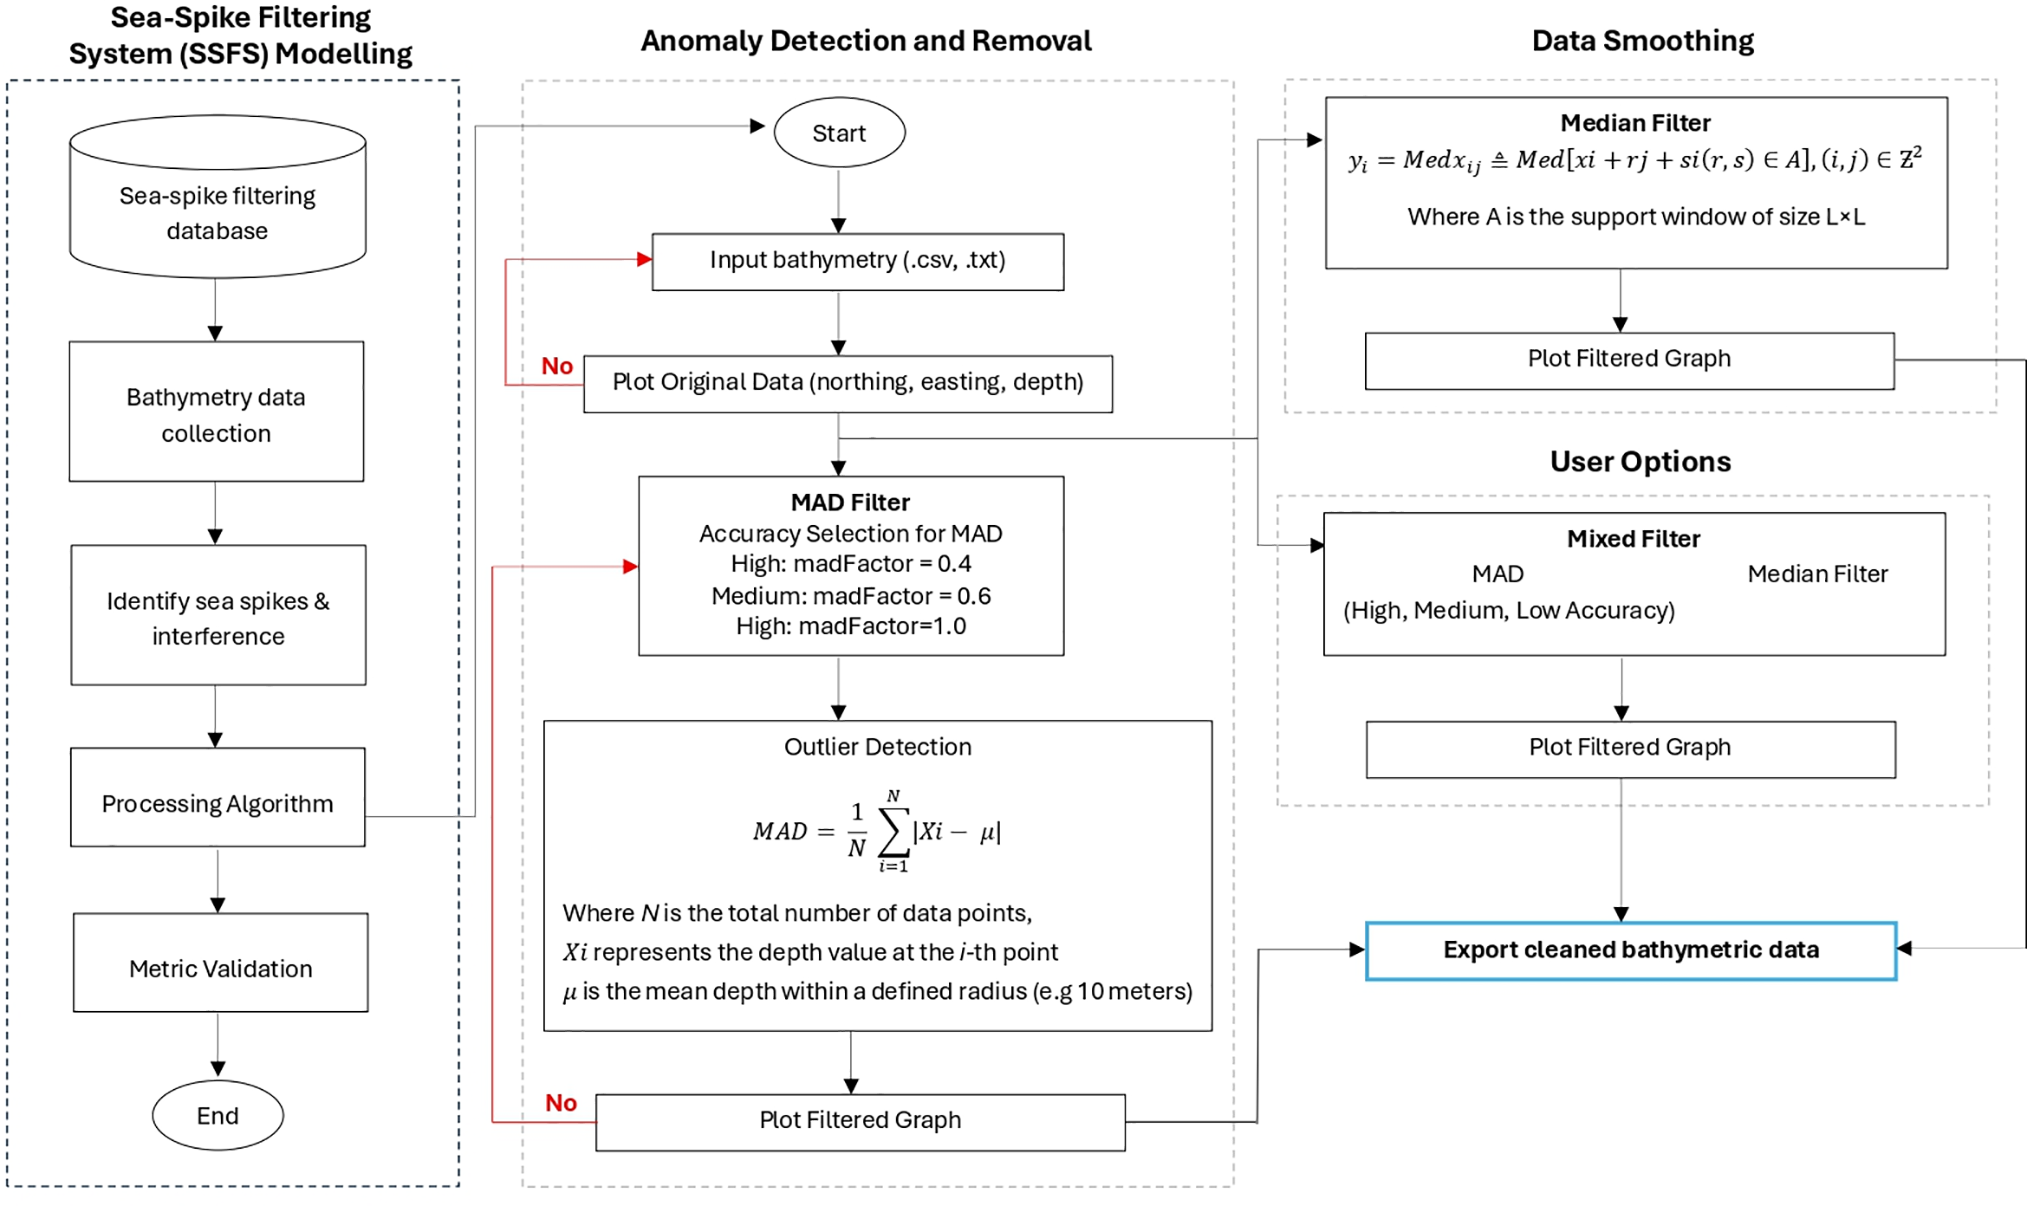
Figure 5: The flowchart of the system development SSFS
The system was designed to meet functional and non-functional requirements, emphasizing noise filtering and compliance with IHO S-44 standards. Three filtering techniques were implemented: Mean Absolute Deviation (MAD) Filtering to detect outliers based on deviations from the median, Median Filtering to suppress high-frequency noise using a moving window, and Mixed Filtering, which combined both methods for optimal noise reduction while preserving seabed integrity. Customizable parameters, such as mad Factor and radius, allowed users to adjust filtering intensity. Additionally, the system prioritized usability, computational efficiency, and compatibility with common file formats (CSV, TXT) to ensure seamless integration into hydrographic workflows.
After that, the filtering algorithms were employed for cleaning up the dataset and maintaining the seabed detail. It was a three-step process starting with an initial noise identification, and subsequently, implementation of filtering techniques and comparative analysis to recognize good noise removal without interruption of seabed relief. Filtering done, tidal correction was carried out for depth value synchronizing with known tidal range to remain consistent throughout the survey area. The last data set contained accurate seabed elevation measurements that made it suitable for use in marine navigation, dredging, and coastal engineering.
The system’s performance was then quantified using some of the important performance indicators such as Mean Absolute Deviation (MAD), Root Mean Square Error (RMSE), Mean Absolute Error (MAE), and Total Vertical Uncertainty (TVU) compliance. All these indicators tested the system’s accuracy to remove noise without sacrificing valid seabed data. TVU compliance was verified by comparing depth deviations with accuracy limits for Order 2, Order 1a, and Special-Order hydrographic surveys to ensure the dataset met international hydrographic standards. The validation confirmed that the dataset is suitable for use in marine and coastal environments. Like robust algorithms such as cBathy developed for nearshore bathymetric estimation in dynamic coastal environments [6], the SSFS aims to preserve measurement integrity while mitigating noise.
3 Sea-Spike Filtering System Algorithm Design
3.1 Mean Absolute Deviation for Sea-Spike Detection
The mean absolute deviation (MAD) is a tool used to detect the outlier (sea-spike data) from the bathymetry depth data. MAD is a measure of variability that indicates the average distance between observations and their mean. MAD uses the original units of the data, which simplifies interpretation. Larger values signify that the data points spread out further from the average. Besides that, a smaller value indicates that the data point clusters near it. The equation for the MAD is as follows [7]:
where N is the total number of data points,
The minimum threshold value represents the lower limit that the Mean Absolute Deviation (MAD) cannot fall below, while the maximum threshold value defines the upper limit that cannot be exceeded. Establishing these boundaries is critical for maintaining the data set within specific parameters, ensuring consistency in data analysis and the accurate identification of outliers. To determine these boundaries for the MAD, the standard deviation of the average must be precisely 0.5 m within a 10-m radius, as illustrated in Fig. 6. The MAD quantifies variability by calculating the mean absolute difference between data points and their mean, providing a robust metric that is resistant to the influence of outliers. The standard deviation (σ) relationship between the Mean Absolute Deviation (MAD) is normally distributed with approximately 1.25 times the MAD, σ ≈ 1.25 × MAD. The standard deviation can be derived with the formula of [8]:
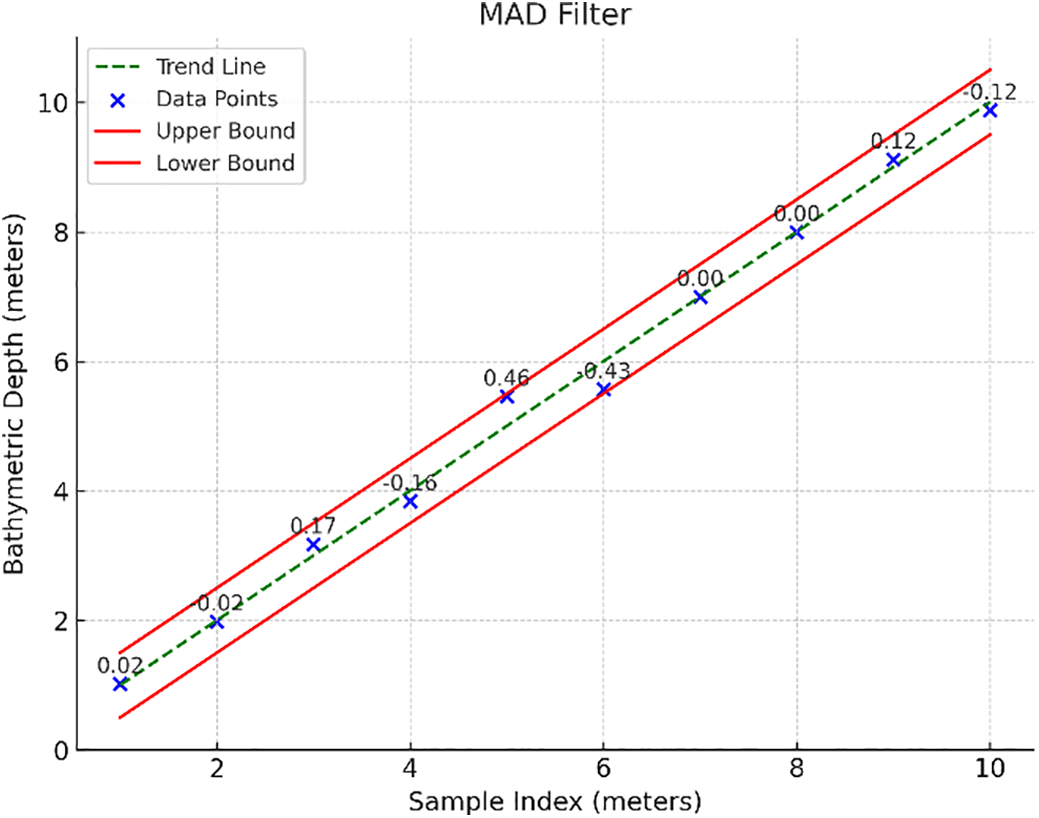
Figure 6: The illustration of MAD filter in outliers’ detection
where N is the total number of data points,
To calculate the lower bound and upper bound, the relationship between the standard deviation and the MAD can be used. Given the standard deviation constraint (σ = 0.5), to solve for the lower bound and upper bound of the MAD: MAD ≈
3.2 Median Filter in Outlier Mitigation
In bathymetric data processing, median filtering has been utilized extensively due to its ability to reduce high-frequency noise while maintaining morphological traits, especially when used in directional or regional-residual contexts [11]. Median filtering is a nonlinear signal processing method effective for reducing impulsive or “pepper-and-salt” noise while preserving signal boundaries, which is crucial for bathymetric data where edges may represent rocks or crevices. The median of a set of numbers
where
Meanwhile, the 2-D filtering that is applied to a surface (seabed), the median filter response is:
where A is the support window of size L × L.
When applying a median filter, the pictured covered by a window that slides over it. The output value for the set of samples being processed is determined by the median value of the samples inside the window. The filter window’s size is a crucial component of a median filter. Trying multiple median filters with varying window sizes and selecting the best of the resulting surfaces is helpful because it might be challenging to determine the ideal window size in advance [12].
The median filter combats this issue by replacing each data point with median of its neighbouring points within a predefined window. This non-linear filtering technique is effective in removing outliers without excessively smoothing data, thereby preserving critical details in the depth measurement [11,12]. To apply a median filter to single beam bathymetry data, one first must select an appropriate window size, typically an odd number such as 3, 5 or 7. The window size selected will determine the number of adjacent data points to consider for each analysis. As the window is moved through the dataset, the interior depth values are selected in ascending order and the median is selected, the median is less affected by outliers than the mean. As a result, the average value of the window is replaced by this average, effectively reducing the peaks in the sea while maintaining the overall structure of the data [12]. The result of the application is as illustrated in Fig. 7.
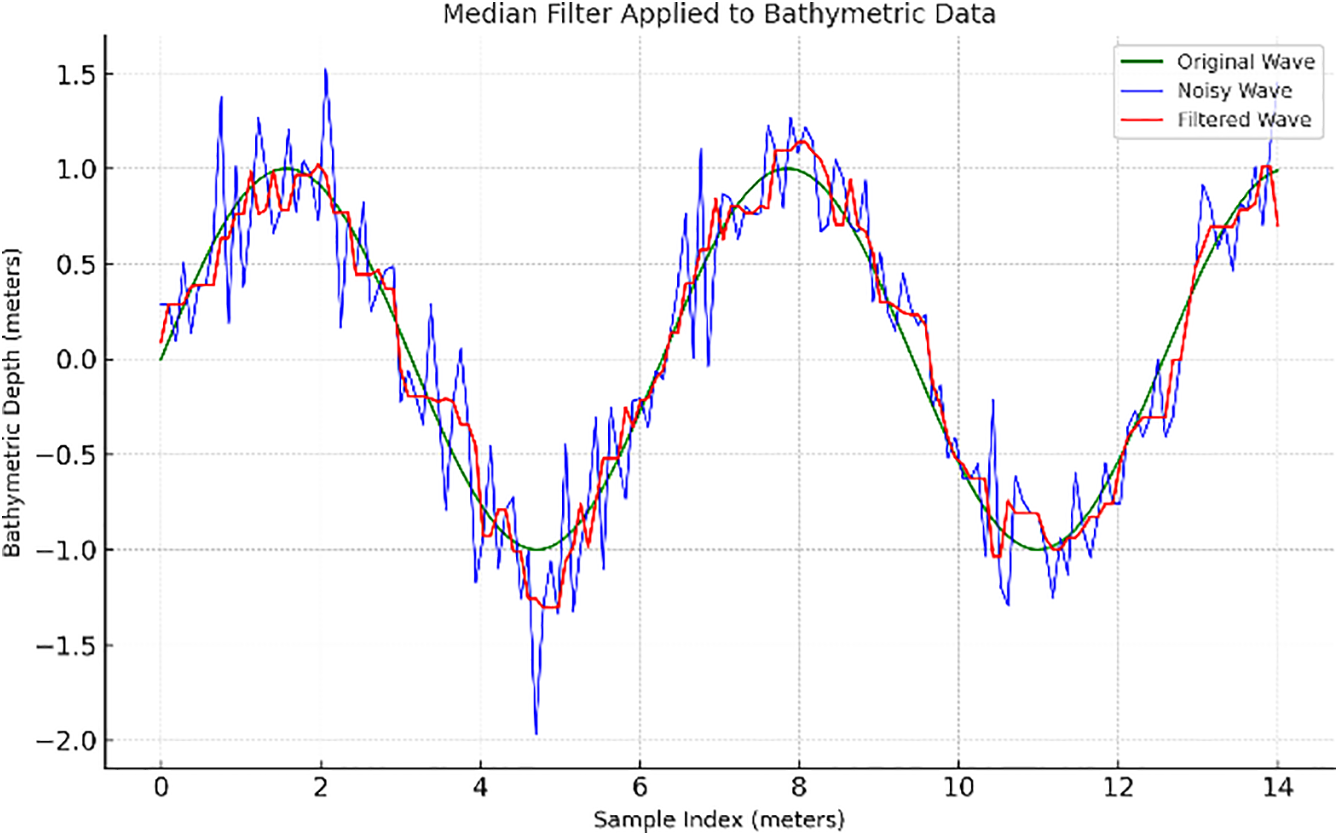
Figure 7: The illustration of median filter application in bathymetric data
Validation of the filtered dataset produced by the Sea-Spike Filtering System (SSFS) is a critical step to ensure its accuracy and reliability, particularly in the context of single beam echo sounder (SBES) data. The inherent limitations of SBES, such as sparse spatial coverage and susceptibility to noise and environmental disturbances, make it essential to rigorously assess the system’s effectiveness in mitigating sea spikes and maintaining depth measurement integrity. This validation method employs a combination of Root Mean Square Error (RMSE), Mean Absolute Error (MAE) and Total Vertical Uncertainty (TVU) metrics.
The RMSE measures the average magnitude of errors between the filtered and reference datasets, emphasizing larger deviations due to the squaring operation as stated in Eq. (5). The RMSE is particularly useful for evaluating the effectiveness of the SSFS in minimizing large deviations caused by sea spikes. For SBES, achieving a low RMSE is crucial as the sparsity of data points makes each measurement more significant compared to the denser datasets from MBES systems. A lower RMSE indicates that the SSFS has successfully aligned the filtered SBES depths with the high-resolution MBES benchmarks [13].
where n is the number of data points,
The other method of validation is the Mean Absolute Error (MAE) where it provides a balance measure of overall error by averaging the absolute differences between the filtered and reference datasets as shown in Eq. (6). Unlike RMSE, MAE treats all deviations equally, making it useful for evaluating the system’s consistency in noise reduction across the entire dataset. This metric ensures that the SSFS maintains uniform accuracy, which is critical for generating reliable bathymetric profiles from SBES data [14]. The MAE is calculated as follows:
where n is the number of data points,
The Total Vertical Uncertainty (TVU) is used to assess the compliance of the filtered SBES data with international hydrographic survey standards, specifically those outlined in the IHO S-44, Edition 6.2.0, October 2024, Standards for Hydrographic Survey guidelines as can be referred to in Table 1. The TVU accounts for both depth-independent and depth-dependent uncertainties, combining them into a single measure [15].
where a represents the depth-independent uncertainty,

b is the depth-dependent coefficient,
d is the measured depth.
The filtered bathymetry data accuracy was categorized into three levels: low, medium, and high which are based on the IHO standards. For low accuracy (Order 2), the TVUmax at a 10-m depth is set to 1.0 m. For medium accuracy (Order 1b and 1a), the TVUmax is 0.5 m, while for high accuracy (Special Order), it is set to 0.25 m. These accuracy levels allow users to select the appropriate data quality based on the site’s specifications and project requirements. Maintaining the geomorphological integrity of the seabed is critical for accurate landform characterization, as supported by GIS-based tools such as CoMMA which rely on clean and precise bathymetric data to map and quantify marine topography [16].
4.1 The Sea-Spike Filtering System (SSFS) Overview
The Sea Spike Filtering System is a tool designed to improve the quality of bathymetry data by detecting and filtering noise, particularly sea spikes, and validating results against IHO S-44 hydrographic standards. Bathymetry data, essential for marine navigation and engineering, often suffers from inaccuracies caused by environmental noise, sensor errors, or collection processes. This system addresses these challenges, ensuring filtered data meets the required accuracy levels.
The system employs three filtering methods: Median Absolute Deviation (MAD), Median, and Mixed filtering. The MAD filter effectively identifies and reduces outliers by analysing statistical deviations within a defined radius. The Median filter smooths the data by replacing each point with the median value of a surrounding window, while the Mixed filter combines both methods, first removing outliers with MAD and then smoothing the data with the Median filter. These options allow flexibility to handle varying noise patterns.
Key metrics, including MAD, Root Mean Square Error (RMSE), Mean Absolute Error (MAE), and Total Vertical Uncertainty (TVU) compliance, are calculated to evaluate the system’s performance. Compliance with IHO standards is validated by categorising data into accuracy levels such as Order 2, Order 1a, and Special Order. The system’s user-friendly interface enhances data analysis with visualisations of original and filtered signals, 3D scatter plots, and bounds to show how noise is managed. With the ability to load, filter, and save data, this system provides a robust platform for improving marine survey quality (Fig. 8).
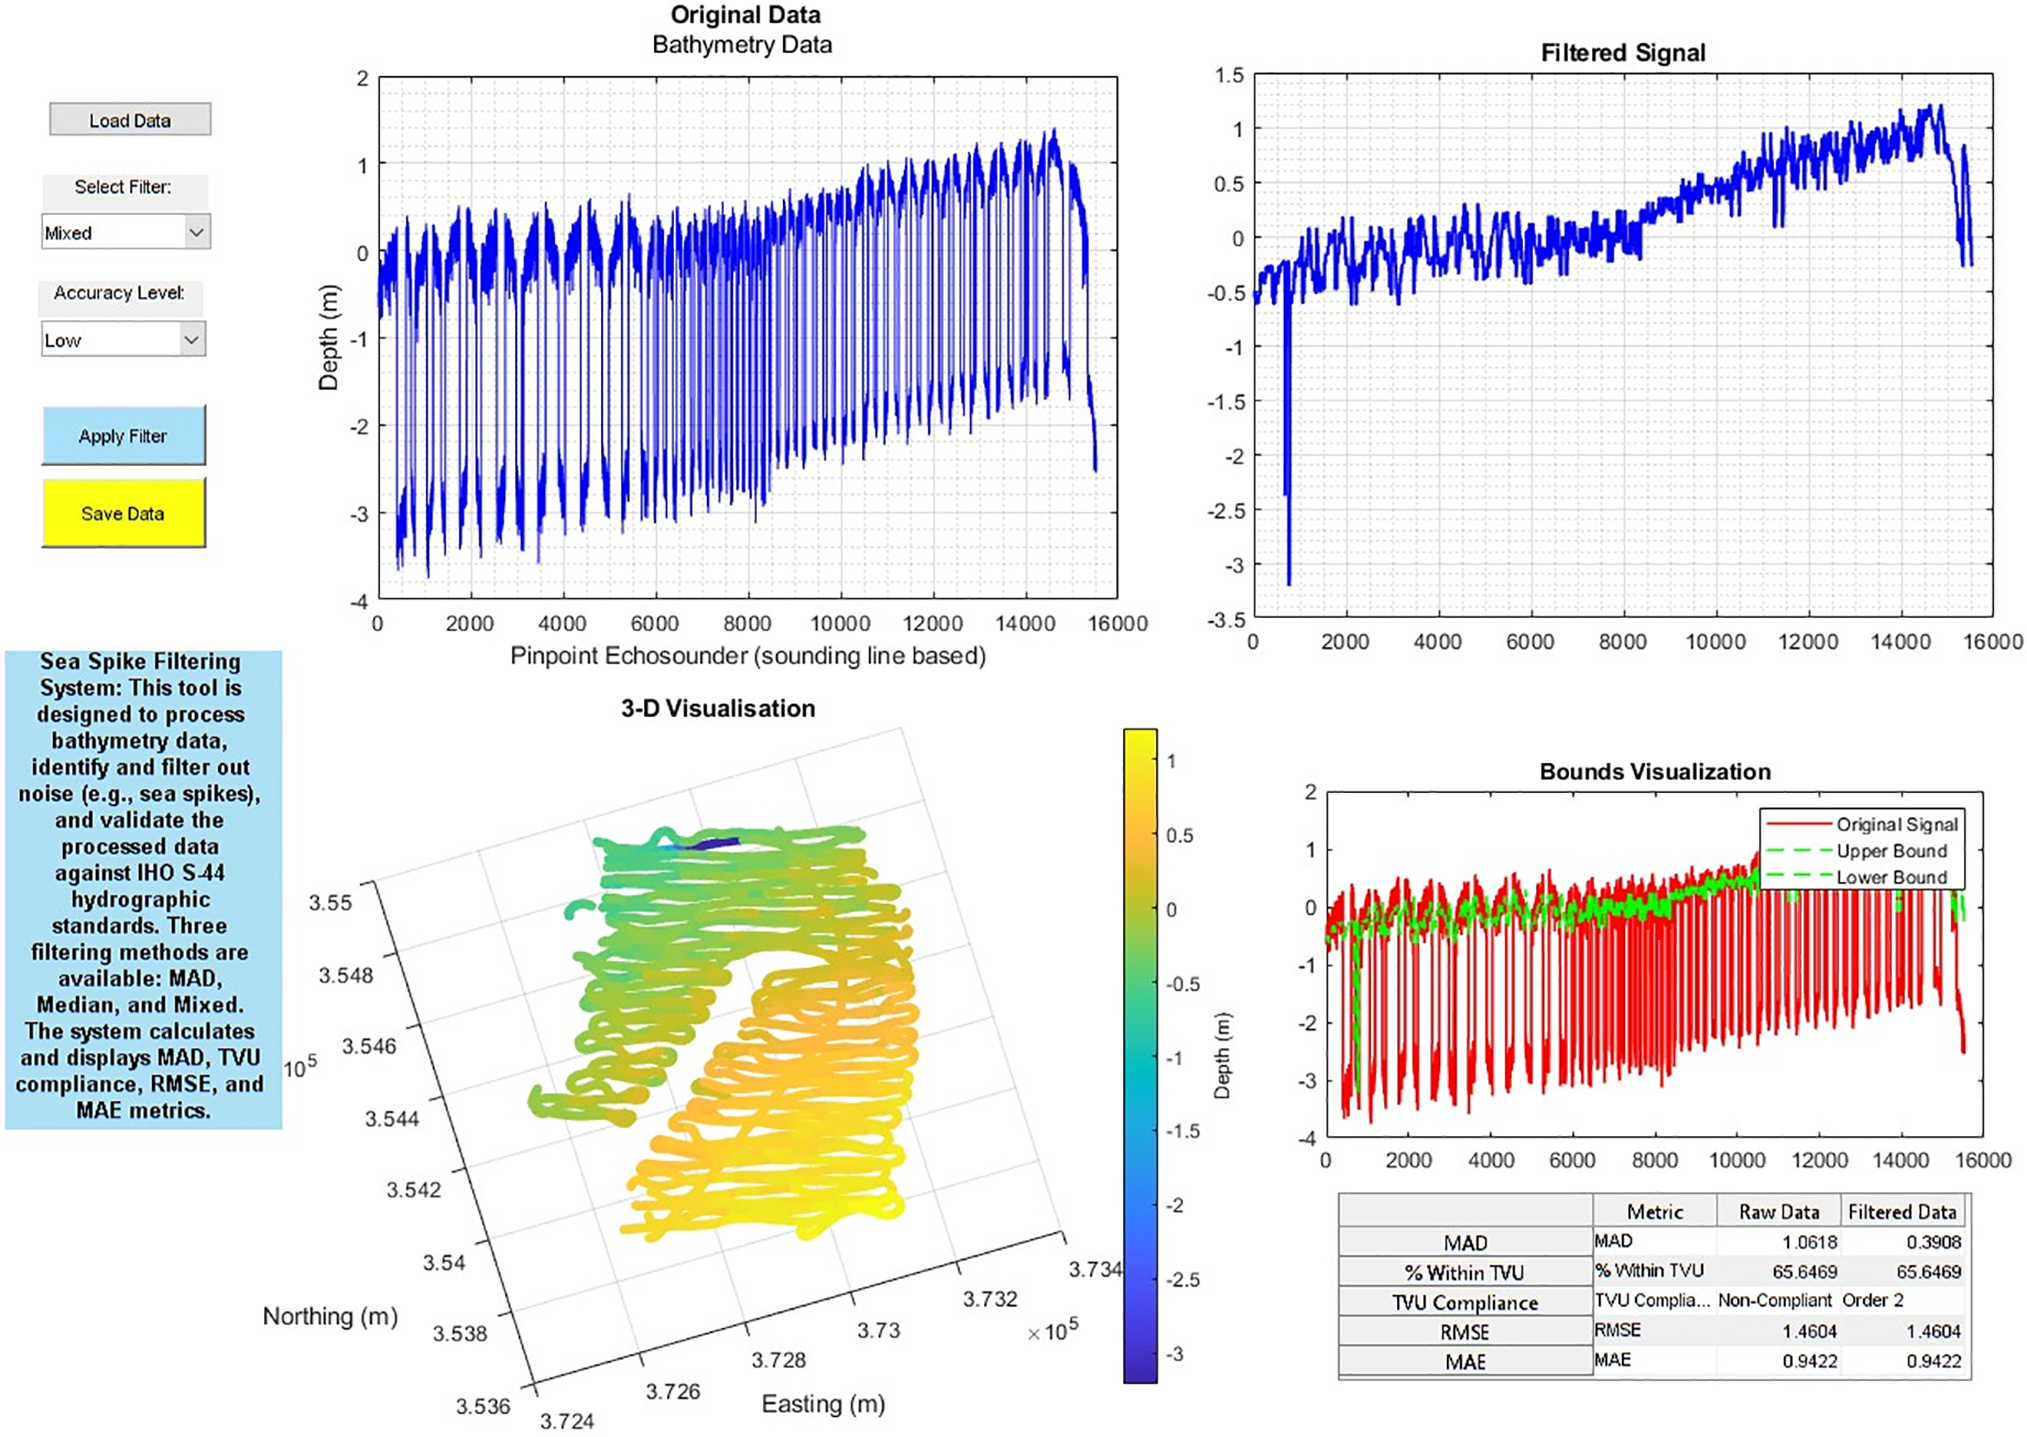
Figure 8: The illustration of system interface in MATLAB
4.2.1 Mixed Filter at Three Accuracy Levels
The Mixed Filtering technique integrates the strengths of Mean Absolute Deviation (MAD) Filtering and Median Filtering to effectively reduce noise while maintaining the integrity of essential seabed features. By adjusting the MAD factor, the filtering process can be fine-tuned to achieve different levels of accuracy, balancing noise removal with data preservation. The results for High, Medium, and Low Accuracy Levels illustrate the impact of varying MAD factor values on the quality of processed bathymetric data.
At the High Accuracy Level, the MAD factor is set to 0.2, which results in a significant reduction of sea spikes while maintaining the integrity of actual depth values as viewed in Fig. 9. This setting ensures that the dataset adheres closely to hydrographic standards, as seen in the improved Total Vertical Uncertainty (TVU) compliance. Additionally, Root Mean Square Error (RMSE) and Mean Absolute Error (MAE) values decrease, reflecting an overall enhancement in data accuracy. This level of filtering is particularly useful for applications requiring precise seabed mapping and navigation.

Figure 9: The illustration of mixed filter with high accuracy
For the Medium Accuracy Level, the MAD factor is adjusted to 0.5, striking a balance between noise reduction and data preservation. While the technique effectively minimizes most sea spikes, some minor noise artifacts remain within the dataset. Despite this, TVU compliance shows notable improvement compared to raw data, making this level of filtering a suitable compromise between accuracy and computational efficiency. At the Low Accuracy Level, the MAD factor is set to 0.7, allowing for a more aggressive filtering approach as viewed in Fig. 10. While this setting efficiently removes sea spikes, there is a slight risk of data distortion, as some finer seabed features may be altered. Nevertheless, the processed dataset still meets Order 2 compliance standards, though the RMSE and MAE values are slightly higher than those observed at higher accuracy levels.
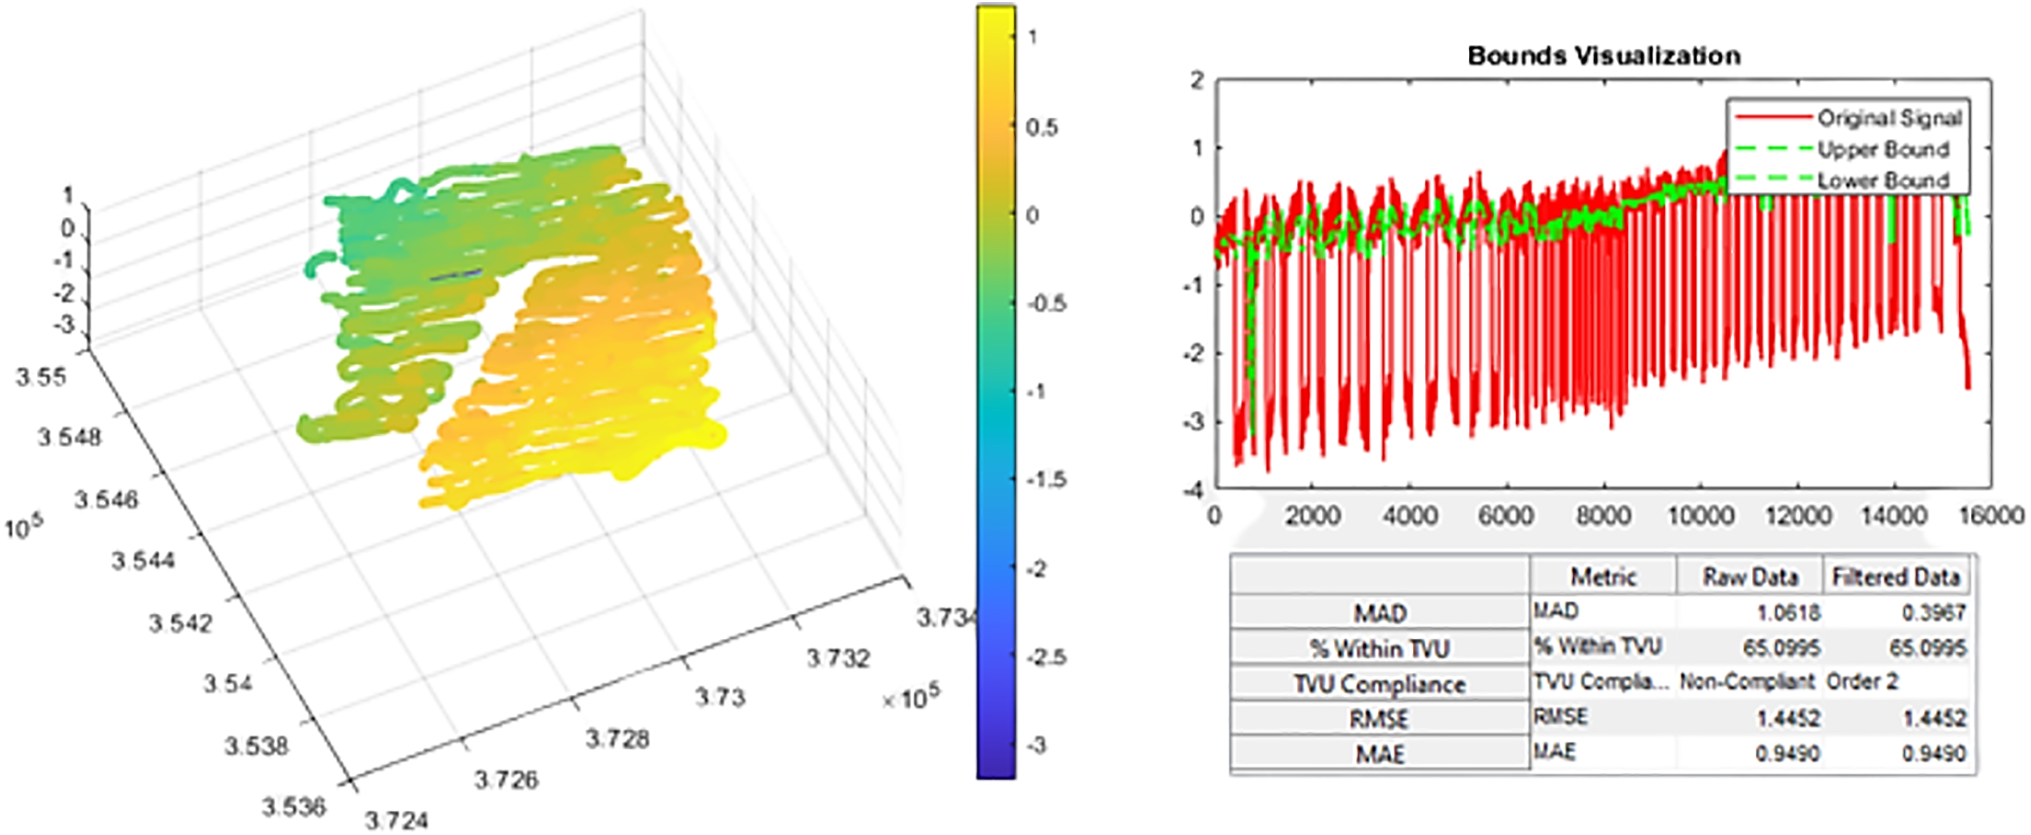
Figure 10: The illustration of mixed filter with low accuracy
4.2.2 The Outcomes of Median Filter
The Median Filtering technique is a widely used method for noise reduction in bathymetric data, employing a moving window function to suppress high-frequency noise and smooth depth variations. While it is effective in reducing abrupt fluctuations caused by environmental and instrumental factors, it is inherently less adaptive to extreme outliers compared to the Mixed Filtering approach. Nonetheless, it remains a valuable technique for enhancing data quality in hydrographic surveys (Fig. 11).
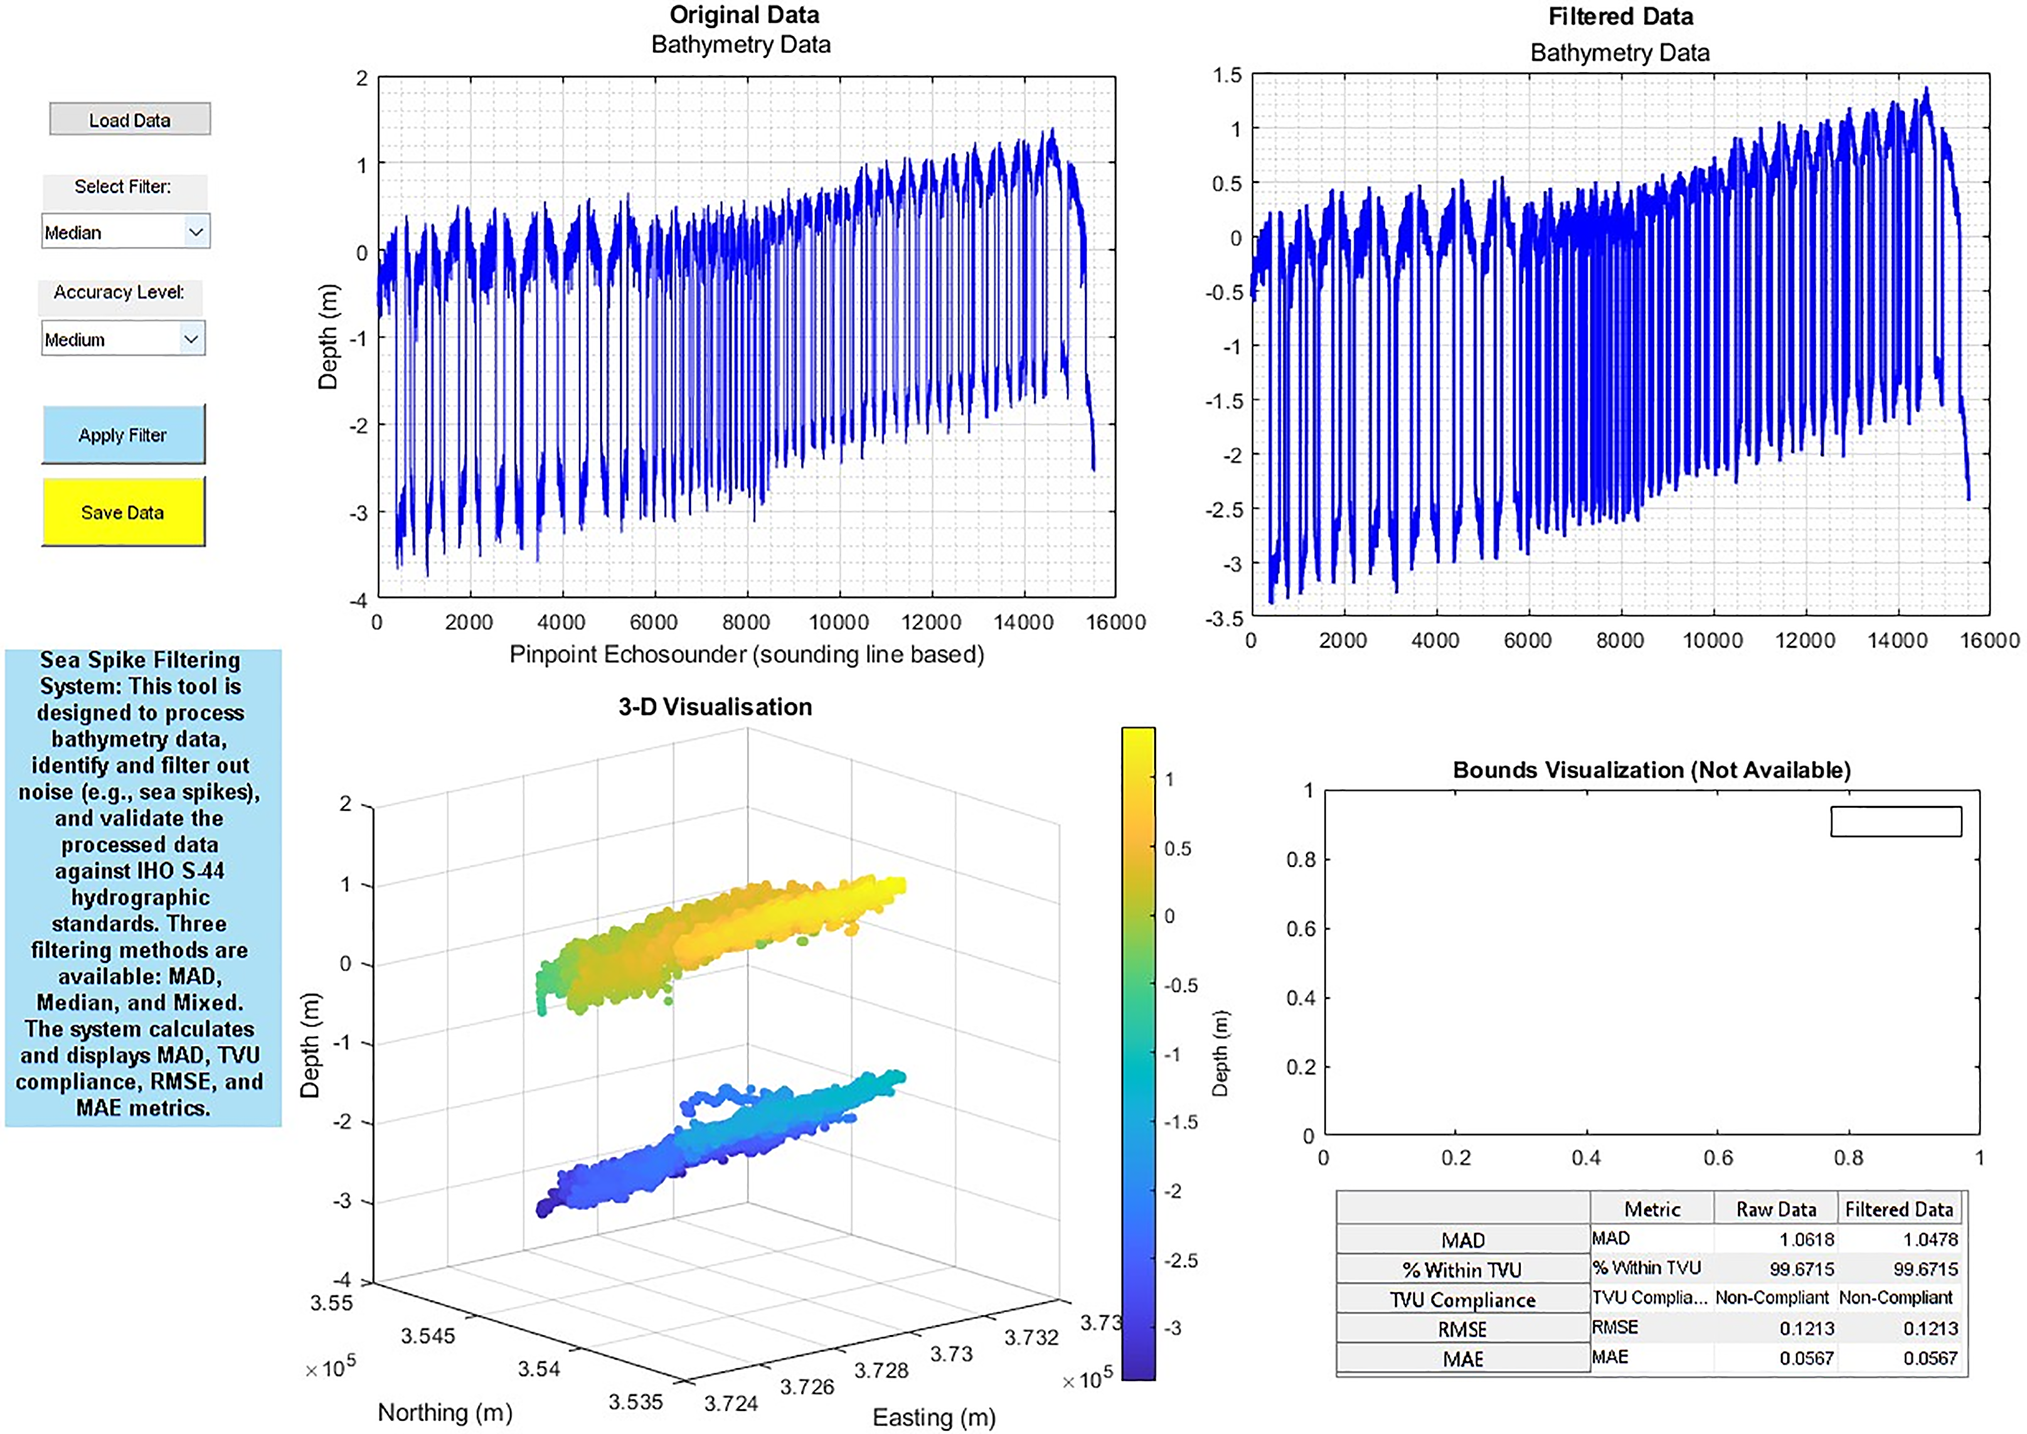
Figure 11: The illustration of median filter application on bathymetric data
The results indicate that Median Filtering significantly reduces noise spikes while maintaining the overall depth trend, contributing to a smoother and more stable depth profile as illustrated in Fig. 9. This effect is particularly beneficial in mitigating rapid depth variations introduced by wave action, sensor noise, or water column disturbances. The smoothing effect helps improve the interpretability of bathymetric datasets, especially in applications requiring continuous depth consistency. However, despite its strengths, Median Filtering exhibits limitations in handling extreme outliers, as it does not account for localized statistical variations in the dataset. Unlike Mean Absolute Deviation (MAD) Filtering or Mixed Filtering, which adaptively identify and remove extreme deviations, Median Filtering applies a uniform approach that may retain certain outlier artifacts. Consequently, while the technique contributes to Total Vertical Uncertainty (TVU) compliance, its effectiveness in ensuring adherence to hydrographic accuracy standards is not as extensive as that of Mixed Filtering. Given its computational efficiency and simplicity, the Median Filtering approach is particularly useful in cases where a straightforward noise suppression method is required. However, for datasets with highly irregular sea-spike occurrences, a more adaptive technique such as Mixed Filtering is recommended to achieve better accuracy, noise reduction, and compliance with hydrographic standards.
4.2.3 Comparison Result Overview in Global Mapper
The seabed features remained intact during the bathymetric survey alongside the filtering process which showed how the system cut down on sound disturbances effectively. Comparison between unprocessed and processed data shows a major decrease in high-amplitude sea spike errors which naturally corrupt depth measurement accuracy and data precision. The raw dataset presented depth values stretching from −3.8 m to 1.5 m prior to filtering occurred. Environmental disturbances consisting of wave action together with turbulence and sensor-related errors triggered these observed changes in the data. The filtering process created an acceptable depth zone of −3.2 m through 1.0 m because it correctly eliminated invalid data points while preserving actual bathymetric differences. The refined dataset had improved depth transition smoothness across regions where extreme anomalies had previously existed. The improvement is highlighted through depth gradient visualization implemented with color-coding. The raw dataset displays irregular colour layouts together with conflicting edges that reflect significant noise interferences. The processed dataset displays a standard colour transition that enables better seafloor observation (Figs. 12 and 13).
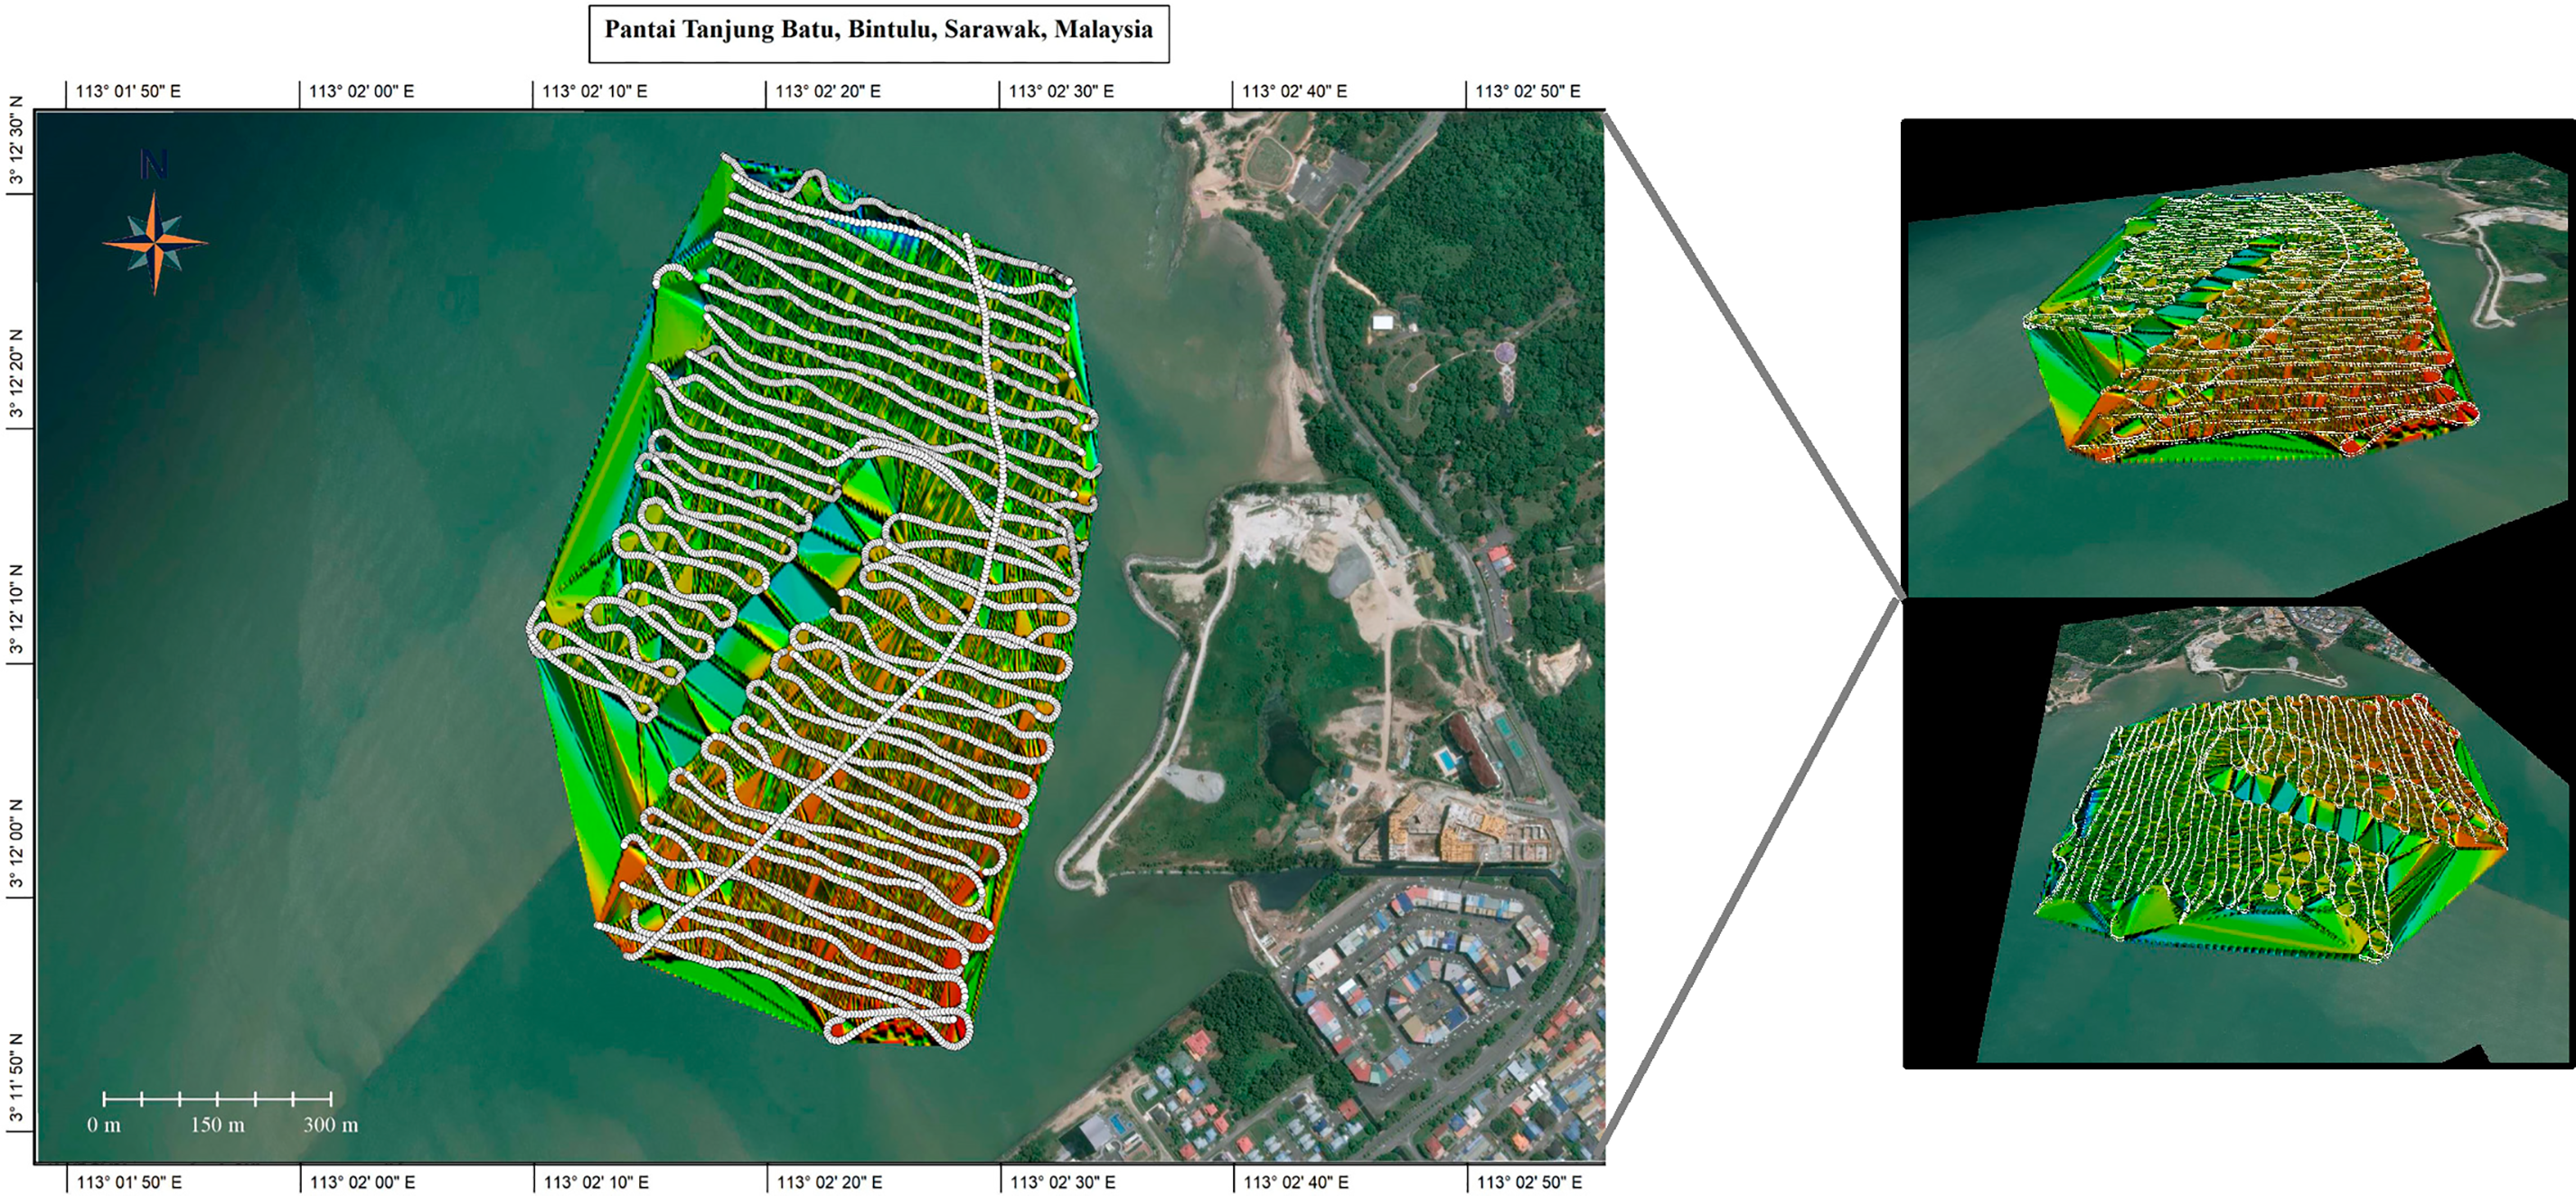
Figure 12: The illustration of unfiltered bathymetric data in Global Mapper 3-D view
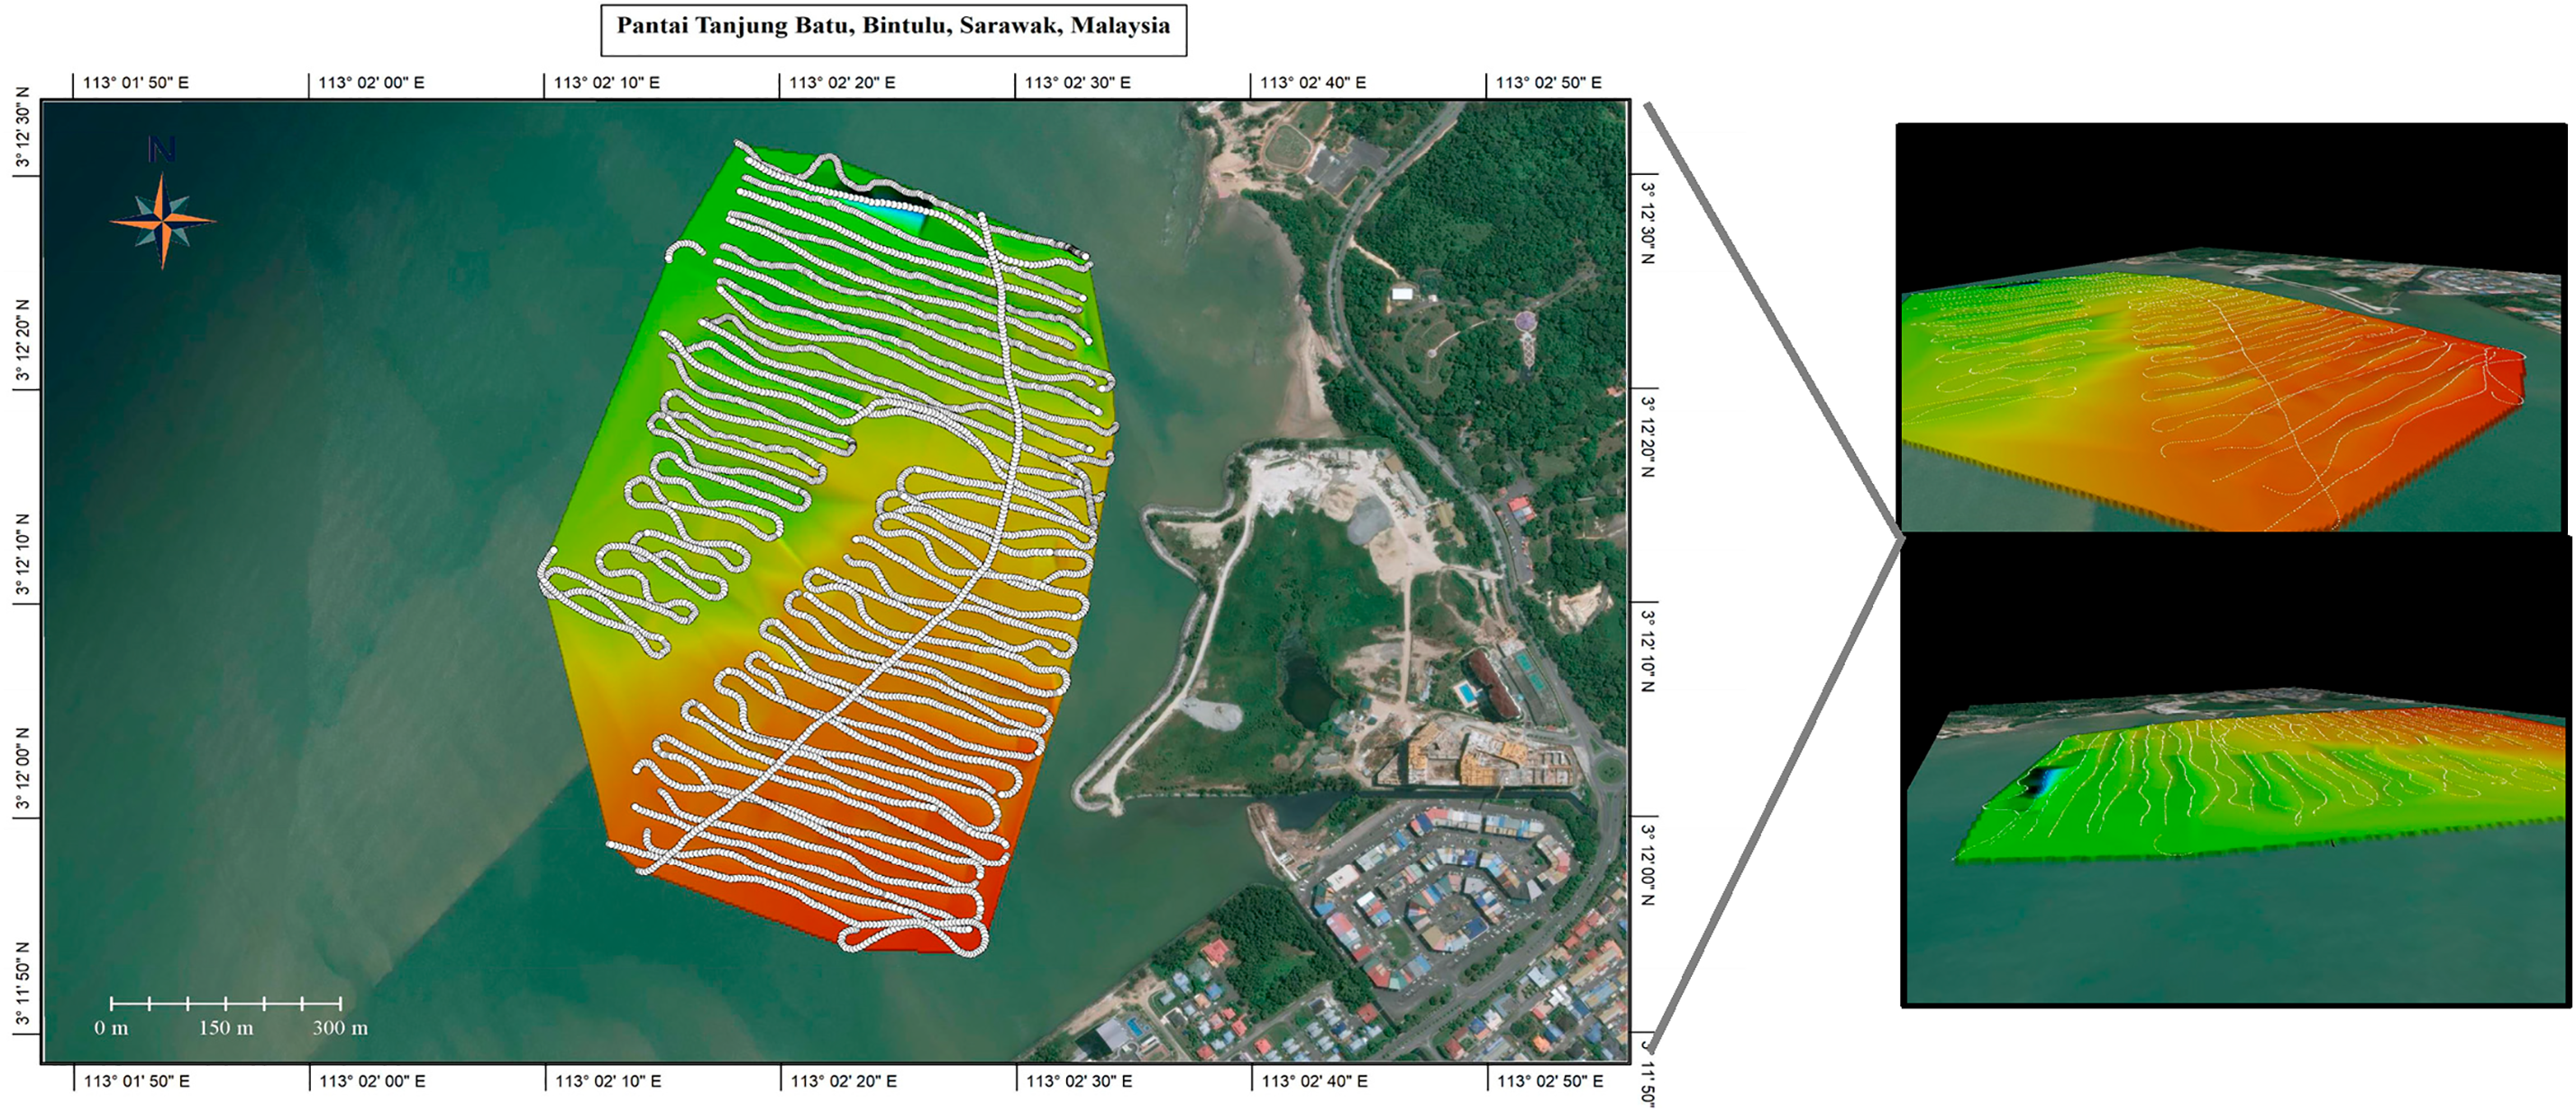
Figure 13: The illustration of filtered bathymetric data in Global Mapper 3-D view
4.2.4 Residual Error and Detection Efficiency
The Sea-Spike Filtering System (SSFS) generated superior bathymetric data through its ability to remove extreme outliers yet keep the seabed continuous. The system met IHO Order 2 TVU guidelines at 59.39% while lowering MAD values from 1.0618 to 0.4314, thus demonstrating a substantial reduction in noisy data. The Root Mean Square Error (RMSE) and Mean Absolute Error (MAE) stayed constant at 1.4188 and 0.9663 m respectively showing that the system reduced extreme variations but left some variations in depth data as can be seen in Table 2. The data filtering approach with MAD and Median Filter methods improved the data stability while removing anomalous spikes, which validated their application success. The system demonstrates exceptional performance in noise reduction because the depth range analysis confirms these findings. The initial depth values measured from 3.8 to 1.5 m reflected major variations that occurred because of sea spikes. The filtering process decreased the overall depth range from 3.2 to 1.0 m without distorting the natural seabed morphology, thus removing extreme outliers that affected the survey. The bathymetric data becomes more suitable for hydrographic applications through the reduced depth variations detected by the system.

The TVU compliance improved through all filtering methods, even though no technique achieved full compliance with IHO S-44 precision standards. Through the Mixed approach, researchers achieved the best compliance rate by decreasing extreme deviations while keeping accurate results. The MAD method performed well at noise reduction, however it occasionally corrupted authentic seabed points that affected the final compliance scores. Although keeping more original data properties, the Median filtering method proved to be less efficient at eliminating extreme outlier points. The SSFS proved successful at reducing sea-spike errors while improving the reliability of bathymetric data, while preventing overly smooth data results. The system improved seabed topography visualization but did not meet all the demanding requirements from the International Hydrographic Organization S-44. The system could achieve higher precision hydrographic survey capabilities through the implementation of additional developments like adaptive thresholding in combination with iterative filtering and machine learning-based anomaly detection.
This research presented the Sea-Spike Filtering System (SSFS), which functions as a semi-automated method to identify and eliminate sea-spike outliers that appear in Single Beam Echo Sounder (SBES) obtained bathymetric data. Three filtering methods known as Mean Absolute Deviation (MAD) Filtering and Median Filtering and Mixed Filtering blended into the system for effective noise suppression and genuine seabed feature protection. The methodology achieved extensive testing by applying it to bathymetric data from Bintulu, Sarawak, where marine conditions show constant changes alongside numerous high-amplitude anomalies.
Noise reduction resulted in improved data quality based on the results, which showed MAD values moving from 1.0618 to 0.4314. The IHO Order 2 Total Vertical Uncertainty (TVU) standards showed that the filtered data reached 59.39% compliance, so it proved effective for general hydrographic survey work. The system managed to improve data consistency for coastal management and resource conservation while sustaining RMSE at 1.4188 m and MAE at 0.9663 m by successfully addressing extreme outliers in the data.
The SSFS system failed to satisfy the IHO Order 1a and Special-Order standards that are necessary for critical shallow-water navigation operations. Although, it still offers a practical solution for less demanding survey conditions, particularly in developing regions or settings with limited access to high-cost equipment. Additional improvement measures such as machine learning-together with iterative data correction and integrating advanced signal processing techniques such as wavelet transform-based threshold filtering may further enhance the ability of the system [17]. We should consider the addition of multi-frequency sounders or advanced technology such as interferometric echo sounding, which utilize direction of arrival estimation to our development stages to enhance our depth estimation capabilities in different seabed situations [18] Furthermore, incorporating techniques such as weighted local linear regression with equality constraints as demonstrated in image edge analysis [19], may offer improved accuracy distinguishing seabed features.
The Sea-Spike Filtering System (SSFS) represents a reliable operational method that enhances bathymetric data quality excellence in restricted marine settings where resources are limited. The automated filtering function of SSFS simplifies sound quality control, which results in time-efficient hydrographic surveys while maintaining high accuracy and reliability. Future optimization efforts will enable SSFS to deliver higher precision results, thus establishing it as a vital instrument for scientific investigations of marine construction and safety-related operations.
Acknowledgement: The authors express their sincere gratitude to Universiti Teknologi Malaysia (UTM) for its support and research environment. Appreciation is extended to the Geomatic Innovation Research Group (GnG) and the Geospatial Imaging & Information Research Group (Gi2RG) for providing essential facilities and technical support. The authors also acknowledge and extend their heartfelt thanks to the financial assistance from the Nexus Young Researcher (NYR) grant.
Funding Statement: This research was financially supported by the Nexus Young Researcher (NYR) grant, awarded by Universiti Teknologi Malaysia (UTM) for the period of 2024–2026. The grant was provided under Vote Number Q.J130000.3852.42J12. Additional funding was provided through the grant SWK 10.1: The Establishment of a Seamless Vertical Datum for Marine Geospatial Data Reference, under Vote Number R.J130000.7309.1R059. The authors gratefully acknowledge this support, which played a crucial role in facilitating the successful execution of this study.
Author Contributions: We hereby declare that this article is the result of a collaborative work between the following authors: Study design, data collection and analysis, writing of the article: Nurfazira Mohamed Fadil, Kelvin Kang Wee Tang, Malavige Don Eranda Kanchana Gunathilaka, Abdullah Hisam Omar, Muhammad Fahim Supian; draft manuscript preparation and substantial revision of the article: Nurfazira Mohamed Fadil, Kelvin Kang Wee Tang, Malavige Don Eranda Kanchana Gunathilaka. All authors reviewed the results and approved the final version of the manuscript.
Availability of Data and Materials: The data for this research can be made available upon request.
Ethics Approval: Not applicable.
Conflicts of Interest: The authors declare no conflicts of interest to report regarding the present study.
References
1. Ferreira IO, de Paula dos Santos A, de Oliveira JC, das Graças Medeiros N, Emiliano PC. Robust methodology for detection of spikes in multibeam echo sounder data. Bol Ciênc Geod. 2019;25(3):e2019014. doi:10.1590/s1982-21702019000300014. [Google Scholar] [CrossRef]
2. Calder BR, Smith S. A time/effort comparison of automatic and manual bathymetric processing in real-time mode. In: Proceedings of the US Hydro 2003 Conference. Biloxi, MS, USA: The Hydrographic Society of America; 2003. [Google Scholar]
3. Šiljeg A, Marić I, Domazetović F, Cukrov N, Lovrić M, Panđa L. Bathymetric survey of the St. Anthony channel (Croatia) using multibeam echosounders (MBES)—a new methodological semi-automatic approach of point cloud post-processing. J Mar Sci Eng. 2022;10(1):101. doi:10.3390/jmse10010101. [Google Scholar] [CrossRef]
4. Mayashari M, Herdiani ET, Anisa A. Comparison of control chart x− based on median absolute deviation with s. J Math Its Appl. 2024;18(2):737–50. doi:10.30598/barekengvol18iss2pp0737-0750. [Google Scholar] [CrossRef]
5. Calder BR, Mayer LA. Automatic processing of high-rate, high-density multibeam echosounder data. Geochem Geophys Geosyst. 2003;4(6):1–22. doi:10.1029/2002GC000486. [Google Scholar] [CrossRef]
6. Holman R, Plant N, Holland T. cBathy: a robust algorithm for estimating nearshore bathymetry. J Geophys Res Ocean. 2013;118(5):2595–609. doi:10.1002/jgrc.20199. [Google Scholar] [CrossRef]
7. Khair U, Fahmi H, Al Hakim S, Rahim R. Forecasting error calculation with mean absolute deviation and mean absolute percentage error. J Phys Conf Ser. 2017;930:012002. doi:10.1088/1742-6596/930/1/012002. [Google Scholar] [CrossRef]
8. Devore JL. Probability and statistics for engineering and the sciences. 10th ed. Andover, UK: Cengage Learning; 2020. [Google Scholar]
9. Hampel FR, Ronchetti EM, Rousseeuw PJ, Stahel WA. Robust statistics: the approach based on influence functions. Hoboken, NJ, USA: John Wiley & Sons, Inc.; 1986. [Google Scholar]
10. Jamshidi EJ, Yusup Y, Kayode JS, Kamaruddin MA. Detecting outliers in a univariate time series dataset using unsupervised combined statistical methods: a case study on surface water temperature. Ecol Inform. 2022;69(3):101672. doi:10.1016/j.ecoinf.2022.101672. [Google Scholar] [CrossRef]
11. Kim SS, Wessel P. Directional median filtering for regional-residual separation of bathymetry. Geochem Geophys Geosyst. 2008;9(3):Q03005. doi:10.1029/2007GC001850. [Google Scholar] [CrossRef]
12. Li Z, Peng Z, Zhang Z, Chu Y, Xu C, Yao S, et al. Exploring modern bathymetry: a comprehensive review of data acquisition devices, model accuracy, and interpolation techniques for enhanced underwater mapping. Front Mar Sci. 2023;10:1178845. doi:10.3389/fmars.2023.1178845. [Google Scholar] [CrossRef]
13. Gao W, Sun Y, Wang L, Wang S. VMDWT-based method for extracting on-the-fly GNSS tide level and its realization. Remote Sens. 2022;14(19):4816. doi:10.3390/rs14194816. [Google Scholar] [CrossRef]
14. Plant NG, Edwards KL, Kaihatu JM, Veeramony J, Hsu L, Holland KT. The effect of bathymetric filtering on nearshore process model results. Coast Eng. 2009;56(4):484–93. doi:10.1016/j.coastaleng.2008.10.010. [Google Scholar] [CrossRef]
15. IHO S-44 Edition 6.2.0. International hydrographic organization standards for hydrographic surveys. Monaco: International Hydrographic Organization; 2024. [Google Scholar]
16. Arosio R, Gafeira J, De Clippele LH, Wheeler AJ, Huvenne VAI, Sacchetti F, et al. CoMMa: a GIS geomorphometry toolbox to map and measure confined landforms. Geomorphology. 2024;458(120):109227. doi:10.1016/j.geomorph.2024.109227. [Google Scholar] [CrossRef]
17. Gao C, Zhou S. Wavelet transform threshold noise reduction methods in the oil pipeline leakage monitoring and positioning system. J Electron. 2010;27(3):405–11. (In Chinese). doi:10.1007/s11767-010-0407-6. [Google Scholar] [CrossRef]
18. Grall P, Kochanska I, Marszal J. Direction-of-arrival estimation methods in interferometric echo sounding. Sensors. 2020;20(12):3556. doi:10.3390/s20123556. [Google Scholar] [PubMed] [CrossRef]
19. Zhu M, Hu Y, Yu J, He B, Liu J. Find outliers of image edge consistency by weighted local linear regression with equality constraints. Sensors. 2021;21(7):2563. doi:10.3390/s21072563. [Google Scholar] [CrossRef]
Cite This Article
 Copyright © 2025 The Author(s). Published by Tech Science Press.
This work is licensed under a Creative Commons Attribution 4.0 International License , which permits unrestricted use, distribution, and reproduction in any medium, provided the original work is properly cited.
 Downloads
 Citation Tools