
 Submit a Paper
 Propose a Special lssue
 Open Access
ARTICLE

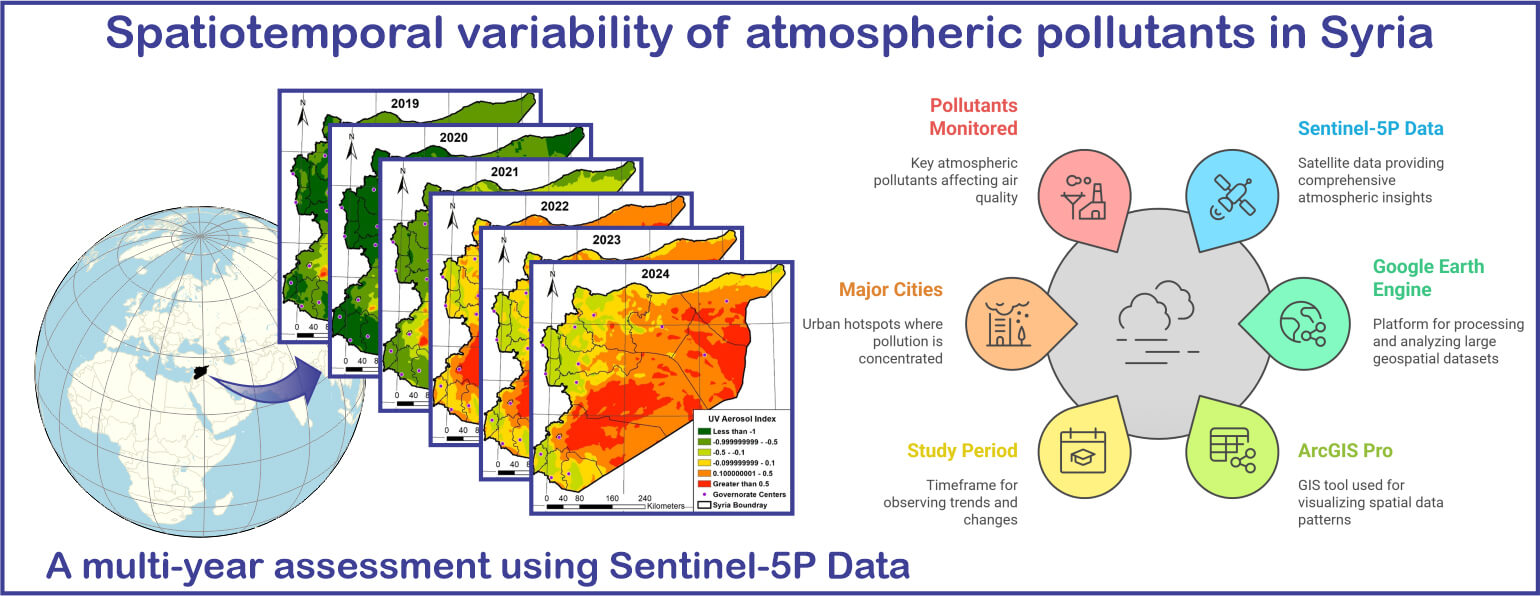
Spatiotemporal Variability of Atmospheric Pollutants in Syria: A Multi-Year Assessment Using Sentinel-5P Data
1 Department of Topography, Faculty of Civil Engineering, University of Aleppo, Aleppo, 12212, Syria
2 Laboratory of Architecture, Cities and Environment, Faculty of Civil Engineering and Architecture, Department of Hydraulic, Hassiba Benbouali University of Chlef, B.P. 78C, Ouled Fares, Chlef, 02180, Algeria
3 Faculty of Science, University of Technology Sydney, Sydney, NSW 2007, Australia
4 Department of Geography, Faculty of Arts and Humanities, Damascus University, Damascus, 1193, Syria
5 Department of Geography, Faculty of Arts and Humanities, Tartous University, Tartous, 96510, Syria
6 Department of Mathematics and Computer Science, Faculty of Material Sciences, Mathematics and Computer Science, University Ahmed Draia of Adrar, Adrar, 01000, Algeria
7 Energies and Materials Research Laboratory, Faculty of Sciences and Technology, University of Tamanghasset, Tamanghasset, 11000, Algeria
8 Department of Civil and Environmental Engineering, Federal University of Paraíba, João Pessoa, 58051-900, Paraíba, Brazil
9 Stokes School of Marine and Environmental Sciences, University of South Alabama, Mobile, AL 36688, USA
* Corresponding Author: Bilel Zerouali. Email:
(This article belongs to the Special Issue: Applications of GNSS Remote Sensing)
Revue Internationale de Géomatique 2025, 34, 669-689. https://doi.org/10.32604/rig.2025.067137
Received 25 April 2025; Accepted 29 July 2025; Issue published 19 August 2025
 View Full Text
 Download PDF
Abstract
This study investigates the spatial and temporal dynamics of key air pollutants—nitrogen dioxide (NO2), carbon monoxide (CO), methane (CH4), formaldehyde (HCHO), and the ultraviolet aerosol index (UVAI)—over the period 2019–2024. Utilizing high-resolution remote sensing data from the Sentinel-5 Precursor satellite and its TROPOspheric Monitoring Instrument (TROPOMI) processed via Google Earth Engine (GEE), pollutant concentrations were analyzed, with spatial visualizations produced using ArcGIS Pro. The results reveal that urban and industrial hotspots—notably in Damascus, Aleppo, Homs, and Hama—exhibit elevated NO2 and CO levels, strongly correlated with population density, traffic, and industrial emissions. Temporal trends indicate significant pollutant fluctuations linked to external factors such as economic activities and regulatory measures. Methane concentrations have shown a steady increase, driven by intensified oil refining, biomass burning, and agricultural practices. Formaldehyde levels initially declined—due to reduced industrial activity—before experiencing a moderate rebound, though remaining below 2019 levels overall. The UV aerosol index demonstrated marked variability, predominantly influenced by wind-driven dust transport, desert dust storms, and localized anthropogenic emissions. These findings underscore the intricate interplay between economic dynamics and environmental processes, highlighting the critical need for robust air quality management strategies.Graphic Abstract
Keywords
Air pollution is a pressing global issue with profound and far-reaching consequences. Its impacts transcend national borders, affecting human health, ecosystems, and the climate [1–4]. The health implications are particularly concerning, encompassing respiratory and cardiovascular diseases, as well as premature mortality linked to pollutant exposure [5]. Moreover, air pollution adversely affects biodiversity, degrades ecosystems, and contaminates soil and water resources [6]. Addressing this transboundary issue requires international cooperation to implement effective mitigation strategies [7]. These strategies include adopting cleaner technologies, promoting renewable energy sources, and enhancing air quality standards [8]. Public education and awareness are also essential in fostering environmentally responsible behavior.
Air pollution has profound implications, affecting both individual mental health and the large-scale movement of populations. With regard to mental health, exposure to air pollution has been associated with increased stress and anxiety, exacerbating the perception of environmental insecurity among residents in polluted areas [9]. Emerging evidence also links air pollution to neurological disorders such as depression and dementia, suggesting long-term mental health consequences [10]. Children are particularly vulnerable, as early exposure may negatively influence cognitive development and behavioral outcomes. In parallel, air pollution can drive population displacement [11]. For example, Ref. [12] showed demonstrated that increased air pollution and temperature variability were associated with a higher likelihood of declining mental health among more than 20,000 Chinese residents. Interestingly, no significant relationship was observed between mean temperature and mental health scores, while the influence of residential greenness varied depending on model specifications, indicating the need for further research. Similarly, Ref. [13] through exploratory analyses using two large and independent datasets—one comprising 151 million individuals from U.S.
Insurance claims and the other including 1.4 million individuals from Danish national treatment registers—found that environmental pollution contributes to an elevated risk of neuropsychiatric disorders. In heavily polluted regions, forced migration may become inevitable due to adverse health conditions, resulting in relocations to less polluted areas and increasing pressure on local resources. Moreover, environmental disasters related to air pollution, such as major industrial accidents, can necessitate emergency evacuations and resettlements [14]. Furthermore, air pollution is closely linked to greenhouse gas emissions, contributing to climate change and its associated phenomena, including climate-induced migration [15]. Thus, air pollution represents a multifaceted challenge extending well beyond environmental concerns. It has significant mental health and social consequences, underscoring the critical need for integrated mitigation strategies aimed at both protecting public health and managing environmentally driven population movements [16,17].
The battle against air pollution constitutes a major global challenge, prompting numerous countries to implement diverse and effective strategies to address this environmental threat [18]. These solutions are often tailored to the specific socioeconomic and environmental contexts of each nation [19]. The transition to renewable energy sources, such as solar and wind power, has become a central priority, reducing dependence on polluting fossil fuels [20]. Concurrently, investments in public transportation infrastructure and incentives for clean mobility have contributed to reducing the impact of individual vehicular emissions. Many countries have also enforced stringent air quality standards for both industrial processes and motor vehicles, while public awareness campaigns play a vital role in promoting behavioral change [21]. Additionally, continuous air quality monitoring and technological innovation are pivotal to tracking pollutants and implementing timely interventions. Nevertheless, international cooperation remains critical, as air pollution transcends national boundaries. By integrating these approaches, countries aim to significantly reduce pollution levels, improve public health, and protect environmental quality on a global scale [22]. In some countries, air pollution has reached alarming levels. For instance, Ref. [23] employed satellite data to monitor atmospheric pollutants and their relationship with meteorological parameters in Al-Qurayyat City, Saudi Arabia. The study reported elevated concentrations of NO2, SO2, and CO exceeding World Health Organization (WHO) limits. Correlation analyses indicated that while some pollutants share common emission sources, others originate from distinct activities, underscoring the complexity of local air pollution dynamics and the urgency for targeted mitigation strategies. In Ho Chi Minh City, Vietnam, Ref. [24] observed significant seasonal variations in NO2 concentrations, with higher levels during the dry season—reaching up to 70 μg/m3—and lower values during the rainy season. SO2 concentrations were more uniformly distributed across the area but increased notably in industrial zones, ranging from 0.1 to 1.37 mg/m3. Similarly, Ref. [25] examined the impact of COVID-19 lockdown measures on air quality in Anqing, Suzhou, and Hefei in central China. During the epidemic control period, the concentrations of PM2.5, PM10, SO2, CO, and NO2 significantly decreased, while O3 levels remained relatively stable. These findings highlight the measurable influence of human activity reductions on atmospheric pollution.
Research in air quality assessment is currently at the forefront of efforts to combat air pollution. Technological advancements have enabled the development of real-time monitoring systems, offering unprecedented precision and responsiveness in tracking atmospheric pollutant concentrations [26,27]. In parallel, sophisticated computational models are employed to simulate pollutant dispersion based on diverse environmental parameters, enhancing predictive capabilities [28]. Artificial intelligence (AI) and machine learning (ML) techniques are increasingly utilized to process large volumes of monitoring data, facilitating the identification of temporal trends and pollution sources [29,30]. Remote sensing technologies, including drones and satellites, further augment these efforts by providing comprehensive spatial coverage of air quality at multiple altitudes and across extensive geographic areas [31]. Concurrently, epidemiological studies investigate the associations between pollutant exposure and human health outcomes, while other research focuses on characterizing emission sources and the chemical composition of airborne pollutants.
In addition to satellite-based monitoring, ground-based emission inventories play a pivotal role in understanding air pollution sources and their spatial distribution. These inventories, often developed using a combination of transportation data, industrial activity, fuel consumption records, and land use classifications, provide essential input for air quality modeling and policy planning. In regions where direct measurement networks are scarce or disrupted, such as Syria, these inventories offer a complementary pathway to interpret satellite-derived atmospheric concentrations. For instance, Ghaffarpasand and Pope (2020) developed a high-resolution vehicle emission inventory in Isfahan, Iran, revealing strong spatial correlations between traffic intensity and NO2 concentrations in densely populated urban cores [32]. Similarly, Ghaffarpasand and Pope (2023) utilized telematics data to produce detailed maps of vehicular emissions and fuel consumption, demonstrating the value of integrating mobility data into urban air quality assessments [33]. These studies are especially relevant to the Syrian context, where rapid urbanization, poorly regulated traffic, and informal industrial activity likely contribute significantly to air pollutant levels. Incorporating insights from such inventory-based approaches enhances the interpretation of remote sensing observations and supports the design of targeted mitigation strategies.
Recent studies have highlighted the complex interplay between air pollution, population density, Land Surface Temperature (LST), and Land Use Land Cover (LULC), emphasizing the significant role of both geographical and anthropogenic factors in shaping pollutant distribution and urban thermal patterns. In this context, Fuladlu and Altan found strong spatial associations between LST and elevated concentrations of pollutants such as PM2.5, SO2, and NO2 in densely populated, low-altitude areas of Tehran, underscoring the cumulative impact of urban and atmospheric variables [34]. Similarly, Fuladlu’s investigation in Cyprus demonstrated that anthropogenic emissions are significantly linked to artificial surfaces and intensive agricultural zones, particularly in urban districts like Nicosia and Limassol, highlighting how land use decisions directly influence both thermal patterns and pollutant dispersion [35].
In Syria, over a decade of armed conflict has resulted in significant degradation of air quality, driven by a combination of interrelated factors. These include military operations; the destruction of industrial facilities and critical infrastructure; substantial shifts in population distribution and energy consumption patterns; the emergence of both organized and unregulated industrial zones; fluctuations in industrial activity; the impact of economic sanctions; and the effects of the COVID-19 pandemic on patterns of human activity. Additionally, forest and agricultural fires—whether caused by military actions, acts of sabotage, or land conversion for agriculture—have released substantial amounts of carbon and fine particulate matter (PM2.5) into the atmosphere, particularly in the coastal and western regions of Syria. These emissions have significantly worsened air pollution in affected areas. Preliminary measurements indicate that fine particulate concentrations in some regions exceeded global air quality standards by more than an order of magnitude during periods of intense fire activity.
Given the challenges associated with conducting field measurements in conflict-affected regions, remote sensing techniques and geographic information systems (GIS) are essential tools for monitoring and analyzing air quality. This study utilizes Sentinel-5P satellite data processed via the Google Earth Engine (GEE) platform, enabling comprehensive spatial and temporal coverage of the study area. The objective is to examine the spatial and temporal distribution of annual averages for five key atmospheric pollutants—carbon monoxide (CO), methane (CH4), nitrogen dioxide (NO2), aerosols, and formaldehyde (HCHO)—to provide an in-depth assessment of air quality dynamics in Syria over the period 2019–2024. By documenting the environmental consequences of prolonged conflict, this research aims to contribute a scientific foundation for future environmental restoration and policy-making initiatives.
This study contributes new insights to the existing literature by presenting a multi-year, satellite-based analysis of air pollution across Syria—an area with limited ground-based monitoring and significant conflict-related disruptions. It is among the first to integrate Sentinel-5P data and Google Earth Engine for tracking five key pollutants (NO2, CO, CH4, HCHO, and UVAI) across all Syrian governorates from 2019 to 2024. By linking spatiotemporal pollutant patterns to socio-economic activities, conflict-related land use changes, and natural events such as dust storms and biomass burning, this research offers a scientifically robust framework for environmental assessment in complex, data-scarce contexts. These findings aim to inform both post-conflict environmental recovery and regional air quality management strategies.
Syria is situated in the eastern Mediterranean region, between latitudes 32°19′ and 37°30′ N and longitudes 35°45′ and 42°00′ E, encompassing a total area of approximately 185,180 km2 (Fig. 1). The country exhibits diverse topography, extending from Mediterranean coastal plains in the west to the arid Syrian Badia (desert) in the east. The western region is defined by two parallel mountain ranges: the Latakia Mountains to the west and the Anti-Lebanon Mountains to the east, with the rift valleys of Al-Ghab and Al-Rouj located between them. The northern region includes the expansive plains of Aleppo and Al-Jazira, which are separated from the Badia by the Euphrates Valley. Central Syria is characterized by fertile plains such as those of Al-Ghab and Homs. In the south, the Golan Heights occupy the western margin, the Hauran plains lie centrally, and the volcanic massif of Jabal Al-Arab (Arab Mountain) is situated to the east, while the Badia extends as a desert plateau across the southeastern sector of the country.

Figure 1: (A) Geographic location of Syria and (B) Digital Elevation Model (DEM) of the study area
The climate of Syria varies considerably across its diverse geographical zones, ranging from Mediterranean conditions in the coastal areas to semi-arid and arid climates in the interior and eastern regions. This combination of topographical and climatic heterogeneity, along with differences in population density and industrial activity across governorates, results in distinct spatial patterns of air pollution. The study area includes all fourteen governorates of Syria, enabling a comprehensive analysis of air quality variations across urban, rural, and desert environments under differing socio-economic and environmental conditions.
This section presents an overview of the Sentinel-5P satellite instrumentation and the data acquisition methodology, followed by a detailed description of the analyzed pollutants and the data retrieval process using Google Earth Engine (GEE). The flowchart of the methodological framework used in this study were presented in Fig. 2.

Figure 2: Flowchart of the methodological framework used in this study
3.1 Sentinel-5 Precursor Satellite
The Sentinel-5 Precursor (Sentinel-5P) satellite, launched by the European Space Agency in October 2017, is a critical component of the Copernicus Earth Observation Program. Operating in a sun-synchronous orbit at an altitude of 824 km, its primary mission is to perform global atmospheric monitoring for air quality, climate change, and ozone layer assessments.
The satellite’s key instrument, the TROPOspheric Monitoring Instrument (TROPOMI), employs advanced push-broom scanning technology to measure concentrations of various trace gases, including nitrogen dioxide (NO2), sulfur dioxide (SO2), ozone (O3), carbon monoxide (CO), methane (CH4), water vapor (H2O), bromine oxide (BrO), formaldehyde (HCHO), and aerosols. TROPOMI provides daily global coverage with a swath width of 2600 km and offers high spatial resolution, ranging from 5.5 × 3.5 km2 at nadir for most species to 7 × 3.5 km2 for CH4 and CO. The instrument operates across seven spectral bands, from the ultraviolet (UV: 270–320 nm) to the shortwave infrared (SWIR: 2305–2385 nm).
TROPOMI utilizes both solar radiation reflected by the Earth’s surface and atmosphere and thermal radiation emitted by the Earth system. This comprehensive monitoring capability allows for highly accurate assessments of the spatial and temporal distribution of atmospheric constituents, contributing substantially to research in air pollution, public health, and climate dynamics. Its daily temporal resolution and high spatial granularity enable detailed atmospheric monitoring from local to global scales.
This study analyzes the concentrations of five major atmospheric pollutants. A brief description of each pollutant and its typical sources is provided below:
• Carbon Monoxide (CO):
Carbon monoxide is a major trace gas primarily emitted through fossil fuel combustion, biomass burning, and the oxidation of methane and hydrocarbons.
• Formaldehyde (HCHO):
Formaldehyde is an intermediate product in the oxidation of non-methane volatile organic compounds (NMVOCs), ultimately forming CO2. In terrestrial environments, HCHO concentrations are elevated due to NMVOC oxidation from vegetation, biomass burning, traffic, and industrial processes.
• Methane (CH4):
Methane is the second most important anthropogenic greenhouse gas after CO2. Approximately 75% of global methane emissions are attributed to human activities, including agriculture, fossil fuel extraction, and waste management.
• Nitrogen Dioxide (NO2):
Nitrogen dioxide, along with nitric oxide (NO), forms a group of reactive trace gases known as NOx. These are released through both anthropogenic activities—such as fossil fuel combustion and biomass burning—and natural processes including lightning and microbial activity in soils.
• Ultraviolet Aerosol Index (UVAI):
The UVAI is a satellite-derived metric used to detect the presence and characteristics of aerosols in the atmosphere. It measures deviations in UV radiation reflected from the Earth’s surface and atmosphere relative to expected values. Positive UVAI values indicate the presence of UV-absorbing aerosols such as dust or smoke, while negative values suggest reflective aerosols like sulfates. The magnitude of UVAI reflects both aerosol type and concentration.
3.3 Data Access via Google Earth Engine
The pollutant data used in this study were obtained as annual averages using the Google Earth Engine (GEE) platform. Spatial visualizations and further analysis were conducted using ArcGIS Pro. Table 1 presents the data sources used in this study, including the GEE access codes and the respective atmospheric measurement ranges for each pollutant.

The spatial distribution of nitrogen dioxide (NO2) concentrations across Syria from 2019 to 2024 reveals prominent pollution hotspots in major urban centers such as Damascus, Aleppo, Homs, and Hama. These elevated levels are primarily attributed to high population density, intensified vehicular emissions, and the widespread use of diesel generators (Fig. 3).

Figure 3: Spatial distribution of nitrogen dioxide (NO2) concentrations across Syria from 2019 to 2024. The maps highlight significant temporal dynamics, with periods of decline and resurgence reflecting fluctuations in anthropogenic activity and partial stability in major emission sources
Temporal patterns in NO2 concentrations reflect changes in anthropogenic activity, energy demand, and movement restrictions during the study period. In 2019, NO2 levels peaked above 0.00004 mol/m2, indicating relatively stable industrial and transportation activity. A significant decline in pollution was observed in 2020, particularly in Homs, Tartus, and desert regions, was observed. Pollution levels began to rise again in 2021, especially in northern Aleppo and rural parts of Homs, driven by the resumption of economic activities and industrial expansion. During 2022 and 2023, a general decrease in NO2 levels was observed across most regions, with the exception of northeastern Syria, where emissions from informal oil refineries remained relatively stable. In 2024, major cities experienced a renewed increase in NO2 concentrations, largely attributed to rising energy demand and the widespread use of diesel generators. Overall, the data underscore that transportation, industrial activity, and fossil fuel combustion remain the primary contributors to NO2 pollution in Syria. Higher concentrations are consistently observed in densely populated urban centers, whereas desert regions display lower levels due to atmospheric dispersion. These findings highlight the urgent need for improved emission monitoring and regulatory control, particularly in industrialized areas, to mitigate pollution during periods of disruption and economic recovery.
The spatial and temporal distribution of carbon monoxide (CO) concentrations in Syria between 2019 and 2024, as illustrated in Fig. 4, reveals notable fluctuations shaped by patterns of energy consumption, anthropogenic activity, and external socio-economic disruptions. These variations are primarily attributed to changing fuel usage habits, economic sanctions, and the impact of the COVID-19 pandemic.


Figure 4: Spatial distribution of carbon monoxide (CO) concentrations across Syria from 2019 to 2024. The maps reveal a fluctuating trajectory shaped by changes in human activity, energy access, and economic conditions, with clear geographical variations across regions
In 2019, CO levels ranged from 0.030 to 0.0325 mol/m2, with elevated concentrations observed in the northern regions, particularly around Damascus and the southwestern coastal areas. In 2021, a marked decrease in CO concentrations was observed, with regional values declining to 0.025–0.0275 mol/m2. This reduction coincided with pandemic-induced lockdowns, decreased traffic, and reduced industrial activity, in alignment with global trends during the same period. However, localized increases in CO levels were recorded around Jabal al-Arab (Mount Al-Arab) and the Qalamoun Mountains, primarily due to increased wood burning for heating and transboundary pollution from neighboring Lebanon. By the end of 2021, CO concentrations fell below 0.025 mol/m2 in many areas, particularly along the coastline and in large portions of northern Syria, a trend largely driven by continued economic stagnation and diminished fuel consumption.
In 2022, CO concentrations began to rise in various regions, ranging between 0.0275 and approximately 0.030 mol/m2. This increase was primarily associated with the resumption of industrial and transportation activities following the easing of COVID-19 restrictions, along with the growing reliance on low-quality fuels and backup diesel generators amid widespread power shortages. However, in 2023, CO levels declined once more, largely driven by fuel shortages, worsening economic conditions, and a sharp depreciation of the Syrian currency. By 2024, carbon monoxide concentrations continued to decrease across much of Syria, with measurements ranging between 0.025 and 0.0275 mol/m2. Nonetheless, the Mount Al-Arab and Qalamoun regions remained outliers, again recording CO levels above 0.0325 mol/m2, underscoring the persistence of localized emission sources. These temporal patterns underscore the complex interplay between energy availability, economic conditions, and CO emissions. A comparison between 2021 and 2024 reveals how different crisis-driven triggers—COVID-19 lockdowns in 2021 and economic sanctions and currency devaluation in 2024—can produce similar impacts on air quality through different mechanisms.
The methane (CH4) distribution maps of Syria from 2019 to 2024 (Fig. 5) reveal a consistent upward trend in atmospheric CH4 concentrations, with a geographical shift from lower levels in the northwest toward higher concentrations in the southeast. This trend reflects combined effects of human activities, such as oil extraction, livestock farming, and waste burning, as well as environmental and climatic variations.

Figure 5: Spatial distribution of methane (CH4) concentrations in Syria from 2019 to 2024. The maps reveal a steady increase in CH4 levels, with a geographic progression from the northwest to the southeast. The observed rise is closely linked to human activities, including oil refining, livestock farming, and waste burning, as well as limited regulatory control in key regions
In 2019, most regions recorded CH4 levels below 1910 parts per billion (ppb), with the southern and coastal areas exhibiting the lowest values—below 1855 ppb—due to low population density and limited industrial and agricultural activity. CH4 concentrations in the 1910–1935 ppb range were primarily observed in the Homs Desert, rural Damascus, and near the Syrian-Iraqi border. By 2020, methane concentrations had increased across rural desert areas near Damascus and in parts of central Syria, including the Homs and Aleppo regions. These increases, with values approaching or surpassing 1935 ppb, were attributed to intensified oil extraction activities and biomass burning. In 2021, CH4 levels in the 1910–1935 ppb range expanded to encompass most of Syria, while only the southwestern coastal regions remained below 1910 ppb.
During 2022 and 2023, elevated CH4 levels became prevalent across the country, while concentrations below 1860 ppb were confined to isolated coastal zones. This rise is largely attributed to the intensification of oil refining, improper waste burning, and increased livestock activity in desert regions. In 2024, a significant shift occurred, with a large portion of Syria exceeding 1935 ppb in CH4 concentration, while only limited coastal areas remained below 1910 ppb. These observations underscore the critical role of livestock agriculture and manure handling in methane accumulation, particularly in desert and rural areas such as Aleppo. The persistent rise in CH4 levels throughout Syria highlights the urgent need for improved waste management practices, sustainable agricultural techniques, and stricter monitoring of emissions from oil-related activities.
Formaldehyde (HCHO) concentrations across Syria between 2019 and 2024 exhibited a declining trend until 2022, followed by a modest increase in 2023 and 2024; however, overall levels remained below those recorded in 2019 (Fig. 6). Elevated concentrations were primarily observed in the northwestern regions, including Al-Hasakah, Idlib, and parts of Aleppo, while lower levels were prevalent in the southern and southeastern areas. These spatial patterns reflect the influence of agricultural burning, industrial activities, and unregulated oil operations. In 2019, relatively high HCHO concentrations—exceeding 0.000135 to 0.000170 mol/m2—were detected in northern and northwestern Syria, extending into central areas such as the Al-Ghab Plain in the Hama Governorate. These elevated levels correlate with intense agricultural activity and informal oil-related operations, particularly in the Al-Hasakah region. By 2020, concentrations decreased to the range of 0.000110–0.000135 mol/m2, likely due to reduced industrial production and transportation as a result of COVID-19 restrictions and ongoing economic challenges. In 2023 and 2024, HCHO levels began to rise again, with a reduction in the extent of low-concentration zones (<0.000085 mol/m2). This increase coincided with the gradual revival of oil-related operations. Nevertheless, high HCHO concentrations remained largely absent in regions such as Idlib, suggesting that agricultural and oil production activities had not returned to 2019 levels. Overall, the data indicate that although some emission sources have resumed, formaldehyde concentrations remain subdued compared to pre-pandemic conditions.


Figure 6: Spatial distribution of formaldehyde (HCHO) concentrations across Syria from 2019 to 2024. The maps illustrate temporal and regional variations in HCHO levels, highlighting an initial decline through 2022 followed by a moderate increase in 2023 and 2024. These patterns reflect changes in agricultural activity, industrial operations, and oil-related emissions over time
The UV Aerosol Index (UVAI) across Syria from 2019 to 2024 exhibited substantial spatial and temporal variability, driven by wind dynamics, desert dust transport, and anthropogenic emissions (Fig. 7). In 2019, negative UVAI values predominated across much of the country, except in the Heijana Depression, located southeast of Damascus, where local topography and wind channeling contributed to increased UVAI levels. In 2020, a strengthening of westerly winds further suppressed the impact of easterly desert winds. Simultaneously, a decline in fossil fuel combustion—linked to economic contraction and reduced transportation—led to a decrease in sulfate aerosol emissions, contributing to lower UVAI values overall. By 2021, intensification of easterly wind systems increased dust transport into central and eastern Syria, elevating UVAI values in these regions (Fig. 7). In 2022, a sharp increase in UVAI values was observed, with concentrations exceeding 0.5 across large portions of central and eastern Syria. This spike was driven by strong easterly and southeasterly wind activity, which transported significant quantities of desert dust. In contrast, the western region maintained lower UVAI values, influenced by moderating sea breezes and orographic barriers that limited aerosol accumulation.

Figure 7: Spatial distribution of the UV Aerosol Index (UVAI) across Syria from 2019 to 2024. The sequence of maps reveals notable interannual and regional changes, with persistent high UVAI values in central and eastern regions driven by desert dust storms, and lower values in western and southern areas influenced by sea breezes and topographical barriers. Urban and industrial emissions further contribute to elevated UVAI in densely populated zones such as Aleppo
The pattern observed in previous years persisted through 2023 and 2024, with consistently high UVAI values in central and eastern Syria and lower values in the west and south (Fig. 7). This spatial distribution reinforces the critical role of regional topography and prevailing meteorological conditions in modulating aerosol loading. In addition, persistent UVAI elevations were recorded in and around Aleppo, reflecting the influence of urbanization and industrial activity. These increases are associated with emissions from transportation, energy generation, and other anthropogenic sources, emphasizing the contribution of population density and human activities to aerosol burden. Overall, the observed patterns underscore the dominant role of wind-driven dust transport and anthropogenic emissions in shaping Syria’s aerosol distribution. These processes collectively influence long-term air quality and regional atmospheric dynamics.
The correlation between NO2 concentrations and urban traffic congestion, as well as fossil fuel combustion, has been previously documented [36,37]. In contrast to urban areas, rural and desert regions consistently exhibit lower NO2 concentrations, a pattern similarly observed in studies of sparsely populated zones [38] The northern and northwestern regions—including cities such as Aleppo and Idlib—demonstrated variable NO2 g, with peaks in 2021 and 2024 likely linked to the resurgence of industrial activity following conflict-induced economic downturns [39] In central Syria, cities like Homs and Hama displayed moderately high NO2 levels, particularly in the vicinity of oil refineries and industrial zones. This pattern aligns with findings by [40], who reported significant emissions near refining centers. Additionally, the northeastern governorates of Deir ez-Zor and Hasakah, known for oil production, exhibited localized NO2 concentration spikes. These emissions are associated with oil refining operations, a phenomenon also emphasized by [41], who reported elevated NO2 levels in conflict-affected oil-producing regions. A significant decline in pollution was observed in 2020, particularly in Homs, Tartus, and desert regions, consistent with the global reduction in NO2 concentrations during COVID-19 lockdowns [39,42]. Pollution levels began to rise again in 2021, especially in northern Aleppo and rural parts of Homs, driven by the resumption of economic activities and industrial expansion. This pattern aligns with post-pandemic trends reported by [43], where economic recovery contributed to increased pollutant emissions. Reference [40] noted that limited regulatory oversight in these areas facilitates persistent emissions from small-scale oil processing facilities. The trend of rising NO2 in 2024 is many cities is consistent with the findings of [44], who reported increased reliance on high-emission energy sources in regions facing infrastructural or regulatory constraints.
High CO levels in cities such as Latakia and Tartus are linked to dense populations and vehicular emissions, consistent with findings by [45], who reported similar CO patterns in urbanized and high-traffic regions. Additionally, Sahu et al. (2021) emphasized the role of biomass and agricultural residue burning as key contributors to CO hotspots. The localized anomalies of increases in CO levels align with observations by [46], who highlighted the influence of meteorological conditions on CO transport and accumulation. In addition, elevated concentrations exceeding 0.0325 mol/m2 were again observed in the Jabal al-Arab (Mount Al-Arab) and Qalamoun Mountains regions, indicating persistent emissions from biomass burning and household heating, consistent with previous findings [47]. Reduciton of CO levels in 2023 are consistent with those observed in other regions where economic downturns led to reductions in combustion-related emissions [48].
Levels exceeding 1935 ppb were rare during the selected study period. This pattern is consistent with findings by [49] and [50], who observed lower background CH4 levels in arid and sparsely populated regions. On the other hand, the sustained lower concentrations suggest a relative absence of major CH4 sources, aligning with dispersion patterns discussed by [50]. The significant rise occurred in 2024 where 1935 ppb was observed in Syria, this surge is linked to the expansion of unregulated oil operations, increased biomass combustion, and inadequate waste management practices [51,52]. The conitnuos rise in Syria’s CH4 levels are corroborated with earlier research that states on the influence of anthropogenic sources on atmospheric methane [53]. Further, for the downward trend of HCHO which persisted through 2021 and 2022, with an expansion of areas recording concentrations below 0.000085 mol/m2, attributed to a decline in biomass burning and industrial activity [54].
For the UVAI variations in wstern Syria from 2019 to 2024, negative values were largely attributed to marine salt aerosols transported inland by prevailing westerly winds. Additionally, sulfate aerosols originating from fossil fuel combustion contributed to UVAI values below −0.1, particularly in industrial areas [55,56]. This trend extended into the southern and western parts of the country, consistent with previous research highlighting the role of desert dust in elevating UVAI values [57]. Eastern and southeastern Syria continued to exhibit elevated UVAI levels due to the frequent occurrence of dust storms and the dominance of arid desert terrain, consistent with climatological patterns observed in Middle Eastern deserts [55].
This study investigated the spatial and temporal dynamics of five key atmospheric pollutants—nitrogen dioxide (NO2), carbon monoxide (CO), methane (CH4), formaldehyde (HCHO), and the ultraviolet aerosol index (UVAI)—across Syria over the period 2019–2024. Utilizing Sentinel-5P TROPOMI satellite data processed via the Google Earth Engine (GEE) platform, the analysis revealed distinct trends in pollutant distribution, shaped by economic activity, meteorological variability, and anthropogenic emissions.
Urban and industrial centers such as Damascus, Aleppo, Homs, and Hama consistently exhibited elevated NO2 and CO concentrations, which were strongly associated with population density, vehicular traffic, and industrial output. NO2 levels peaked in 2019, followed by a gradual decline attributable to economic slowdowns and emission reductions, with a moderate rebound observed in 2023 and 2024. CO concentrations followed a similar pattern, with persistent hotspots near urban areas and oil refining facilities. Methane emissions displayed a steady upward trajectory, particularly in northeastern Syria, where intensified oil production, biomass burning, and agricultural expansion were evident. Formaldehyde concentrations declined between 2019 and 2022—likely due to reduced industrial activity and transportation during this period—but increased moderately in 2023 and 2024, though remaining below 2019 levels. This trend suggests that post-2020 emissions from industrial and agricultural sectors have not fully returned to pre-pandemic intensities.
The UV Aerosol Index exhibited pronounced spatial and temporal variability, largely influenced by wind-driven dust transport, desert dust storms, and localized anthropogenic sources. Lower UVAI values were recorded in western and southern regions, where sea breezes and elevated terrain mitigated aerosol concentrations, while eastern and central areas experienced frequent increases, particularly in 2022, coinciding with intensified dust storm activity.
These findings underscore the complex interactions between economic, environmental, and atmospheric processes in determining air pollution patterns in conflict-affected regions. To support effective air quality management, future efforts should prioritize the integration of satellite-based remote sensing with ground-based monitoring networks to enhance data accuracy and validation. Policy interventions must include the enforcement of stricter emission controls on industrial activities, transportation, and biomass burning. Mitigating methane emissions will require the adoption of sustainable agricultural practices, including improved livestock management and controlled fertilizer application. Enhanced waste management strategies—particularly restrictions on open burning—are essential for addressing major sources of CH4 and CO.
To reduce the impact of desert dust on air quality, land management approaches such as afforestation, soil stabilization, and sustainable water resource practices should be promoted. The application of artificial intelligence and machine learning to remote sensing analytics presents an opportunity to improve real-time air pollution forecasting and to support evidence-based environmental policymaking. Collectively, these measures can facilitate the development of more effective and sustainable strategies to reduce air pollution and promote resilient urban and industrial development in Syria.
Acknowledgement: This study was funded in part by the Brazilian Federal Agency for the Support and Evaluation of Graduate Education (CAPES)—Finance Code 001, and by the National Council for Scientific and Technological Development (CNPq), Brazil (Grant Nos. 313358/2021-4 and 443905/2023-1). The authors also acknowledge the institutional support provided by the affiliated universities.
Funding Statement: The authors received no specific funding for this study.
Author Contributions: Almustafa Abd Elkader Ayek, Bilel Zerouali, Ankur Srivastava and Mohannad Ali Loho conceived the research framework, processed the data, designed the experiments, and were responsible for plot and map preparation. They also validated the processing results and wrote the manuscript. Nadjem Bailek and Celso Augusto Guimarães Santos provided feedback on the manuscript and contributed to its analysis and editing, focusing on improvements in English language, grammar, punctuation, and technical content. All authors reviewed the results and approved the final version of the manuscript.
Availability of Data and Materials: Data substantiating the findings of this study are available from the corresponding author upon reasonable request.
Ethics Approval: Not applicable.
Conflicts of Interest: The authors declare no conflicts of interest to report regarding the present study.
Abbreviations
| NO2 | Nitrogen Dioxide |
| CH4 | Methane |
| UVAI | Ultraviolet Aerosol Index |
| O3 | Ozone |
| BrO | Bromine Oxide |
| NOx | Nitrogen Oxides |
| PM10 | Particulate Matter 10 |
| TROPOMI | TROPOspheric Monitoring Instrument |
| GIS | Geographic Information Systems |
| ML | Machine Learning |
| LULC | Land Use Land Cover |
| UV | Ultraviolet |
| WHO | World Health Organization |
| km | Kilometer |
| ppb | Parts Per Billion |
| μg/m3 | Micrograms per Cubic Meter |
| Al-Ghab | Al-Ghab Plain |
| Al-Jazira | Al-Jazira Plains |
| Qalamoun | Qalamoun Mountains |
| Sentinel-5P | Sentinel-5 Precursor |
| Swath Width | Coverage Width |
| Coverage Area | Geographic Extent |
| CO | Carbon Monoxide |
| HCHO | Formaldehyde |
| SO2 | Sulfur Dioxide |
| H2O | Water Vapor |
| CO2 | Carbon Dioxide |
| PM2.5 | Particulate Matter 2.5 |
| NMVOCs | Non-Methane Volatile Organic Compounds |
| GEE | Google Earth Engine |
| AI | Artificial Intelligence |
| LST | Land Surface Temperature |
| DEM | Digital Elevation Model |
| SWIR | Shortwave Infrared |
| km2 | Square Kilometer |
| nm | Nanometer |
| mol/m2 | Moles per Square Meter |
| mg/m3 | Milligrams per Cubic Meter |
| Al-Rouj | Al-Rouj Valley |
| Jabal Al-Arab | Mount Al-Arab |
| Badia | Syrian Badia |
| Spatial Resolution | TROPOMI Resolution |
| Study Period | Temporal Coverage |
| Governorates | Administrative Units |
References
1. Balakrishnan U, Tsaneva M. Impact of air pollution on mental health in India. J Dev Stud. 2023;59(1):133–47. doi:10.1080/00220388.2022.2120804. [Google Scholar] [CrossRef]
2. Lavtižar K, Fikfak A, Fink R. Overlooked impacts of urban environments on the air quality in naturally ventilated schools amid the COVID-19 pandemic. Sustainability. 2023;15(3):2796. doi:10.3390/su15032796. [Google Scholar] [CrossRef]
3. Madronich S, Sulzberger B, Longstreth JD, Schikowski T, Andersen MPS, Solomon KR, et al. Changes in tropospheric air quality related to the protection of stratospheric ozone in a changing climate. Photochem Photobiol Sci. 2023;22(5):1129–76. doi:10.1007/s43630-023-00369-6. [Google Scholar] [PubMed] [CrossRef]
4. Chukkali S, Rastogi K, Agrawal A, Nayar S, Raj P. Air quality index, personality traits and their impact on the residential satisfaction and quality of life: an exploratory path analysis model. Asian J Water Environ Pollut. 2024;21(4):39–46. doi:10.3233/ajw240044. [Google Scholar] [CrossRef]
5. Kumar P, Singh AB, Arora T, Singh S, Singh R. Critical review on emerging health effects associated with the indoor air quality and its sustainable management. Sci Total Environ. 2023;872:162163. doi:10.1016/j.scitotenv.2023.162163. [Google Scholar] [PubMed] [CrossRef]
6. de Vries W. Impacts of nitrogen emissions on ecosystems and human health: a mini review. Curr Opin Environ Sci Health. 2021;21:100249. doi:10.1016/j.coesh.2021.100249. [Google Scholar] [CrossRef]
7. Feng Y, Ning M, Lei Y, Sun Y, Liu W, Wang J. Defending blue sky in China: effectiveness of the “Air Pollution Prevention and Control Action Plan” on air quality improvements from 2013 to 2017. J Environ Manage. 2019;252:109603. doi:10.1016/j.jenvman.2019.109603. [Google Scholar] [PubMed] [CrossRef]
8. Khan A, Plana-Ripoll O, Antonsen S, Brandt J, Geels C, Landecker H, et al. Environmental pollution is associated with increased risk of psychiatric disorders in the US and Denmark. PLoS Biol. 2019;17(8):1–28. doi:10.1371/journal.pbio.3000353. [Google Scholar] [PubMed] [CrossRef]
9. Ma Y, Wang W, Li Z, Si Y, Wang J, Chen L, et al. Short-term exposure to ambient air pollution and risk of daily hospital admissions for anxiety in China: a multicity study. J Hazard Mater. 2022;424:127535. doi:10.1016/j.jhazmat.2021.127535. [Google Scholar] [PubMed] [CrossRef]
10. Wang X, Younan D, Millstein J, Petkus AJ, Garcia E, Beavers DP, et al. Association of improved air quality with lower dementia risk in older women. Proc Natl Acad Sci. 2022;119(2):e2107833119. doi:10.1002/alz.056626. [Google Scholar] [CrossRef]
11. Chen S, Oliva P, Zhang P. The effect of air pollution on migration: evidence from China. J Dev Econ. 2022;156:102833. [Google Scholar]
12. Xue T, Zhu T, Zheng Y, Zhang Q. Declines in mental health associated with air pollution and temperature variability in China. Nat Commun. 2019;10(1):2165. doi:10.1038/s41467-019-10196-y. [Google Scholar] [PubMed] [CrossRef]
13. Khan SAR, Yu Z, Belhadi A, Mardani A. Investigating the effects of renewable energy on international trade and environmental quality. J Environ Manage. 2020;272:111089. doi:10.1016/j.jenvman.2020.111089. [Google Scholar] [PubMed] [CrossRef]
14. Kunii O, Kanagawa S, Yajima I, Hisamatsu Y, Yamamura S, Amagai T, et al. The 1997 Haze disaster in Indonesia: its air quality and health effects. Arch Environ Health Int J. 2002;57(1):16–22. doi:10.1080/00039890209602912. [Google Scholar] [PubMed] [CrossRef]
15. Ramanathan V, Feng Y. Air pollution, greenhouse gases and climate change: global and regional perspectives. Atmos Environ. 2009;43(1):37–50. doi:10.1016/j.atmosenv.2008.09.063. [Google Scholar] [CrossRef]
16. Zu D, Zhai K, Qiu Y, Pei P, Zhu X, Han D. The impacts of air pollution on mental health: evidence from the Chinese university students. Int J Environ Res Public Health. 2020;17(18):6734. doi:10.3390/ijerph17186734. [Google Scholar] [PubMed] [CrossRef]
17. Attademo L, Bernardini F. Air pollution as risk factor for mental disorders: in search for a possible link with Alzheimer’s disease and schizophrenia. J Alzheimer’s Dis. 2020;76(3):825–30. doi:10.3233/JAD-200289. [Google Scholar] [PubMed] [CrossRef]
18. Al-Rikabi RJ, Alqaralosy HNW, Sultan MA. The impact of human activities on air pollution in the Fallujah city, Al-Anbar province—West Iraq. Asian J Water Environ Pollut. 2024;21(4):31–8. doi:10.3233/ajw240043. [Google Scholar] [CrossRef]
19. Torkayesh AE, Alizadeh R, Soltanisehat L, Torkayesh SE, Lund PD. A comparative assessment of air quality across European countries using an integrated decision support model. Socioecon Plann Sci. 2022;81:101198. doi:10.1016/j.seps.2021.101198. [Google Scholar] [CrossRef]
20. Karlilar S, Emir F. Exploring the role of coal consumption, solar, and wind power generation on ecological footprint: evidence from India using Fourier ADL cointegration test. Environ Sci Pollut Res. 2023;30(9):24077–87. doi:10.1007/s11356-022-23910-z. [Google Scholar] [PubMed] [CrossRef]
21. Ercan T, Onat NC, Keya N, Tatari O, Eluru N, Kucukvar M. Autonomous electric vehicles can reduce carbon emissions and air pollution in cities. Transp Res D Transp Environ. 2022;112:103472. doi:10.1016/j.trd.2022.103472. [Google Scholar] [CrossRef]
22. Alharthi M, Hanif I, Alamoudi H. Impact of environmental pollution on human health and financial status of households in MENA countries: future of using renewable energy to eliminate the environmental pollution. Renew Energy. 2022;190:338–46. doi:10.1016/j.renene.2022.03.118. [Google Scholar] [CrossRef]
23. Al-Alola SS, Alkadi II, Alogayell HM, Mohamed SA, Ismail IY. Air quality estimation using remote sensing and GIS-spatial technologies along Al-Shamal train pathway, Al-Qurayyat City in Saudi Arabia. Environ Sustain Indic. 2022;15:100184. doi:10.1016/j.indic.2022.100184. [Google Scholar] [CrossRef]
24. Phuong DTK, Nhut MC, Tri ND. Air pollution assessment using RS and Gis in Ho Chi Minh City, Viet Nam: a case study of period 2015–2019 for SO2 and NO2. IOP Conf Ser Earth Environ Sci. 2021;652(1):12004. doi:10.1088/1755-1315/652/1/012004. [Google Scholar] [CrossRef]
25. Xu K, Cui K, Young LH, Wang YF, Hsieh YK, Wan S, et al. Air quality index, indicatory air pollutants and impact of COVID-19 event on the air quality near central China. Aerosol Air Qual Res. 2020;20(6):1204–21. doi:10.4209/aaqr.2020.04.0139. [Google Scholar] [CrossRef]
26. Kadri A, Yaacoub E, Mushtaha M, Abu-Dayya A. Wireless sensor network for real-time air pollution monitoring. In: Proceedings of the 2013 1st International Conference on Communications, Signal Processing, and their Applications (ICCSPA); 2013 Feb 12–14; Sharjah, United Arab Emirates. p. 1–5. [Google Scholar]
27. Kaivonen S, Ngai ECH. Real-time air pollution monitoring with sensors on city bus. Digit Commun Netw. 2020;6(1):23–30. doi:10.1016/j.dcan.2019.03.003. [Google Scholar] [CrossRef]
28. Oliveri Conti G, Heibati B, Kloog I, Fiore M, Ferrante M. A review of AirQ Models and their applications for forecasting the air pollution health outcomes. Environ Sci Pollut Res. 2017;24(7):6426–45. doi:10.1007/s11356-016-8180-1. [Google Scholar] [PubMed] [CrossRef]
29. Méndez M, Merayo MG, Núñez M. Machine learning algorithms to forecast air quality: a survey. Artif Intell Rev. 2023;56(9):10031–66. doi:10.1007/s10462-023-10424-4. [Google Scholar] [PubMed] [CrossRef]
30. Bellinger C, Mohomed Jabbar MS, Zaïane O, Osornio-Vargas A. A systematic review of data mining and machine learning for air pollution epidemiology. BMC Public Health. 2017;17(1):907. doi:10.1186/s12889-017-4914-3. [Google Scholar] [PubMed] [CrossRef]
31. Jońca J, Pawnuk M, Bezyk Y, Arsen A, Sówka I. Drone-assisted monitoring of atmospheric pollution—a comprehensive review. Sustainability. 2022;14(18):11516. doi:10.3390/su141811516. [Google Scholar] [CrossRef]
32. Ghaffarpasand O, Talaie MR, Ahmadikia H, Khozani AT, Shalamzari MD. A high-resolution spatial and temporal on-road vehicle emission inventory in an Iranian metropolitan area, Isfahan, based on detailed hourly traffic data. Atmos Pollut Res. 2020;11(9):1598–609. doi:10.1016/j.apr.2020.06.006. [Google Scholar] [CrossRef]
33. Ghaffarpasand O, Pope FD. Telematics data for geospatial and temporal mapping of urban mobility: fuel consumption, and air pollutant and climate-forcing emissions of passenger cars. Sci Total Environ. 2023;894:164940. doi:10.1016/j.scitotenv.2023.164940. [Google Scholar] [PubMed] [CrossRef]
34. Fuladlu K, Altan H. Examining land surface temperature and relations with the major air pollutants: a remote sensing research in case of Tehran. Urban Clim. 2021;39:100958. doi:10.1016/j.uclim.2021.100958. [Google Scholar] [CrossRef]
35. Fuladlu K. Human activities and increased anthropogenic emissions: a remote sensing study in Cyprus. Environ Dev. 2024;51:101023. doi:10.1016/j.envdev.2024.101023. [Google Scholar] [CrossRef]
36. Mansour AI, Aljamil HA. Investigating the effect of traffic flow on pollution, noise for urban road network. IOP Conf Ser Earth Environ Sci. 2022 Jan;961(1):12067. doi:10.1088/1755-1315/961/1/012067. [Google Scholar] [CrossRef]
37. Song W, Liu XY, Hu CC, Chen GY, Liu XJ, Walters WW, et al. Important contributions of non-fossil fuel nitrogen oxides emissions. Nat Commun. 2021;12(1):243. doi:10.1038/s41467-020-20356-0. [Google Scholar] [PubMed] [CrossRef]
38. Civan MY, Elbir T, Seyfioglu R, Kuntasal ÖO, Bayram A, Doğan G, et al. Spatial and temporal variations in atmospheric VOCs, NO2, SO2, and O3 concentrations at a heavily industrialized region in Western Turkey, and assessment of the carcinogenic risk levels of benzene. Atmos Environ. 2015;103:102–13. doi:10.1016/j.atmosenv.2014.12.031. [Google Scholar] [CrossRef]
39. Yang Y, Ren L, Wu M, Wang H, Song F, Leung LR, et al. Abrupt emissions reductions during COVID-19 contributed to record summer rainfall in China. Nat Commun. 2022;13(1):959. doi:10.1038/s41467-022-28537-9. [Google Scholar] [PubMed] [CrossRef]
40. Barkley MP, González Abad G, Kurosu TP, Spurr R, Torbatian S, Lerot C. OMI air-quality monitoring over the Middle East. Atmos Chem Phys. 2017;17(7):4687–709. doi:10.5194/acp-17-4687-2017. [Google Scholar] [CrossRef]
41. Altahaan Z, Dobslaw D. Post-war air quality index in Mosul city, Iraq: does war still have an impact on air quality today? Atmos. 2025;16(2):135. doi:10.3390/atmos16020135. [Google Scholar] [CrossRef]
42. Shi Z, Song C, Liu B, Lu G, Xu J, Vu T, et al. Abrupt but smaller than expected changes in surface air quality attributable to COVID-19 lockdowns. Sci Adv. 2021;7(3):eabd6696. doi:10.1126/sciadv.abd6696. [Google Scholar] [PubMed] [CrossRef]
43. Maziak W, Ward KD, Mzayek F, Rastam S, Bachir ME, Fouad MF, et al. Mapping the health and environmental situation in informal zones in Aleppo, Syria: report from the Aleppo household survey. Int Arch Occup Environ Health. 2005;78(7):547–58. doi:10.1007/s00420-005-0625-7. [Google Scholar] [PubMed] [CrossRef]
44. Zalakeviciute R, Diaz V, Rybarczyk Y. Impact of city-wide diesel generator use on air quality in Quito, Ecuador, during a nationwide electricity crisis. Atmosphere. 2024;15(10):1192. doi:10.3390/atmos15101192. [Google Scholar] [CrossRef]
45. Roy S, Bose A, Majumder S, Chowdhury IR, Abdo HG, Almohamad H, et al. Evaluating urban environment quality (UEQ) for Class-I Indian city: an integrated RS-GIS based exploratory spatial analysis. Geocarto Int. 2023;38(1):2153932. doi:10.1080/10106049.2022.2153932. [Google Scholar] [CrossRef]
46. Le NH, Ly BT, Thai PK, Pham GH, Ngo IH, Do VN, et al. Assessing the impact of traffic emissions on fine particulate matter and carbon monoxide levels in Hanoi through COVID-19 social distancing periods. Aerosol Air Qual Res. 2021;21(10):210081. doi:10.4209/aaqr.210081. [Google Scholar] [CrossRef]
47. Yadav IC, Devi NL. Biomass burning, regional air quality, and climate change. In: Encyclopedia of environmental health. Amsterdam, The Netherlands: Elsevier; 2019. p. 386–91. doi:10.1016/b978-0-12-409548-9.11022-x. [Google Scholar] [CrossRef]
48. Keshav B, Yousef M. Petroleum resources and energy transitions in the mena region: geopolitical and economic implications. In: The middle East: past, present, and future. Cham: Springer Nature Switzerland; 2025. p. 137–66. doi:10.1007/978-3-031-83967-2_6. [Google Scholar] [CrossRef]
49. Guo M, Wang XF, Li J, Yi KP, Zhong GS, Wang HM, et al. Spatial distribution of greenhouse gas concentrations in arid and semi-arid regions: a case study in East Asia. J Arid Environ. 2013;91:119–28. doi:10.1016/j.jaridenv.2013.01.001. [Google Scholar] [CrossRef]
50. Ran L, Shi H, Yang X. Magnitude and drivers of CO2 and CH4 emissions from an arid/semiarid river catchment on the Chinese Loess Plateau. J Hydrol. 2021;59:126260. doi:10.1016/j.jhydrol.2021.126260. [Google Scholar] [CrossRef]
51. Francis D, Weston M, Fonseca R, Temimi M, Alsuwaidi A. Trends and variability in methane concentrations over the southeastern Arabian Peninsula. Front Environ Sci. 2023;11:1177877. doi:10.3389/fenvs.2023.1177877. [Google Scholar] [CrossRef]
52. Arshad K, Hussain N, Ashraf MH, Saleem MZ. Air pollution and climate change as grand challenges to sustainability. Sci Total Environ. 2024;928:172370. doi:10.1016/j.scitotenv.2024.172370. [Google Scholar] [PubMed] [CrossRef]
53. Roshan DR, Koc M, Isaifan R, Shahid MZ, Fountoukis C. Aerosol optical thickness over large urban environments of the arabian peninsula—speciation, variability, and distributions. Atmos. 2019;10(5):228. doi:10.3390/atmos10050228. [Google Scholar] [CrossRef]
54. Fan J, Wang T, Wang Q, Ma D, Li Y, Zhou M, et al. Assessment of HCHO in Beijing during 2009 to 2020 using satellite observation and numerical model: spatial characteristic and impact factor. Sci Total Environ. 2023;894:165060. doi:10.1016/j.scitotenv.2023.165060. [Google Scholar] [PubMed] [CrossRef]
55. Roshan DR, Koc M, Abdallah A, Martin-Pomares L, Isaifan R, Fountoukis C. UV Index forecasting under the influence of desert dust: evaluation against surface and satellite-retrieved data. Atmos. 2020;11(1):96. doi:10.3390/atmos11010096. [Google Scholar] [CrossRef]
56. Mahfouz MMK, Skok G, Sciare J, Pikridas M, Alfarra MR, Moosakutty S, et al. Contribution of black carbon and desert dust to aerosol absorption in the atmosphere of the Eastern Arabian Peninsula. Atmos Environ. 2024;324:120427. doi:10.1016/j.atmosenv.2024.120427. [Google Scholar] [CrossRef]
57. Namdari S, Karimi N, Sorooshian A, Mohammadi G, Sehatkashani S. Impacts of climate and synoptic fluctuations on dust storm activity over the Middle East. Atmos Environ. 2018;173:265–76. doi:10.1016/j.atmosenv.2017.11.016. [Google Scholar] [PubMed] [CrossRef]
Cite This Article
 Copyright © 2025 The Author(s). Published by Tech Science Press.
This work is licensed under a Creative Commons Attribution 4.0 International License , which permits unrestricted use, distribution, and reproduction in any medium, provided the original work is properly cited.
 Downloads
 Citation Tools