
 Submit a Paper
 Propose a Special lssue
 Open Access
ARTICLE

Evaluation of Different Digital Elevation Models with Elevation Data
1 Centre of Studies for
Surveying Science and Geomatics, Faculty of Built
Environment, Universiti Teknologi MARA, Shah Alam, 40450, Selangor, Malaysia
2 Faculty of Maritime Studies, Universiti Malaysia Terengganu, Kuala Nerus, 21030, Terengganu, Malaysia
* Corresponding Author: Amir Sharifuddin Ab Latip. Email:
(This article belongs to the Special Issue: Advancements in Geospatial Methods and Technologies for Sustainable Built Environment and Engineering)
Revue Internationale de Géomatique 2025, 34, 691-705. https://doi.org/10.32604/rig.2025.065949
Received 26 March 2025; Accepted 25 July 2025; Issue published 29 August 2025
 View Full Text
 Download PDF
Abstract
Digital Elevation Model (DEM) refers to a digital map of the surface of the Earth that only shows the bare ground, without any buildings, plants, or other characteristics. However, obtaining unlimited access to DEM data at high and medium resolutions is very hard. Consequently, users often question the accuracy of freely available DEMs and their suitability for various applications. By comparing them to Global Positioning System (GPS) elevation data, this study aimed to identify the most reliable and widely available DEM for various terrains. The objectives of this study were to generate DEMs from different open sources and validate the accuracy of these DEMs using GPS elevation data. Various DEM types including Sentinel-1, ALOS PALSAR, SRTM, AW3D30, and ASTER were compared. Root Mean Square Error (RMSE) and Mean Error (ME) were used to measure the difference between the DEM-derived elevations and the GPS-measured elevations. The results showed that even though Sentinel-1 has higher resolutions, the accuracy of the DEM from Sentinel-1 depends on issues including coherence and interferometry, surface features, and temporal stability. On the other hand, ALOS PALSAR could accurately represent surfaces in some situations. Additionally, DEMs with lower resolutions, such as SRTM and AW3D30, demonstrated greater consistency across various types of terrain. In contrast, the ASTER DEM showed more variability in complex terrains. While freely available DEMs are easy to use and accessible, their accuracy varies depending on the source and terrain features. Future improvements could include adding more ground control points and using advanced filtering methods to enhance precision.Keywords
A digital elevation model (DEM) is a type of raster data model that is commonly used to view and analyze the Earth’s surface by representing the variance in topographical features. The establishment of spot elevation measurements can be achieved by collecting data and subsequently predicting the values of points on a specified surface. Various sources of data can be used to construct a DEM, including airborne laser scanning, photogrammetry techniques, remote sensing, field survey, and unmanned aerial vehicles. These sources can be evaluated based on characteristics such as accuracy, cost, time, ease of use, and application. A DEM is a reliable source of spatial data that serves as the foundation for several derived products, such as contour lines, volume calculations, profile analysis, slope determination, aspect identification, drainage network mapping, and more [1]. Thus, one of the essential requirements is that DEMs must possess sufficient quality to meet the needs of their respective applications. A DEM of a specific quality level might be used in a study requiring different quality levels [2]. The increase in accessibility and availability of DEMs has significantly facilitated users in utilising DEM for analytical and research purposes, ensuring the ease of their determination. Hence, the availability of freely accessible DEMs is undeniably a significant and valuable resource in accurately representing the Earth’s topography [3]. Nevertheless, the issue at hand pertains to the reliability and precision of the elevation data obtained from freely accessible DEMs compared to the actual ground elevation.
The capacity of a DEM to meet user needs is determined by several quality factors. After establishing the general features of the DEM, such as resolution, spatial coverage, and date, the primary focus shifts to data quality. This quality can be categorized into two main types: elevation quality, which refers to the accuracy of the elevation measurements in terms of absolute or relative accuracy, and shape and topologic quality, which pertains to the accuracy of derived DEM features such as slope, aspect, and curvature, which are quantitative descriptions of the terrain. The accuracy of these descriptors is critical for applications that rely on them, as DEMs should closely represent the terrain and the landscape. As DEM should closely approximate the actual position of the terrain and visually resemble the real landscape to the greatest extent possible. Undoubtedly, even a minor deviation in location can lead to inaccurate depictions of shape [4]. The standard technique for evaluating a DEM’s accuracy is comparing it with a ‘true’ terrain surface [5].
The DEM has been extensively used across several applications and disciplines, particularly in geomatics. This DEM can be derived from many sources, as it is also available online for free. However, the accuracy and precision of this DEM have been the central issue in this study. A range of global DEMs generated by remote sensing methodologies is accessible at varying resolutions. DEMs that offer accurate and detailed terrain depictions are significantly expensive [6]. Unrestricted access to DEM data at high and medium resolutions is difficult to attain [7]. Consequently, the accuracy of freely available DEM and their suitability for various applications has been a concern among users.
The accuracy of these DEMs can vary considerably due to differences in source data, sensor distortions, land cover, terrain characteristics, and processing methods, despite their widespread use [8]. Evaluating the accuracy of global DEMs is critical for both large-scale and site-specific applications, and several studies have examined how these models perform in various terrains worldwide [9]. This variability complicates the selection of the best DEM for specific applications, especially in regions with varied terrain.
Hence, it is imperative to thoroughly examine the vertical accuracy of the DEMs to ascertain their compliance with the prescribed accuracy standards. Evidently, the present global DEM cannot effectively simulate or anticipate processes and their associated implications at a local scale. Despite undergoing extensive preprocessing to eliminate substantial biases caused by vegetation and physical structures, as well as reducing inherent vertical errors, publicly accessible global DEM still exhibits inaccuracies that are frequently several orders of magnitude larger than the length scales of the simulated processes [10].
The variety of DEMs poses challenges in choosing appropriate ones for specific applications. By employing ground elevation data from the GPS to assess the accuracy of various free DEMs, this study intends to resolve this deficiency and determine the most dependable DEMs for various terrains. This research aims to comprehensively evaluate the accuracy and reliability of DEMs by generating them from different open sources and validating them against GPS elevation data. The results will assist users in determining the most suitable DEM for their specific requirements.
Numerous scholarly investigations have employed inter-comparison methodologies to ascertain the best precise DEM inside a specific geographical area. The accuracy of these DEMs varies across different geographic areas. The necessity for local accuracy assessment of these open-source solutions arises from this juncture [11]. The acquisition of precise elevation data can be further complicated by the presence of vegetation, urban areas, and aquatic bodies, as these features can obscure the ground surface.
Global Navigation Satellite System (GNSS) is one of the geodetic approaches that can be utilized to compute the geoid accurately and, hence, determine an orthometric height (H). The process involves the conversion of ellipsoidal height (h) derived from GNSS to orthometric height (H) [12]. The assessment of the absolute vertical accuracy of the DEMs involved the calculation of the absolute discrepancies between the pixel values of the DEMs and the associated GPS points [13]. The combination of Root Mean Square Error (RMSE) and Mean Error (ME) is commonly regarded as the most effective method for assessing the correctness of DEMs. This metric is essential for comprehending the general disparity between the DEM and ground elevations. Consequently, it is a favoured option for numerous applications [2].
This study assessed the open-source DEMs derived with different resolutions, both below and above 30 m. The main focus was to evaluate the high-resolution free DEMs against ground elevation data obtained from GPS using the Real Time Kinematic (RTK) Network method as a reference. Additionally, three other free DEMs with lower resolutions, approximately 30 m, were also evaluated against the reference data to determine the accuracy differences between high-resolution and lower-resolution free DEMs compared to ground elevation data. The evaluation of the different DEMs and GPS elevation data employed external validation, which involved comparing each DEM with GPS control points in a study area and using statistical measurements such as ME and RMSE to assess the vertical precision of the DEMs. The structure of the rest of this article is as follows: First, the material and methods of the study are explained in Section 2. Following that, the results and analysis of this study are elaborated in Section 3. It entails generated DEMs, evaluation of elevation from DEMs, statistical validation, and reliability of DEMs. The conclusion is provided in Sections 4 and 5.
The selection of Universiti Technology MARA (UiTM) campus at Shah Alam, Selangor, as the study area of this research is due to its diverse land surface, including hilly and flat areas. This choice allows for the evaluation of ground elevation by comparing it with the elevation data obtained from a free DEM of satellite imagery. Therefore, this region is readily accessible for establishing the GCP and conducting observations. Fig. 1 shows terrain diversity in the study area that is suitable for the elevation evaluation purpose.
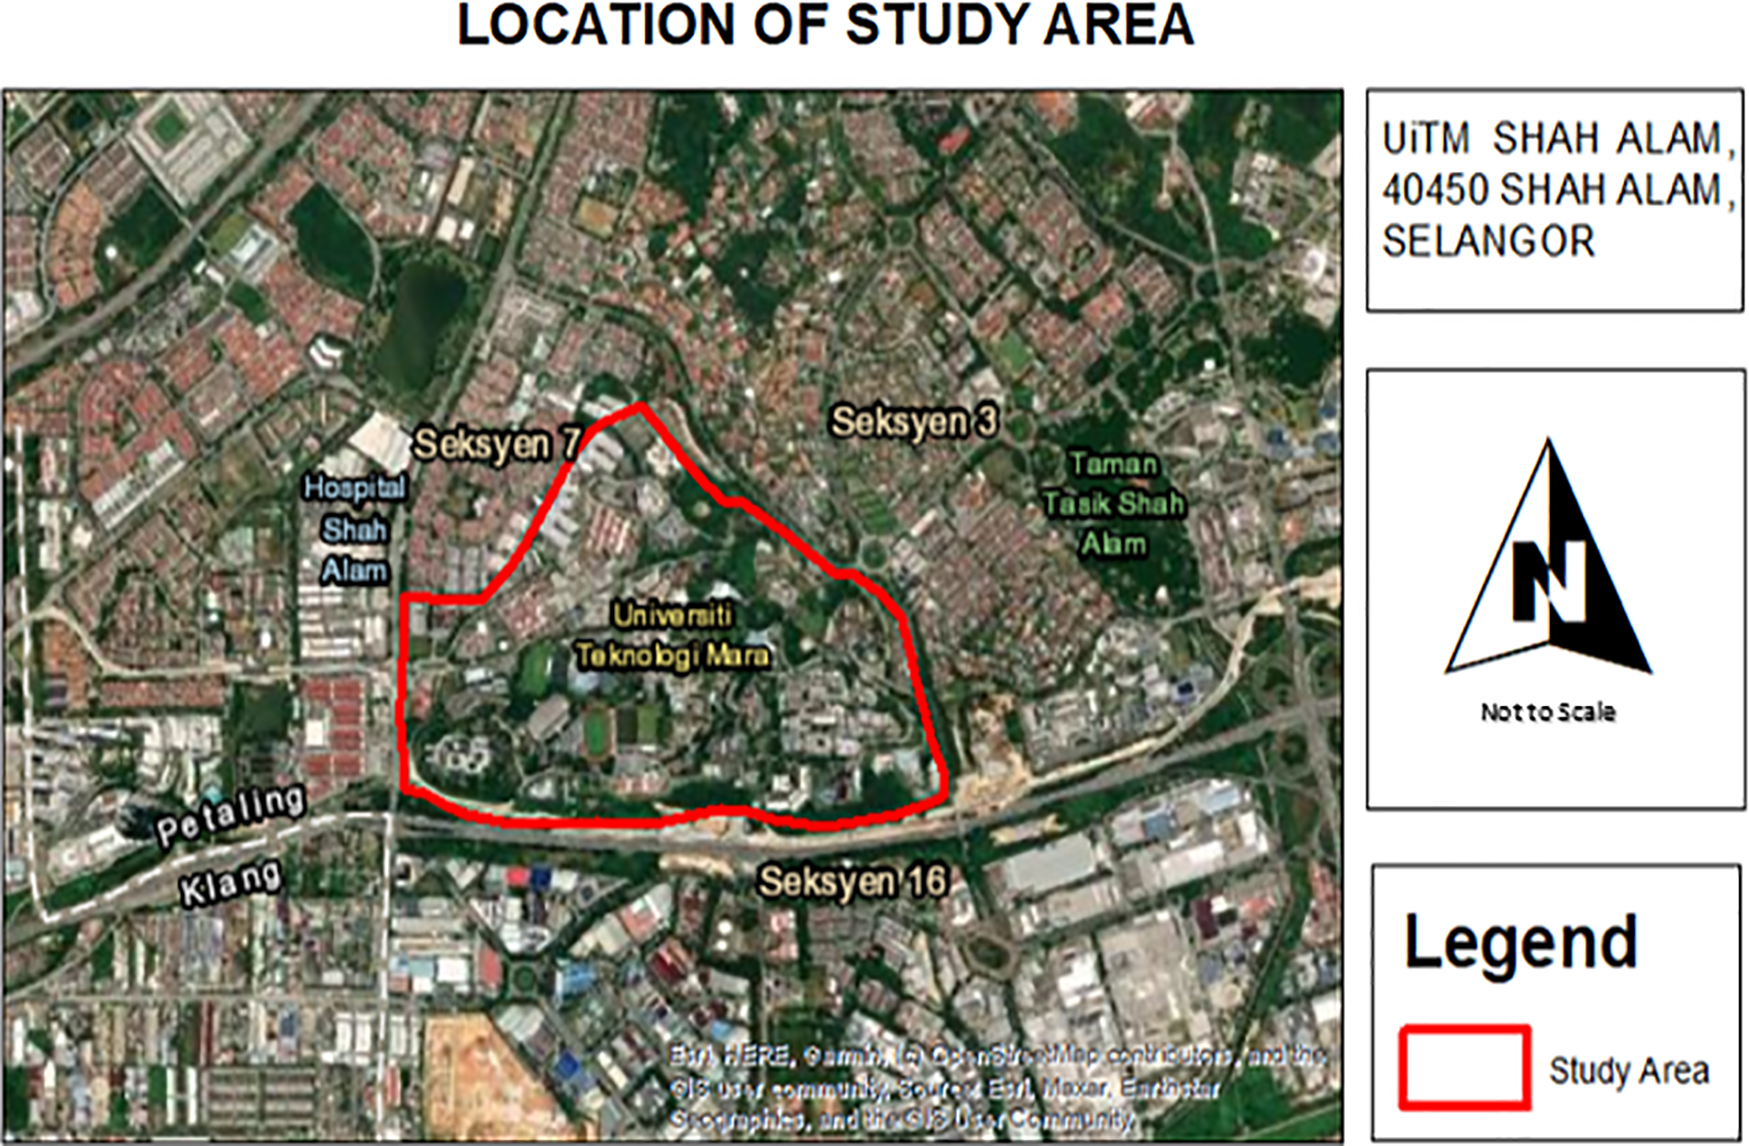
Figure 1: UiTM Campus at Shah Alam, Selangor
GPS observations are employed in this study to collect ground elevation data at numerous points in the study area. It was acquired using GPS observations with the Real Time Kinematic (RTK) approach from MyRTKnet. It derives real-time data without needing post-processing to obtain ground elevation data across various surface types. 300 elevation data points covering the entire study area were observed using GPS, as illustrated in Fig. 2. However, from these 300 points, only 20 points were selected as Ground Control Points (GCPs) to evaluate the other DEMs. Specifically, the yellow point illustrates 20 GCPs implemented on different terrains within the UiTM Shah Alam campus. The strategic selection of these GCPs represents the study area’s diverse topographical features. The GCPs are disseminated randomly from lower to higher elevations to guarantee comprehensive coverage of various terrain types. This random distribution method ensures that the data collected accurately reflects the variations in elevation and terrain across the entire study area, thereby improving the dependability and robustness of the elevation data for subsequent analysis. GPS with RTK can offer centimetre level accuracy, but it is still possible for small errors to occur due to factors like multipath or satellite geometry. The number of 20 GCPs was chosen to be able to capture both higher and lower points of the terrain, and to avoid placement of multiple points in the same kind of terrain, so that each GCP provides new information.
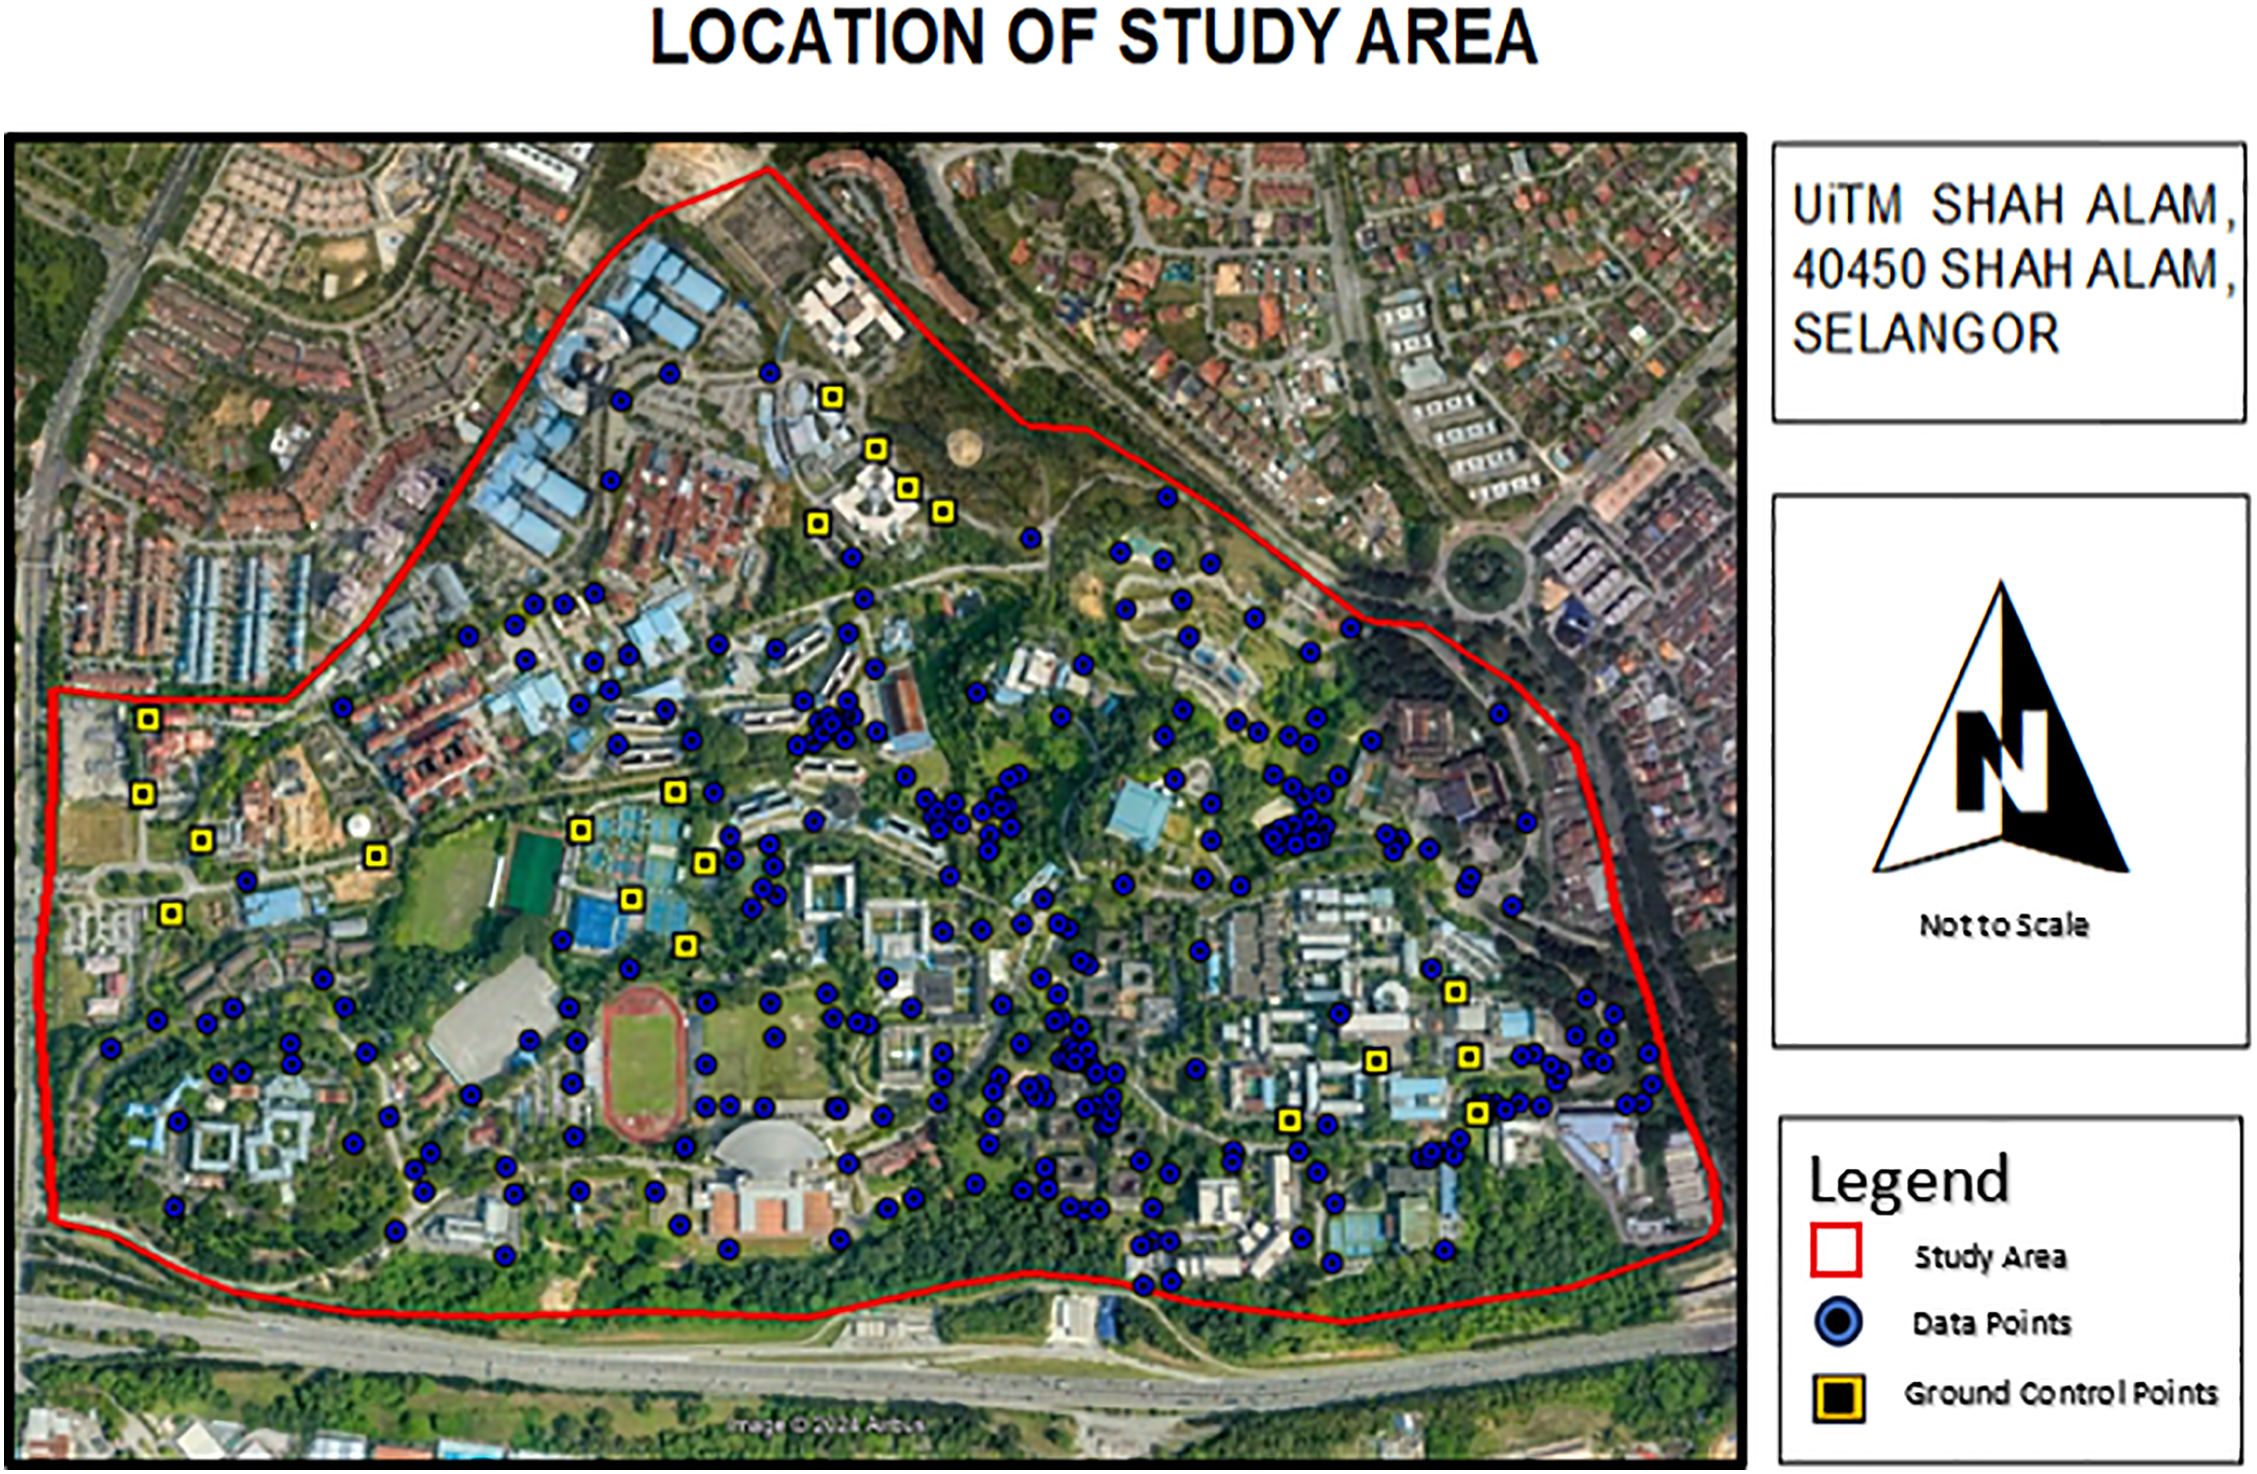
Figure 2: GPS observation points in the study area (Google Earth)
2.3 Open Accessible Digital Elevation Models
This study utilised five freely accessible DEMs which are Sentinel-1, ALOS PALSAR, SRTM, AW3D30 and ASTER with distinct resolutions. Sentinel-1 DEM required a several processing steps in SNAP software, while the other DEMs are a straightforward process. The basic steps to download this DEMs are to define the study area, select the data range and download the selected data in TIFF format. This DEMs can be download from several reliable sources. Details of the characteristics of each DEM are summarized in Table 1.

The Sentinel-1 mission, a component of the Copernicus Programme of the European Space Agency (ESA), has made substantial contributions to developing DEMs through Synthetic Aperture Radar (SAR) data. There are disadvantages in the accuracy of this high-resolution free DEM from Sentinel-1, which has a resolution of 5 m by 20 m spatial resolution. Hence, Sentinel-1 is remote sensing data that can be extracted into a high-resolution DEM [7]. A perpendicular baseline (PB) ranging from 150 to 300 m is optimal for DEM generation. Due to a heightened susceptibility to atmospheric influences and phase noise, both high and low values of PB may result in decorrelation and loss of coherence. Concurrently, the temporal baseline (TB) is taught to be brief, typically spanning no more than six to twelve days. The primary objective of the Sentinel-1 mission was deformation investigations, not DEM generation. Therefore, a PB greater than 100 m is uncommon. Most image pairs have a baseline of less than 30 m, and locating pairings with a short TB and a large PB can be challenging [14]. The Sentinel data used in this study have been downloaded from the Copernicus Open Access Hub. The data selected are from 20 April 2024 to 2 May 2024, with 12 temporal days between these two images, and the perpendicular baseline is 173 m. After downloading two Sentinel-1 SLC images, the master and the slave image of the same study area, these images were selected to form an interferometric pair. Software tools such as SNAP (Sentinel Application Platform) provided by ESA were used to perform these steps. Fig. 3 illustrates the workflow for DEM generation from Sentinel-1 SLC data in SNAP.
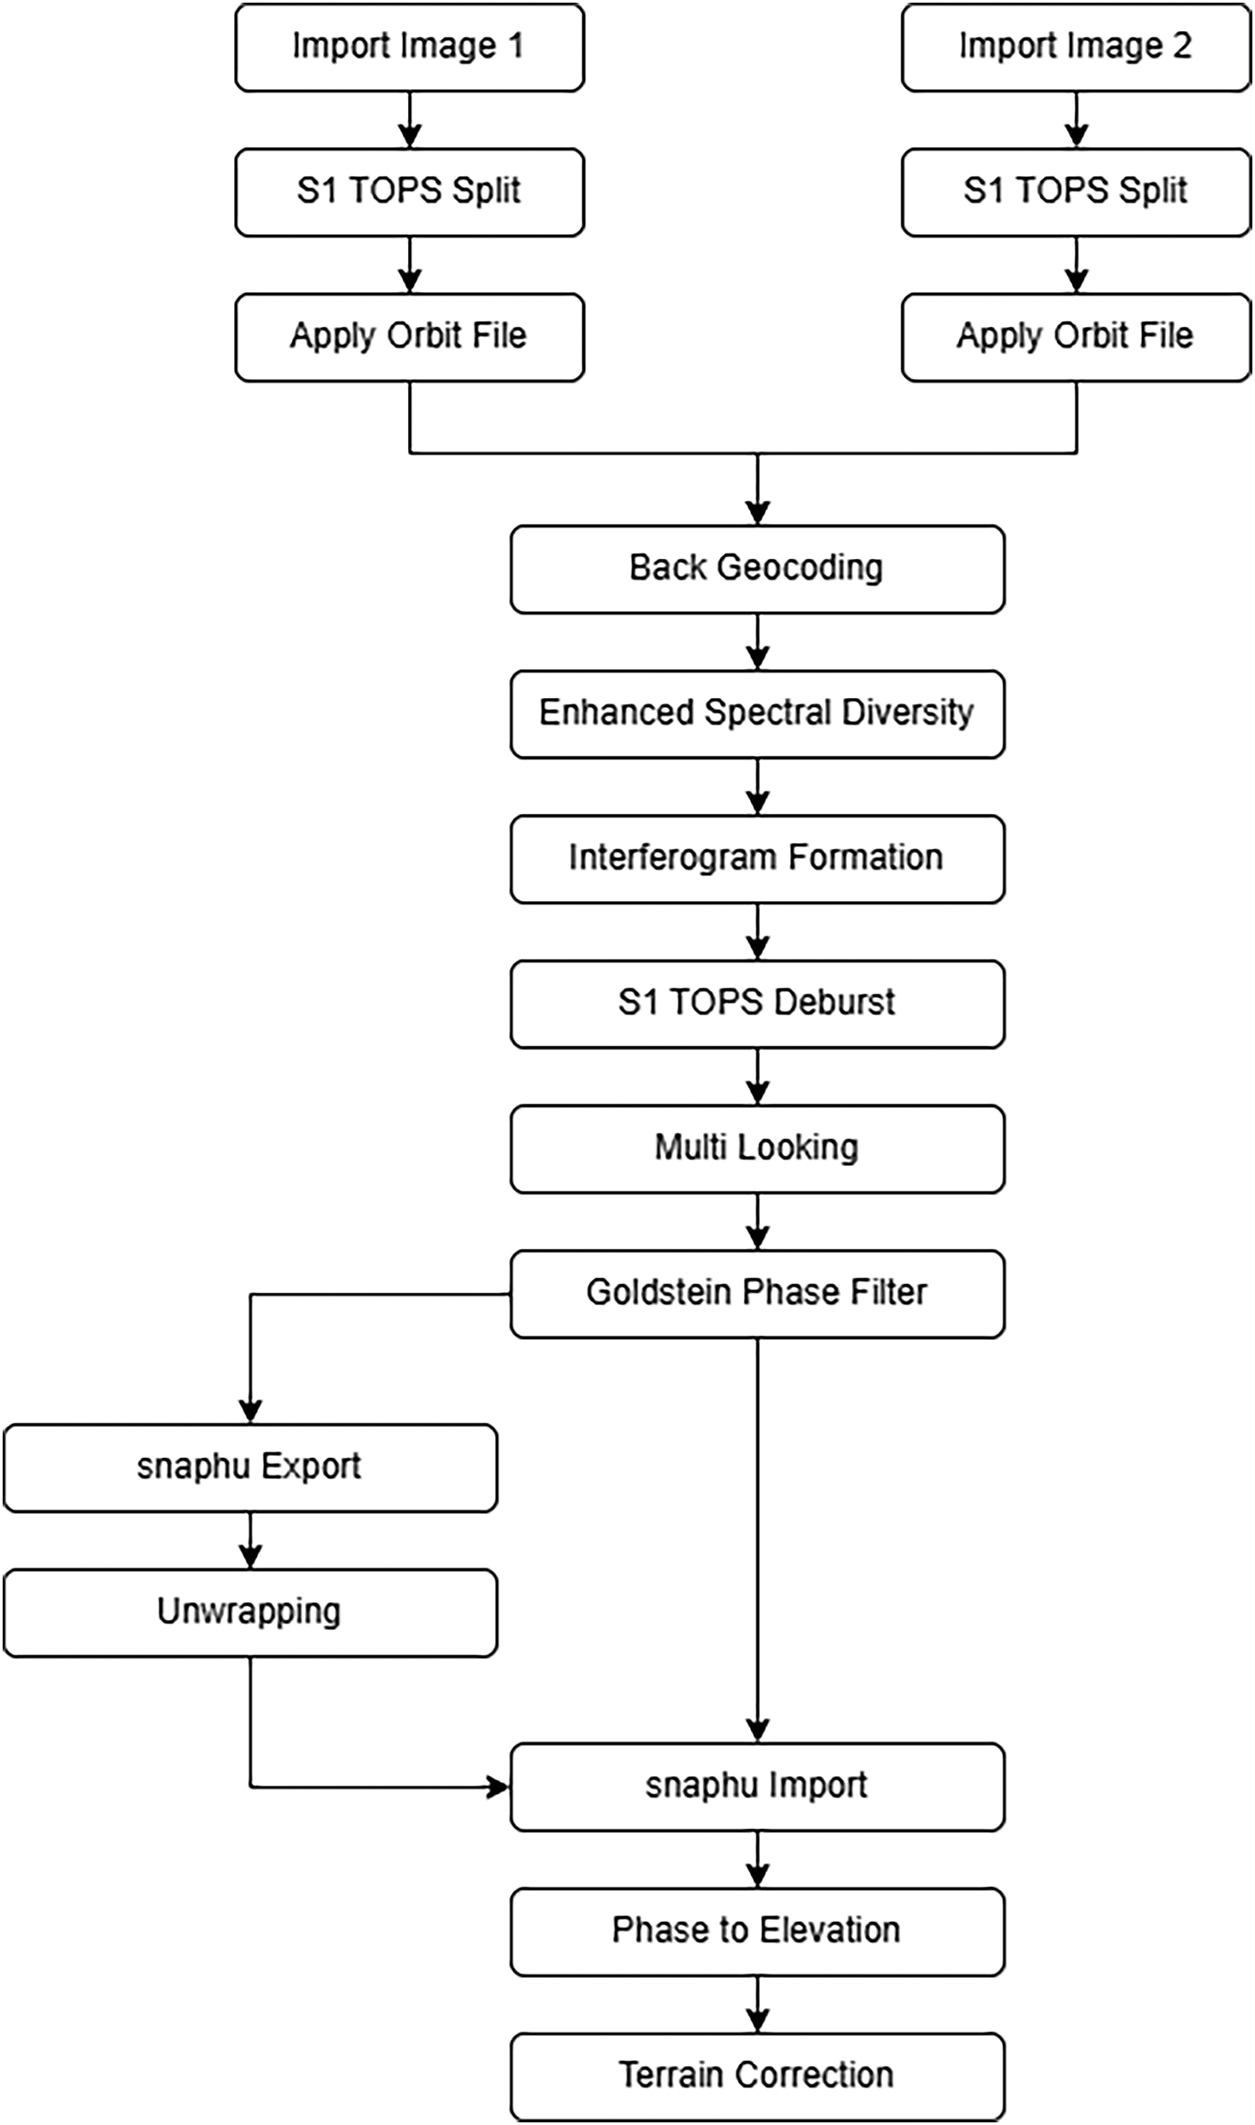
Figure 3: Workflow of Sentinel-1 DEM processing (Adapted from ESA SNAP Toolbox Manual, 2023)
The comprehensive topographical information that the DEM derived from the Advanced Land Observing Satellite Phased Array type L-band Synthetic Aperture Radar (ALOS PALSAR) is essential for various scientific and practical applications. ALOS PALSAR, created by the Japan Aerospace Exploration Agency (JAXA), employs L-band radar technology capable of penetrating clouds and vegetation. This capability makes it highly effective in various environments, such as tropical and forested regions [15]. A spatial resolution of 12.5 m is typically considered satisfactory for precise terrain mapping and analysis in DEMs derived from ALOS PALSAR (JAXA, 2020). The main accuracy difficulty is radar signal penetration, especially in heavily vegetated areas where L-band radar might induce elevation biases. Disparities in surface roughness and terrain incline can also reduce accuracy, and converting radar data into DEM introduces regular mistakes that lower dataset quality [16]. The ALOS PALSAR DEM product can be downloaded from the ASF ALASKA website (https://search.asf.alaska.edu/).
The SRTM, which stands for Shuttle Radar Topography Mission, was the first spaceborne SAR interferometer. The SRTM mission successfully captured both C-band and X-band synthetic aperture radar data sets, enabling the generation of a new, accurate global digital terrain model and topographic maps for all land surfaces between latitudes +60° and −56°. The SRTM DEM data has a horizontal resolution of 1 arc-second, equivalent to 30 m at the equator. It also has a vertical resolution of 10 m, achieved using C-band radar [17]. According to reports, the SRTM is known to have inaccuracies, particularly in places with dense vegetation, because the 5.6 cm wavelength it uses does not effectively penetrate through plants. The SRTM DEM product can be downloaded from the USGS website (https://earthexplorer.usgs.gov/).
The ALOS World 3D (AW3D) 0.15 arc seconds (~5 m) DEM was developed by the Japan Aerospace Exploration Agency (JAXA) using over 3 million images captured by the Panchromatic Remote-sensing Instrument for Stereo Mapping (PRISM) sensor on board the ALOS satellite. Over the years, JAXA has consistently improved the global DEM by integrating multiple iterations to enhance accuracy and usability. In 2018, version 2.1 was released, followed by version 2.2 in 2019 and version 3.1 in 2021. These updates were significant. Version 3.2, introduced in 2021, was the most recent revision. It included a revised sea mask, which further enhanced the quality of the DEM for coastal and maritime applications [10]. The AW3D30 DEM, a freely available 30-m resolution version, has demonstrated consistent high spatial resolution and vertical accuracy across multiple validation studies, confirming its reliability for global-scale terrain analysis [18]. The dataset can be downloaded from the Open Topography website (https://portal.opentopography.org/).
ASTER GDEM is a dataset that provides global elevation data derived from optical stereoscopic photogrammetry. The sensors encompass a range of 14 bands, spanning from visible light to thermal infrared (IR), and possess exceptional spatial, spectral, and radiative resolutions. In addition, the device’s near-infrared (NIR) band offers stereoscopic coverage. NASA and METI released ASTERGDEMv3 on 5 August 2019. GDEMv2 now has 360,000 optical stereo picture pairs, eliminating water area elevation gaps and numerical anomalies. The GDEMv3 dataset has improved coverage and elevation accuracy [8]. The ASTER DEM product can be downloaded from the NASA website (https://search.earthdata.nasa.gov/).
GPS-based ground control points (GCPs) are commonly used in DEM validation because they provide reliable and accurate elevation data for comparison [19]. In this study, the elevation values from all DEMs have been extracted using ArcGIS software to derive their elevation data based on 300 GPS observation points. The processing tool that was used to derive the elevation data was “Add Surface Information (3D Analyst)”, and it was available in ArcToolbox. This tool can extract the height value from the DEMs based on the latitude and longitude coordinates from GPS observation. Then, the attribute table with a geographic coordinate system in the WGS84 and heights values can be derived and exported in text file format.
Ground elevation data that was determined from the GPS observation using the Network RTK method was in ellipsoidal height. This ellipsoidal height needs to be subtracted from the local geoid model. This local geoid height information is extracted from the Malaysia precise geoid model (MyGEOID) provided by DSMM that was derived from (https://ebiz.jupem.gov.my/). To transform the ellipsoidal height (h) to the orthometric height (H) using the local geoid model (N) at each station is expressed in Eq. (1):
The elevation values from GPS, Sentinel-1 and ALOS PALSAR refer to the ellipsoidal height. In contrast, the SRTM, AW3D30, and ASTER refer to the orthometric height. Due to this divergent referenced height, the elevation value derived from all DEMs must be converted into the same referenced height, orthometric height. To determine the orthometric height for an elevation value obtained from all DEMs, it is necessary to use the same geoid model that was used to calculate the orthometric height from GPS elevation data. Fig. 4 illustrates the flowchart for converting the height values from all DEMs.
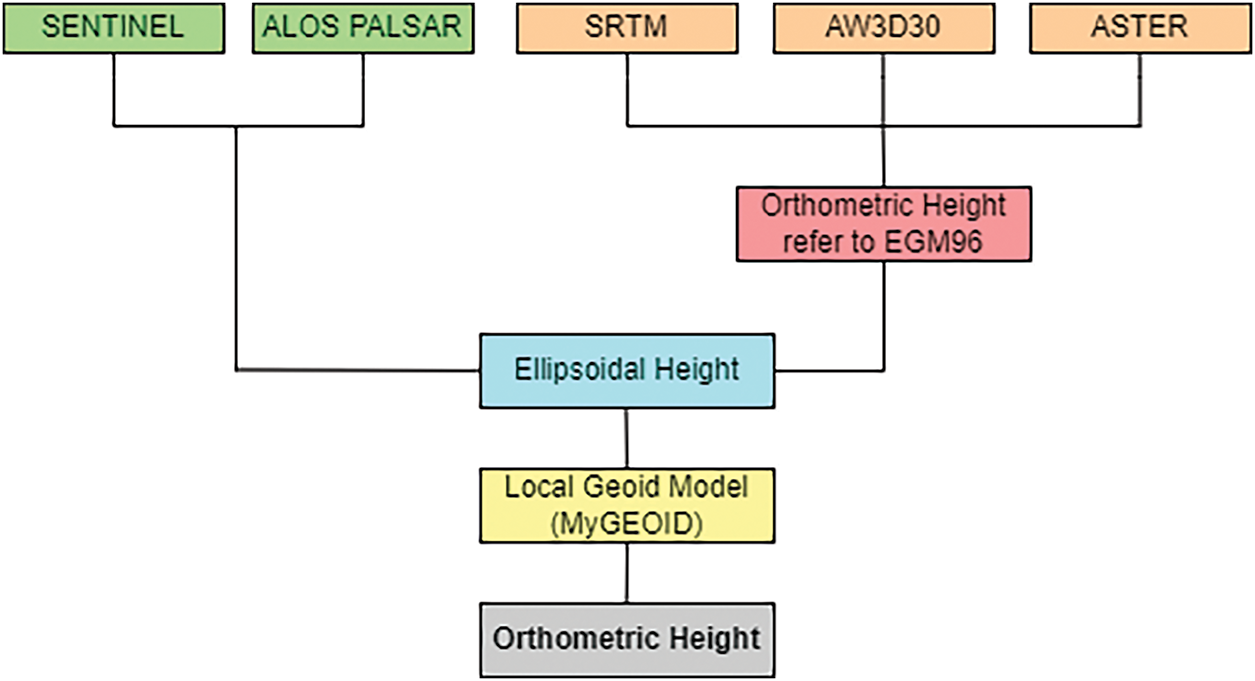
Figure 4: Flowchart to convert elevation values from DEMs
According to the flowchart, the Sentinel and ALOS PALSAR DEM elevation values refer to the ellipsoidal height. The values derived from these two DEMs must be adjusted by subtracting the geoid value from MyGeoid to calculate the orthometric height. In contrast, the elevation values from the SRTM, AW3D30, and ASTER DEMs refer to the orthometric height, which is based on the geoid value from EGM96. To ensure consistency in orthometric heights across all DEMs, these values must first be converted to ellipsoidal heights by adding the EGM96 geoid value, as obtained from the Geoid Height Calculator (available at https://www.unavco.org/). Once the ellipsoidal heights are determined, the same geoid value from MyGeoid is subtracted to get the orthometric height, ensuring that all orthometric heights are referenced to the same local geoid model.
To generate the DEMs, the elevations derived from selected free DEMs converted to the orthometric height using MyGeoid are saved in the attribute table containing Latitude, Longitude, and Height for each DEM. Then, the attribute table was used to generate the new DEMs utilizing ArcGIS. A Kriging tool that used an interpolation method was utilized to generate the new DEMs from different elevation data sources. Kriging was chosen due to its capacity to create precise estimates and quantify the uncertainty of predictions. Kriging is a geostatistical interpolation that not only predicts values but also provides a measure of the accuracy of these predictions (kriging variance). It is predicated on statistical models containing autocorrelation, the statistical relationship between the measured points. Additionally, this method offers the ability to estimate prediction errors, manage irregularly spaced data points, and generate more precise and smooth surfaces.
The assessment of the absolute vertical accuracy of the DEMs involved the calculation of the absolute discrepancies between the pixel values of the DEMs and the associated GPS points. Determining an elevation error for each point involves calculating the discrepancy between the model and reference values. The variable
For DEM accuracy assessment, the combination of Root Mean Square Error (RMSE) and Mean Error (ME) is widely recognized as an effective and reliable method. RMSE and ME are among the most accepted indicators for evaluating DEM performance, as they provide insight into both systematic and random deviations [20]. RMSE offers a comprehensive measure of overall accuracy by accounting for the magnitude and distribution of elevation errors, thus reflecting the typical variation between DEM-derived and actual ground elevations. In contrast, ME highlights systematic biases, indicating whether a DEM tends to consistently overestimate or underestimate terrain elevations. These metrics are expressed as follows:
The ground elevation data as a reference in Fig. 5, the first evaluation was evaluating the surface representation from five open accessible ground elevation data using DEM that was generate early using Kriging tool in Fig. 6. After the surface representation, the graph illustrated the elevation data on 20 Ground Control Point (GCP) along with their differences between each other to see their how close their ground elevation data with the actual elevation that was observed using GPS. Then, the accuracy assessment for error identification was carried out using RMSE and ME.
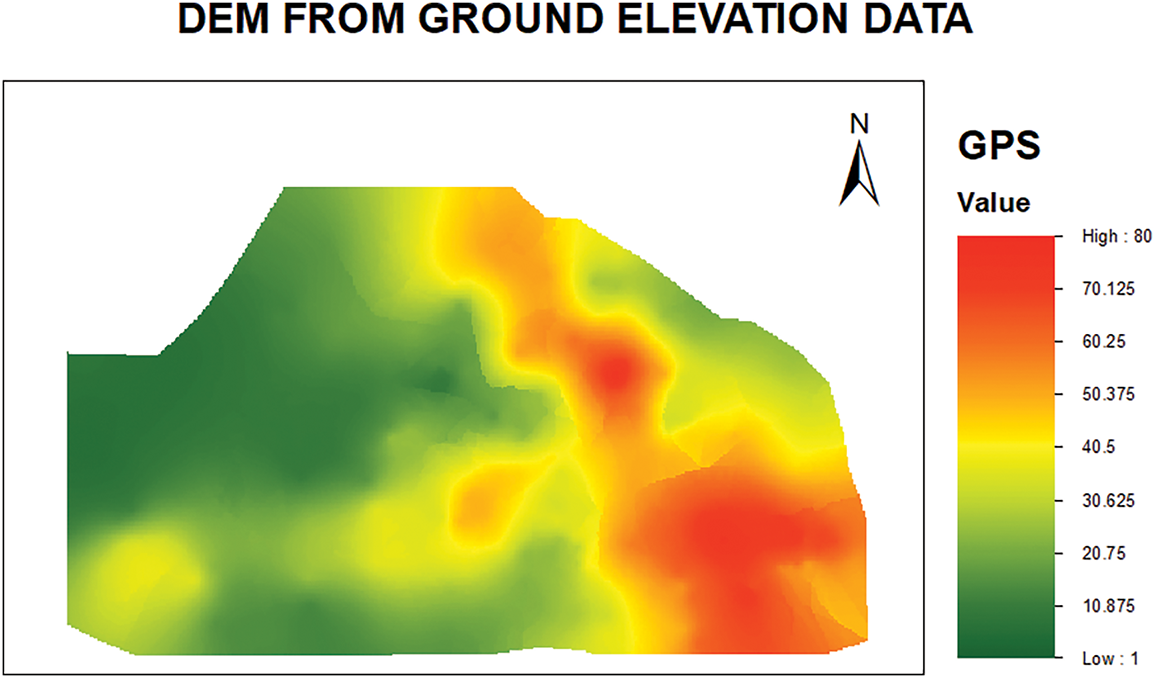
Figure 5: Reference DEM
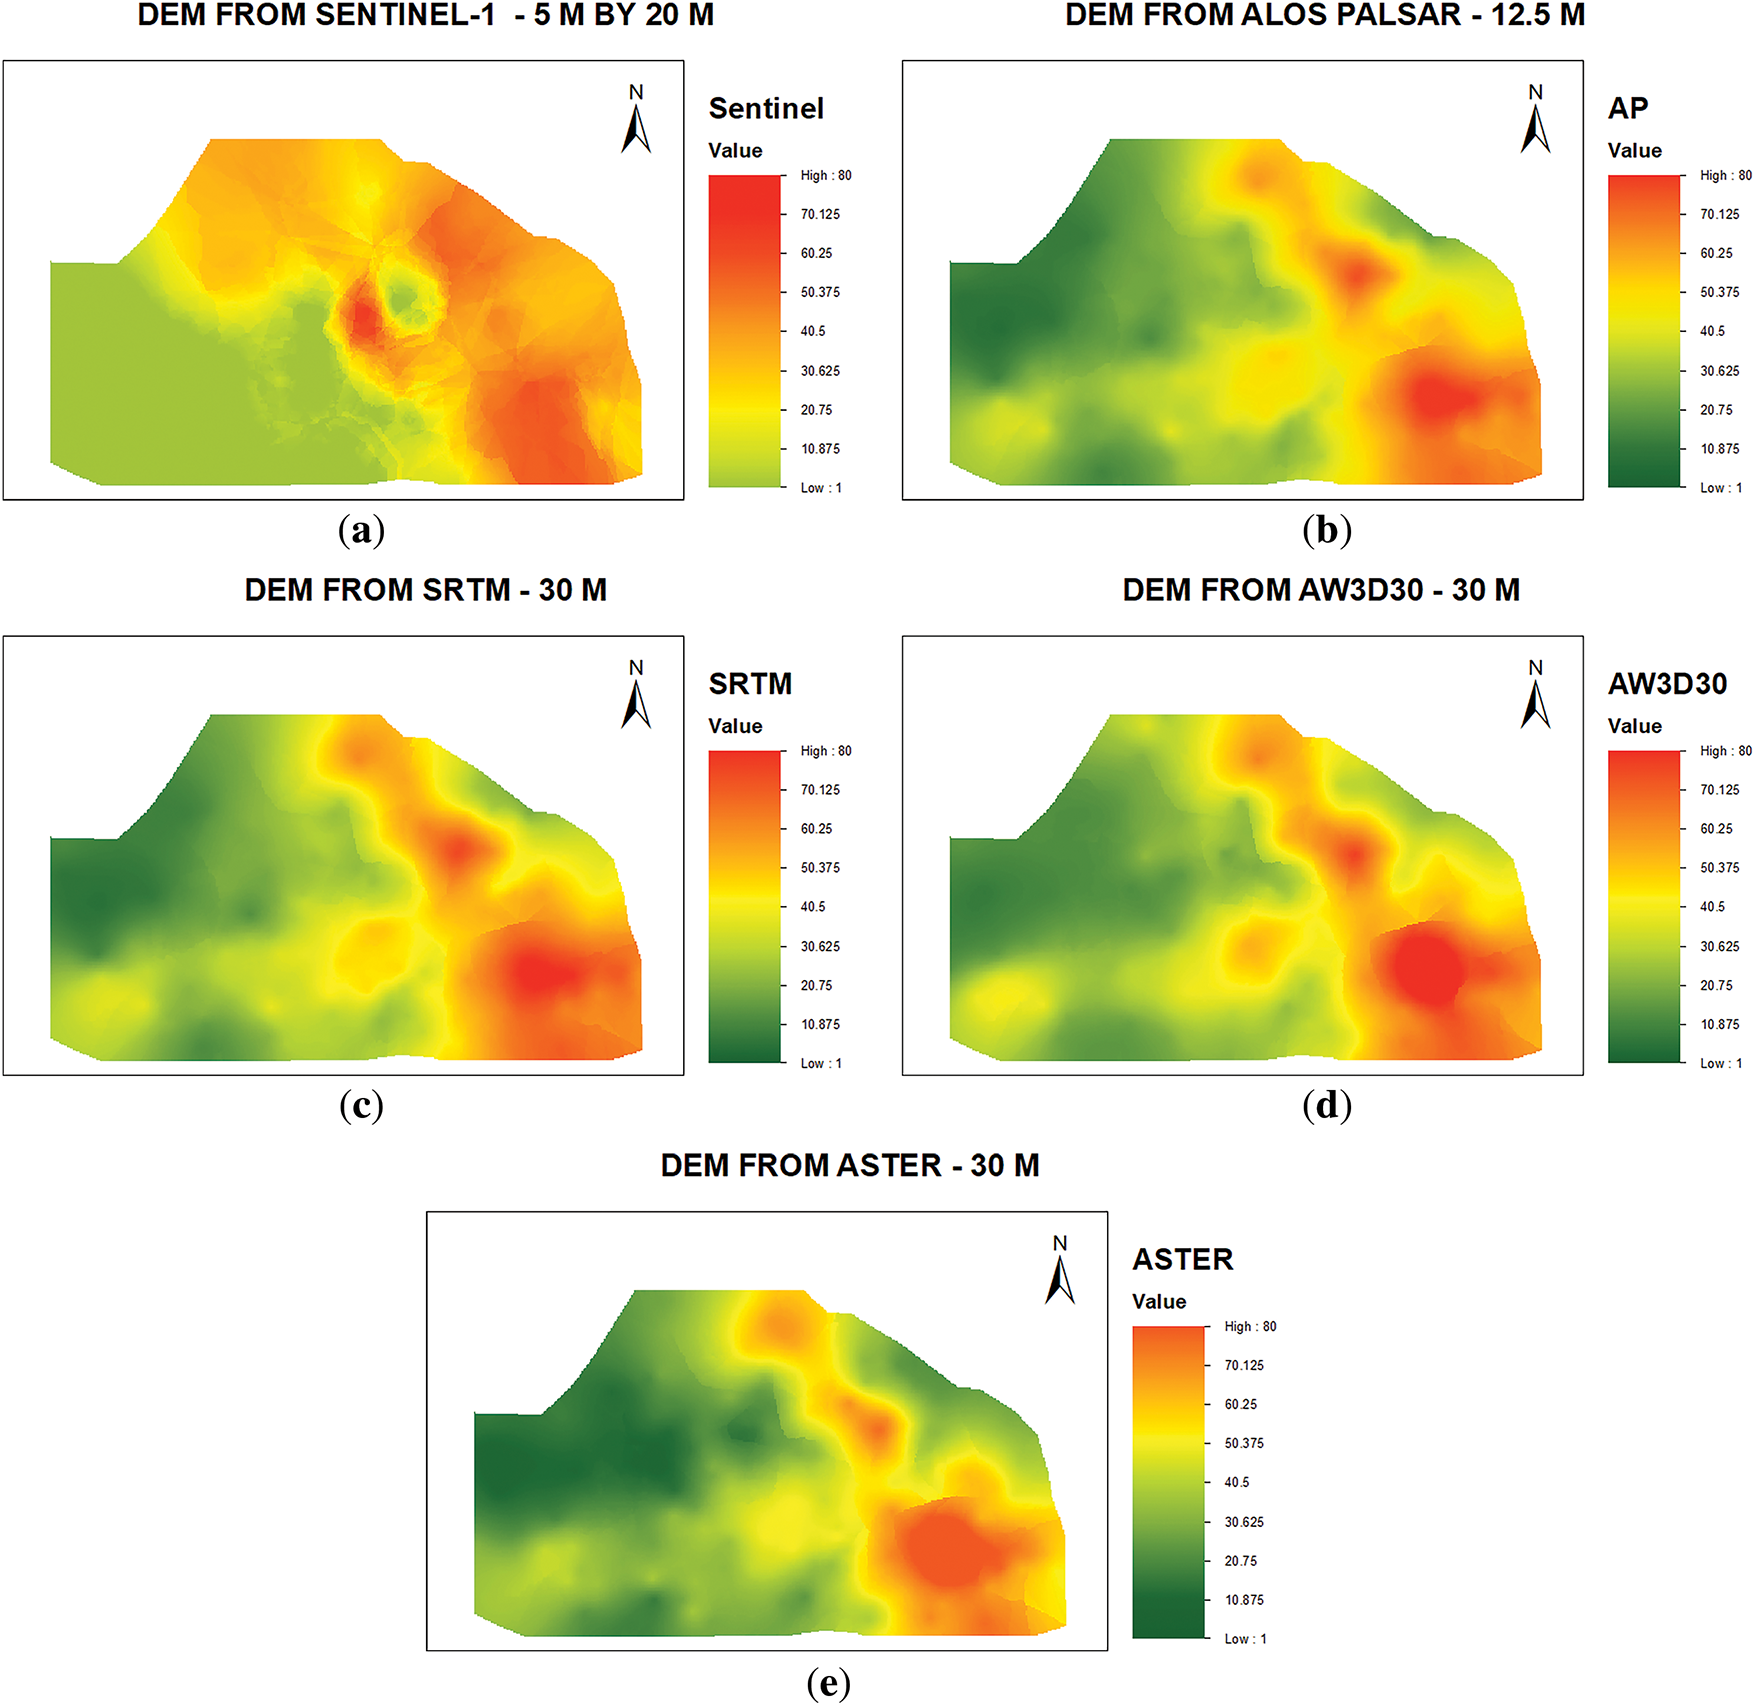
Figure 6: Generated DEM (a) Sentinel-1 (b) ALOS PALSAR (c) SRTM (d) AW3D30 (e) ASTER
Based on the results, the generated DEMs represented the surface elevation in orthometric height (MyGeoid) and visualized the elevation values using a stretched color ramp with the interval between the elevation separated into 8 classes with maximum set to 80 m and minimum 1 m to shows the elevation difference between the generated DEMs in Fig. 6 with the reference DEM in Fig. 5. According to the reference DEM, DEMs with below 30 m resolution, Sentinel-1, and ALOS PALSAR, have been shown a distinct ground representation. Other reasons causing DEM errors are terrain slope, land cover (vegetation or building) and particular sensor issues. In the case of Sentinel-1 data, decorrelation may occur as a result of a long temporal baseline and a large perpendicular baseline. Despite its L-band and wide swath advantages, which allow ALOS PALSAR to penetrate through the vegetation canopy, the accuracy of ALOS PALSAR DEM in high vegetation or hilly areas may be compromised by volume scattering and terrain distortion.
The results show that the DEM from Sentinel-1 did not reliably represent ground elevation data even though it has a high resolution of 5 m by 20 m. It can be spotted that the ground representation from this DEM did not accurately represent the valid ground data when compared to the reference DEM and also exhibited various noises in the data. This can be confirmed when one of the locations with a high elevation from the reference DEM was not presented in the DEM from Sentinel-1. In contrast, the lowest elevation from the referenced DEM was visualized as the high elevation in the DEM from the Sentinel-1 elevation data. In contrast to the Sentinel-1 DEM, which failed to depict ground elevation data accurately, the second evaluated DEM of below 30 m resolutions, ALOS PALSAR, with a resolution of 12.5 m, provided a more dependable surface representation due to its satisfactory resolution. Based on the visualization, the surface representation from this DEM shows almost similar surface elevations to reference DEMs when it shows the actual locations with high and lowest elevations. The surface representation was also most faithful to the ground elevation data.
Next, in the category of DEMs above 30 m resolution, the SRTM, AW3D30, and ASTER DEMs also show slightly different surface representations from each other, even though they have the same resolution of 30 m. These differences among them can be spotted in the DEM from SRTM and AW3D30, which shows a surface representation that is approximately the same when compared to the reference DEM and ALOS PALSAR, even though this DEM has a resolution of 30 m only, making it difficult to distinguish between them based on their visualizations alone when it shows the high elevations and low elevations same as the reference DEM that represents the ground truth data. This representation shows that the ground truth data can rely on the elevation data from DEMs that provide free access and low resolution. However, for surface representation from elevation data of ASTER that also have the same resolution as SRTM and AW3D30, it did not accurately show the surface representation when compared to the reference DEM, ALOS PALSAR, SRTM, and AW3D30 when it shows some of the locations that are supposed to have high elevations with lower elevations representation. Despite the presentation of surface, the comparative analysis of the elevation values derived from the different DEMs against the GPS-based elevation values revealed significant discrepancies across various GCPs as shown in Fig. 7.
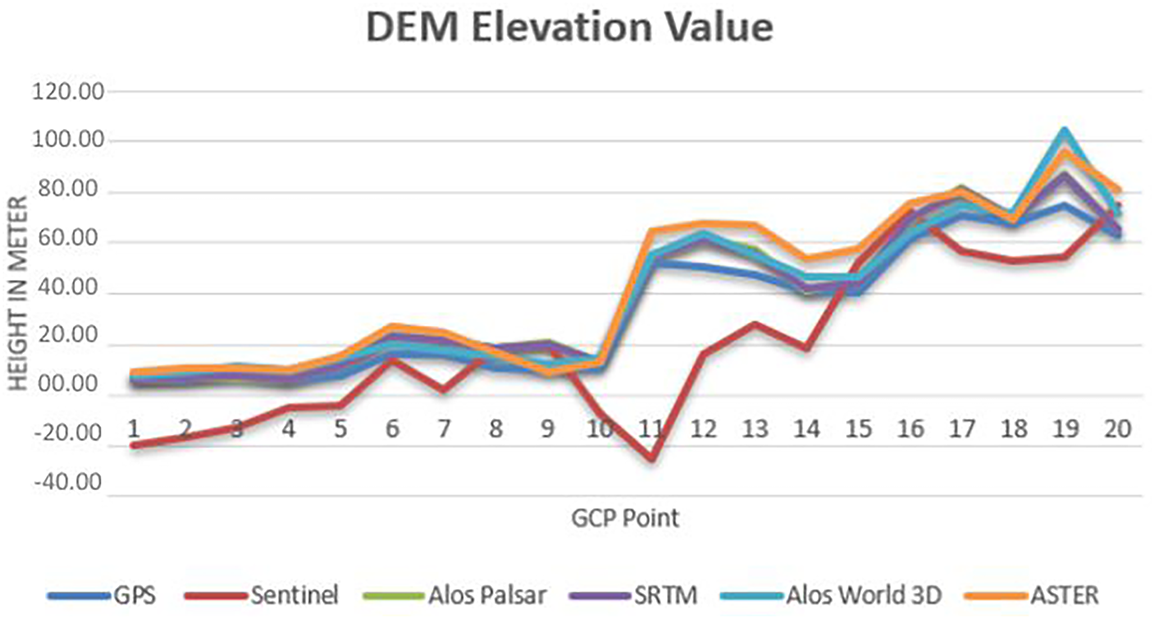
Figure 7: DEM elevation value
The Sentinel-1 DEM exhibited the most important deviations, with some values significantly lower than the GPS measurements. For instance, at GCP 1, the GPS elevation was 6.52 m, whereas the Sentinel-1 elevation was −19.86 m, indicating a substantial underestimation. Fig. 7 also shows that the Sentinel-1 DEM consistently shows lower elevation values, it suggests that the Sentinel DEM is less reliable for accurate elevation representation in this study area, as evidenced by its significant underestimations. In contrast, the ALOS PALSAR DEM provided elevation values closer to the GPS measurements, though some discrepancies were still observed. For example, at GCP 6, the GPS elevation was 16.21 m, while the ALOS PALSAR value was 23.79 m, showing an overestimation. Fig. 6 shows that the ALOS PALSAR DEM has an elevation representation similar to the GPS elevation data. Even if it still shows some overestimations, it is still more accurate than Sentinel-1. For resolutions below 30 m, SRTM, AW3D30, and ASTER DEMs generally agreed better with the GPS measurements than Sentinel-1. However, variations were still present. For instance, at GCP 19, the GPS elevation was 74.86 m. However, the SRTM, AW3D30, and ASTER values were 86.56, 104.76, and 95.90 m, respectively, indicating an overestimation by all three DEMs. These three DEMs still overestimate the elevations, especially at higher elevation points. However, it provides more consistent and closer elevation values to the GPS measurements while exhibiting overestimation tendencies at specific points. These elevations show the disparities between each other. Fig. 8 shows that the elevation disparities between DEMs and GPS data were significant.
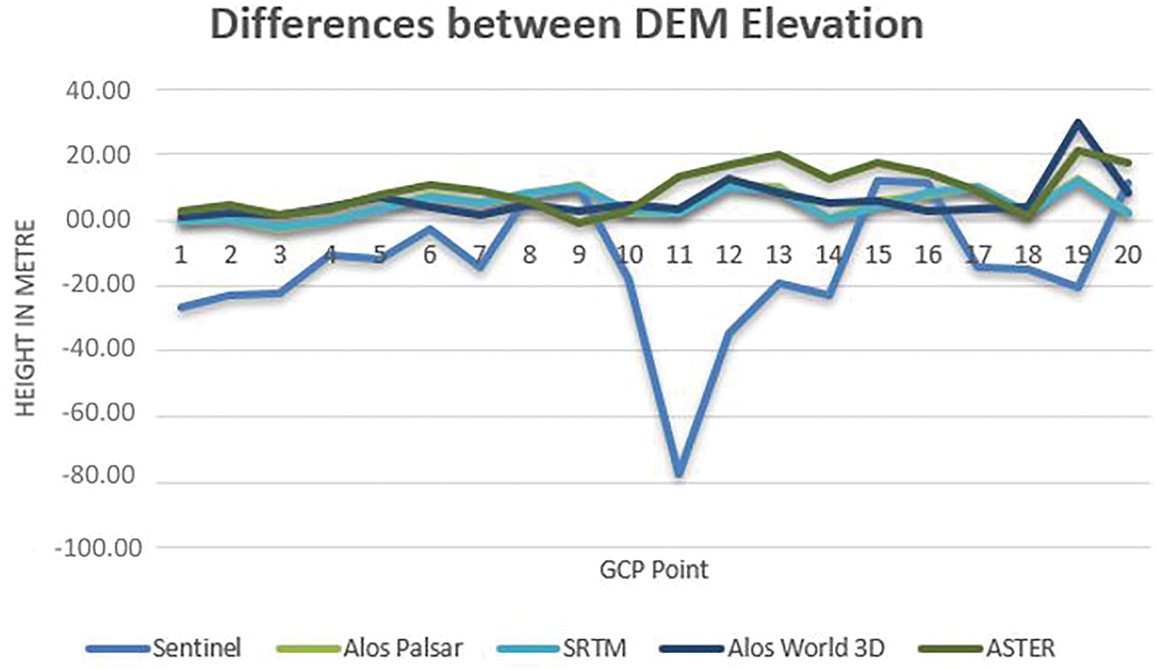
Figure 8: Differences between DEM elevation value
The analysis of the differences in elevation between the various DEMs and GPS measurements revealed notable discrepancies. The Sentinel-1 DEM exhibited the most significant variations, with elevation differences ranging from 11.78 m at GCP 15 to a maximum of −77.42 m at GCP 11. This wide range of discrepancies indicates substantial inconsistencies in the Sentinel-1 DEM, suggesting potential issues in its vertical accuracy for the study area. In contrast, the ALOS PALSAR DEM generally showed more minor discrepancies, mostly within ±10 m, except for more significant errors at GCP 3 and GCP 19. This suggests that while ALOS PALSAR provided relatively consistent elevation values, there were still notable errors in certain locations. The SRTM DEM demonstrated moderate discrepancies, ranging from −2.35 m at GCP 3 to 11.70 m at GCP 19. The fewer extreme errors compared to Sentinel-1 and ALOS PALSAR indicate a fair level of vertical accuracy. The AW3D30 DEM had discrepancies ranging from 29.90 m at GCP 19 to 1.14 m at GCP 1, suggesting significant errors at specific points but generally moderate discrepancies similar to SRTM. The ASTER DEM showed the most significant errors among the evaluated DEMs, with discrepancies ranging from 21.04 m at GCP 19 to −0.82 m at GCP 9. This indicates considerable inaccuracies in representing ground elevation, making ASTER less reliable for precise elevation mapping in the study area. While the SRTM and ALOS PALSAR DEMs were relatively more reliable, no DEM was perfectly aligned with the GPS elevation data, highlighting the importance of careful DEM selection based on specific study requirements and area characteristics. For the accuracy assessment for all evaluated DEM from these 20 GCP is focused on the elevation values for each model in terms of RMSE and ME as shown in Table 2. RMSE exhibits, on average, how far observed values differ from the actual value. The ME provides information on whether a set of measurements consistently underestimates (negative ME) or overestimates (positive ME) the actual value.

RMSE represents the average error for each DEM, while ME indicates the mean tendency of predicted elevation values to be higher or lower than DEM values. Based on Table 2, the average inaccuracy of Sentinel-1 is 24.54 m, while ME predicts elevations to be 14.05 m lower than actual values. The ALOS PALSAR DEM estimated an average inaccuracy of 6.64 m, substantially lower than Sentinel-1. The ME of ALOS PALSAR DEM predicts heights 4.88 m higher than actual values. Next, the average SRTM DEM error is 6.29 m indicating a 4.71 m underestimate. AW3D30 DEM has an average inaccuracy of 8.52 m, with an underestimation of 5.89 m, while the ASTER DEM has an average inaccuracy of 11.64 m and an underestimation of 9.53 m.
In conclusion, the study demonstrated that high-resolution DEMs like Sentinel-1 and ALOS PALSAR offer detailed elevation data, but their performance can vary due to processing dependencies and band differences. ALOS PALSAR’s L-band is more reliable for interferometric applications in vegetated regions, providing more accurate ground elevation data than Sentinel-1’s C-band, which can generate increased noise. Among the 30 m resolution DEMs, SRTM and AW3D30 provide more consistent and accurate terrain representations compared to ASTER. Statistical validation using RMSE and ME indicated that Sentinel-1 is the least accurate, while SRTM is the most accurate, with ALOS PALSAR, AW3D30, and ASTER showing intermediate accuracy. Therefore, the choice of DEM should depend on the specific accuracy requirements of the application. Further research is recommended to expand the study to urban areas without vegetation with varied topographies, to generalize the findings and assess the effects of DEM from Sentinel-1 in urban environments. This will help understand how these DEMs perform under different environmental conditions. Additionally, investigating the temporal stability of DEMs by comparing data from different time periods can provide insights into how they perform over time, revealing changes in accuracy and bias due to seasonal variations or other temporal factors. Evaluating more DEM products, including commercial options, can also provide a broader comparison and help identify whether other available DEMs offer better accuracy and reliability for specific applications. It would also be interesting for future studies to examine the impact of various interpolation methods on the DEM generation process to determine how techniques such as Kriging, IDW, or spline may affect the accuracy of the elevation data.
Acknowledgement: We would like to thank the Ministry of Higher Education Malaysia (MOHE) for supporting this study via the Fundamental Research Grant Scheme—FRGS/1/2021/WAB07/UiTM/02/1. Then, we would like to extend our gratitude to the ASF Data Search for providing the image of Sentinel-1 and ALOS PALSAR with a resolution below 30 m that was used in this study. Additionally, special thanks go to the U.S. Geological Survey (USGS), Open Topography and Earth Data NASA for providing the DEM with resolutions above 30 m which is SRTM, ASTER and AW3D30, respectively.
Funding Statement: This research was funded by the Ministry of Higher Education Malaysia (MOHE) through the Fundamental Research Grant Scheme (FRGS/1/2021/WAB07/UiTM/02/1).
Author Contributions: Muhamad Ammar Hanif Arif was responsible for research design, GPS data collection, DEM processing, statistical analysis, and drafting the original manuscript. Amir Sharifuddin Ab Latip led the research project and contributed to the critical discussion of the methodology design, guided the DEM accuracy assessment, and edited the manuscript for technical content and clarity. Siti Balqis Mohd Tun participated in GPS data collection, processing of DEM datasets, and drafting the manuscript. Nur Azlina Hariffin participated in structuring and revising the manuscript. Adel Gohari and Mohd Hakimi Abdul Rahman reviewed the manuscript and gave valuable technical and editorial changes in terms of geospatial data interpretation and validation. All authors reviewed the results and approved the final version of the manuscript.
Availability of Data and Materials: The datasets used and/or analyzed during the current study are available from the corresponding author upon reasonable request. Public datasets used for DEM generation are available from: Sentinel-1: https://scihub.copernicus.eu/; ALOS PALSAR: https://search.asf.alaska.edu/; SRTM: https://earthexplorer.usgs.gov/; AW3D30: https://www.eorc.jaxa.jp/ALOS/en/aw3d30/ (accessed on 01 January 2025); ASTER GDEM: https://search.earthdata.nasa.gov/.
Ethics Approval: Not applicable.
Conflicts of Interest: The authors declare no conflicts of interest to report regarding the present study.
References
1. Habib M, Alzubi Y, Malkawi A, Awwad M. Impact of interpolation techniques on the accuracy of large-scale digital elevation model. Open Geosci. 2020;12(1):190–202. doi:10.1515/geo-2020-0012. [Google Scholar] [CrossRef]
2. Mesa-Mingorance JL, Ariza-López FJ. Accuracy assessment of digital elevation models (DEMsa critical review of practices of the past three decades. Remote Sens. 2020;12(16):1–27. doi:10.3390/RS12162630. [Google Scholar] [CrossRef]
3. Arungwa ID, Obarafo EO, Okolie CJ. Validation of global digital elevation models in Lagos State, Nigeria. Niger J Env Sci Technol. 2018;2(1):78–88. [Google Scholar]
4. Polidori L, El Hage M. Digital elevation model quality assessment methods: a critical review. Remote Sens. 2020;12(21):1–36. doi:10.3390/rs12213522. [Google Scholar] [CrossRef]
5. Sedeek A. Accuracy assessment of DEMs using modern geoinformatic methods. Geoinformatica. 2019;6(2):13–22. [Google Scholar]
6. Aziz KMA, Rashwan KS. Comparison of different resolutions of six free online DEMs with GPS elevation data on a new 6th of October City, Egypt. Arab J Geosci. 2022;15(20):1–11. doi:10.1007/s12517-022-10845-5. [Google Scholar] [CrossRef]
7. Ihsan HM, Sahid SS. Vertical accuracy assessment on Sentinel-1, Alos Palsar, and DEMNAS in the Ciater Basin. J Geogr Gea. 2021;21(1):16–25. doi:10.17509/gea.v21i1.29931. [Google Scholar] [CrossRef]
8. Liu X, Ran M, Xia H, Deng M. Evaluating vertical accuracies of open-source digital elevation models over multiple sites in China using GPS control points. Remote Sens. 2000 2022;14(9):2000. doi:10.3390/rs14092000. [Google Scholar] [CrossRef]
9. Hirt C, Rexer M. Earth2014: 1 arc-min shape, topography, bedrock and ice-sheet models—available as gridded data and degree-10,800 spherical harmonics. Int J Appl Earth Obs Geoinf. 2015;39(11):103–12. doi:10.1016/j.jag.2015.03.001. [Google Scholar] [CrossRef]
10. Schumann GJP, Bates PD. The need for a high-accuracy, open-access global DEM. Front Earth Sci. 2018;6:225. doi:10.3389/feart.2018.00225. [Google Scholar] [CrossRef]
11. Pa’suya FM, Talib N, Narashid RH, Ahmad Fauzi AF, Amri Mohd F, Abdullah MA. Quality assessment of TanDEM-X DEM 12 m using GNSS-RTK and airborne IFSAR DEM: a case study of Tuba Island, Langkawi. Int J Geoinform. 2022;18(5):87–103. doi:10.52939/ijg.v18i5.2389. [Google Scholar] [CrossRef]
12. Tahir H, Din AHM. Vertical accuracy assessment for open-source digital elevation model: a case study of Basrah City, Iraq. Int Arch Photogramm Remote Sens Spat Inf Sci. 2023;48:355–61. doi:10.5194/isprs-archives-XLVIII-4-W6-2022-355-2023. [Google Scholar] [CrossRef]
13. El Mhamdi A, Aarab M, El Fariati A. Evaluation of the accuracy of open-source DEMs using GPS data. Int J Env Geoinform. 2023;10(1):41–50. doi:10.30897/ijegeo.1119695. [Google Scholar] [CrossRef]
14. Mohammadi A, Karimzadeh S, Jalal SJ, Kamran KV, Shahabi H, Homayouni S, et al. A multi-sensor comparative analysis on the suitability of generated dem from sentinel-1 sar interferometry using statistical and hydrological models. Sensors. 2020;20(24):1–24. doi:10.3390/s20247214. [Google Scholar] [PubMed] [CrossRef]
15. Tadono T, Ishida H, Oda F, Naito S, Minakawa K, Iwamoto H. Precise global DEM generation by ALOS PRISM. ISPRS Ann Photogramm Remote Sens Spat Inf Sci. 2014;2:71–6. doi:10.5194/isprsannals-II-4-71-2014. [Google Scholar] [CrossRef]
16. Darwish N, Kaiser M, Koch M, Gaber A. Assessing the accuracy of alos/palsar-2 and sentinel-1 radar images in estimating the land subsidence of coastal areas: a case study in Alexandria City, Egypt. Remote Sens. 2021;13(9):1838. doi:10.3390/rs13091838. [Google Scholar] [CrossRef]
17. Khasanov K. Evaluation of ASTER DEM and SRTM DEM data for determining the area and volume of the water reservoir. IOP Conf Ser Mater Sci Eng. 2020;883(1):012063. doi:10.1088/1757-899X/883/1/012063. [Google Scholar] [CrossRef]
18. Takaku J, Tadono T, Tsutsui K. Validation of ‘AW3D’ global DSM generated from ALOS PRISM. ISPRS Ann Photogramm Remote Sens Spat Inf Sci. 2016;3:25–31. doi:10.5194/isprs-annals-III-4-25-2016. [Google Scholar] [CrossRef]
19. Grohmann CH. Effects of spatial resolution on slope and aspect derivation for regional-scale analysis. Comput Geosci. 2015;77:111–7. doi:10.1016/j.cageo.2015.02.003. [Google Scholar] [CrossRef]
20. Gesch D, Oimoen M, Greenlee S, Nelson C, Steuck M, Tyler D. The national elevation dataset. Photogramm Eng Remote Sens. 2002;68(1):5–11. [Google Scholar]
Cite This Article
 Copyright © 2025 The Author(s). Published by Tech Science Press.
This work is licensed under a Creative Commons Attribution 4.0 International License , which permits unrestricted use, distribution, and reproduction in any medium, provided the original work is properly cited.
 Downloads
 Citation Tools