
 Submit a Paper
 Propose a Special lssue
 Open Access
ARTICLE

Integrating Temporal Change Detection and Advanced Hybrid Modeling to Predict Urban Expansion in Jaipur, a UNESCO World Heritage City
1 Department of Civil Engineering, Poornima University, Sitapura, Jaipur, 303905, Rajasthan, India
2 Faculty of Environmental Earth Science, Hokkaido University, Sapporo, 060-0808, Hokkaido, Japan
3 Graduate School of Environmental Science, Hokkaido University, Sapporo, 060-0808, Hokkaido, Japan
* Corresponding Author: Sudip Pandey. Email:
(This article belongs to the Special Issue: Application of Remote Sensing and GIS in Environmental Monitoring and Management)
Revue Internationale de Géomatique 2025, 34, 899-914. https://doi.org/10.32604/rig.2025.071156
Received 01 August 2025; Accepted 24 October 2025; Issue published 09 December 2025
 View Full Text
 Download PDF
Abstract
Urban expansion in semi-arid regions poses critical challenges for sustainable land management, ecological resilience, and heritage conservation. Jaipur, India—a United Nations Educational, Scientific and Cultural Organization (UNESCO) World Heritage City located in a semi-arid environment—faces rapid urbanization that threatens agricultural productivity, fragile ecosystems, and cultural assets. This study quantifies past and projects future land use/land cover (LULC) dynamics in Jaipur to support evidence-based planning. Using the Dynamic World dataset, we generated annual 10-m LULC maps from 2016 to 2025 within the municipal boundary. Temporal change detection was conducted through empirical transition probability analysis, and future scenarios for 2026–2030 were simulated with a Markov chain model coupled with a neighbour-aware cellular automata (CA–Markov) allocation to capture spatial diffusion and terrain constraints. Validation on a 2025 hold-out achieved an Overall Accuracy of 0.79, Cohen’s κ of 0.15, and a figure of Merit of 0.073 for built-up gains, confirming credible localization of urban growth. Results reveal that the built-up area expanded from 340.57 km2 in 2016 to 387.25 km2 in 2025 (+13.71%) and is projected to rise by +44.96% by 2030. Over 2016–2025, cropland declined by −40.83%, shrub/scrub by −27.71%, tree cover by −4.12%, and flooded vegetation by −41.28%, while bare ground (+3.14%), grass (−4.22%), and water (~+0.18%) showed minimal change. Forecasts for 2016–2030 indicate severe contractions in crops (−98.40%), shrub/scrub (−93.10%), trees (−80.44%), grass (−95.36%), water (−99.53%), bare ground (−99.51%), and flooded vegetation (−99.80%). These findings highlight an accelerating transformation of Jaipur’s peri-urban landscape, with built-up expansion occurring at the expense of nearly all productive and ecological land classes. The study demonstrates that CA–Markov–based LULC forecasting provides a reproducible and transparent framework for high-frequency monitoring and offers actionable insights for sustainable urban management in heritage cities under rapid growth pressure.Keywords
Urban expansion in semi-arid cities such as Jaipur, India UNESCO World Heritage Cityposes pressing challenges for sustainable land management, food security, and ecological conservation [1]. Jaipur, like many rapidly growing urban centers in South Asia, is experiencing dramatic transformations in its land use and land cover (LULC) patterns, largely driven by population growth, economic development, and intensifying demands for housing and infrastructure [2]. These processes often result in the conversion of agricultural land and natural vegetation into built-up areas, fundamentally reshaping the landscape and threatening vital ecosystem services [3]. The proliferation of impervious surfaces intensifies surface runoff, increases local land surface temperatures, and exacerbates the urban heat island effect, while the loss of cropland and green spaces compromises food security, groundwater recharge, and biodiversity [4]. In heritage cities, unchecked urban growth can also imperil cultural assets, degrade historical urban fabric, and jeopardize tourism-related revenue [5]. Accurate monitoring and projection of these spatial dynamics are therefore essential for guiding sustainable urban planning, mitigating environmental degradation, and safeguarding the region’s unique cultural and ecological assets [6]. In recent decades, Jaipur has faced rising ecological pressure as the city’s population and industries have expanded. Vehicle emissions, factory smoke, and unplanned construction have led to worsening air quality, filling the atmosphere with dust and harmful pollutants. Water resources are also under strain, with groundwater overuse and untreated industrial waste contaminating supplies and reducing both their quality and availability. At the same time, noise pollution from traffic, especially motor vehicles, has reached alarming levels, far exceeding permissible limits in all areas of the city [7,8].
Among the most significant drivers of unregulated urban expansion in such environments are (i) rapid population growth, (ii) weak enforcement of land use policies, (iii) increasing economic pressures, and (iv) poor institutional coordination (Fig. 1). Each of these factors independently and synergistically contributes to the encroachment of built-up areas onto agricultural and ecologically sensitive zones [9]. Population growth fuels the demand for housing and infrastructure; weak policy enforcement and fragmented governance reduce the efficacy of land management strategies; and economic pressures—such as real estate speculation and industrialization—accelerate the conversion of open spaces [10]. Poor institutional coordination between agencies further undermines integrated land use planning, enabling patchy, often unsustainable development [11].
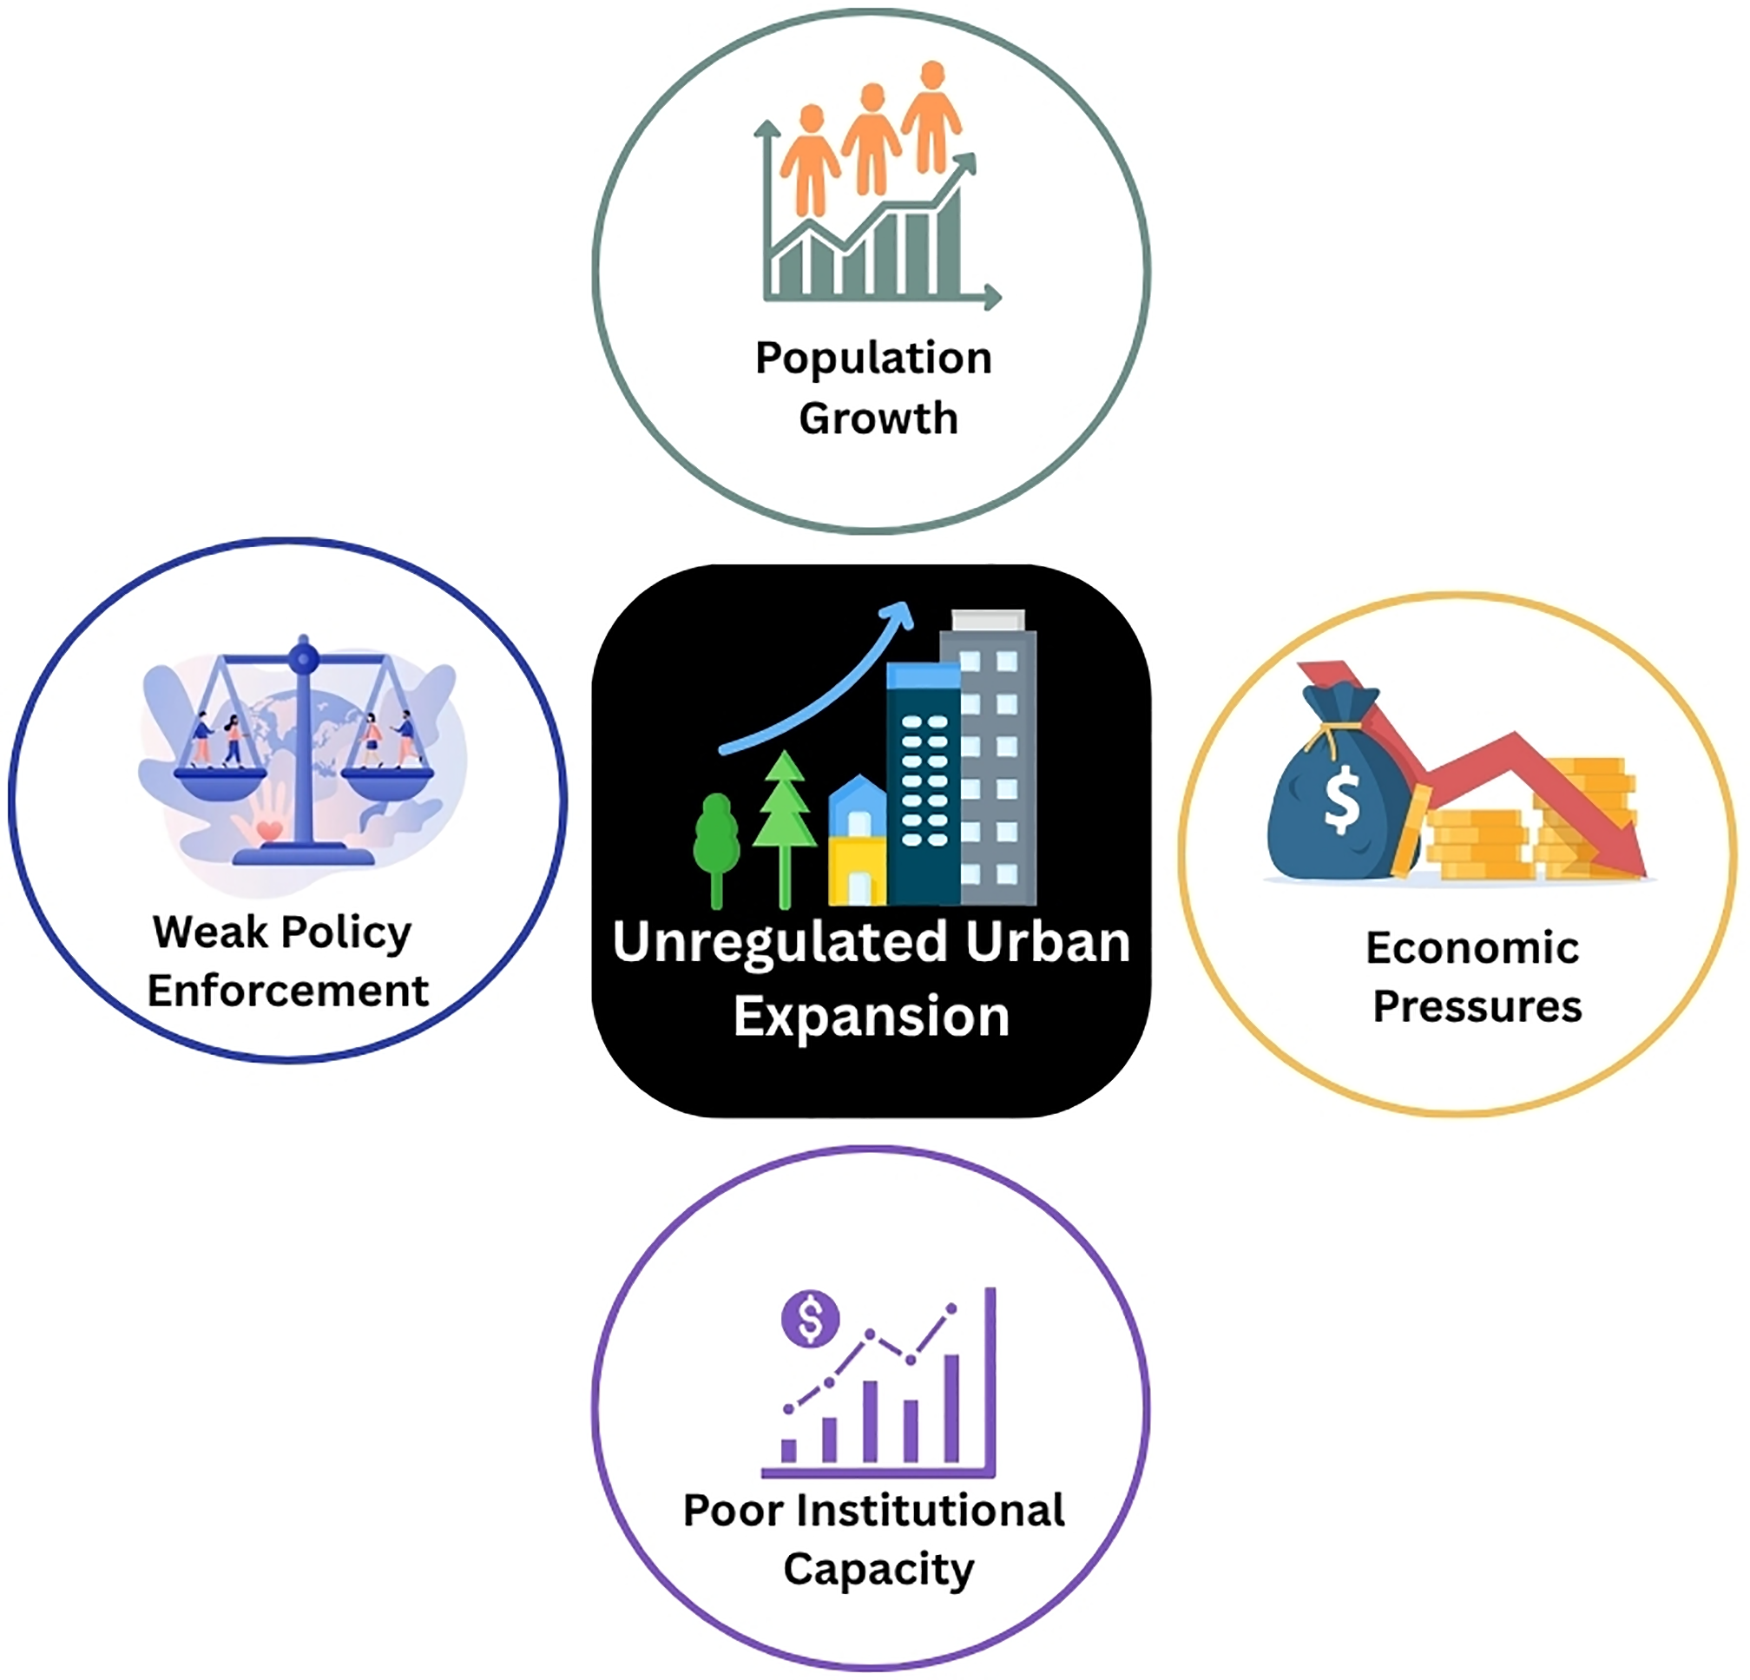
Figure 1: Primary drivers contributing to unregulated urban expansion in semi-arid heritage cities
However, traditional LULC mapping approaches—often reliant on decadal census data or coarse-resolution satellite products—are insufficient to capture the pace and granularity of recent urban change, particularly in fast-evolving peri-urban zones [12]. In recent years, significant advances have been made in the analysis and prediction of land use and land cover (LULC) dynamics. These advances leverage multispectral satellite imagery, advanced hybrid modeling techniques, and cloud-based geospatial platforms. The integration of Cellular Automata (CA), Markov chains, machine learning, and deep learning models has notably improved the accuracy and interpretability of spatiotemporal urban change simulation [13]. These innovations enable both retrospective analysis of historical landscape transformations and robust scenario forecasting, providing essential evidence to inform sustainable urban development policies in rapidly changing environments such as Jaipur.
Duan et al. (2025) conducted a comprehensive study on the Okara District of Pakistan, employing a hybrid CA-Markov model in combination with high-resolution Landsat imagery and a decision tree classifier, which achieved accuracies exceeding 95%. Their findings revealed a marked decline in vegetation cover (from 92.7% to 88.2% between 1994 and 2024) and a substantial expansion of built-up areas, projected to reach 14.9% by 2044. The CA-Markov approach enabled both retrospective analysis and future scenario projection, providing valuable insights for planners aiming to balance urban growth with ecological conservation [14]. The reliability of hybrid modeling was further enhanced by Mostafa et al. (2023), who integrated a fuzzy analytical hierarchy process (FAHP) with the CA-Markov framework to simulate LULC dynamics in Gharbia, Egypt. Their model accurately captured the spatial drivers of urbanization, identifying ongoing urban encroachment onto agricultural lands and its impact on land surface temperature (LST). The study highlighted that agricultural land declined from 91.2% in 1991 to 83.7% in 2018, with the built-up area nearly doubling by 2048. The FAHP-CA-Markov hybrid model outperformed the standalone CA-Markov approach, underlining the importance of incorporating expert knowledge and spatial criteria in predictive LULC modeling [15]. Recent methodological innovations have focused on harnessing deep learning and transformer-based architectures for simulating urban land change. Li et al. (2024) introduced a novel spatiotemporal simulation framework that couples a transformer encoder and a convolutional neural network (CNN) within a CA model (TC-CA). Applied to Wuxi City, China, this approach demonstrated superior accuracy compared to traditional random forest-CA and CNN-CA models, improving the figure of merit by up to 8.14%. The study showed that incorporating both spatial and temporal dependencies via transformer architectures can substantially enhance the predictive power of urban expansion models [16]. Similarly, Zhu et al. (2024) proposed an explainable ensemble deep learning framework for intra-urban simulation in Shenzhen, China. Their approach leveraged transformers for encoding multi-temporal spatial features and implemented channel-wise attention modules to address model interpretability. The ensemble framework outperformed all baseline methods, providing robust and interpretable forecasts of urban growth patterns [17]. In the context of cloud-based geospatial analysis, Zhang et al. (2025) utilized Google Earth Engine and predictive models (including Random Forest and CA-ANN-MLP) to analyze historical and future LULC changes in Multan and Sargodha, Pakistan, from 1990 to 2030. The study revealed rapid urban expansion, with built-up areas more than doubling over three decades. The integration of cloud computing, machine learning, and CA-based simulation enabled high-accuracy, scalable analysis of LULC dynamics and the identification of potential urbanization hotspots for sustainable urban planning [18].
The rapid pace of urbanization in Jaipur—a semi-arid and culturally significant UNESCO World Heritage City—has outstripped the capacity of traditional, decadal LULC mapping approaches, which lack the temporal resolution and spatial precision needed to track ongoing landscape transformations. Although hybrid models such as CA–Markov, FAHP–CA–Markov, and deep learning–enhanced CA frameworks have shown considerable promise in simulating urban change, they have seldom been applied to heritage cities like Jaipur and rarely leverage annual, high-frequency, globally consistent LULC products such as Google’s Dynamic World. In this study, we utilized ten years of LULC data to train the Markov model, enabling a more accurate projection of land-use transitions and urban dynamics in the region. Jaipur highlights the pressing challenges of balancing rapid urban expansion with ecological sustainability and heritage preservation. As a UNESCO World Heritage City located in a semi-arid region, it faces severe stress on air and water quality, groundwater reserves, and fragile ecosystems [7,8].
This study addresses this gap by employing the annual LULC time series derived from Dynamic World to compute empirical transition probabilities and calibrate a Markov chain model for scenario forecasting of urban growth from 2026 to 2030. Its novelty lies in integrating temporally dense, globally uniform LULC data with pixel-level transition modeling, enabling quantification of subtle and rapid changes in built-up, agricultural, and natural classes within a complex, heritage-sensitive environment.
The insights generated are critical for urban planners and conservation authorities, offering timely evidence on annual landscape dynamics and forecasted trajectories that support sustainable land management, heritage protection, and peri-urban ecological resilience. Moreover, the methodology presents a replicable framework for other fast-growing cities within data-rich yet analytically underserved regions.
2.1 Study Area and Data Sources
The study focuses on Jaipur city, India—a semi-arid region and UNESCO World Heritage City. The city’s official municipal boundary shapefile was used as the region of interest (ROI) for all analyses. Annual land use/land cover (LULC) data from 2016 to 2025 were acquired from the Dynamic World dataset (Gong et al., 2022), a global, 10-m resolution LULC product based on Sentinel-2 imagery. Brown et al. (2022) mention that the Dynamic World dataset has an accuracy of about 80%–90%, making it a valuable source for LULC. In this study, each year’s LULC map was clipped to the Jaipur boundary.
We chose the municipal ROI because it aligns with the jurisdiction of local planning policies and reporting, ensuring that results are directly actionable for governance. We selected 2016 as the start year because it coincides with stable Sentinel-2 coverage and the availability of Dynamic World classifications needed to build a consistent annual time series (Fig. 2).

Figure 2: Location map of Jaipur city, Rajasthan, India. Shows Jaipur’s position within the state of Rajasthan, while the enlarged map highlights the municipal boundary of Jaipur, which was used as the region of interest (ROI) for land use/land cover (LULC) analysis
2.2 Data Preprocessing and LULC Map Generation
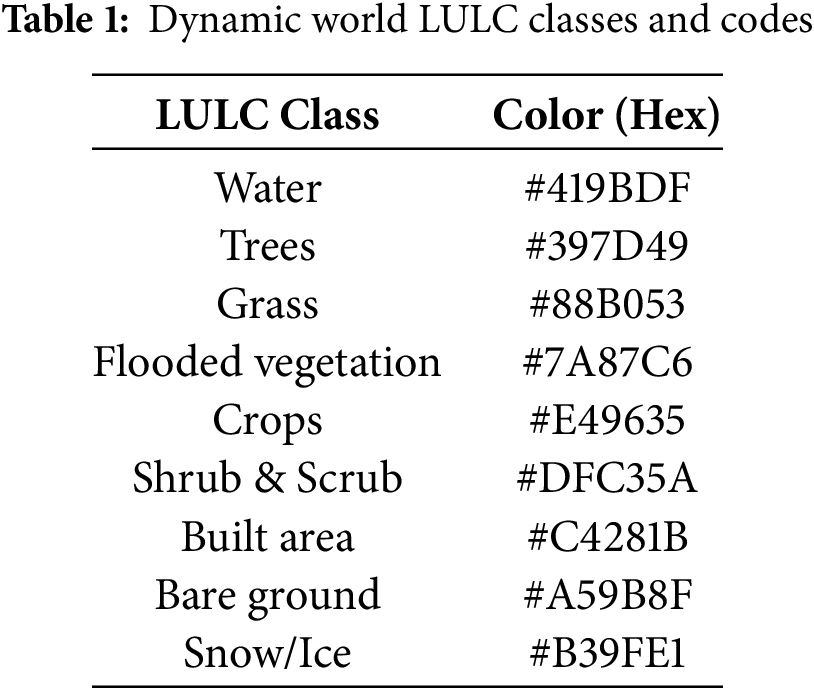
All raster data were projected to UTM Zone 43N (EPSG:32643), resampled to 10 m resolution, and clipped to the ROI. The class encoding followed Table 1. Consistency checks ensured the absence of data gaps within the ROI.
Annual LULC transitions were quantified by pixel-wise comparison for each consecutive year. The area of each class in the year
where
To reduce noise and better exploit temporal information, we aggregate transitions across all consecutive year pairs (2016→2017, …, 2024→2025) rather than relying only on start–end years; this provides more stable empirical estimates for subsequent modeling.
2.4 LULC Change Modeling and Future Prediction
Future LULC maps for 2026–2030 were predicted using a Markov chain model. The probability of a pixel transitioning from class iii to class j was determined by Eq. (2):
where Pij is the transition probability and Sij is the count of 10-m pixels (non-negative integer; Sij ∈ N0 observed to transition from class i to j over the historical period, aggregated across all consecutive year pairs (2016→2017, …, 2024→2025) within the ROI. Let Ni =
2.4.2 Multi-Year Iterative Forecasting
The transition probability matrix P was iteratively applied to generate predictions for each subsequent year by using Eq. (3):
where
2.4.3 Neighbour-Aware Allocation of Markov Totals (CA–Markov)
To explicitly account for neighbourhood diffusion (as requested by the reviewers), we spatially allocate the Markov totals using a cellular-automata (CA) rule that combines (i) neighbourhood density (5 × 5 Moore kernel) of the target class, (ii) proximity to existing built-up (distance-transform inverted to proximity), and (iii) terrain flatness (1 − normalized slope). The composite suitability U is formed as Eq. (4):
with weights wn = 0.60, wp = 0.25, ws = 0.15 (tested 3 × 3–7 × 7 kernels in sensitivity). For each forecast year t + 1, we convert the top-N non-built pixels ranked by Ubuilt, where N is chosen so that the built-up area equals the Markov total for that year (thus preserving class balances while producing spatially coherent growth).
For each predicted map, the area per class was calculated as in Eq. (1). Percentage change between 2016 and 2030 was determined by Eq. (5):
where
2.6 Visualization and Software Implementation
Predicted maps were visualized with the Dynamic World palette and exported as 300 dpi transparent PNGs, showing only the ROI. All analyses were performed in Python (v3.10) using rasterio, geopandas, numpy, and matplotlib, within a Jupyter Notebook workflow to ensure reproducibility.
2.7 Accuracy Assessment and Model Validation
This study used a temporal hold-out: transitions were estimated from 2016–2024 and the CA–Markov model predicted the 2025 map from the observed 2024 map. Accuracy was computed wall-to-wall at 10 m over the municipal ROI from the pixel-level confusion matrix C = [cij] (rows = reference 2025; columns = prediction). We report Overall Accuracy (OA) and Cohen’s κ for classification performance (summarized in Fig. 3), and the Figure of Merit (FoM) for built-up gain to assess change localization (class-wise results in Fig. 4):
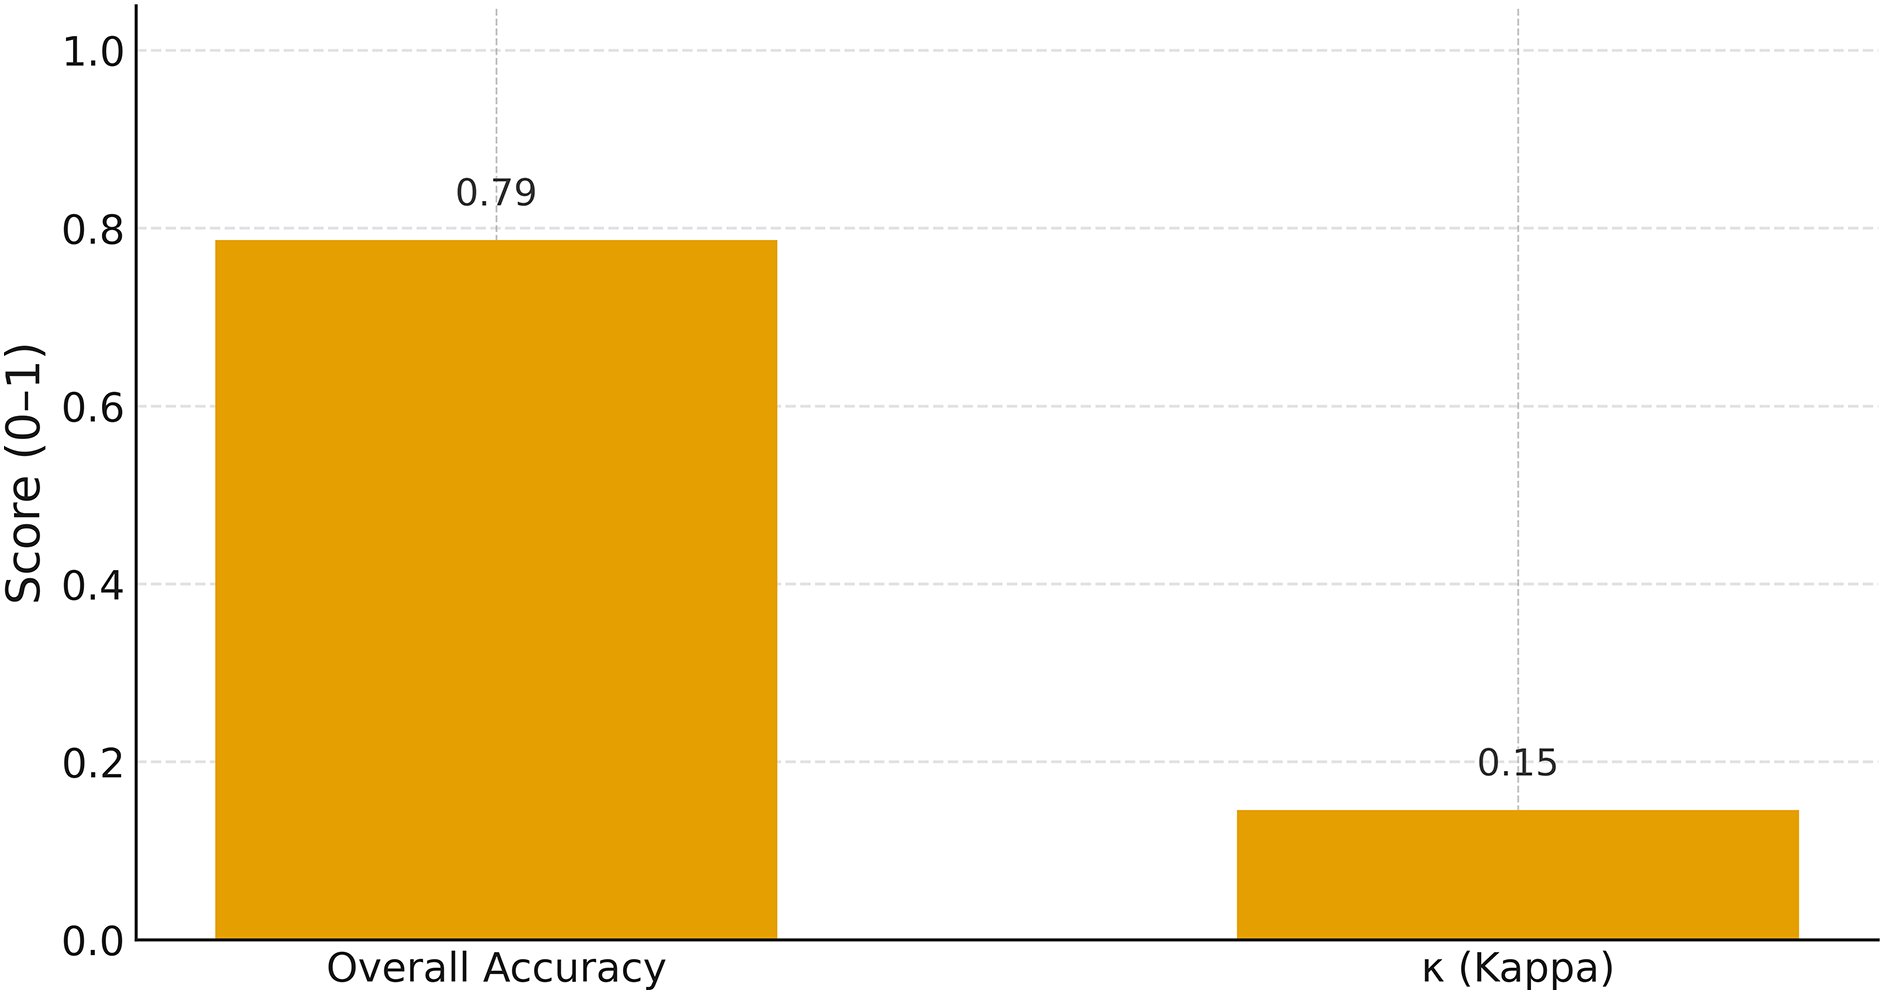
Figure 3: Overall accuracy and Cohen’s κ for the CA–Markov model on the 2025 hold-out
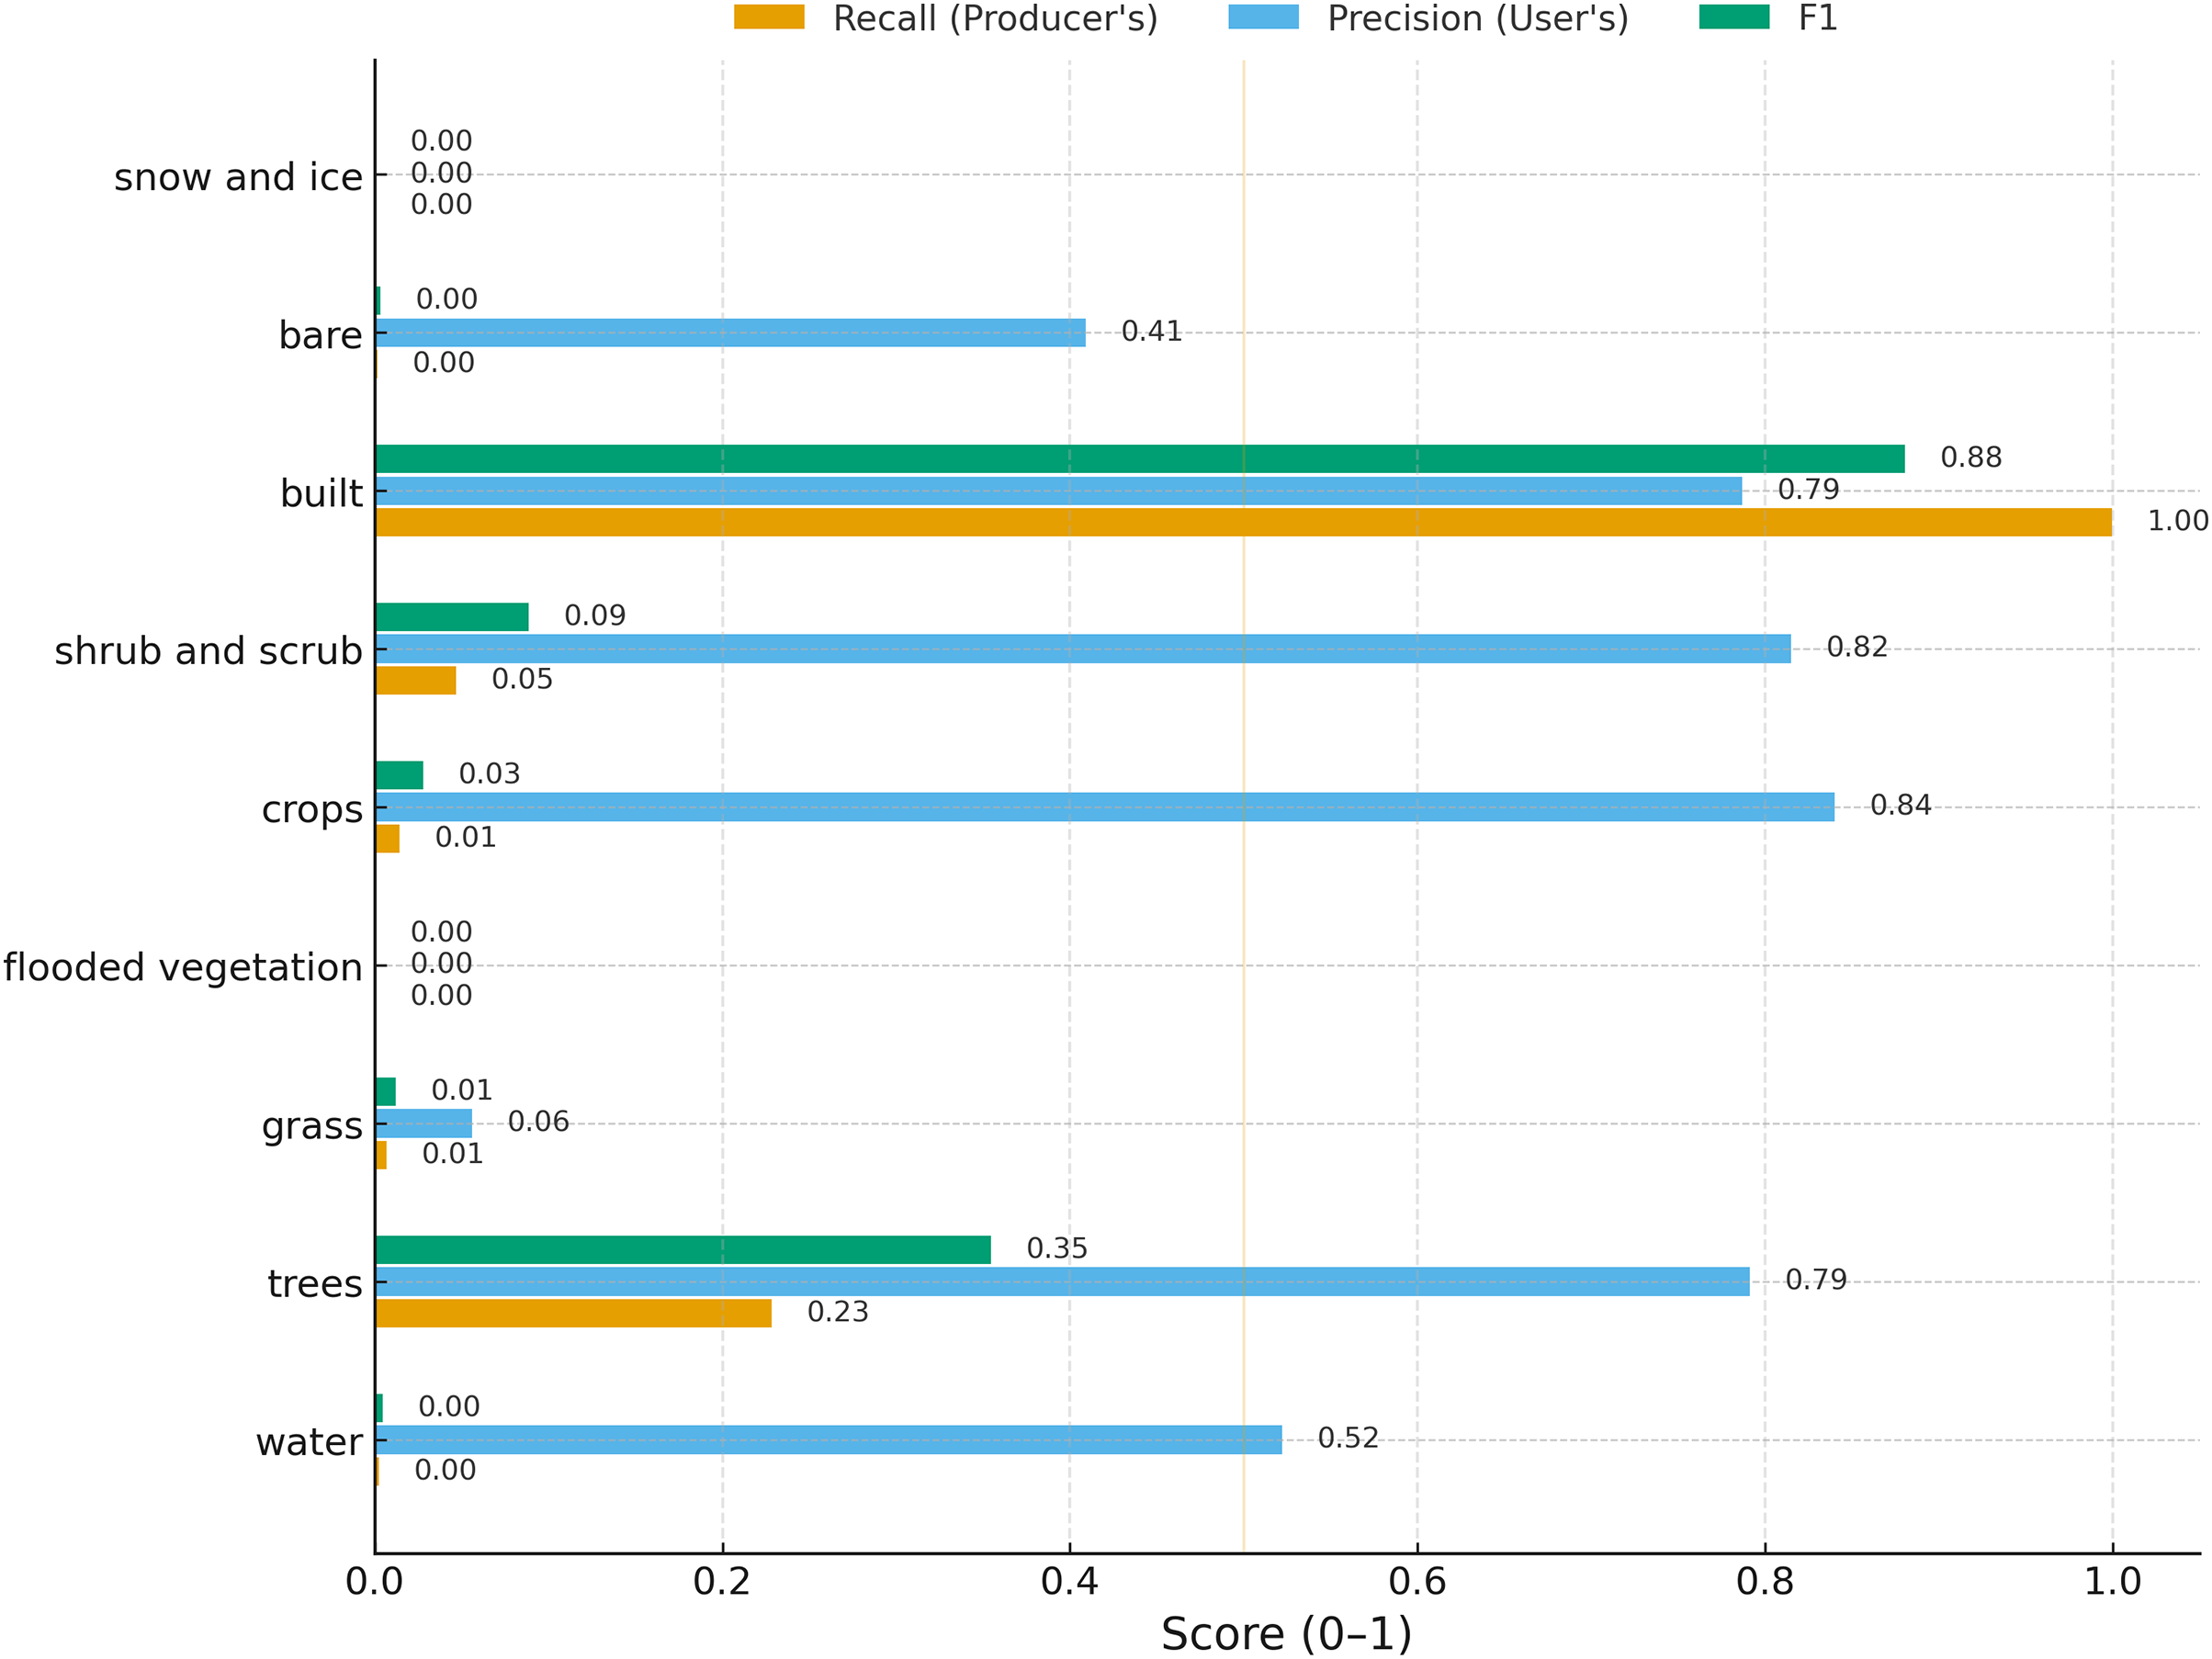
Figure 4: Per-class validation scores for the CA–Markov model on the 2025 hold-out
Here, cij are confusion-matrix diagonal counts; TP, FP and FN are the areas (km2) of correctly, over- and under-allocated newly built-up pixels between 2024 (baseline) and 2025 (reference), respectively. On the 2025 hold-out, the CA–Markov model achieved OA = 0.79 and κ = 0.15. Class-wise scores showed very high built-up localization (F1 ≈ 0.88), with lower performance for conversion-prone vegetation classes at urban fringes. For change localization, FoM = 0.073 with TP = 7.95 km2, FP = 100.26 km2, and FN = 0.06 km2, indicating minimal omission of observed expansion but optimistic allocation in additional suitable areas. Overall, the Markov-for-quantity + CA-for-location. Urban expansion simulation is of significant importance to land management and policymaking. Advances in deep learning facilitate capturing and anticipating urban land dynamics with state-of-the-art accuracy properties. In this context, a novel deep learning-based ensemble framework was proposed for urban expansion simulation at an intra-urban granular level. The ensemble framework comprises (i) multiple deep learning models as encoders, using transformers for encoding multi-temporal spatial features and convolutional layers for processing single-temporal spatial features, (ii) a tailored channel-wise attention module to address the challenge of limited interpretability in deep learning methods. The channel attention module enables the examination of the rationality of feature importance, thereby establishing confidence in the simulated results. The proposed method accurately anticipated urban expansion in Shenzhen, China, and it outperformed all the baseline methods in terms of both spatial accuracy and temporal consistency design preserves empirically learned totals while producing spatially coherent growth fronts; remaining false positives motivate adding drivers (e.g., roads/zoning) or spatially varying rules in future refinements.
3.1 Spatiotemporal Patterns and Quantitative Assessment of Land Use/Land Cover Change in Jaipur (2016–2025)
A decade-long analysis of land use and land cover (LULC) in Jaipur, encompassing the years 2016 through 2025, reveals profound transformations in both spatial configuration and class-wise extents across the metropolitan region. The annual sequence of LULC classification maps, generated using Dynamic World datasets (Fig. 5), provides clear visual evidence of persistent urban growth and the concurrent contraction of agricultural and semi-natural land categories. Each yearly map not only delineates the distribution of dominant classes—such as cropland, shrub & scrub, tree cover, and built-up area—but also reveals subtle shifts and spatial fragmentation driven by anthropogenic pressures.
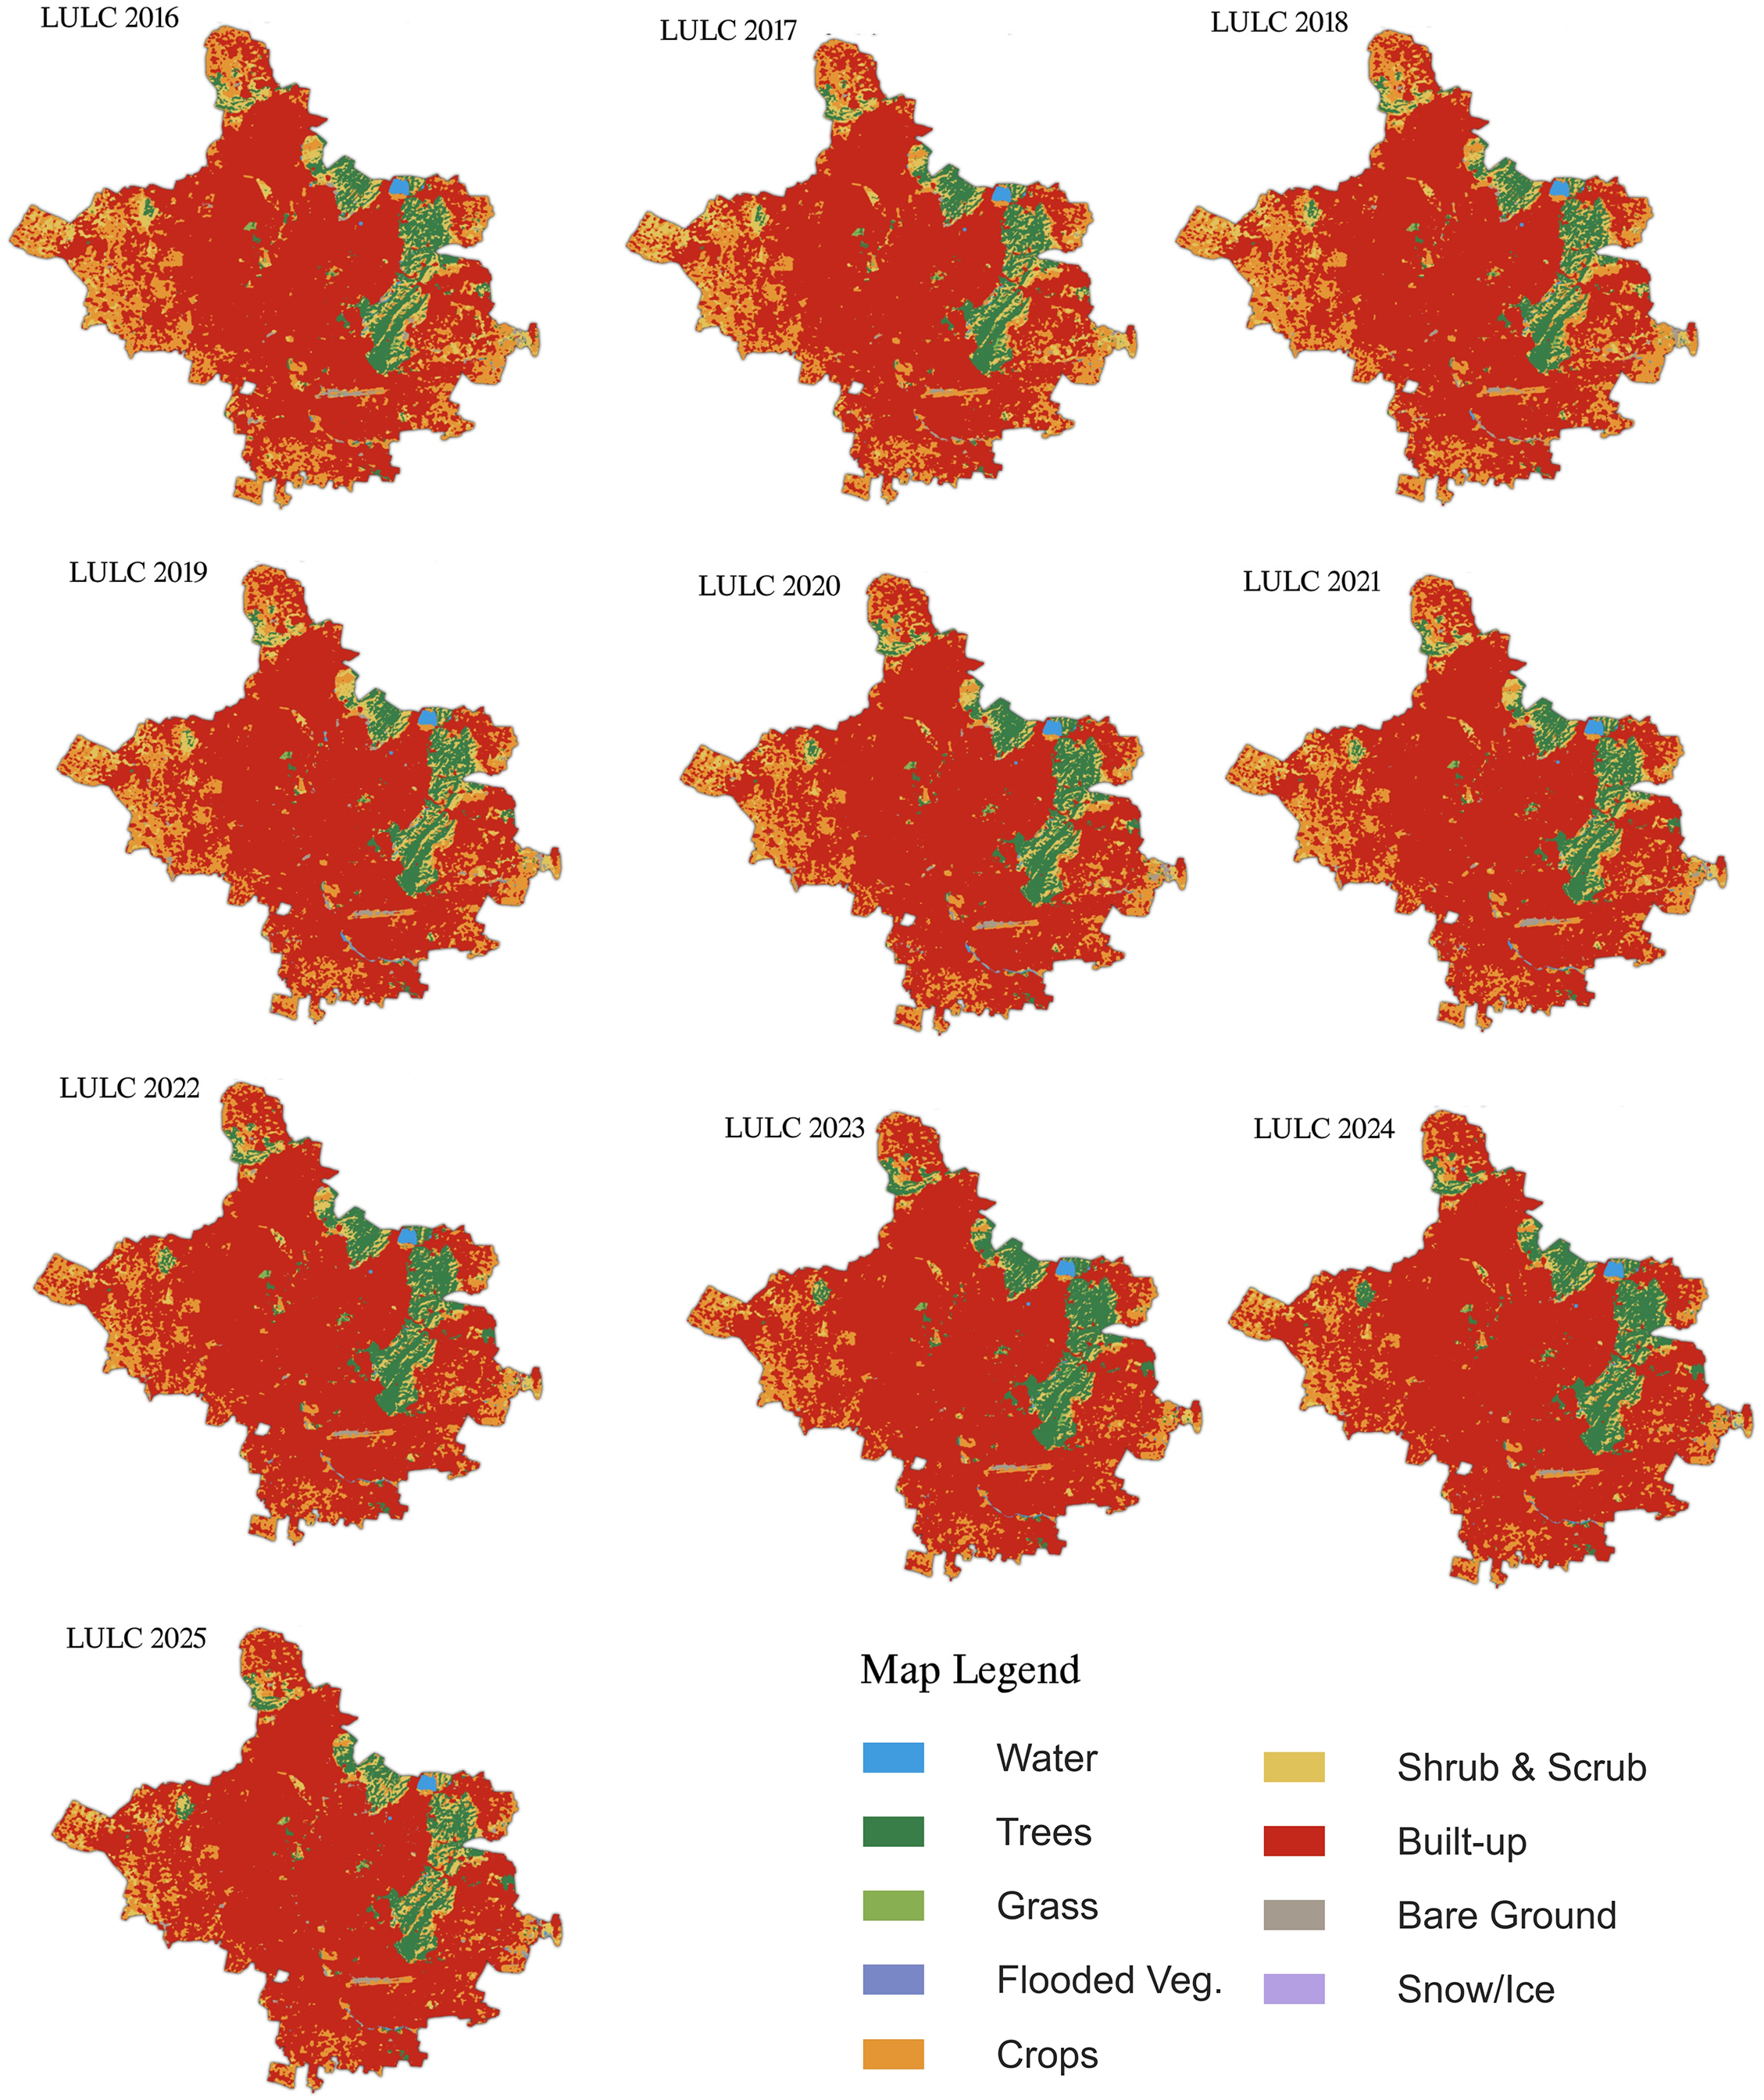
Figure 5: Annual land use/land cover (LULC) classification maps of Jaipur from 2016 to 2025, derived from dynamic world datasets. The maps illustrate the spatial distribution and temporal evolution of key LULC classes—including water, trees, grass, crops, shrub & scrub, built-up area, and bare ground—across the study area
A close examination of these maps indicates a systematic encroachment of built-up areas into zones historically dominated by cropland and natural vegetation. The expansion of urban footprints, particularly in the northern and eastern peripheries of Jaipur, is evident, reflecting both planned infrastructure development and spontaneous peri-urban growth. This urban expansion is paralleled by the shrinking spatial extent of cropland, shrub & scrub, and to a lesser degree, tree-covered regions. Notably, the loss of cropland and shrubland is most pronounced along the city’s developing corridors, suggesting the direct influence of urbanization on local land use transitions.
These spatial observations are substantiated by the quantitative trends depicted in the comparative horizontal bar graph (Fig. 6), which summarizes the area (in km2) of each LULC class for every year in the study period. Fig. 6 highlights the dominant trajectories: cropland area declined from 88.02 km2 in 2016 to 52.08 km2 in 2025, corresponding to an absolute loss of 35.93 km2 or −40.83%. Similarly, shrub & scrub cover decreased by 9.31 km2 (from 33.61 to 24.30 km2, a −27.71% reduction), and tree cover diminished from 35.99 to 34.51 km2, representing a −1.48 km2 or −4.12% decrease.
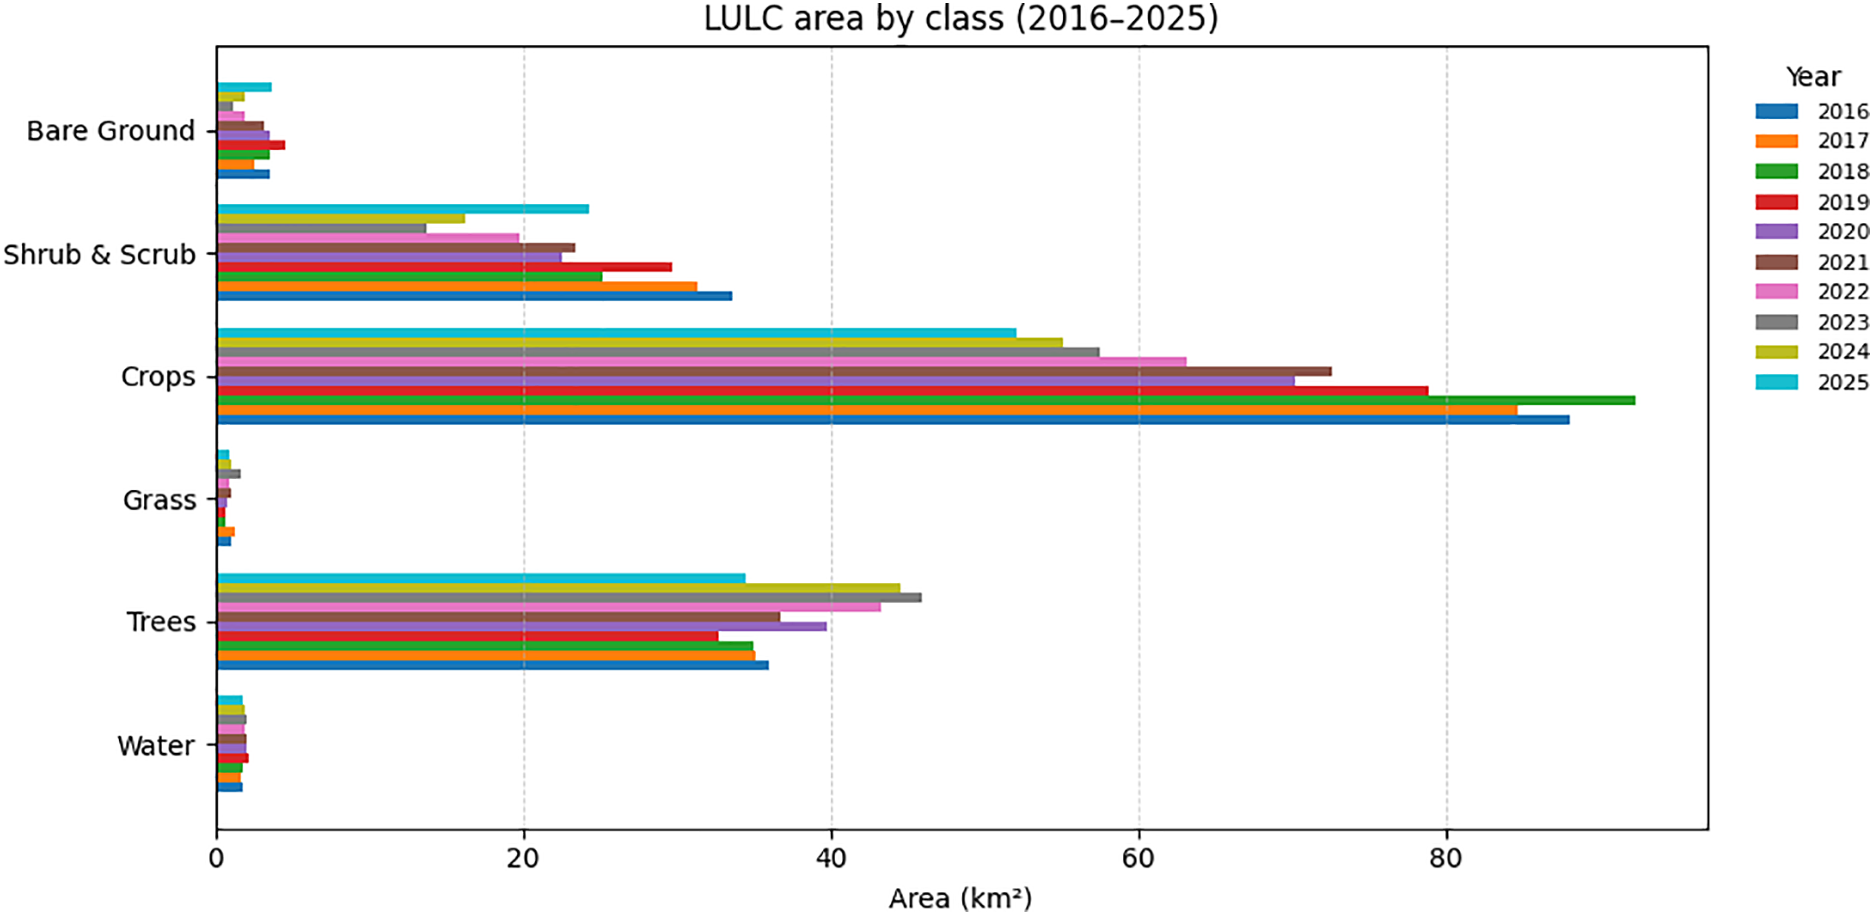
Figure 6: Annual changes in area (km2) for major land use/land cover (LULC) classes in Jaipur between 2016 and 2025
Conversely, the built-up class underwent the most dramatic transformation, increasing from 340.57 km2 in 2016 to 387.25 km2 in 2025—a net gain of 46.68 km2 or +13.71% over the decade. This surge in built-up areas underscores the intensity of urbanization processes at work in Jaipur, with direct implications for ecosystem services, agricultural productivity, and peri-urban land management. The steady and substantial growth in urban footprint, as visualized in both maps and graphs, highlights Jaipur’s status as a rapidly expanding heritage city.
Other LULC classes exhibited comparatively smaller changes: water bodies remained essentially stable (1.81 km2 in both 2016 and 2025, +0.18%), grasslands contracted slightly from 0.97 km2 to 0.93 km2 (−4.22%), and bare ground expanded marginally from 3.53 to 3.64 km2 (+3.14%). These relatively modest trends stand in contrast to the dynamic losses in cropland and shrubland.
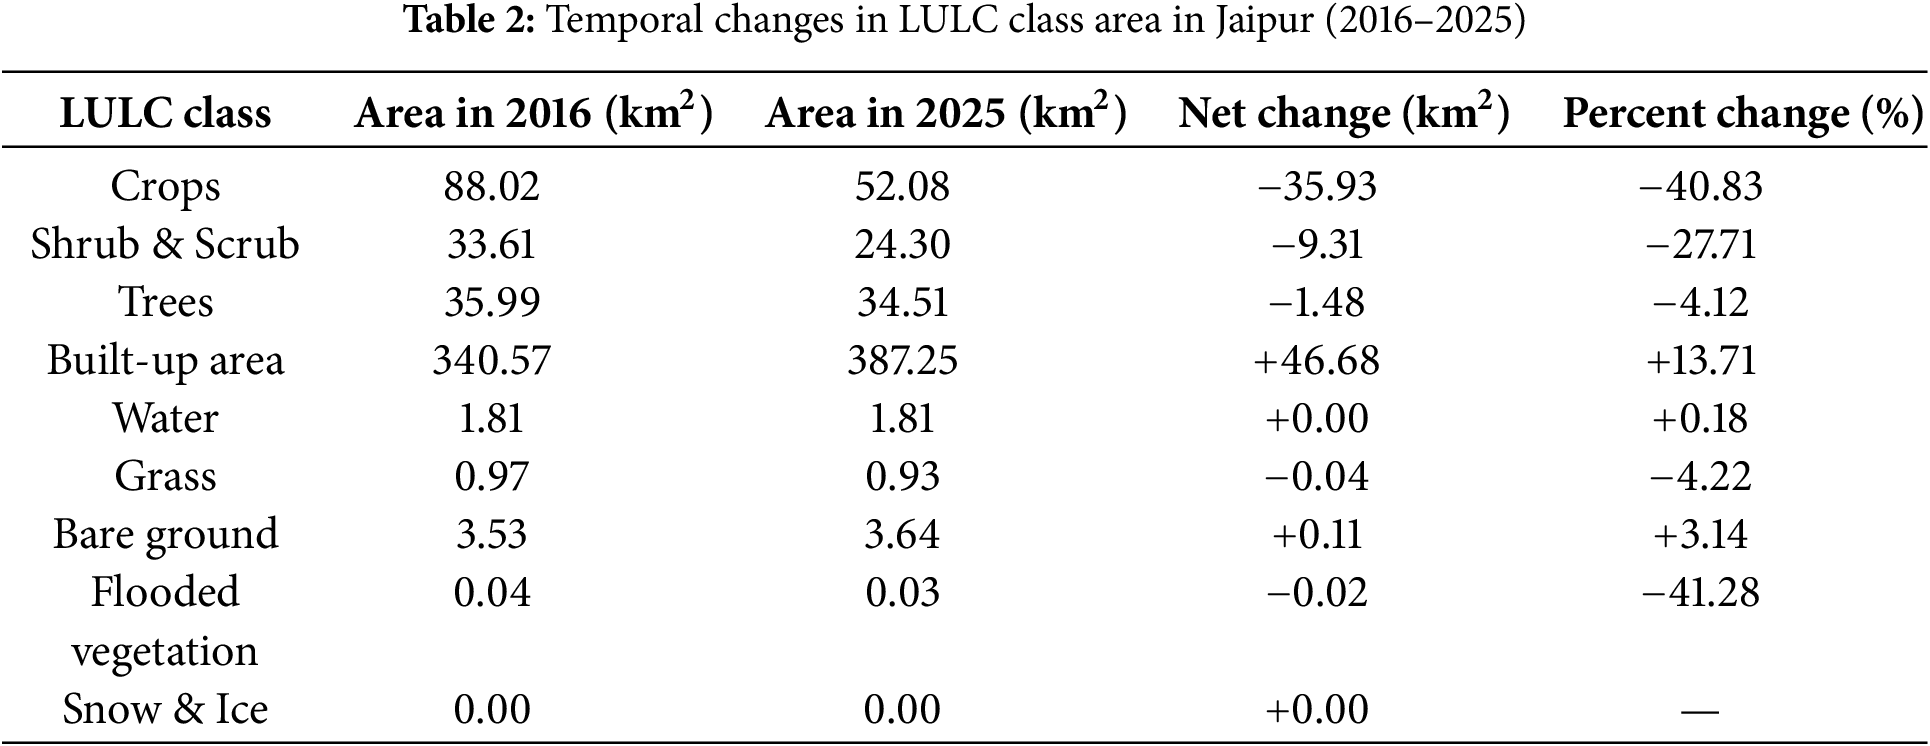
The detailed statistics presented in Table 2 further emphasize these patterns. The table consolidates both the absolute and percentage changes in area for each LULC class, underscoring the dominance of urban expansion and the significant reduction in productive and ecologically important land types. Together, these findings reflect an ongoing process of urban transformation that is reshaping Jaipur’s landscape. They also signal the urgent necessity for integrated urban planning and sustainable land management strategies aimed at mitigating the adverse impacts of unchecked urban growth on agricultural lands, biodiversity, and overall ecosystem integrity.
3.2 Temporal Trajectory of Urban Expansion in Jaipur (2016–2025)
The temporal dynamics of urban growth in Jaipur are clearly depicted in the annual trend of built-up area from 2016 to 2025 (Fig. 7). The analysis demonstrates a persistent and substantial increase in urbanized land, reflecting the city’s rapid demographic and infrastructural development over the past decade.
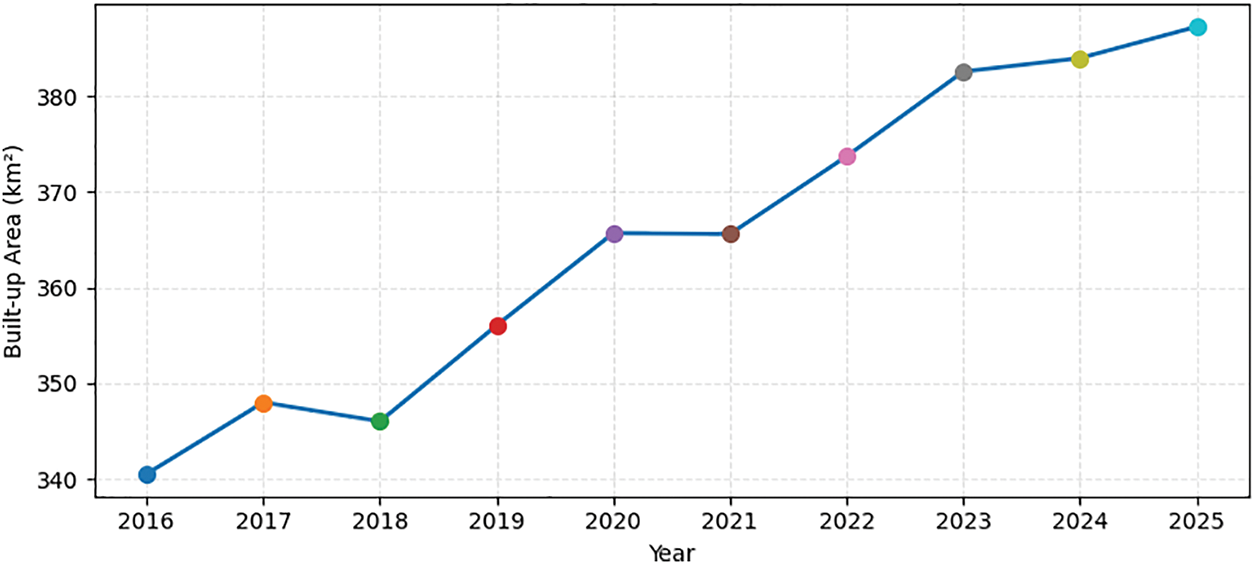
Figure 7: Temporal trend in built-up area (km2) in Jaipur from 2016 to 2025, showing steady annual increases and highlighting periods of accelerated urban expansion
In 2016, the built-up area was approximately 340.57 km2. This value exhibited a steady upward trajectory, reaching 387.25 km2 by 2025. Notably, the most pronounced surges in built-up area occurred after 2019, which aligns with intensified urban development projects and the city’s ongoing expansion to accommodate population growth. Periods of relatively moderate increase, such as between 2017 and 2018, may reflect short-term fluctuations in land conversion or the completion of major construction cycles.
Overall, the data indicate a net increase of about 46.68 km2 in built-up area over the study period—an approximate +13.71% growth. This continuous expansion of impervious surfaces has direct implications for the region’s land resource allocation, peri-urban agricultural land loss, urban heat island effects, and environmental sustainability. The upward trend underscores the urgent need for proactive urban planning, effective land management policies, and targeted interventions to balance growth with the preservation of green spaces and agricultural zones.
3.3 Forecasted Land Use/Land Cover (LULC) Transitions in Jaipur (2026–2030)
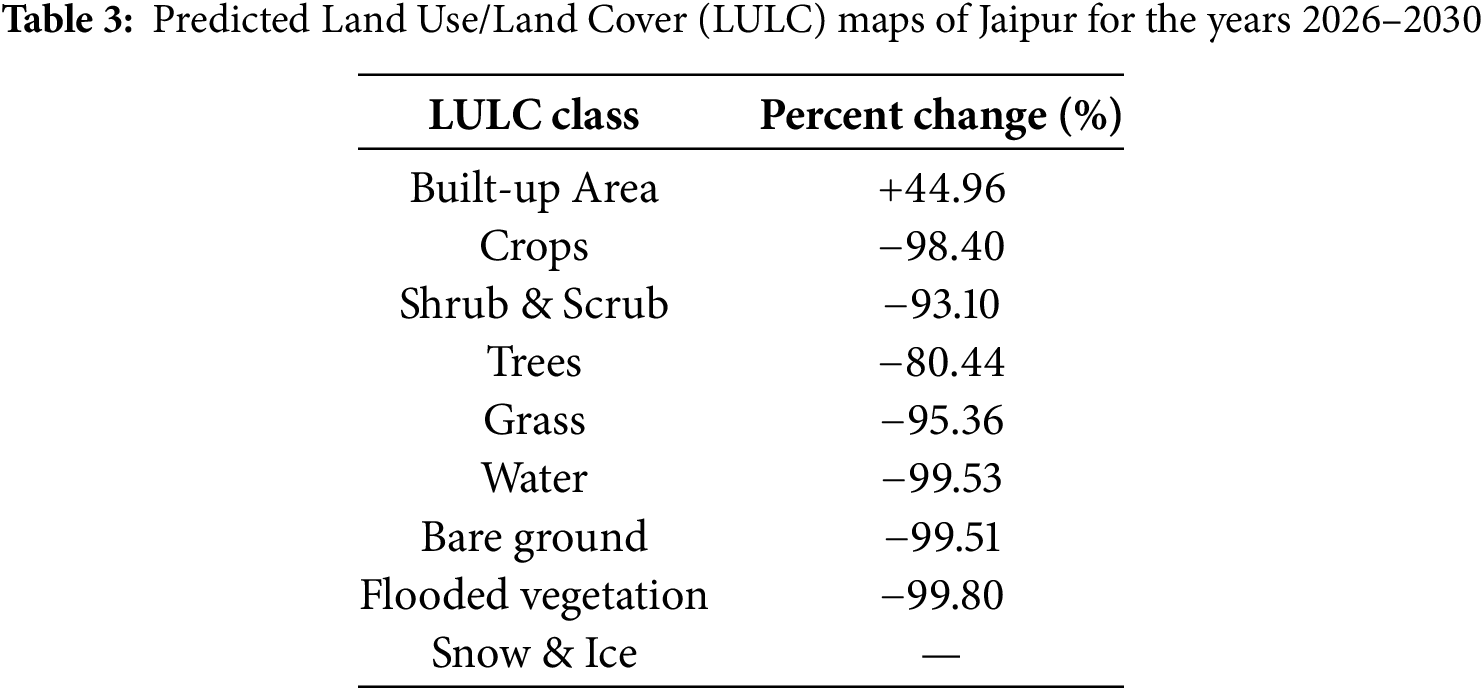
The predictive modeling of LULC dynamics for Jaipur through 2030 reveals striking and consequential transformations in the region’s landscape (Fig. 8). Spatial projections of LULC distribution for the years 2026 to 2030 demonstrate a continued expansion of urban and built-up areas, paralleled by substantial declines in agricultural and natural land classes. These changes, visualized in the annual forecast maps, reflect the likely trajectory of land use transitions under ongoing urbanization pressures.
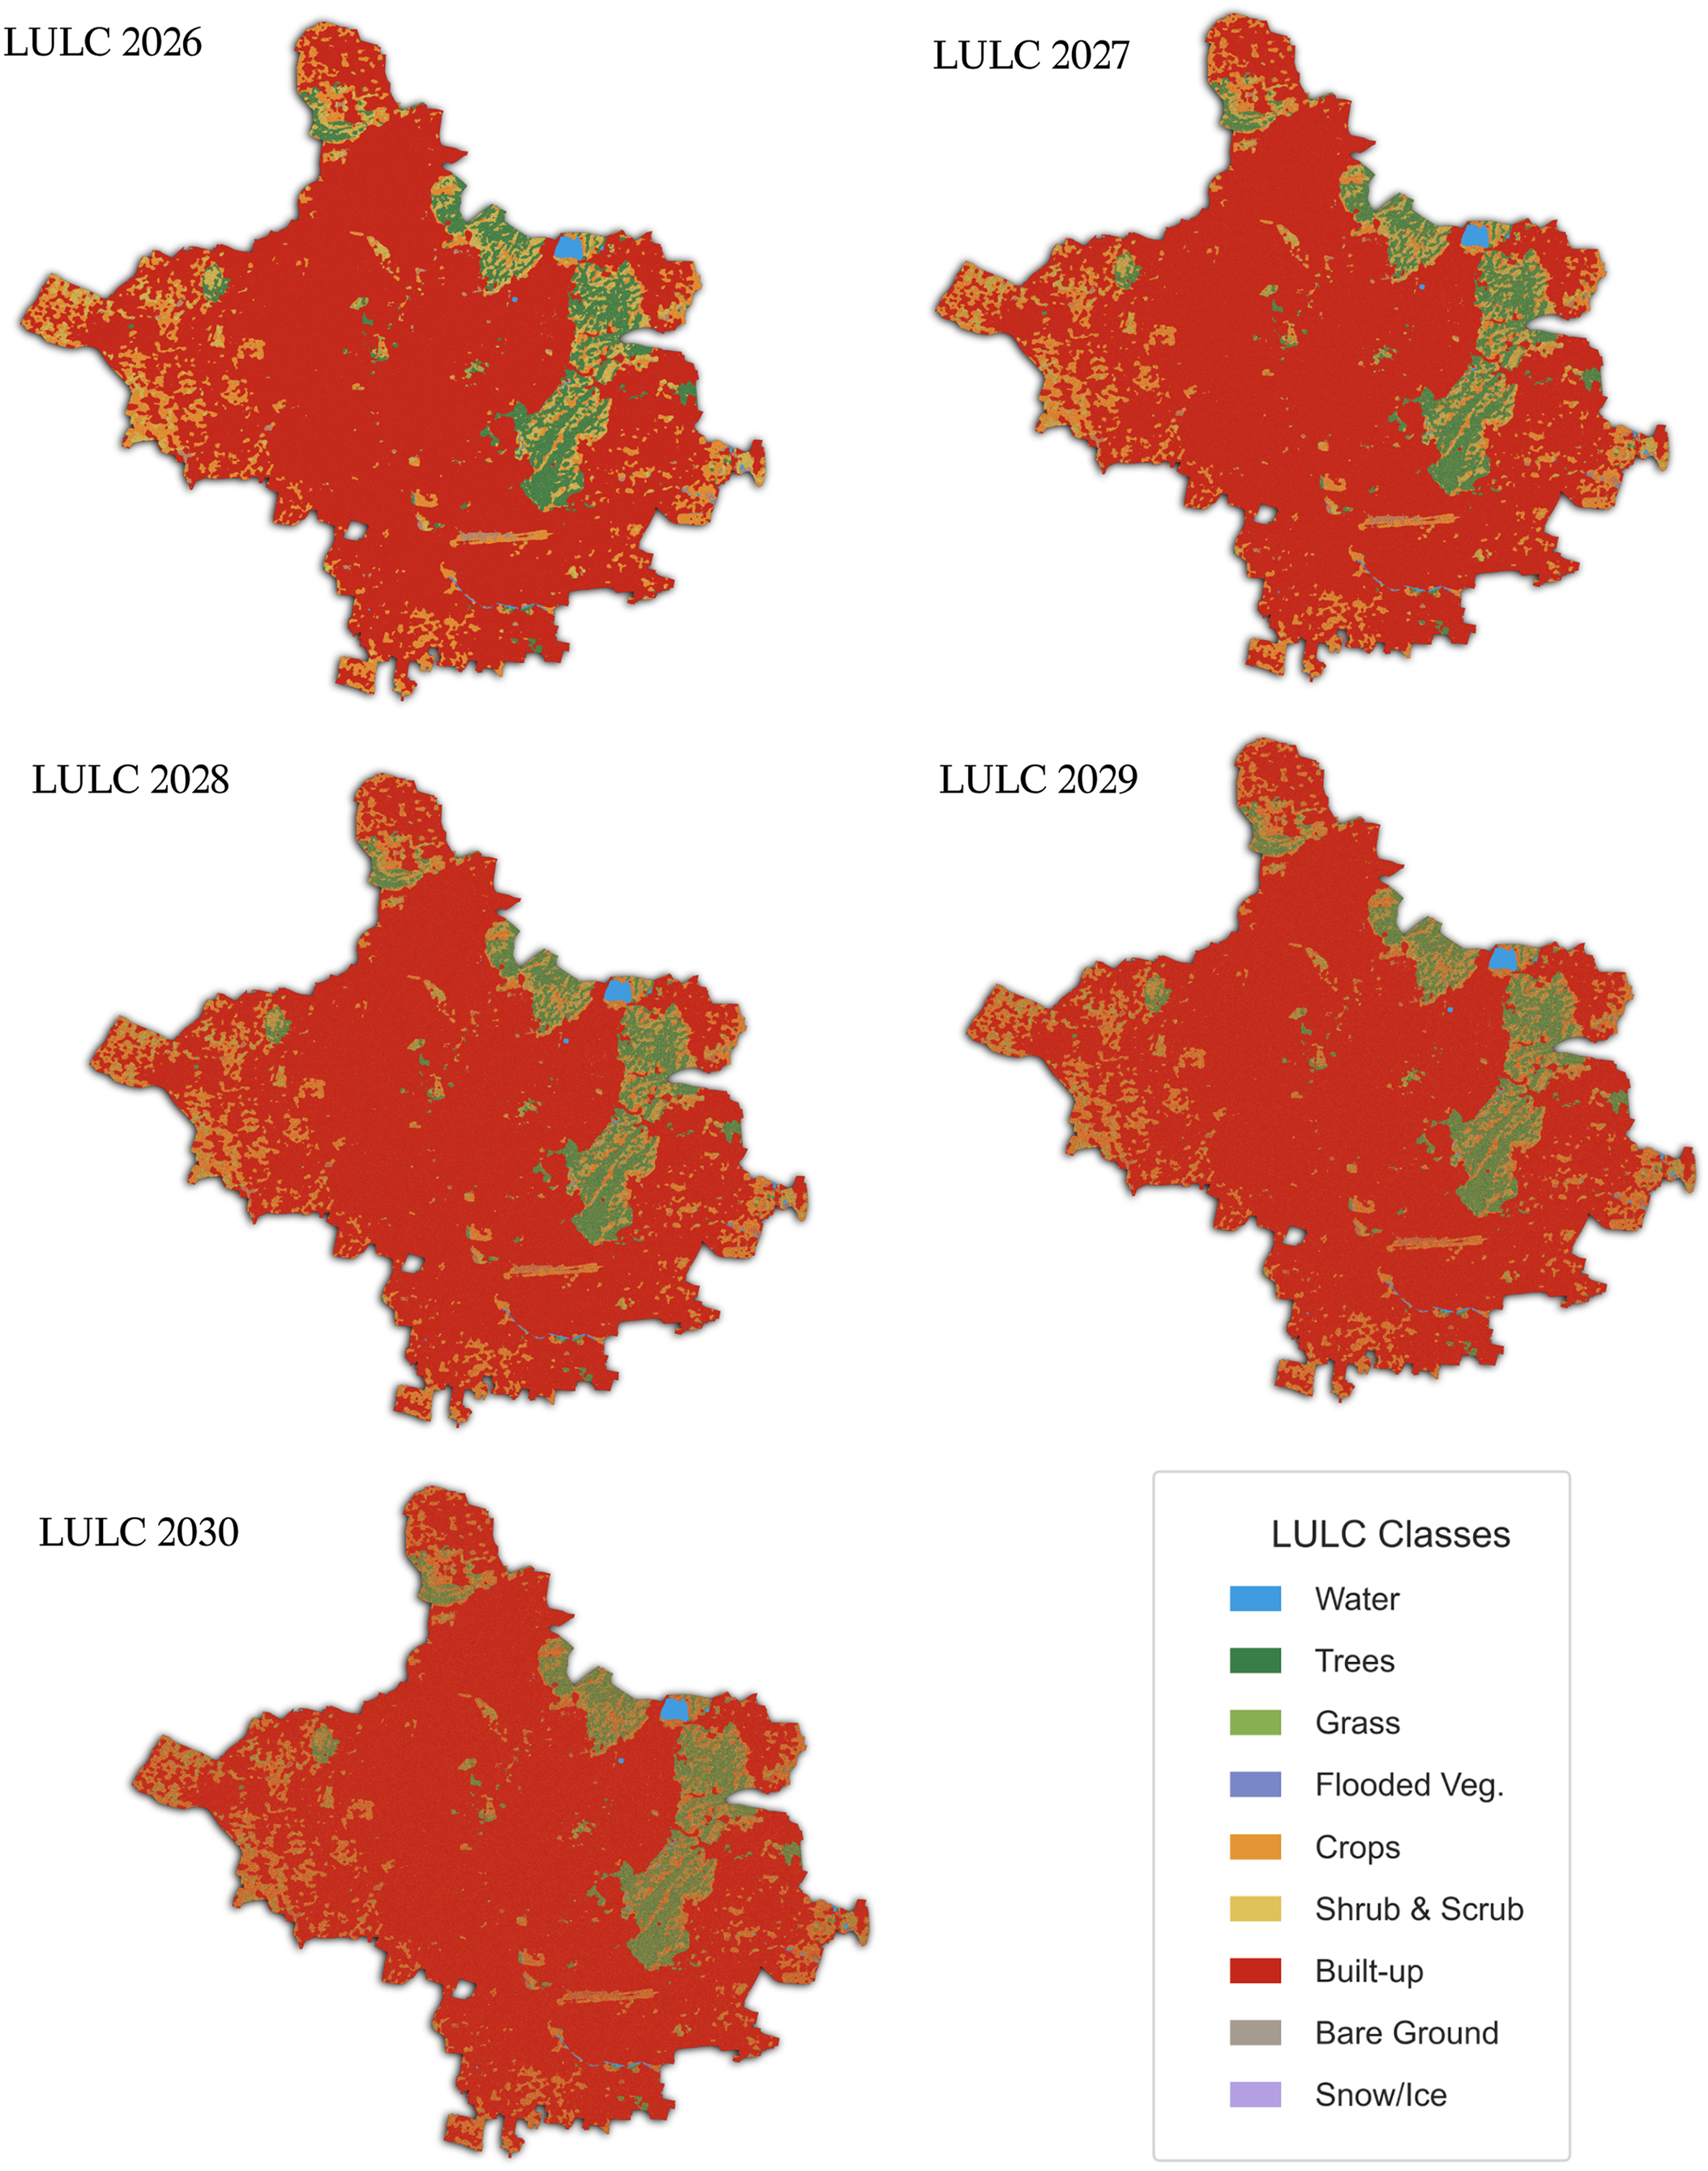
Figure 8: Predicted annual land use/land cover (LULC) maps for Jaipur city from 2026 to 2030, generated using a markov chain transition model calibrated with dynamic world time series (2016–2025)
Quantitative assessment of the forecasted period (Table 3) indicates that the built-up area is projected to increase by +44.96% between 2016 and 2030. This expansion is most prominent along the city’s periphery, where cropland, shrub & scrub, and grasslands are progressively converted to urban uses. The cropland and shrub & scrub classes are anticipated to experience the most severe losses, with predicted declines of −98.40% and −93.10%, respectively. Tree cover is also expected to contract sharply (−80.44%), while grasslands (−95.36%), bare ground (−99.51%), and flooded vegetation (−99.80%) show near-total disappearance. In contrast, water bodies are forecasted to undergo a steep reduction of −99.53%, leaving only negligible remnants.
These projected transitions underscore the accelerating and unsustainable pace of urbanization in Jaipur, which, if unmitigated, will continue to drive the collapse of ecologically significant and agriculturally productive lands. The findings highlight the urgent need for integrated urban planning and the implementation of land management strategies to ensure sustainable growth while preserving critical natural resources, agricultural capacity, and ecosystem services.
The quantitative and spatial analyses presented in this study clearly illustrate a decade of pronounced landscape transformation within Jaipur’s municipal boundaries. The steady expansion of built-up areas, as evidenced by a +13.71% increase between 2016 and 2025 and a forecasted +44.96% rise by 2030, points to a rapid and ongoing urbanization process. This growth is closely linked to a drastic reduction in agricultural and semi-natural land categories, with croplands declining by −40.83% during 2016–2025 and projected to contract by −98.40% by 2030, and shrub & scrub decreasing by −27.71% during 2016–2025 and forecasted to fall by −93.10% by 2030. The spatial pattern of these transitions—particularly along the city’s northern and eastern peripheries—reflects typical peri-urban dynamics, where anthropogenic pressure leads to the systematic conversion of productive land to urban uses.
The shrinkage of cropland and natural vegetation is particularly significant for Jaipur, given the city’s semi-arid climate and its dependence on peri-urban agriculture for local food supply and ecological resilience. The reduction in shrubland and tree cover (projected to decline by −80.44% by 2030) not only signals the loss of biodiversity and habitat connectivity but also suggests a diminished capacity for ecosystem services such as groundwater recharge and temperature regulation. The expansion of impervious surfaces, coupled with the contraction of vegetated land, intensifies surface runoff and may contribute to more severe urban heat island effects and localized flooding events—issues that are increasingly documented in rapidly urbanizing environments globally.
While built-up area showed the most dramatic change, the near-total projected disappearance of water bodies (−99.53%), grasslands (−95.36%), bare ground (−99.51%), and flooded vegetation (−99.80%) suggests that few land classes remain resilient to encroachment. The continued contraction of croplands and open green spaces raises concerns about the long-term sustainability of the urban landscape and its capacity to support both human and ecological needs.
The predictive LULC maps for 2026–2030 reinforce these findings, indicating an accelerated and unsustainable trajectory unless effective land management and urban planning interventions are implemented. The projected +44.96% increase in built-up area, paired with catastrophic losses across nearly all natural and agricultural categories, underscores the urgency of developing integrated land use policies that address not only housing and infrastructure demands but also the protection of critical agricultural and ecological assets.
In summary, the results highlight a critical inflection point for Jaipur’s landscape, where unchecked urban expansion could fundamentally alter the region’s environmental balance, food security, and heritage value. The empirical evidence provided by this study supports the need for data-driven, forward-looking strategies to manage urban growth and sustain vital ecosystem services in the face of rapid change.
The results of this study underscore a dramatic transformation in Jaipur’s landscape. Between 2016 and 2025, built-up area increased by +13.71% (340.57 → 387.25 km2), with projections showing a further +44.96% rise by 2030. The loss of agricultural and natural lands is even more alarming: croplands are projected to decline by—The l and shrub/scrub by—and sh by 2030, while tree cover, grasslands, water bodies, bare ground, and flooded vegetation face near-total losses (−80% to −99%). These figures signal a profound challenge to Jaipur’s ecological resilience, food security, and heritage context.
These projected trends align with findings in other urbanizing cities. For instance, Gupta et al. (2020) documented significant land surface warming in Jaipur between 2008 and 2018, driven by cropland conversion to urban land. Although the DOI isn’t publicly available via search, their work supports the connection between urban expansion and environmental stress. Similarly, Mostafa et al. (2023) employed a hybrid FAHP–CA–Markov LULC model in Gharbia, Egypt, revealing accelerated vegetation decline and heat stress due to urban growth [15].
Methodologically, our approach reflects recent advances in prediction modeling. Research by Li et al. (2024) and Zhu et al. (2024) demonstrated the benefits of incorporating spatial diffusion (e.g., neighbourhood effects) in hybrid models (CA–Markov + deep learning) for more realistic urban forecasts [16,17]. Zhang et al. (2025) showed that combining Google Earth Engine with ML and CA-based simulation improved LULC prediction accuracy in Pakistan—validating our use of Dynamic World data coupled with CA–Markov modelling [18].
Collectively, these studies affirm that peri-urban landscapes in fast-growing cities—particularly heritage cities like Jaipur—are undergoing rapid ecological and agricultural transformation. The consistent amplification of built-up areas and the steep decline in green spaces documented across geographies reinforce the urgency of our findings.
Policy and planning implications are therefore clear: immediate actions are needed. Protecting peri-urban croplands through zoning controls, establishing green buffers, and integrating remote sensing into urban governance can help safeguard heritage landscapes and ecosystem services.
Limitations and future directions: While Dynamic World offers high-frequency, global LULC coverage, its 10-m resolution may obscure small-scale developments and misclassify mosaic landscapes. Our model validation (OA = 0.79; κ = 0.15; FoM = 0.073) supports credible built-up capture but signals room for improvement. Integrating supervised classifiers (Random Forest, SVM) or deep-learning CA hybrids alongside socio-economic drivers (e.g., road networks, zoning) would refine future projections.
This study not only provides a reproducible, policy-ready modelling framework but also validates and extends evidence from other rapidly urbanizing contexts, presenting a critical call to action for preserving Jaipur’s ecological and cultural heritage amid mounting urban pressure.
This study provides a comprehensive assessment of land use and land cover (LULC) changes in Jaipur, India, between 2016 and 2025, and projects future dynamics through 2030 using annual, high-resolution Dynamic World data combined with a CA–Markov transition modeling framework. The results reveal a +13.71% increase in built-up areas during 2016–2025, with a projected +44.96% rise by 2030, accompanied by catastrophic declines in croplands (−98.40%), shrub & scrub (−93.10%), tree cover (−80.44%), grasslands (−95.36%), and water bodies (−99.53%). These transformations highlight the severity of urban encroachment into agricultural and ecologically significant zones, particularly along Jaipur’s periphery, and point to escalating risks for food security, biodiversity, and ecosystem services.
Our findings are consistent with earlier research showing urban growth–driven environmental stress in Jaipur (Gupta et al., 2020) and comparable patterns in other semi-arid and developing regions (Mostafa et al., 2023; Li et al., 2024; Zhang et al., 2025). By employing temporally dense, globally consistent LULC datasets and explicitly integrating neighbourhood effects in a CA–Markov allocation, this study advances beyond conventional pixel-based Markov models. Validation against a 2025 hold-out (OA = 0.79, κ = 0.15, FoM = 0.073) further demonstrates the robustness of the framework for forecasting urban diffusion processes.
Beyond methodological contributions, the results carry strong policy relevance. Jaipur, as a UNESCO World Heritage City in a semi-arid region, faces an inflection point where unregulated urban expansion could irreversibly compromise its environmental balance and cultural value. To mitigate these risks, we recommend (i) Strengthening zoning regulations to protect peri-urban cropland and heritage landscapes. Establishing ecological buffers and urban green belts to counter habitat loss and heat stress. (ii) Integrating remote-sensing–based monitoring systems into municipal planning for continuous tracking of LULC change. (iii) Exploring scenario-based planning to balance infrastructure growth with the preservation of ecosystem services and cultural assets.
The methodological framework demonstrated here—leveraging annual, globally uniform LULC data with a transparent, reproducible CA–Markov approach—provides a scalable tool for high-frequency monitoring and scenario analysis in rapidly urbanizing cities. More broadly, this study underscores the necessity of data-driven, forward-looking urban planning to safeguard ecological resilience, agricultural productivity, and cultural heritage in Jaipur and comparable heritage cities worldwide.
Acknowledgement: We would like to express our sincere gratitude to the Dynamic World dataset for providing valuable Land Use and Land Cover (LULC) data. We are also deeply thankful to the Geospatial Research Laboratory at Hokkaido University for offering an excellent research environment.
Funding Statement: The authors received no specific funding for this study.
Author Contributions: The authors confirm contribution to the paper as follows: Conceptualization, Methodology, Software, Validation, Formal analysis, Investigation, Data Curation, Writing—Original Draft, Writing—Review & Editing, Visualization: Saurabh Singh; Conceptualization, Methodology, Writing—Original Draft, Writing—Review & Editing, Visualization: Sudip Pandey; Methodology, Writing—Original Draft: Ankush Kumar Jain. All authors reviewed the results and approved the final version of the manuscript.
Availability of Data and Materials: All data and code used in this research will be provided upon reasonable request.
Ethics Approval: Not applicable.
Conflicts of Interest: The authors declare no conflicts of interest to report regarding the present study.
References
1. Eduardo R, Gustavo A, De Stefano C, Susan M, Jean Louis C. Urban heritage for sustainable development. In: Culture: urban future. Paris, France: UNESCO; 2016. p. 193–9. [Google Scholar]
2. Santra A, Debnath J, Ghosh M. Urban growth dynamics and land surface temperature analysis of Vijayawada city, India: a geospatial perspective. Urban Transit. 2025;2:100008. doi:10.1016/j.ubtr.2025.100008. [Google Scholar] [CrossRef]
3. Nagendra H, Sudhira HS, Katti M, Schewenius M. Sub-regional assessment of India: effects of urbanization on land use, biodiversity and ecosystem services. In: Elmqvist T, Fragkias M, Goodness J, Güneralp B, Marcotullio PJ, McDonald RI et al., editors. Urbanization, biodiversity and ecosystem services: challenges and opportunities. Dordrecht, The Netherlands: Springer; 2013. p. 65–74. doi:10.1007/978-94-007-7088-1_6. [Google Scholar] [CrossRef]
4. Das S, Choudhury MR, Chatterjee B, Das P, Bagri S, Paul D, et al. Unraveling the urban climate crisis: exploring the nexus of urbanization, climate change, and their impacts on the environment and human well-being—a global perspective. AIMS Public Health. 2024;11(3):963–1001. doi:10.3934/publichealth.2024050. [Google Scholar] [PubMed] [CrossRef]
5. Al-Houdalieh SH, Sauders RR. Building destruction: the consequences of rising urbanization on cultural heritage in the ramallah province. Int J Cult Prop. 2009;16(1):1–23. doi:10.1017/s0940739109090043. [Google Scholar] [CrossRef]
6. Son TH, Weedon Z, Yigitcanlar T, Sanchez T, Corchado JM, Mehmood R. Algorithmic urban planning for smart and sustainable development: systematic review of the literature. Sustain Cities Soc. 2023;94:104562. doi:10.1016/j.scs.2023.104562. [Google Scholar] [CrossRef]
7. Halder S, Bose S. Ecological quality assessment of five smart cities in India: a remote sensing index-based analysis. Int J Environ Sci Technol. 2024;21(4):4101–18. doi:10.1007/s13762-023-05270-4. [Google Scholar] [CrossRef]
8. Jawaid MF, Sharma M, Pipralia S, Kumar A. City profile: Jaipur. Cities. 2017;68(3):63–81. doi:10.1016/j.cities.2017.05.006. [Google Scholar] [CrossRef]
9. Sustainability Directory. Urban Expansion Impacts [Internet]. 2025 [cited 2025 Jul 24]. Available from: https://pollution.sustainability-directory.com/term/urban-expansion-impacts/. [Google Scholar]
10. Sukanya R, Tantia V. Urbanization and the impact on economic development. In: New perspectives and possibilities in strategic management in the 21st century: between tradition and modernit. Hershey, PA, USA: IGI Global; 2023. p. 369–408. [Google Scholar]
11. United Nations Convention to Combat Desertification. The Contribution of Integrated Land Use Planning and Integrated Landscape Management to Implementing Land Degradation Neutrality [Internet]. Bonn, Germany: UNCCD. [cited 2025 Jul 24]. Available from: https://www.unccd.int/sites/default/files/2023-09/UNCCD%20Integrated%20Land%20Use%20Planning-rev.pdf. [Google Scholar]
12. Verburg PH, Neumann K, Nol L. Challenges in using land use and land cover data for global change studies. Glob Change Biol. 2011;17(2):974–89. doi:10.1111/j.1365-2486.2010.02307.x. [Google Scholar] [CrossRef]
13. Gui B, Bhardwaj A, Sam L. A novel multi-scale deep learning framework for adaptive urban expansion simulation. Sustain Cities Soc. 2025;130:106594. doi:10.1016/j.scs.2025.106594. [Google Scholar] [CrossRef]
14. Duan X, Haseeb M, Tahir Z, Mahmood SA, Tariq A. Analyzing and predicting land use and land cover dynamics using multispectral high-resolution imagery and hybrid CA-Markov modeling. Land Use Policy. 2025;157:107655. doi:10.1016/j.landusepol.2025.107655. [Google Scholar] [CrossRef]
15. Mostafa E, Li X, Sadek M. Urbanization trends analysis using hybrid modeling of fuzzy analytical hierarchical process-cellular automata-Markov chain and investigating its impact on land surface temperature over gharbia city. Egypt Remote Sens. 2023;15(3):843. doi:10.3390/rs15030843. [Google Scholar] [CrossRef]
16. Li H, Liu Z, Lin X, Qin M, Ye S, Gao P, et al. A novel spatiotemporal urban land change simulation model: coupling transformer encoder, convolutional neural network, and cellular automata. J Geogr Sci. 2024;34(11):2263–87. doi:10.1007/s11442-024-2292-1. [Google Scholar] [CrossRef]
17. Zhu Y, Geiß C, So E, Bardhan R, Taubenböck H, Jin Y. Urban expansion simulation with an explainable ensemble deep learning framework. Heliyon. 2024;10(7):e28318. doi:10.1016/j.heliyon.2024.e28318. [Google Scholar] [PubMed] [CrossRef]
18. Zhang A, Tariq A, Quddoos A, Naz I, Aslam RW, Barboza E, et al. Spatio-temporal analysis of urban expansion and land use dynamics using google earth engine and predictive models. Sci Rep. 2025;15(1):6993. doi:10.1038/s41598-025-92034-4. [Google Scholar] [PubMed] [CrossRef]
Cite This Article
 Copyright © 2025 The Author(s). Published by Tech Science Press.
This work is licensed under a Creative Commons Attribution 4.0 International License , which permits unrestricted use, distribution, and reproduction in any medium, provided the original work is properly cited.
 Downloads
 Citation Tools