
 Submit a Paper
 Propose a Special lssue
 Open Access
ARTICLE

Spatial Analysis Tool for Urban Environmental Quality Assessment: Leveraging Geoinformatics and GIS
Department of Cartography and Geoinformatics, Siberian State University of Geosystems and Technologies, Novosibirsk, 630108, Russia
* Corresponding Author: Igor Musikhin. Email:
(This article belongs to the Special Issue: Resource and Environmental Information Modeling)
Revue Internationale de Géomatique 2025, 34, 939-957. https://doi.org/10.32604/rig.2025.071168
Received 01 August 2025; Accepted 30 October 2025; Issue published 09 December 2025
 View Full Text
 Download PDF
Abstract
Urban environmental quality research is crucial, as cities become competitive centers concentrating human talent, industrial activity, and financial resources, contributing significantly to national economies. Municipal and government priorities include retaining residents, preventing skilled worker outflow, and meeting the evolving needs of urban populations. The study presents the development and application of a scenario-based spatial analysis tool for assessing urban environmental quality at a detailed spatial scale within the city of Novosibirsk. Using advanced geoinformatics, GIS techniques, and an expert knowledge base, the tool integrates diverse thematic data layers with user-defined scenarios to compute and visualize the Scenario-based Urban Environment Quality Index across 87,905 standardized unit areas. The methodology incorporates comprehensive criteria aligned with existing urban planning frameworks and includes demographic targeting to address the city’s heterogeneous population. Validation against expert evaluations demonstrates high accuracy and consistency, while dynamic modeling capabilities facilitate monitoring the effects of planned urban development initiatives. This approach bridges a critical gap in urban planning by providing granular, data-driven insights that reflect residents’ real needs and spatial inequalities. The tool greatly benefits municipal authorities by enabling evidence-based prioritization of interventions, fostering inclusive and sustainable urban growth, and enhancing transparency and participatory governance. Its implementation as a no-code/low-code QGIS plugin ensures wide accessibility and practical application in strategic urban development, marking a significant advancement in urban environment quality assessment science and practice.Keywords
Cities play a crucial role in driving strategic sustainable development. As a result, they have assumed a central role in translating this concept into practice and advancing its related discourse [1]. The relevance of research on urban environmental quality and the selection of appropriate evaluation indicators is underscored by the evolving nature of cities as competitive territorial hubs. These urban centers attract skilled workers, concentrate the majority of human, intellectual, industrial, and financial resources, and host advanced economic sectors, becoming hubs of innovation generating a predominant share of the national gross domestic product and producing the largest volumes of added value [2,3]. Consequently, municipal and state governance increasingly prioritizes retaining the local population, curbing the outflow of skilled workers, and addressing the expectations, interests, and needs of both current and future generations of urban residents with respect to the quality of their living environment.
Urban indicators play a crucial role in shaping local public policies by providing measurable and actionable data that guide decision-making at the municipal level [4]. They serve as essential instruments for diagnosing existing urban conditions, setting development priorities, and assessing the effectiveness of implemented policies and interventions. By capturing diverse dimensions of the urban environment such as housing quality, infrastructure provision, environmental conditions, and social well-being these indicators help policymakers address complex and interrelated challenges, including inequality, environmental sustainability, public health, and economic development [1,5,6].
Urban environmental quality indicators, in particular, provide a foundation for policy frameworks aimed at enhancing residents’ quality of life and ensuring equitable access to essential services. For example, data on green space distribution and air pollution levels inform strategies for urban greening, pollution control, and climate resilience. Likewise, indicators related to transportation systems, education, and healthcare support strategic investments in infrastructure and social programs that directly respond to community needs [7].
The integration of real-time geospatial data through advanced geoinformatics and GIS techniques further strengthens the role of urban indicators [8]. By enabling precise monitoring of urban dynamics and neighborhood-level variations, these tools allow authorities to design targeted policies, allocate resources more efficiently, and promote inclusive and sustainable urban development.
A substantial body of literature emphasizes the significance of urban environmental quality (UEQ) and its continuous development, highlighting the necessity for ongoing research and methodological advancements [5,9–13]. These studies indicate that conventional city management practices, which predominantly rely on static statistical data, are increasingly being supplanted by innovative geoinformation technologies [14–16]. Such technologies enable real-time data collection, processing, and scenario-based spatial analysis of large datasets. This progression significantly enhances the accuracy and timeliness of decision-making processes and fosters the development of data-driven urban governance frameworks [1,7,10,17].
Related publications on this topic highlight a variety of approaches for selecting indicators used in calculating urban environment quality indices (UEQI), encompassing a broad spectrum of factors across multiple domains. These include environmental conditions, meteorological variables, and socioeconomic status [18], as well as specific indicators such as air pollution levels, access to clean water, green space coverage, social inclusion, and atmospheric CO2 emissions [12]. Additionally, considerations extend to the availability of education and healthcare services, the presence of well-developed transportation networks, and access to recreational facilities [19]. Other significant aspects incorporate the density of built-up areas, spatial disparities, noise pollution levels, age and condition of the housing stock, unemployment rates, and the prevalence of socially marginalized populations [16,20]. Further indicators sometimes included concentrations of industrial enterprises, availability of energy resources, internet connectivity, traffic congestion, residential space per capita, and the average age of city residents.
Numerous case studies have been conducted to illustrate the development and evaluation processes of UEQIs, integrating data from diverse sources to provide a comprehensive assessment of urban environmental quality [18,20–22].
In line with technological trends, in 2016 the Presidential Council for Strategic Development endorsed a project plan for creating comfortable urban environments in Russia. Subsequently, the Federal Ministry of Construction developed a methodology for determining the urban environment quality index nationwide, detailing its calculation procedure. Nevertheless, despite the adoption of this official methodology, ongoing debates among experts and authorities consistently highlighted its deficiencies in evaluation tools. These discussions emphasized the need to incorporate supplementary metrics such as accessibility indicators, safety, eco-friendliness, comfort, aesthetic attractiveness, humanity, and anthropocentrism [14,23].
In its revised version, which incorporated accumulated comments and suggestions, the focus shifted towards examining the characteristics of urban space organization. Here, the UEQI measures livability and accessibility, serving as a key metric for both identifying urban development priorities and guiding informed decision-making processes. According to its developers, the enhanced methodology is intended to be an efficient tool for regional and municipal authorities to pinpoint “pain points” in the urban environment and plan targeted actions to address them.
However, it is essential to emphasize two critical aspects of the revised methodology. Firstly, given the spatial, social, climatic, and infrastructural heterogeneity of cities, applying a single unified methodology appears questionable. Consequently, some researchers are making efforts towards spatial pattern analysis and the targeted selection of urban environment quality indicators tailored to each specific area [8,24]. Secondly, the developed methodology is primarily a requirement for municipal and government authorities when formulating short-and mid-term strategies for urban growth that address large-scale challenges within priority national projects. Yet, it does not fully reflect the immediate needs of city residents. This limitation arises because the UEQI captures an average value that masks extreme differences, allowing widespread comparative analysis of cities across six major indicator categories (housing and adjacent spaces, road networks, green areas, business infrastructure and surroundings, social-recreational facilities and nearby spaces, and overall city space). Crucially, it fails to provide any indication of which neighborhoods fulfill the needs, match the expectations, and cater to the interests of individual city-dwellers.
Given significant spatial inequalities, improving the management of large cities necessitates developing a science-based method for calculation scenario-driven urban environment quality indices and creating a corresponding spatial analysis tool for assessing the quality and accessibility of urban environments at the level of smaller urban units like districts and microdistricts [25–27].
While simple GIS-based spatial analysis models that rely on point distributions and proximity measures are effective for mapping urban infrastructure, their utility is constrained by an exclusive focus on location and distance. To more accurately identify areas with differing levels of functionality, more sophisticated approaches are required. Integrated spatial analysis models provide this capacity by incorporating multiple factors drawn from diverse spatial datasets with heterogeneous structures and geometries, thus extending beyond the capabilities of standard geoinformation software.
In this research, we developed a flexible spatial analysis tool that leverages advanced geoinformatics and GIS techniques to support urban planning. By combining data-driven insights with residents’ expressed preferences, the tool enables a nuanced evaluation of urban environments. Specifically, it identifies areas within the city where amenities cluster according to personalized criteria that reflect individual priorities for a high-quality urban environment and overall quality of life [23].
This study aims to demonstrate the potential of geoinformatics and GIS in developing a flexible spatial analysis tool that evaluates urban environmental quality, supports informed decision-making in large-scale projects, identifies optimal residential or commercial locations based on customizable criteria, and monitors changes in the urban environment quality index following Master Plan implementation.
The methodology for developing the scenario-based spatial analysis tool integrates both domestic and international practices, aligns with existing urban planning regulations, and incorporates effective approaches for assessing urban environment quality [5,8,11,12,14,15,18,28]. The study represents an attempt to fulfil the gap in the scenario-based UEQI assessment in the city of Novosibirsk—the largest Russian municipality spanning over 500.3 km2 with a population of 1,633,900 inhabitants.
During the study, we used a digital topographic map at a scale of 1:100,000 and the city’s Master Plan 2030 both transformed into the WGS-84 coordinate system. These datasets, along with the Kontur Population: Global Population Density for 400 m H3 Hexagons (provided by OCHA Services), were employed to generate thematic layers within the Spatial Database (SDB) using the GIS “Panorama”.
The GIS “Panorama” was opted due to extensive hands-on experience of using it, demonstration of robust performance under heavy computational loads, and support of multi-user mode. Moreover, the specific storage format of the digital topographic map sourced from the Federal Spatial Data Fund aligned perfectly with this GIS, which decreased the risk of losing semantic details or introducing errors in geographic coordinates.
Updating the thematic layers of the SDB derived from the digital topographic map was carried out using spatial analytics tools including 2GIS, OpenStreetMap, Yandex Maps, as well as the public cadastral map of the Novosibirsk region.
Since the built-in spatial data analysis capabilities of the GIS “Panorama” did not entirely satisfy the project’s needs a free and open-source geographic information system (QGIS) was employed to implement the proposed algorithms for data processing and urban environmental quality assessment.
2.2 Data Preparation and Analysis
Drawing on expert input regarding accessibility to urban amenities, the entire territory of Novosibirsk was partitioned into 87,905 unit areas by overlaying a precise rectangular grid of 100 × 100 m across the city.
To convert densities from a 400-m Kontur H3 hexagonal grid to a 100-m rectangular grid, the spatial overlaps between each hexagon and the finer grid cells were first identified. The density within each hexagon was then proportionally distributed to the overlapping 100-m cells based on the ratio of the intersecting area to the total hexagon area. The density value for each rectangular cell was computed as the sum of these area-weighted contributions from all overlapping hexagons, ensuring consistent and accurate downscaling of spatial data. When precise overlap calculations were impractical the biliniar interpolation method was employed. The interpolation error was estimated to be 3.9%, calculated by comparing interpolated density values at 1000 randomly sampled 100 m grid cells against known reference values. The error was quantified using the RMSE formula.
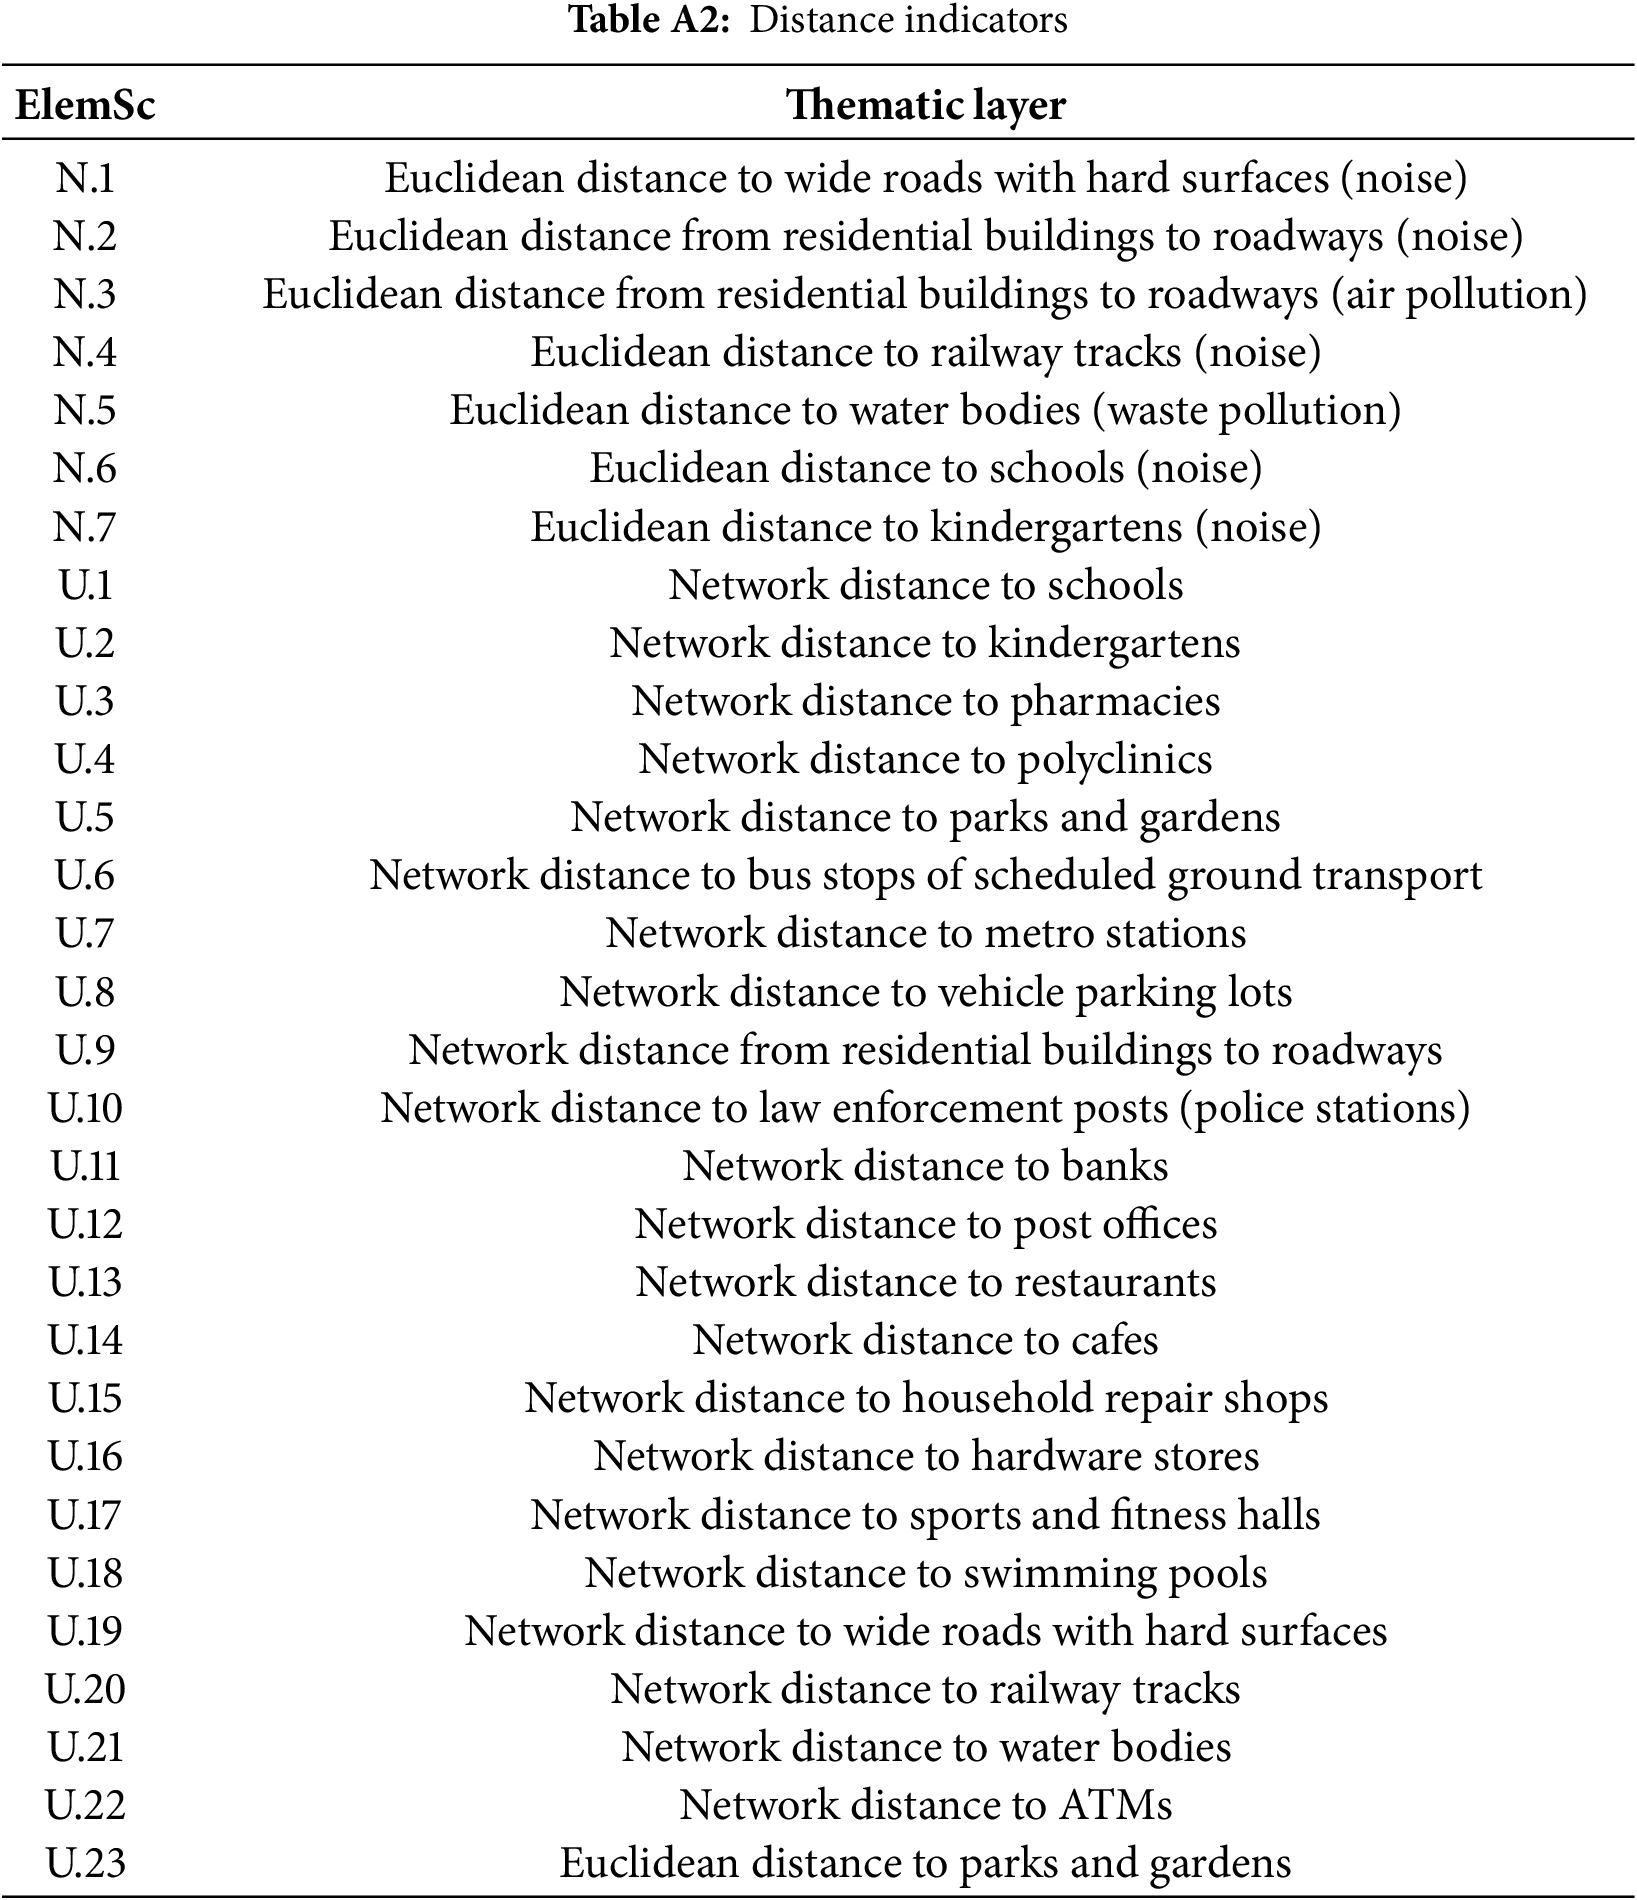
By leveraging the updated Spatial Database, we computed quality and distance matrices for each unit area within the city using the standard tools of GIS “Panorama”. The quality matrix provides a quantitative representation of both topographical and non-topographical features contained within each unit area. In contrast, the distance matrix reflects the accessibility potential of each spatial unit to key infrastructure elements and includes two types of distance measures: network distance, which represents the actual walking distance between two points along the defined pedestrian network of sidewalks and pathways, and Euclidean distance, which indicates the straight-line distance between two points in Euclidean space. Network distance provides realistic, route-based accessibility insights by measuring true travel distances along pedestrian or road networks, accurately reflecting how people move through urban environments. Euclidean distance, on the other hand, offers a simplified straight-line measure often used for general environmental quality assessments, such as estimating proximity to green spaces, noise sources, or pollution.
The routing graph for Novosibirsk’s spatial analysis was generated from detailed municipal GIS data, encompassing comprehensive mappings of sidewalks, pedestrian pathways, and street networks to accurately represent all traversable routes. Nodes correspond to intersections, pathway endpoints, or other key points, while edges denote walkable segments annotated with attributes such as length and pedestrian accessibility (Fig. 1).
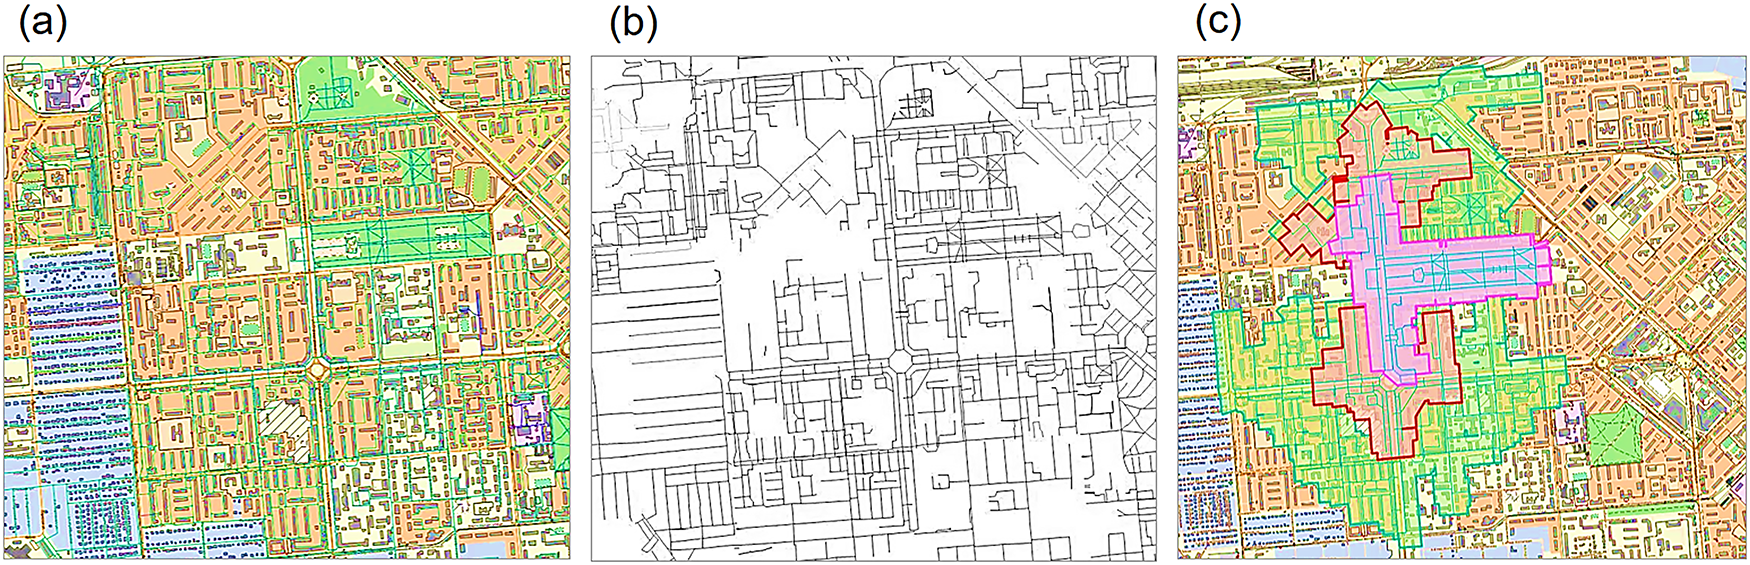
Figure 1: Spatial network graph and pedestrian accessibility to park based on municipal GIS data: (a) GIS data, encompassing sidewalks, pedestrian pathways, and street networks; (b) constructed routing graph; (c) network distances to the park—830 m (10 min walk), 1250 m (15 min walk), and 1785 m (21 min walk)
Key assumptions include: full passability of pathways year-round without temporary closures; bidirectional network connectivity unless explicitly restricted; no consideration of elevation changes, assuming planar distances; and no seasonal or weather-related variations in route availability or speed. The data utilized the Mercator projection, with subsequent normalization to mitigate distortions in spatial metrics.
The graph enables precise calculation of realistic pedestrian travel distances, supporting detailed accessibility assessments within the Scenario-Based Urban Environment Quality Index (SUEQI) framework.
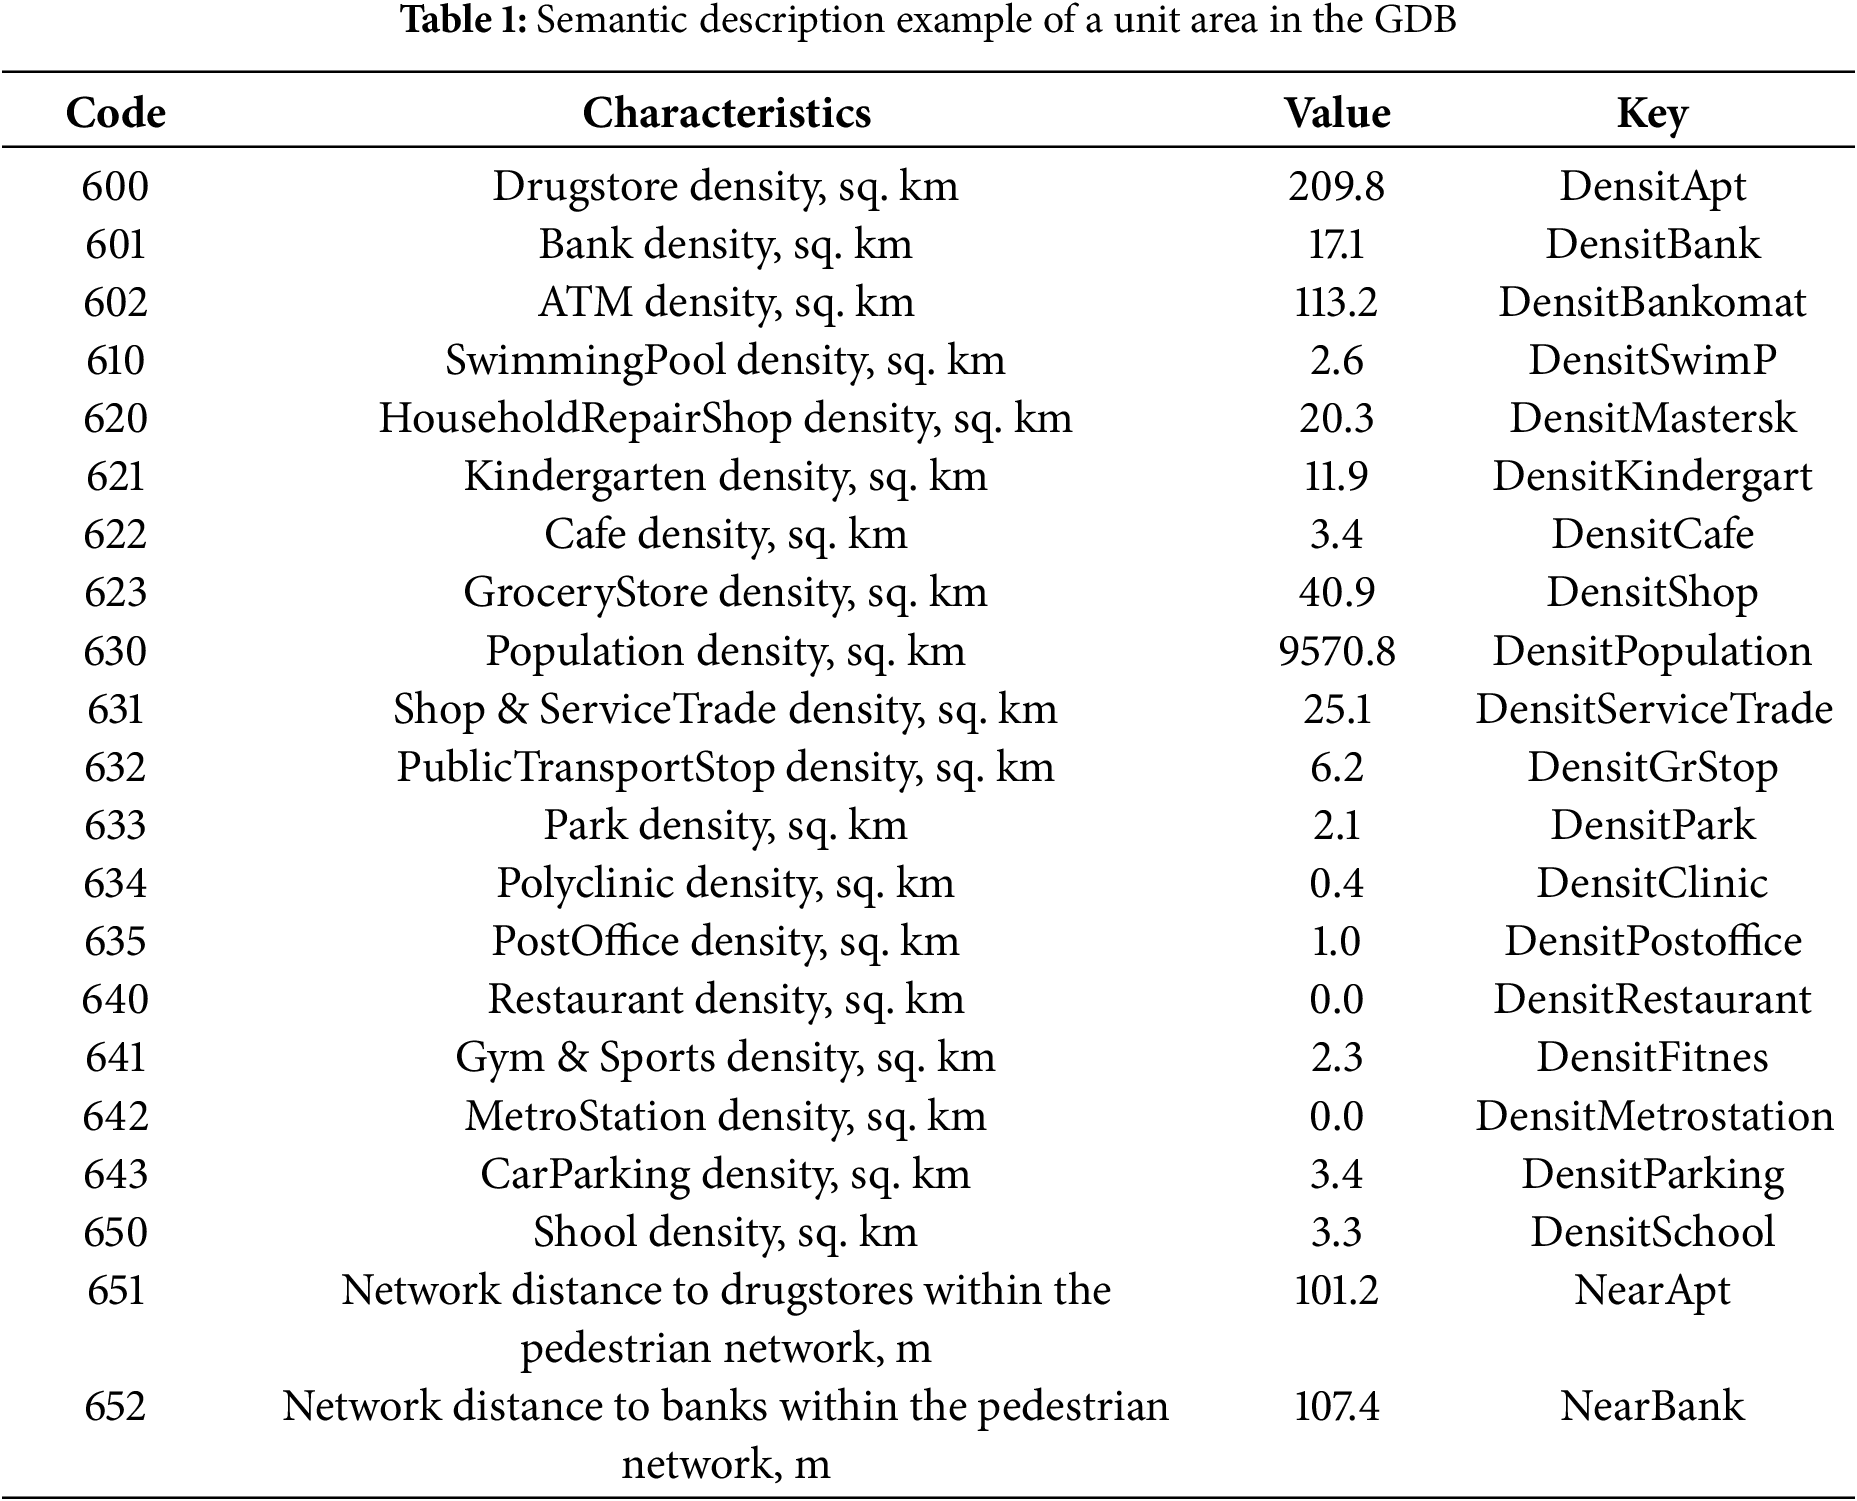
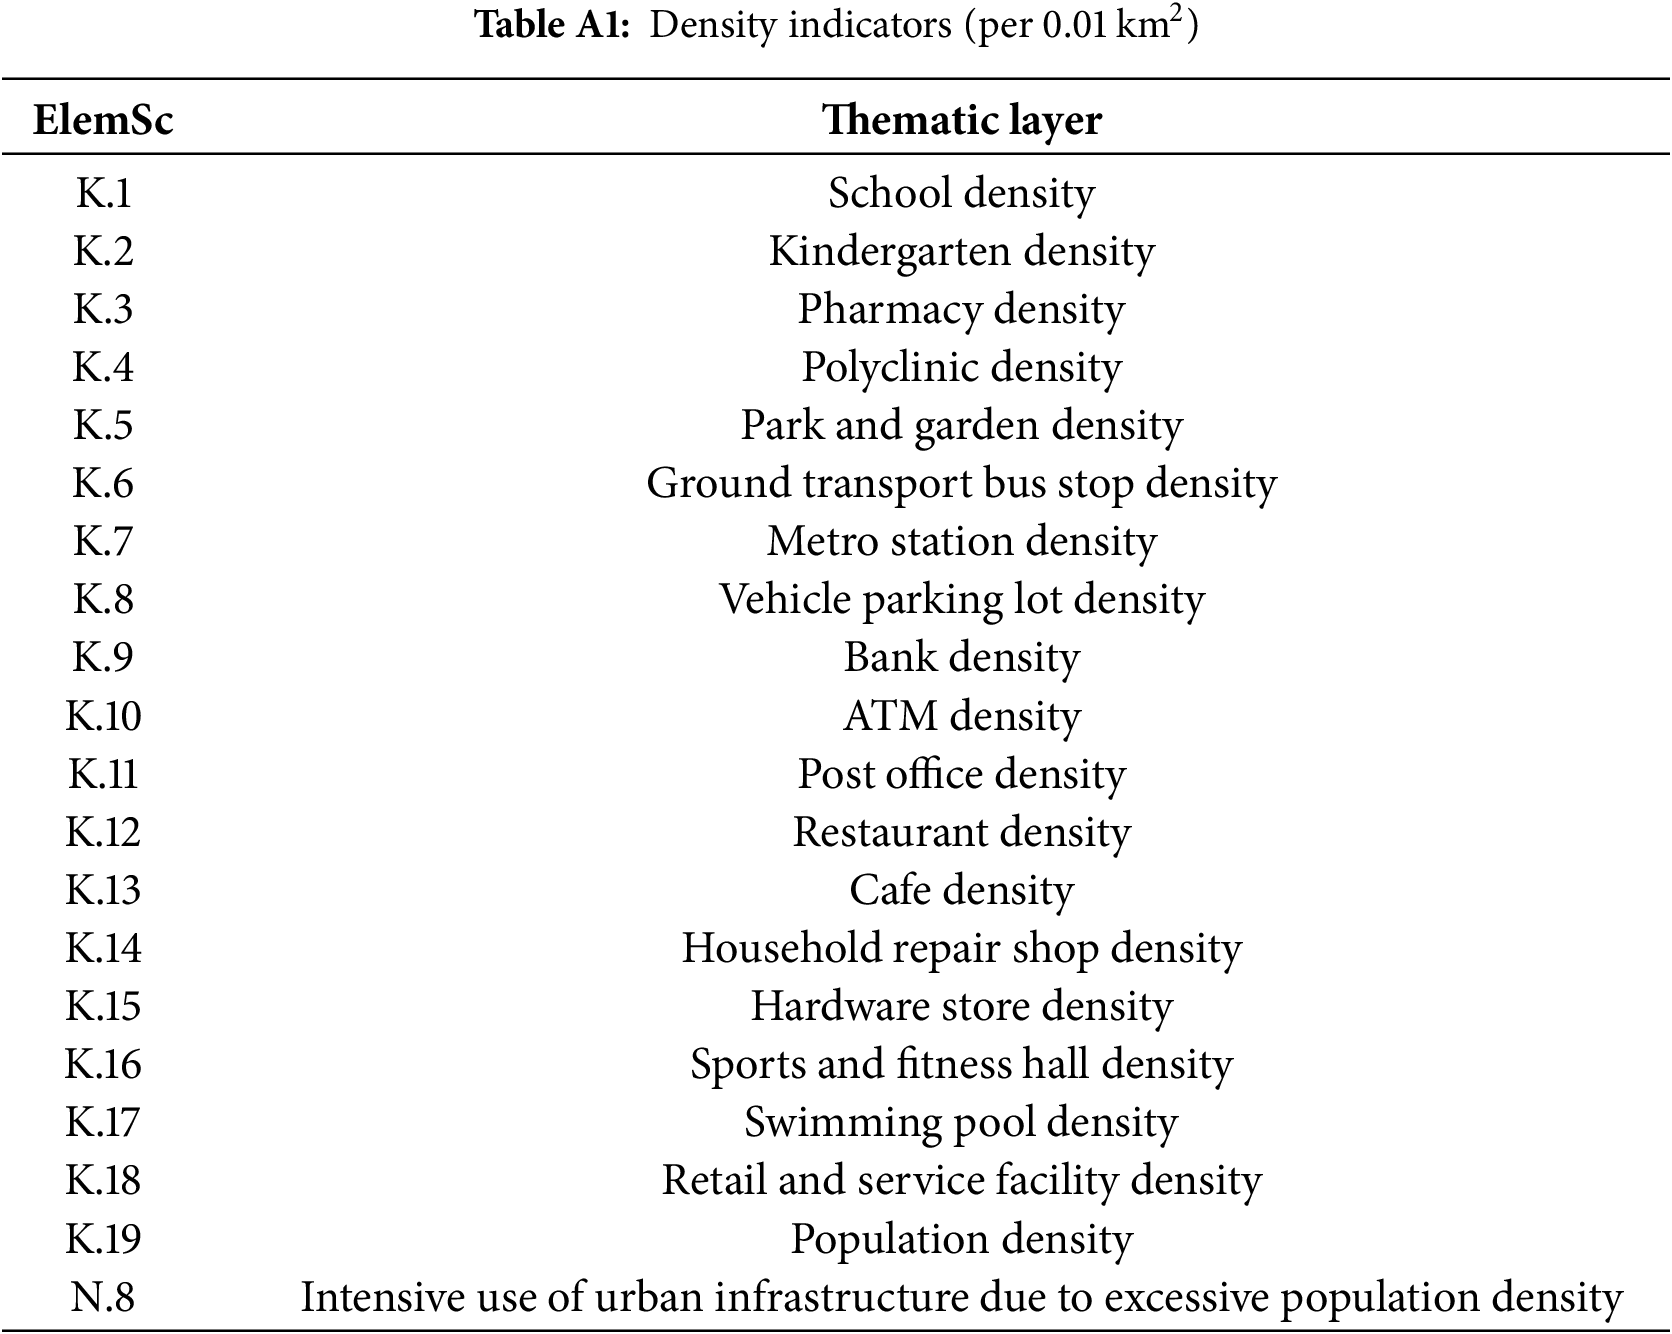
Since the grid node coordinates were defined using the Mercator projection, slight variations occurred in the sizes of comparable unit areas located in the northern and southern parts of Novosibirsk (5731 and 5762 m2, respectively) due to the known area distortions inherent to this projection. To ensure accuracy in spatial analyses, all metric and quantitative characteristics were normalized to a standard unit area of 0.01 km2. The calculated matrices were stored in a dedicated Grid-based Database (GDB) (Table 1), specifically designed to facilitate subsequent modeling and computation of scenario-based urban environment quality indices.
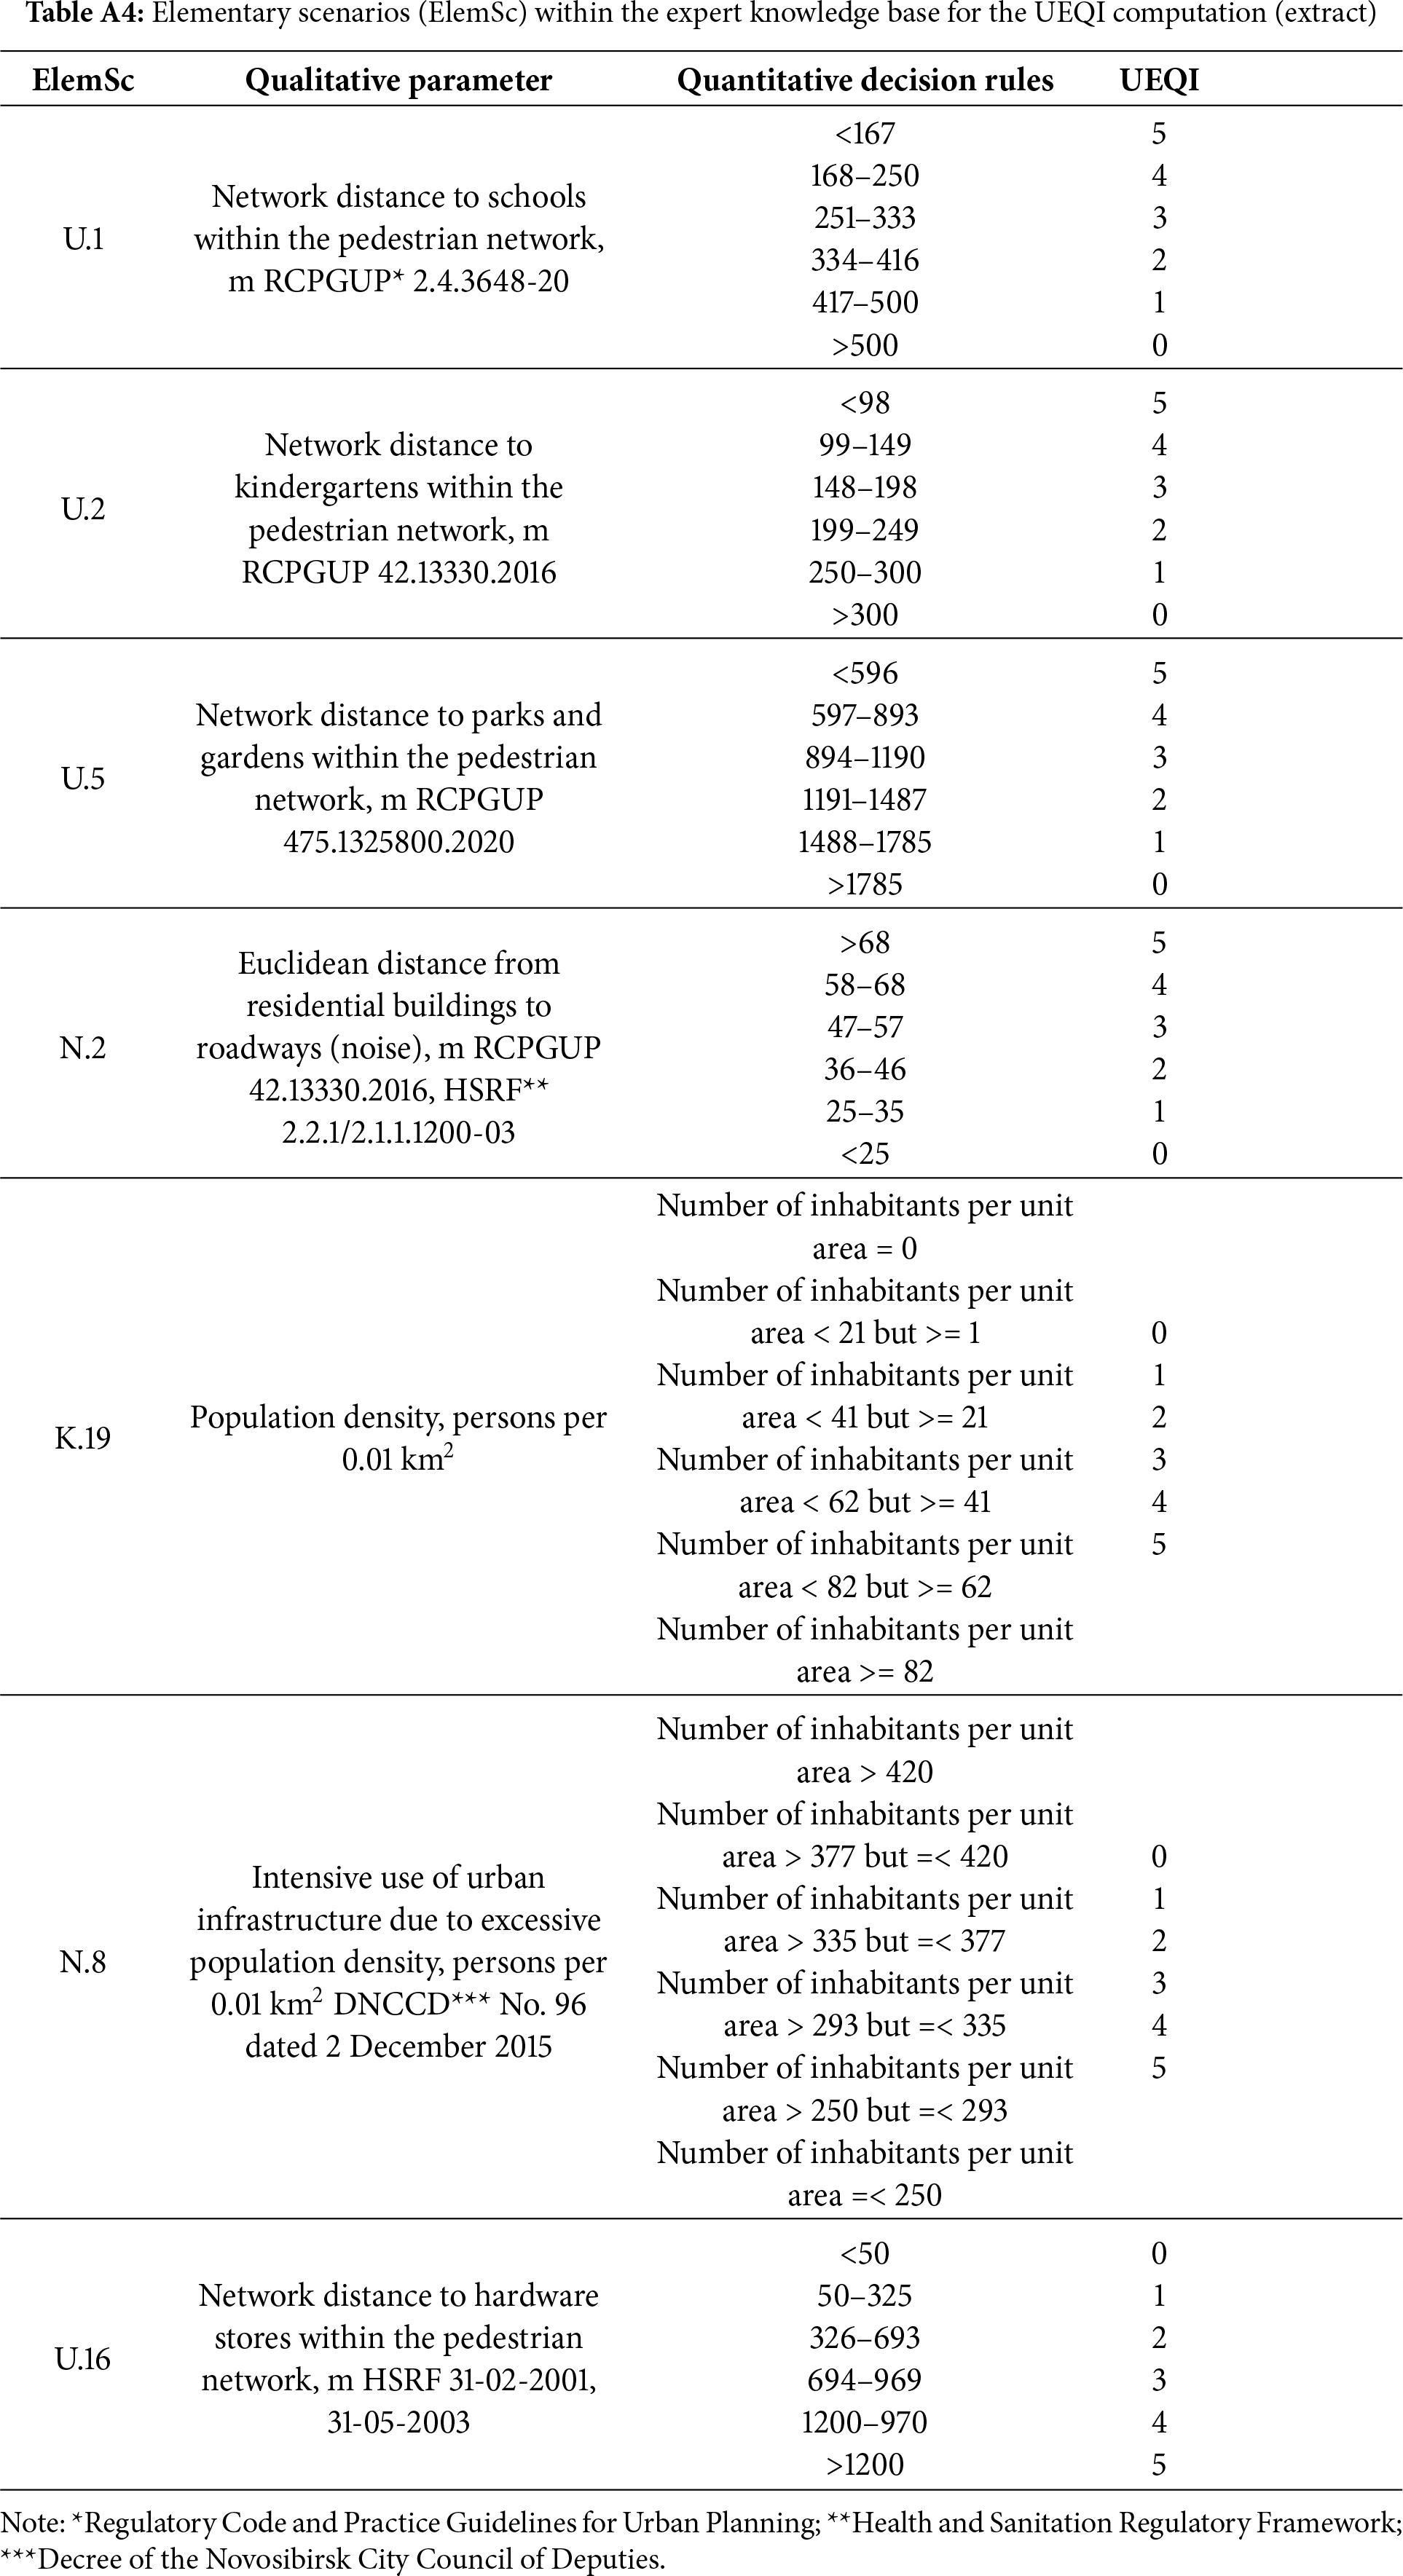
Building upon the revised set of indicators derived from the methodology for determining the urban environment quality index established by the Federal Ministry of Construction, as well as current urban planning guidelines and health and safety standards, we developed a comprehensive series of qualitative and quantitative rules linking Novosibirsk’s social infrastructure to the spatial characteristics of the study area. These rules incorporate a set of quantifiable parameters, compiled within an expert knowledge base, which are systematically applied to relevant baseline scenarios generated from the underlying dataset stored in the GDB.
The calculation of the scenario-based urban environment quality index (SUEQI) for each unit area in Novosibirsk was conducted using newly developed and adapted indicators tailored to the research objectives. The integral UEQI was computed based on inputs from the grid-based database aligned with the specific scenario requirements, incorporating expert evaluations, and processed through custom-developed software implemented as an external plugin within QGIS.
The following formula was employed for the calculation of the scenario-based urban environment quality index [28]:
where SQI x,y denotes SUEQI for a unit area with coordinates {x, y} (center of the unit area), SQI x,y ∈ N0 = {0, 1, 2, 3, 4, 5}, n denotes the number of thematic layers selected from the GDB for joint processing,
The weight coefficient wl ∈ (0, 1] is assigned by experts during the calculations, with a default value of wl = 1. In the study, the coefficient was applied only when accounting for seasonality or multimodal accessibility involving different types of transport. The values of SQIx,y for a unit area with coordinates {x, y} in thematic layer l range from 0, indicating that the unit area does not satisfy the pattern plan, to 5, indicating full compliance with all conditions of the pattern plan.
The
where Rl denotes the value obtained according to the rules formulated by the expert knowledge base for layer l, Rl ∈ N0 = {0, 1, 2, 3, 4, 5}.
In scenarios requiring reversed calculations (rev) of the urban environment quality index for thematic layer l (for instance, identifying areas distant from public transportation rather than close to it) it was calculated as
To assess the changes in the SUEQI after implementing measures specified in the Master Plan, the following formula was applied
where
2.4 Modelling UEQI Scenario-Based Patterns
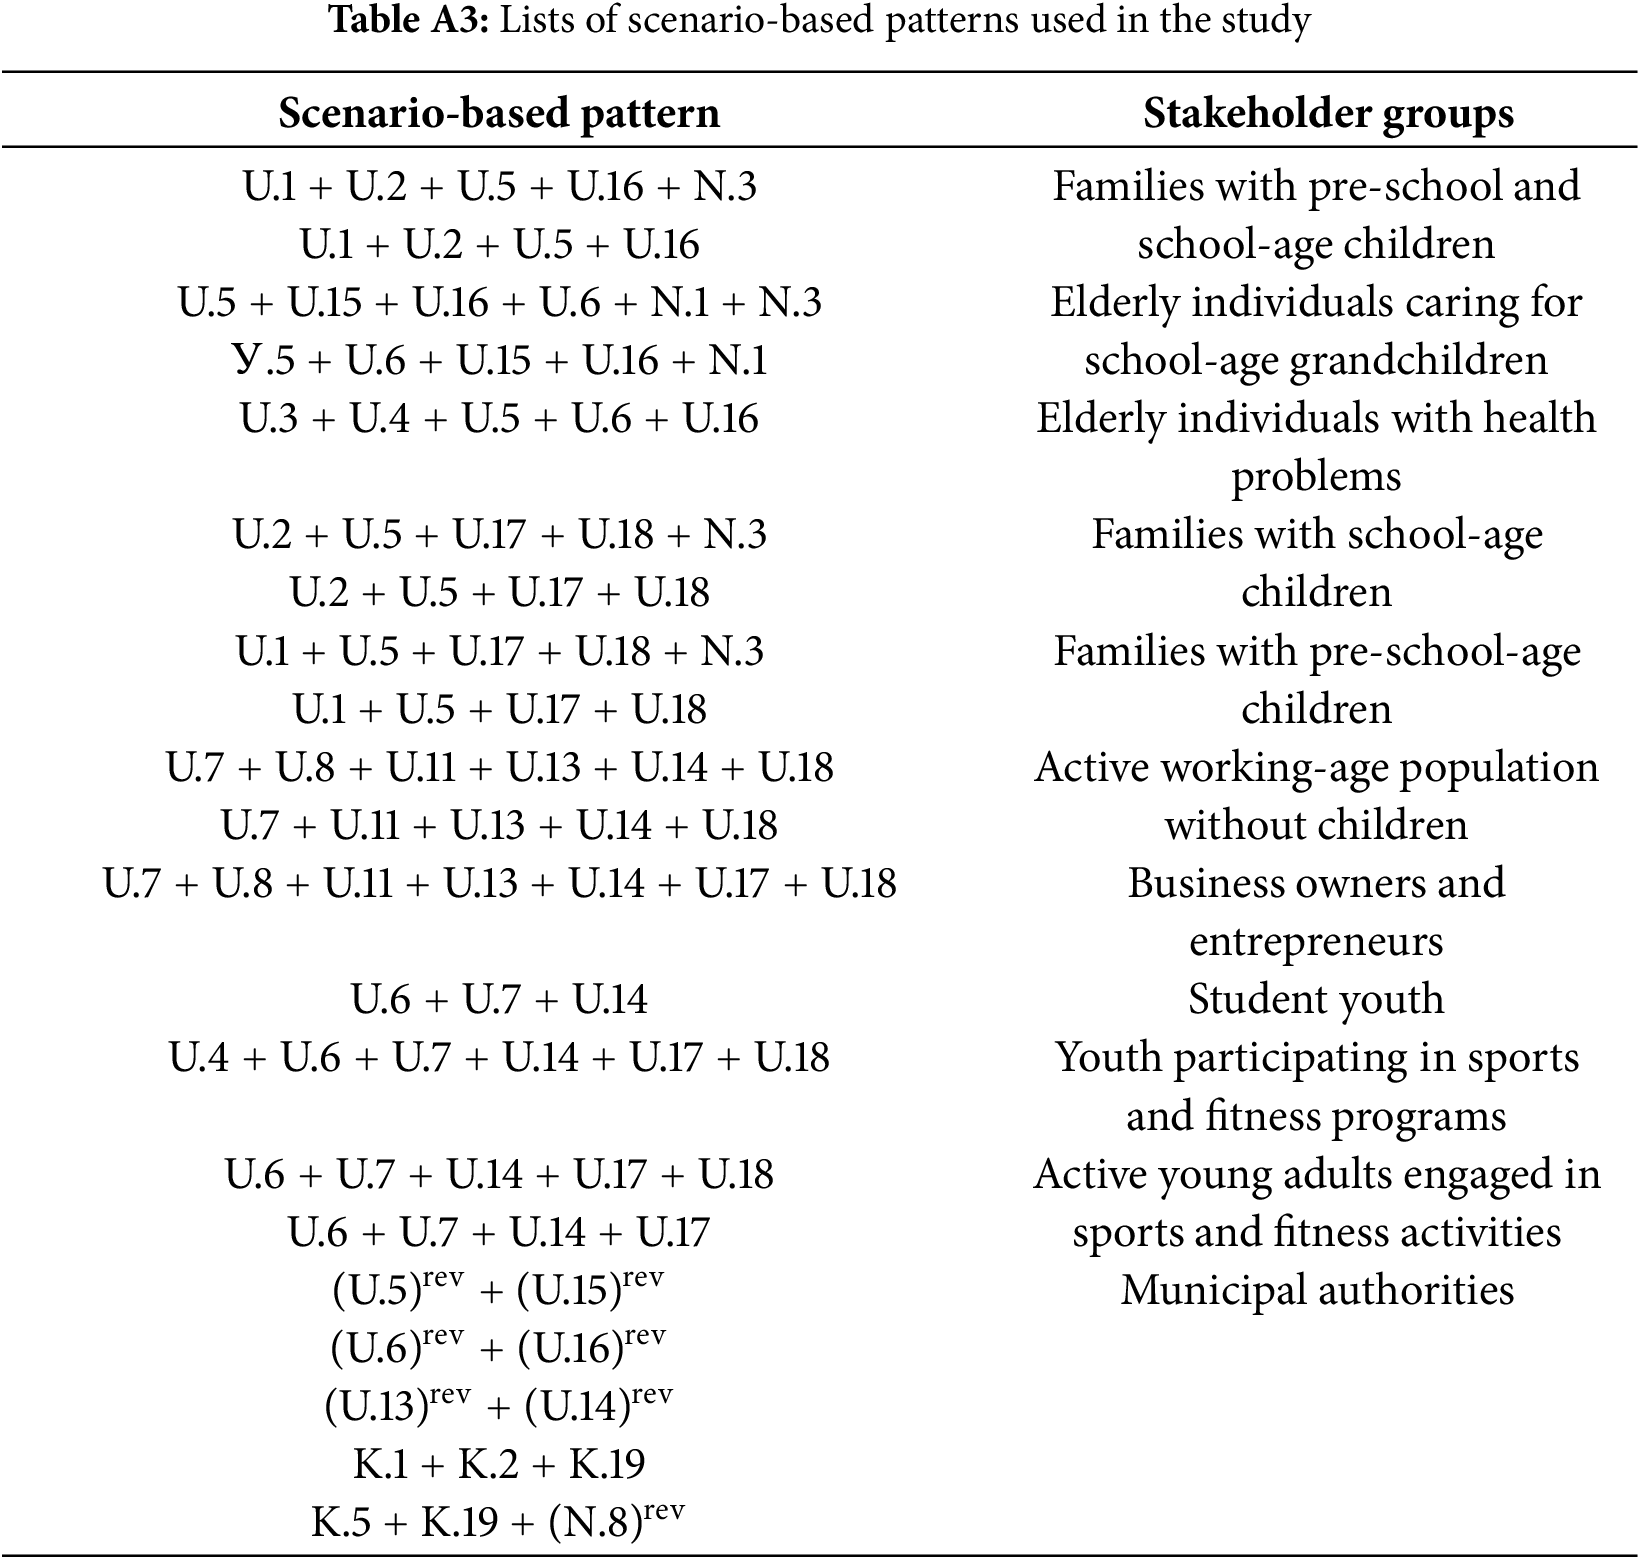
A scenario-based pattern in this study is represented as a sequence of alphanumeric symbols denoting specific urban environment quality criteria (Appendix A, Tables A1 and A2)—an elementary scenario—that is modeled and processed through an external plugin within QGIS. For example, a scenario pattern designed to identify unit areas located near or within acceptable walking distances of kindergartens (U.2) and schools (U.1) can be expressed as U.1 + U.2. In contrast, in scenarios where unit areas are required to be near kindergartens but significantly distant from schools, the scenario pattern is represented as U.1 + (U.2)rev.
Modeling and calculation of SUEQIs were conducted for each of 87,905 unit areas based on 21 scenario-based patterns, targeting four distinct categories of city residents: elderly individuals and pensioners; families with children; the active working-age population and youth; and business owners and entrepreneurs. Additionally, SUEQI modeling and calculation were performed for municipal authorities using five separate scenario-based patterns (Appendix B, Table A3). The number of thematic layers incorporated within these scenario-based patterns ranged from 2 to 7.
Processing of the scenario-based patterns was conducted using the developed expert knowledge base (Appendix C, Table A4), while the calculation of the SUEQI was performed according to Eq. (1).
2.5 Functionality of the Developed QGIS Plugin
The spatial analysis tool was developed using the Python programming language and implemented as an external plugin for QGIS, enhancing its geospatial processing capabilities. The software tool provides the following core functionalities (Fig. 2):
– detection of zones where the urban environmental quality index falls below established standards, thus informing strategic urban planning interventions,
– creation, editing, saving, and loading of scenario-based patterns for spatial analysis, facilitating flexible scenario management,
– calculation of the SUEQI at the unit area level, accompanied by visualization of the degree of conformity between unit areas of the urban territory and the defined scenarios on a quantitative scale from 0 to 5,
– computation and visualization of changes in the SUEQI values resulting from modifications to scenario patterns or the implementation of measures outlined in the Master Plan, represented on a scale from −5 to +5,
– overlay and manipulation of diverse spatial thematic layers to support comprehensive environmental assessments,
– presentation of data processing outcomes through interactive widgets, enabling user-friendly result interpretation,
– analysis of the spatial distribution and clustering of urban objects and features,
– identification and delineation of optimal areas suitable for residential living and business development based on spatial criteria.
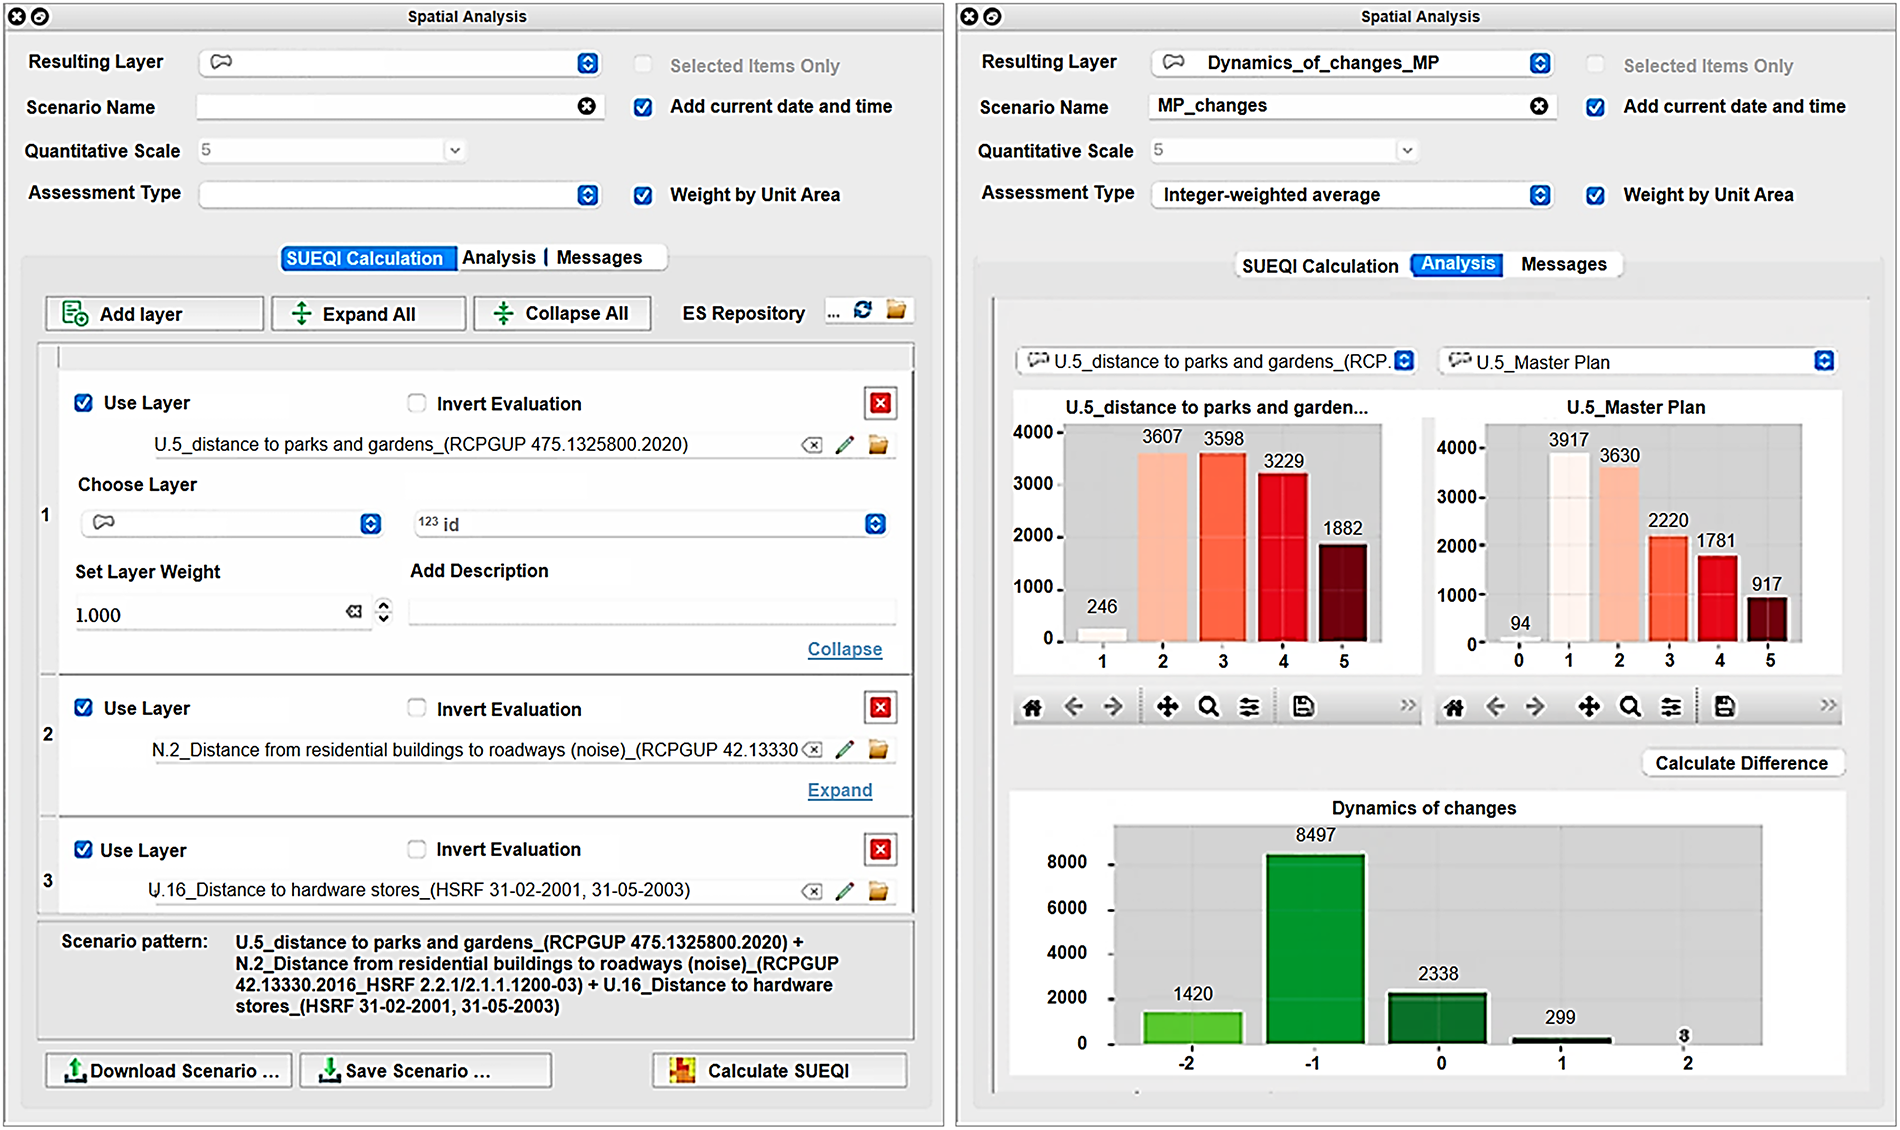
Figure 2: Core functionalities of the spatial analysis tool implemented as a QGIS plugin
The plugin architecture integrates geoprocessing algorithms with a robust expert knowledge base, enabling scenario-based spatial analysis and decision support within the QGIS environment. The tool’s interface and visual output support both technical analysis and communication to stakeholders in urban environmental management.
2.6 Validation of Calculation and Simulation Results
Verification of the correct operation of the developed plugin for QGIS (software), as well as the visualization of the resulting scenario-based simulation outcomes, was conducted on urban test areas spanning 13.5 km2 (5 × 2.7 km) in accordance with the principle of equivalence.
Software accuracy was evaluated by experts who calculated urban environment quality index values for elementary scenarios within individual unit areas of the test site using GIS “Panorama” and MS Excel.
These expert-derived values were then compared with the corresponding SUEQI values generated through software data processing (Fig. 3a). Similarly, validation of standard software functionality was performed by processing sets of elementary scenarios incorporated into scenario-based pattern in varied sequences to evaluate consistent performance (Fig. 3b,c).
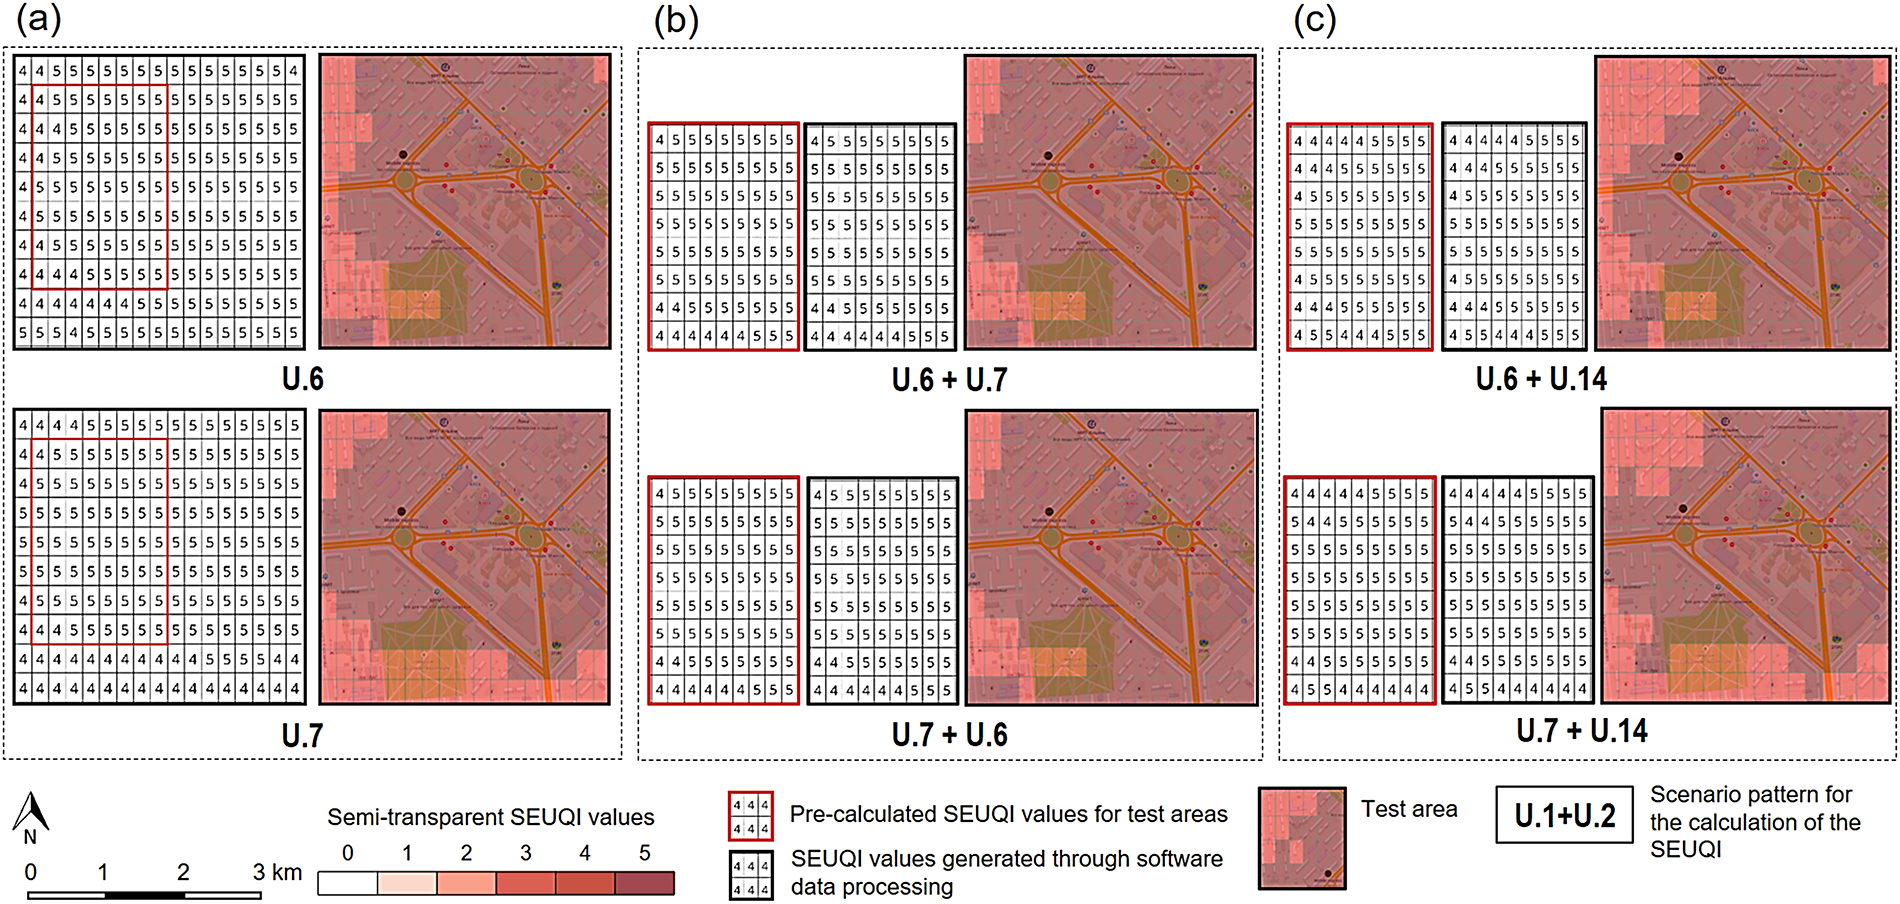
Figure 3: Software verification: (a) comparison of pre-calculated SUEQI values with values from software processing, (b,c) testing software performance when processing scenario-based patterns in varied sequences
The correctness of scenario-based simulation visualization was verified by comparing grayscale images of SUEQI values obtained from preliminary calculations with images produced by the software after processing scenario-based patterns. In the latter, scenario-based urban environment quality indices were presented as semi-transparent grayscale overlays superimposed onto a topographic map (Fig. 4).
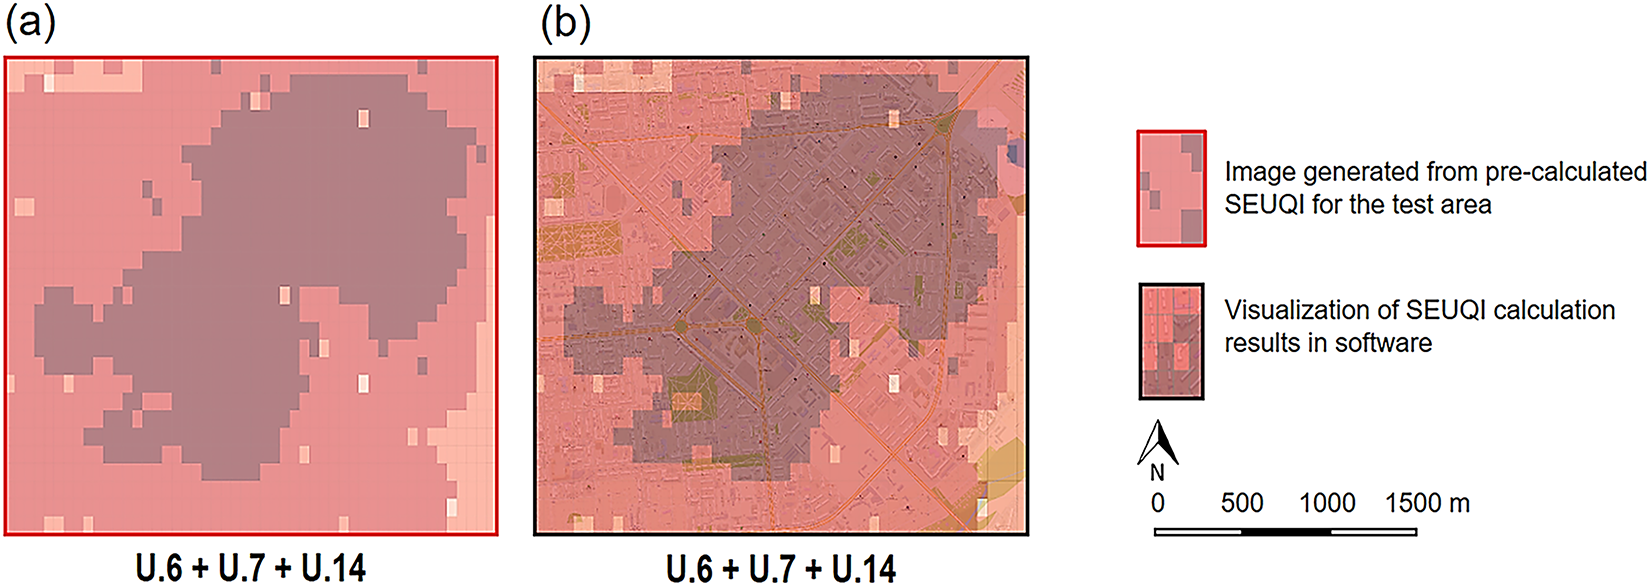
Figure 4: Visualization verification: (a) image generated from pre-calculated SUEQI values, (b) scenario-based SUEQI values displayed as semi-transparent overlays in the software
The software operation and visualization outputs were validated by assessing metrics such as the exact-match rate on scores from 0 to 5, MAE, and Cohen’s κ coefficient, reported separately for elementary and pattern scenarios over the 13.5 km2 site. Verification was confirmed when these metrics demonstrated strong agreement and accuracy, indicating consistent alignment between software-generated outputs and preliminary SUEQI calculations and visualizations.
The development and application of the scenario-based spatial analysis tool produced comprehensive insights into urban environmental quality across the city of Novosibirsk. The integration of geoinformation technologies, expert knowledge base, and GIS enabled the partitioning of the urban landscape into 87,905 standardized unit areas, forming the foundational spatial units for detailed assessment and modeling.
A regularly updated Spatial Database (SDB) was created using topographic maps, the city’s Master Plan for 2030, and population density data. Thematic layers were constructed and integrated into a dedicated grid-based database, facilitating efficient data processing. The prepared quality and distance matrices quantitatively represented key urban infrastructure and environmental features across all unit areas.
Employing 21 scenario-based patterns tailored toward specific demographic groups such as elderly, families with children, working-age population, youth, and entrepreneurs, as well as municipal authorities, the tool computed SUEQI for each unit area. The indices ranged from 0 to 5, quantifying conformity to scenario criteria.
SUEQI values were visualized within QGIS, revealing distinct spatial patterns of urban environmental quality across districts and neighborhoods. Specific “comfort zones” were identified where proximity to key amenities such as schools, parks, shops, public transport bus stops etc. was optimal, while “pain points” highlighted areas deficient in critical infrastructure or environmental quality (Fig. 5).
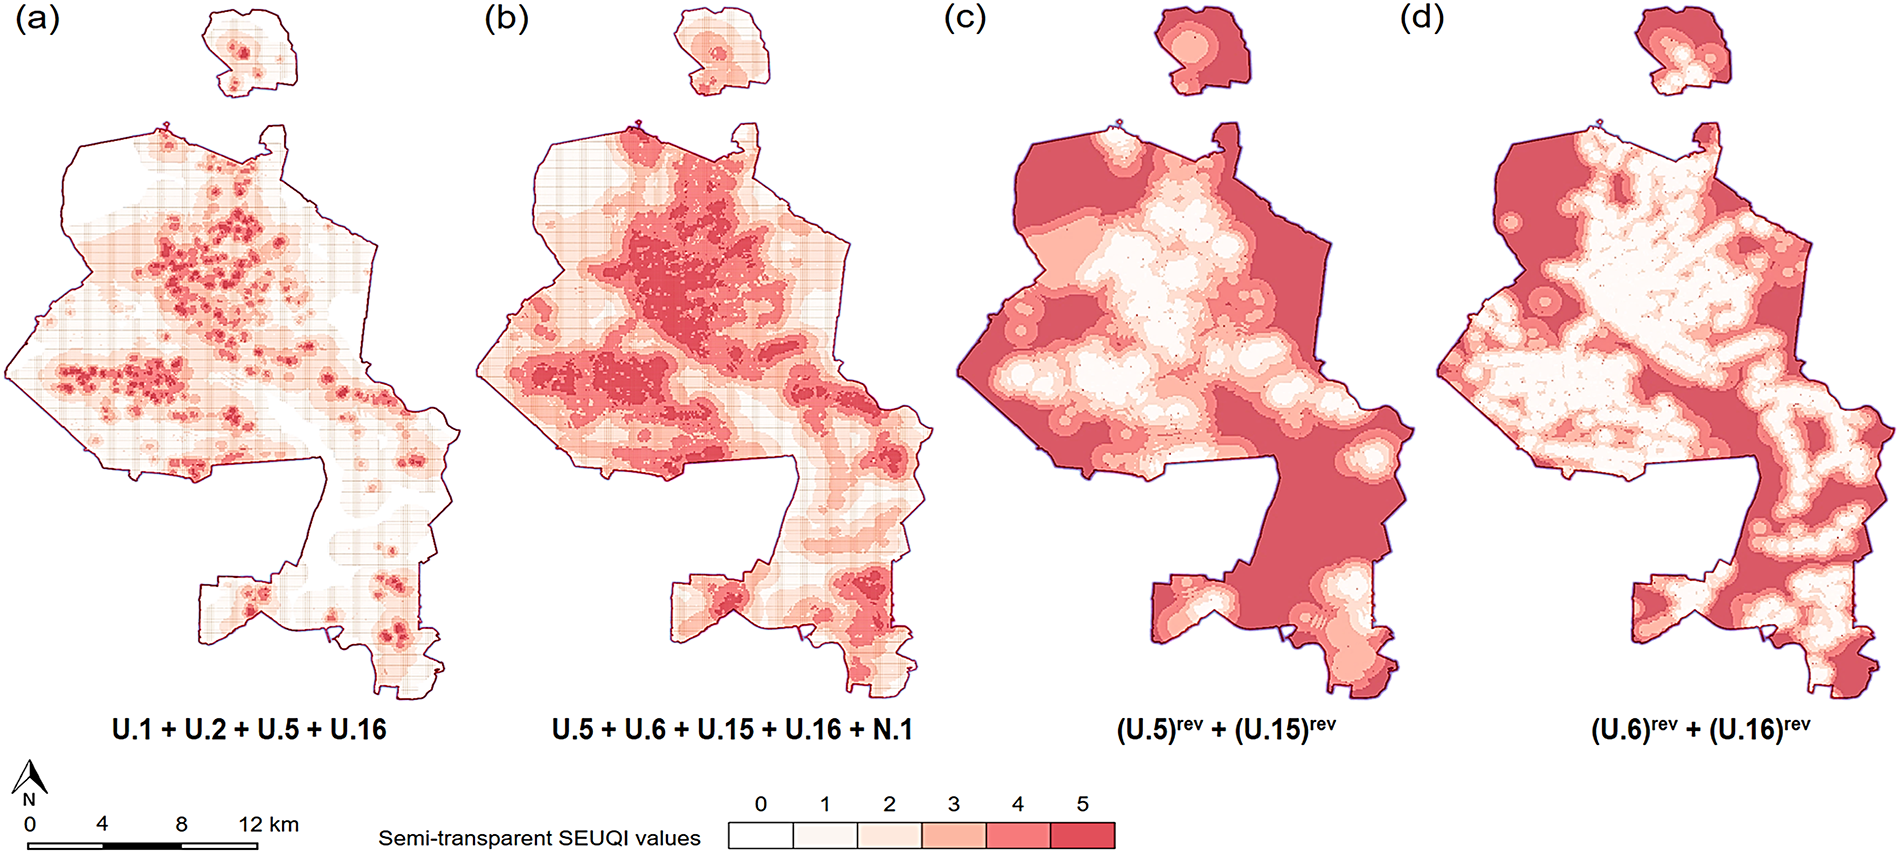
Figure 5: Spatial distribution of unit areas by network-based access to key urban amenities and facilities: (a) areas near schools, kindergartens, shops, parks, and gardens; (b) areas close to parks, gardens, bus stops, workshops, and shops, but far from schools; (c) areas farthest from workshops and green spaces; (d) areas farthest from shops and bus stops
The tool facilitated dynamic modeling and visualization of changes in UEQ resulting from modifications in urban scenarios or implementation of General Plan initiatives.
Overlaying these dynamic results with population density maps further clarified the potential social impacts of spatial planning decisions (Fig. 6).
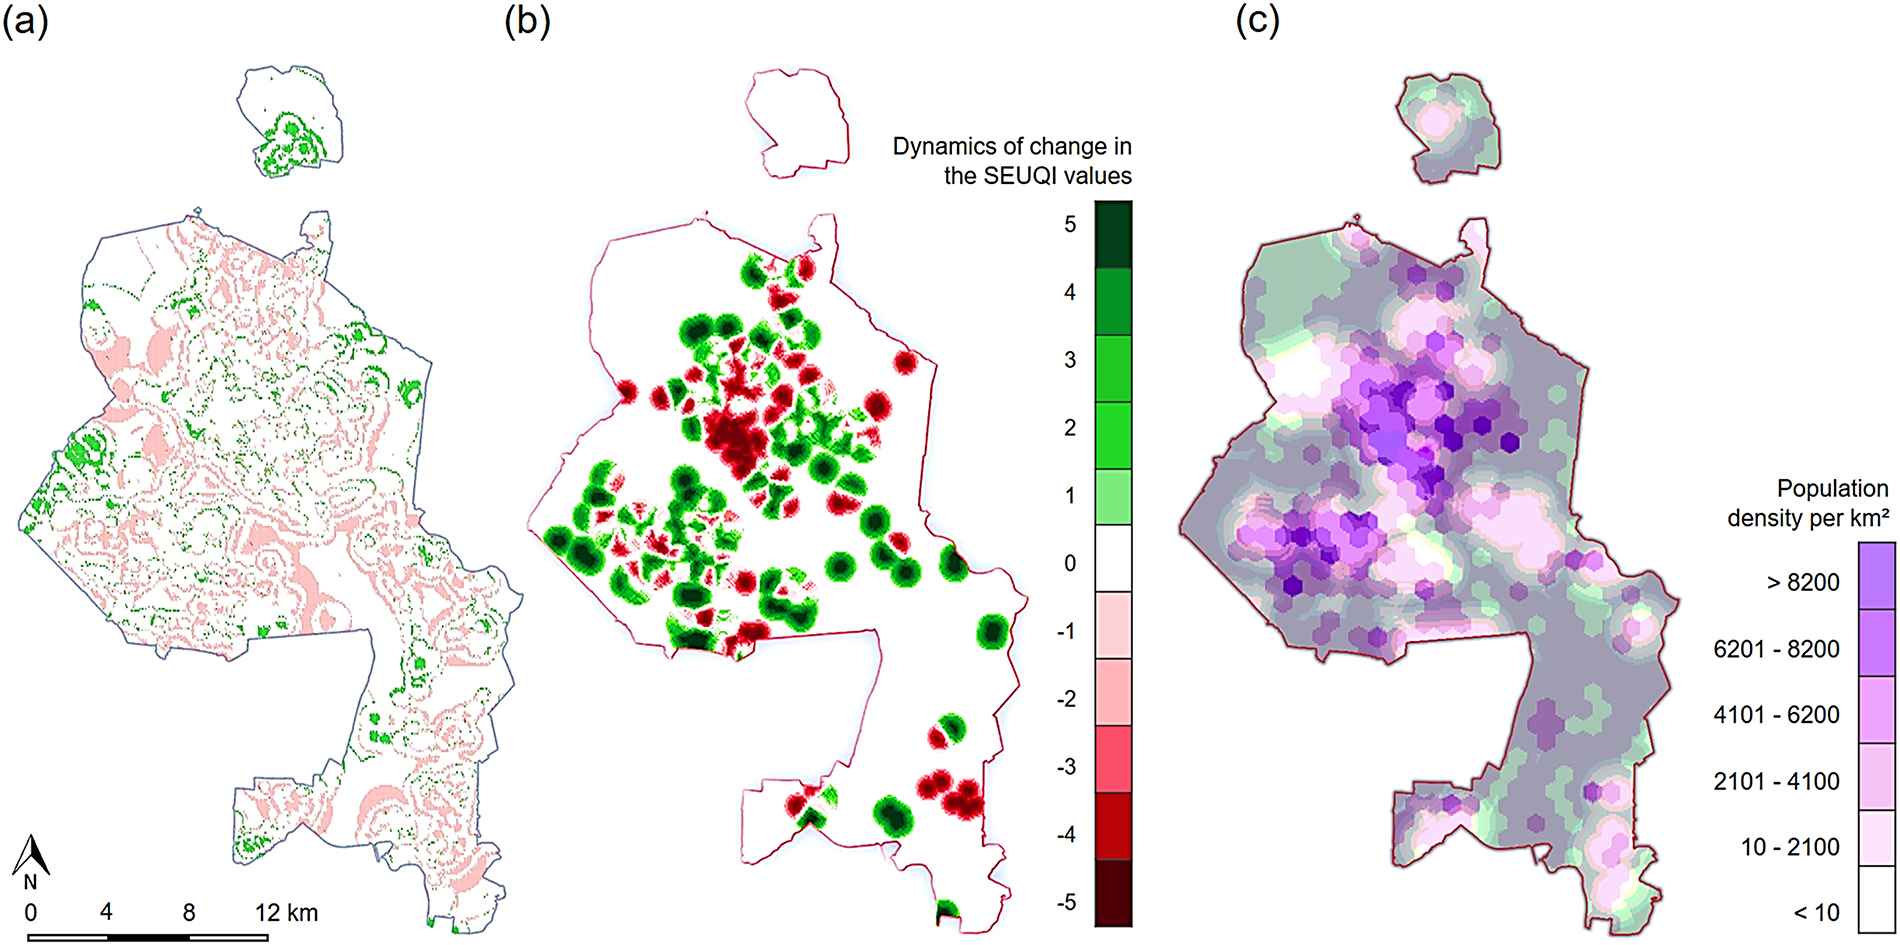
Figure 6: Dynamic changes in SUEQI values: (a) change between scenario patterns U.6 + U.7 + U.14 + U.17 + U.18 and U.6 + U.7 + U.14 + U.17; (b) change in “Car Parking Areas” SUEQI indicator comparing current and Master Plan; (c) impact of Master Plan on SUEQI changes for “Green Spaces” and population coverage
Validation against expert-calculated indices demonstrated high accuracy, with a correspondence rate between pre-calculated and software-derived SUEQI values ranging from 0.98 to 1.00. Consistent software performance was confirmed through repeated scenario processing in varied sequences. Visualization outputs matched preliminary grayscale maps and were presented as semi-transparent overlays, supporting intuitive spatial interpretation.
The spatial analysis identified zones optimal for residential development and business operations based on SUEQI criteria, as well as areas where the urban environment quality index fell below acceptable thresholds. This enables targeted interventions and prioritization in urban development strategies.
Despite the robustness of results, the study acknowledges a key limitation arising from rapid urban changes that render static spatial data less current over time. Recommendations for systematic data updates and automation were articulated to sustain analysis accuracy and relevance.
Determining the status of urban environmental quality (UEQ) directly reflects the quality of life experienced by residents [29,30]. Therefore, the first critical step in formulating effective strategies to enhance UEQ is a comprehensive evaluation of its current state. To conduct this spatial assessment, various models have been employed including GIS-based Multi-Criteria Decision-Making (GIS-MCDM) [16,31], machine learning approaches [32], and regression analyses [33]. Since UEQ inherently depends on multiple environmental and spatial-functional criteria distributed across space, this study adopts a GIS-MCDM approach facilitated by purpose-built software tools.
Previous research highlights that the accuracy of GIS-MCDM models hinges on several key factors: the completeness and relevance of chosen criteria, the precision and consistency in assigning criteria weights, the methodology for standardizing criteria values, and the effectiveness of aggregation techniques. Robust criteria should be comprehensive and compatible, often guided by expert opinion and past studies. The reliability of the weighting scheme plays a vital role in ensuring the quality of model outcomes. Common weighting techniques include the Best–Worst Method [34], the Analytic Network Process (ANP) [35], and the Analytic Hierarchy Process (AHP) [34,35]. This study selects the ANP method due to its particular advantages in addressing complex decision problems. Unlike hierarchical models, ANP can explicitly model feedback loops and interactions within and between clusters of related factors, thus offering a realistic representation of complex real-world systems. It also integrates qualitative and quantitative aspects, enabling a comprehensive evaluation of benefits, risks, costs, and opportunities. These features provide greater flexibility, accuracy, and contextual realism, making ANP especially suitable for dynamic, interconnected multi-criteria decision-making [36].
Currently, numerous well-established methods exist for conducting spatial and spatiotemporal analysis, including Exploratory Spatial Data Analysis (ESDA), Suitability and Site Analysis (SSA), Multi-Criteria Decision Analysis (MCDA), Cellular Automata and Agent-Based Modeling, Land Use and Land Cover Change (LULC) modeling, Network and Accessibility Analysis, and Spatial Optimization, among others [37–39]. For scenario-based urban spatial analysis, this study employs a combination of SSA and MCDA methods, forming a comprehensive toolkit for scientifically grounded, transparent, and participatory spatial planning. The developed spatial analysis tool integrated into QGIS represents a significant advancement in assessing UEQ at fine-grained spatial scales. By dividing the urban area into standardized units, it effectively captures the heterogeneity and spatial inequalities characteristic of large cities like Novosibirsk. The grid-based approach improves upon aggregated indices by offering localized assessments that more accurately reflect residents’ lived experiences and needs.
The integration of expert knowledge with geoinformatics and GIS techniques enables flexible and customizable scenario modeling. This feature supports targeted evaluations for various urban populations, including elderly residents, families, youth, and business professionals. Such tailored approaches address the challenge of applying uniform methods to diverse urban environments, responding to the spatial, social, and infrastructural heterogeneity emphasized in prior studies.
The tool offers robust capabilities for dynamic visualization and scenario-based analysis of urban environmental quality (UEQ) changes, enabling municipal authorities to anticipate and assess the impacts of various urban planning scenarios and Master Plan implementations. This functionality provides critical decision support by clearly illustrating spatial variations and temporal shifts in UEQ, thereby facilitating more informed and proactive urban governance. It helps identify priority intervention areas or “pain points”, facilitating evidence-based urban governance aimed at improving environmental quality, accessibility, and livability. Additionally, its no-code and low-code functionality promotes wider accessibility among planners and stakeholders, fostering participatory planning and transparency.
Compared to existing QGIS plugins for urban and environmental assessments (e.g., UrbanMatrix, UMEP), our tool stands out by emphasizing scenario-based, multi-criteria spatial analyses that incorporate demographic targeting and dynamic monitoring. Its adaptable, expert-driven framework makes it highly suitable for strategic urban planning and enriches the geospatial decision-support ecosystem.
A remaining challenge lies in maintaining the temporal relevance of spatial databases amid rapid urban change. To address this, the study proposes regular, systematic updates, automation of data refresh workflows, and prioritization of critical datasets. These strategies aim to preserve the analytical accuracy, relevance, and long-term utility of the spatial analysis tool in a continuously evolving urban context.
This study presents the first application in Novosibirsk of a scenario-based spatial analysis tool integrating geoinformation technologies, geoinformatics, and an expert knowledge base adapted for urban environment quality indexing aligned with current planning frameworks. The tool, implemented as a QGIS plugin, enables calculation and visualization of urban environment quality indices at fine spatial units derived from standardized partitioning of the urban area. It supports flexible scenario management, multi-layer spatial analysis, and dynamic evaluation of index changes resulting from urban planning scenarios or Master Plan initiatives.
Application results demonstrate the tool’s capability to provide targeted assessments for different demographic groups, aiding in identifying optimal zones for residential and business development as well as priority areas for urban intervention. The tool’s no-code/low-code design fosters usability in municipal governance, while its dynamic tracking of urban environment changes enhances transparency and decision-making effectiveness. Cartographic outputs facilitate evidence-based urban program formulation.
Future work will expand analytical scope to include negative environmental factors and leverage artificial neural networks to improve computational efficiency and predictive accuracy, supporting sustainable urban development and management.
Acknowledgement: The author would like to express sincere gratitude to Dr. Olga Opritova and Sergey Taranenko for their invaluable assistance and dedicated support throughout the course of this research and development project. Their expert guidance and contributions greatly enhanced the quality and success of this work.
Funding Statement: The research was funded by the Ministry of Science and Higher Education of Russia, R&D project number FEFS-2026-0003.
Availability of Data and Materials: The data that support the findings of this study are available from the corresponding author, upon reasonable request.
Ethics Approval: Not applicable.
Conflicts of Interest: The author declares no conflicts of interest to report regarding the present study.
Catalog of thematic layers in the GDB and elementary scenarios of the expert knowledge base (ElemSc)
References
1. Bibri SE. Compact urbanism and the synergic potential of its integration with data-driven smart urbanism: an extensive interdisciplinary literature review. Land Use Policy. 2020;97(25):104703. doi:10.1016/j.landusepol.2020.104703. [Google Scholar] [CrossRef]
2. Henderson JV. Cities and development. J Reg Sci. 2010;50(1):515–40. doi:10.1111/j.1467-9787.2009.00636.x. [Google Scholar] [PubMed] [CrossRef]
3. Ștefan B, Horeczki R, Rácz S, Sanda R, Vasile D, Iuliu V, et al. Spatial analysis of creative industries for urban functional zones: a GIS-based comparative study in eastern European regional centres: cluj-Napoca (Romania) and Pécs (Hungary). Appl Sci. 2024;14(3):1088. doi:10.3390/app14031088. [Google Scholar] [CrossRef]
4. Wong C. Indicators and urban policy-making: the British experience. In: Vers une renaissance anglaise? Dix ans de politique travailliste de la ville. Paris, France: Presses Sorbonne Nouvelle; 2008. p. 121–39. doi:10.4000/books.psn.4220. [Google Scholar] [CrossRef]
5. Zeng X, Xiang H, Xue Y, Su Y, Tong Y, Mao Z. A scenario-based optimization frame to adjust current strategy for population-economy-resource-environment harmony in an urban agglomeration. China Sustain Cities Soc. 2021;67(265):102710. doi:10.1016/j.scs.2021.102710. [Google Scholar] [CrossRef]
6. Zhalehdoost A, Taleai M. Enhancing urban quality of life evaluation using spatial multi criteria analysis. Sci Rep. 2025;15(1):22048. doi:10.1038/s41598-025-05468-1. [Google Scholar] [PubMed] [CrossRef]
7. Costa DG, Bittencourt JCN, Oliveira F, Peixoto JPJ, Jesus TC. Achieving sustainable smart cities through geospatial data-driven approaches. Sustainability. 2024;16(2):640. doi:10.3390/su16020640. [Google Scholar] [CrossRef]
8. Lipilin DA, Evtushenko DD. Assessment of the quality of the urban environment using geographic information systems on the example of the Moscow district of Krasnodar. Reg Geosyst. 2022;46(2):223–40. (In Russian). doi:10.52575/2712-7443-2022-46-2-223-240. [Google Scholar] [CrossRef]
9. Barca F, McCann P, Rodríguez-Pose A. The case for regional development intervention: place-based versus place-neutral approaches. J Reg Sci. 2012;52(1):134–52. doi:10.1111/j.1467-9787.2011.00756.x. [Google Scholar] [CrossRef]
10. Ehngelgardt AE, Lipovka AY, Fedchenko IG. International experience in indexing the quality of the urban environment. Urbanism. 2018;4(4):77–87. (In Russian). doi:10.7256/2310-8673.2018.4.27886. [Google Scholar] [CrossRef]
11. Hansson S, Arfvidsson H, Simon D. Governance for sustainable urban development: the double function of SDG indicators. Area Dev Policy. 2019;4(3):217–35. doi:10.1080/23792949.2019.1585192. [Google Scholar] [CrossRef]
12. Hsu A, Chakraborty T, Thomas R, Manya D, Weinfurter A, Chin NJW, et al. Measuring what matters, where it matters: a spatially explicit urban environment and social inclusion index for the sustainable development goals. Front Sustain Cities. 2020;2:556484. doi:10.3389/frsc.2020.556484. [Google Scholar] [CrossRef]
13. Wolniak R, Jonek-Kowalska I. The level of the quality of life in the city and its monitoring. Innov Eur J Soc Sci Res. 2021;34(3):376–98. doi:10.1080/13511610.2020.1828049. [Google Scholar] [CrossRef]
14. Notman OV. Index method for assessing the quality of the urban environment: international and Russian experience. Vestn Adyg Gos Univ Seriya. 2021;2(279):89–99. (In Russian). doi:10.53598/2410-3691-2021-2-279-89-99. [Google Scholar] [CrossRef]
15. Li B, Liu Y, Xing H, Meng Y, Yang G, Liu X, et al. Integrating urban morphology and land surface temperature characteristics for urban functional area classification. Geo Spatial Inf Sci. 2022;25(2):337–52. doi:10.1080/10095020.2021.2021786. [Google Scholar] [CrossRef]
16. Roy S, Bose A, Majumder S, Roy Chowdhury I, Abdo HG, Almohamad H, et al. Evaluating urban environment quality (UEQ) for Class-I Indian city: an integrated RS-GIS based exploratory spatial analysis. Geocarto Int. 2022;38(1):1–35. doi:10.1080/10106049.2022.2153932. [Google Scholar] [CrossRef]
17. Shan J, Weng Q, Ehlers M, Quattrochi DA, Zhou G, Stilla U, et al. Urban remote sensing. 1st ed. Boca Raton, FL, USA: CRC Press; 2006. doi:10.1201/9781315166612. [Google Scholar] [CrossRef]
18. Krishnan VS, Firoz CM. Regional urban environmental quality assessment and spatial analysis. J Urban Manag. 2020;9(2):191–204. doi:10.1016/j.jum.2020.03.001. [Google Scholar] [CrossRef]
19. Podoprigora Y, Danilova M, Ufimtseva E. Quality of urban environment as a factor of development of municipal formations. In: Proceedings of the International Science and Technology Conference “FarEastСon” (ISCFEC 2019); 2019 Oct 1–4; Vladivostok, Russia. Dordrecht, The Netherlands: Atlantis Press; 2019. p. 242–5. doi:10.2991/iscfec-19.2019.67. [Google Scholar] [CrossRef]
20. Pramanik S, Areendran G, Punia M, Sahoo S. Spatio-temporal pattern of urban eco-environmental quality of Indian megacities using geo-spatial techniques. Geocarto Int. 2022;37(17):5067–90. doi:10.1080/10106049.2021.1903578. [Google Scholar] [CrossRef]
21. Faisal K, Shaker A. An investigation of GIS overlay and PCA techniques for urban environmental quality assessment: a case study in Toronto, Ontario, Canada. Sustainability. 2017;9(3):380. doi:10.3390/su9030380. [Google Scholar] [CrossRef]
22. Musse MA, Barona DA, Santana Rodriguez LM. Urban environmental quality assessment using remote sensing and census data. Int J Appl Earth Obs Geoinf. 2018;71(11):95–108. doi:10.1016/j.jag.2018.05.010. [Google Scholar] [CrossRef]
23. Chernykh VV, Ivanenko VA. Analysis and directions for improving the methodology for the calculation of the urban environment quality index. Econ Vector. 2021;2(25):128–37. doi:10.36807/2411-7269-2021-2-25-128-137. [Google Scholar] [CrossRef]
24. Musikhin IA. Development of a spatial analysis tool for calculating scenario based urban environment quality index and assessment the dynamics of its change. Vestnik SSUGT. 2024;29(5):125–36. (In Russian). doi:10.33764/2411-1759-2024-29-5-125-136. [Google Scholar] [CrossRef]
25. Shekhar S, Evans MR, Kang JM, Mohan P. Identifying patterns in spatial information: a survey of methods. Wires Data Min Knowl Discov. 2011;1(3):193–214. doi:10.1002/widm.25. [Google Scholar] [CrossRef]
26. Giricheva EE, Bocharnikov VN, Fomin EV. Assessment of Vladivostok urban environment quality using collection of indicators. Reg Stud. 2022;78(4):76–91. doi:10.5922/1994-5280-2022-4-7. [Google Scholar] [CrossRef]
27. Musikhin IA, Opritova OA, Taranenko SV. Development of a multi-functional spatial analysis tool for scenario-based urban environment quality assessment on the example of Novosibirsk. Geod Cartogr. 2025;1016(2):26–37. doi:10.22389/0016-7126-2025-1016-2-26-37. [Google Scholar] [CrossRef]
28. Musikhin IA, Opritova OA, Taranenko SV. Technology of scenario-based spatial analysis: planning regional economic development (on the example of Novosibirsk region). Geod Cartogr. 2023;1001(11):18–30. doi:10.22389/0016-7126-2023-1001-11-18-30. [Google Scholar] [CrossRef]
29. Moradi B, Akbari R, Taghavi SR, Fardad F, Esmailzadeh A, Ahmadi MZ, et al. A scenario-based spatial multi-criteria decision-making system for urban environment quality assessment: case study of Tehran. Land. 2023;12(9):1659. doi:10.3390/land12091659. [Google Scholar] [CrossRef]
30. Gurram MK, Bulusu LD, Kinthada NR. Urban environmental quality assessment at ward level using AHP based GIS multi-criteria modeling—a study on Hyderabad City. India Asian J Geoinform. 2015;15(3):16–29. [Google Scholar]
31. Dehimi S. The use of new techniques in spatial modeling and analysis of urban quality of life: multiple-criteria decision analysis and GIS. GeoJ Tour Geosites. 2021;35(2):355–63. doi:10.30892/gtg.35213-659. [Google Scholar] [CrossRef]
32. Fabregat A, Vernet A, Vernet M, Vázquez L, Ferré JA. Using machine learning to estimate the impact of different modes of transport and traffic restriction strategies on urban air quality. Urban Clim. 2022;45(2):101284. doi:10.1016/j.uclim.2022.101284. [Google Scholar] [CrossRef]
33. Carbonara S, Faustoferri M, Stefano D. Real estate values and urban quality: a multiple linear regression model for defining an urban quality index. Sustainability. 2021;13(24):13635. doi:10.3390/su132413635. [Google Scholar] [CrossRef]
34. Srdjevic B, Srdjevic Z, Reynolds KM, Lakicevic M, Zdero S. Using analytic hierarchy process and best-worst method in group evaluation of urban park quality. Forests. 2022;13(2):290. doi:10.3390/f13020290. [Google Scholar] [CrossRef]
35. Shao Q, Weng SS, Liou JJH, Lo HW, Jiang H. Developing a sustainable urban-environmental quality evaluation system in China based on a hybrid model. Int J Environ Res Public Health. 2019;16(8):1434. doi:10.3390/ijerph16081434. [Google Scholar] [PubMed] [CrossRef]
36. Taherdoost H, Madanchian M. Analytic network process (ANP) method: a comprehensive review of applications, advantages, and limitations. J Data Sci Intell Syst. 2023;1(1):12–8. doi:10.47852/bonviewjdsis3202885. [Google Scholar] [CrossRef]
37. Liu L, Wu J. Scenario analysis in urban ecosystem services research: progress, prospects, and implications for urban planning and management. Landsc Urban Plan. 2022;224(6):104433. doi:10.1016/j.landurbplan.2022.104433. [Google Scholar] [CrossRef]
38. Zhao C, Weng Q, He Z. Spatiotemporal analysis of underlying factors in urban transformations: quantifying the importance of urban plan intentions in the Austin Metropolitan Area. Texas Land Use Policy. 2025;149(8):107415. doi:10.1016/j.landusepol.2024.107415. [Google Scholar] [CrossRef]
39. Cai Z, Wang B, Cong C, Cvetkovic V. Spatial dynamic modelling for urban scenario planning: a case study of Nanjing. China Environ Plan B Urban Anal City Sci. 2020;47(8):1380–96. doi:10.1177/2399808320934818. [Google Scholar] [CrossRef]
Cite This Article
 Copyright © 2025 The Author(s). Published by Tech Science Press.
This work is licensed under a Creative Commons Attribution 4.0 International License , which permits unrestricted use, distribution, and reproduction in any medium, provided the original work is properly cited.
 Downloads
 Citation Tools