
 Submit a Paper
 Propose a Special lssue
 Open Access
ARTICLE
Molecular characterization of sweet potato (Ipomoea batatas [L.] Lam) germplasms for desirable traits by using simple sequence repeats markers
1 Tuber Crop Research Centre, Bangladesh Agricultural Research Institute, Gazipur, 1701, Bangladesh
2 Department of Crop Science, Faculty of Agriculture, Universiti Putra Malaysia, UPM, Kuala Lumpur, 43400, Malaysia
3 Plant Genetic Resources Centre, Bangladesh Agricultural Research Institute, Gazipur, 1701, Bangladesh
4 Department of Agriculture Technology, Faculty of Agriculture, Universiti Putra Malaysia, UPM, Kuala Lumpur, 43400, Malaysia
5 Department of Crop Science, Faculty of Agriculture, Universiti Putra Malaysia, UPM, Kuala Lumpur, 43400, Malaysia
6 Regional Agricultural Research Station, Bangladesh Agricultural Research Institute, Cumilla, 3500, Bangladesh
7 Department of Biology, College of Science, Taif University, Taif, 21944, Saudi Arabia
8 Department of Agronomy, Bidhan Chandra Krishi Viswavidyalaya, Nadia, WB, 741252, India
9 Division of Agronomy, Bangladesh Wheat and Maize Research Institute, Dinajpur, 5200, Bangladesh
* Corresponding Authors: Abdul Shukor Juraimi, ; Akbar Hossain,
BIOCELL 2023, 47(1), 227-237. https://doi.org/10.32604/biocell.2023.025135
Received 23 June 2022; Accepted 19 August 2022; Issue published 26 September 2022
 View Full Text
 Download PDF
Abstract
Every breeding program that aims to create new and improved cultivars with desired traits mostly relies on information related to genetic diversity. Therefore, molecular characterization of germplasms is important to obtain target cultivars with desirable traits. Sweet potato [Ipomoea batatas (L.) Lam] is widely considered the world’s most important crop, with great diversity in morphological and phenotypic traits. The genetic diversity of 20 sweet potato germplasms originating from Bangladesh, CIP, Philippines, Taiwan, and Malaysia were compared, which was accomplished by genetic diversity analysis by exploring 20 microsatellite DNA markers for germplasm characterization and utilization. This information was effective in differentiating or clustering the sweet potato genotypes. A total of 64 alleles were generated using the 20 primers throughout the 20 germplasm samples, with locus IBS97 having the highest number of alleles (5), whereas locus IbU33 had the fewest alleles (2). The alleles varied in size from 105 (IbU31) to 213 base pairs (IBS34). The Polymorphism Information Content (PIC) values for the loci IbL46 and IBS97 varied from 0.445 to 0.730. IBS97 has the highest number of effective alleles (3.704), compared to an average of 2.520. The average Shannon’s diversity index (H) was 1.003, ranging from 0.673 in IbU3 to 1.432 in IBS97. The value of gene flow (Nm) varied between 0.000 and 0.005, with an average of 0.003, whereas genetic differentiation (FST-values) ranged between 0.901 and 1.000. The sweet potato germplasm included in this study had a broad genetic base. SP1 vs. SP9 and SP12 vs. SP18 germplasm pairings had the greatest genetic distance (GD = 0.965), while SP1 vs. SP2 germplasm couples had the least genetic diversity (GD = 0.093). Twenty genotypes were classified into two groups in the UPGMA dendrogram, with 16 genotypes classified as group “A” and the remaining four genotypes, SP10, SP18, SP19, and SP20, classified as group “B.” According to cluster analysis, the anticipated heterozygosity (gene diversity) of Nei (1973) was 0.591 on average. In summary, SSR markers successfully evaluated the genetic relationships among the sweet potato accessions used and generated a high level of polymorphism. The results of the present study will be useful for the management of germplasm, improvement of the current breeding strategies, and the release of new cultivars as varieties.Keywords
Sweet potato (Ipomoea batatas L.), a hexaploid crop of the Convolvulaceae family (2n = 6x = 90), is the world’s sixth most significant food crop after rice, wheat, potatoes, maize, and cassava (CIP, 2018) and China accounts for more than 70% of global production (Wadl et al., 2018). A substantial source of carbohydrates, vitamins A (carotenoids-orange-fleshed type), C, B1, B2 (riboflavin), B3, B6, E, and minerals such as potassium, copper, manganese, and iron; it is also a good source of fiber (Wang et al., 2016). Sweet potatoes may also be used for animal feed, starch extraction, alcohol, and biofuel. Many poor nations might benefit from the high concentration of β-carotene in these orange-fleshed sweet potatoes, which could help avoid blindness and maternal mortality caused by vitamin A insufficiency (Meng et al., 2021).
The evolving climate conditions and the staggering expansion of the world population together represent pressing challenges for agriculture. Sweet potatoes are cultivated in diverse ways across the globe, with a wide range of phenotypic differences. This diversity provides a valuable source for potentially useful traits and allows plant breeders and farmers to adapt the crop to heterogeneous and changing environments (Palumbo et al., 2017). Due to its high tolerance for a broad range of environmental circumstances, this crop is particularly resistant to climate change. It is a key crop for food security, and it is grown in more than 100 underdeveloped nations worldwide (Selaocoe et al., 2019).
One of the main obstacles to understanding sweet potato dispersal dynamics throughout the world is probably the genetics of this hexaploid species (2n = 6x = 90) (Wang et al., 2011), which severely complicates any genomic approach. In particular, sweet potato is an allohexaploid species (AABBBB), most likely derived from the interspecific hybridization between a diploid and tetraploid species followed by chromosomal doubling (Gao et al., 2011; Wu et al., 2018). As a consequence, its inheritance model is admixed, including both disomic (AA) and tetrasomic (BBBB) pairings. On the other hand, this polyploidy could represent an important source of genetic diversity (Soltis and Soltis, 1999). The vast genetic diversity that characterizes the sweet potato germplasm is also due to sexual reproduction (i.e., genetic segregation and recombination), asexual propagation (i.e., fixation of specific genetic combinations), and the exchange and introduction of plants from all over the world (Ngailo et al., 2016; Feng et al., 2020).
Genetic diversity is essential for future research and the development of cultivars with the desired properties. To deal with the genetic development of sweet potato, it is necessary to understand the genetic diversity in examined germplasm. To increase the genetic diversity of a breeding population and the number of heterozygous offspring, it is necessary to pick parents with different ancestries (Wellmann and Bennewitz, 2019). Owing to the complex genome of the species, information on the genetic diversity of sweet potato germplasm is still insufficient, which hinders the development of new cultivars (Su et al., 2017). Identifying the genetic diversity, structure, and background of sweet potato accessions is essential for developing efficient breeding techniques (Monden et al., 2015). To ascertain the genetic diversity of sweet potatoes, both morphological and molecular markers have been used (Nair et al., 2017). Molecular markers have the benefit of being more trustworthy and not being impacted by environmental circumstances; besides, it is possible to do DNA testing at any stage of plant development (Rodriguez-Bonilla et al., 2014). In addition to biochemical-based markers, DNA-based markers such as random amplified polymorphic DNA (RAPD), amplified fragment length polymorphism (AFLP), microsatellites, and single nucleotide polymorphisms can also be used (Rahajeng and Rahayuningsih, 2017). Each approach has its own set of benefits, limits, and applications (Farooq and Azam, 2002).
In recent years, simple sequence repeat (SSR) markers or microsatellites have become the most widely used molecular marker technologies for the study of both animals and plants (Shih et al., 2002; Veasey et al., 2008; Zhang et al., 2001; Karuri et al., 2010; Yada et al., 2010; Li et al., 2009). Multi-allelic, highly polymorphic, highly reproducible, co-dominant SSR markers give extensive genetic information with good genome coverage (Kawuki et al., 2009; Sree et al., 2010). SSR markers are inexpensive and adaptable to most breeding protocols, making them ideal for public breeding programs that cannot afford expensive diversity evaluation approaches (Turyagyenda et al., 2012). The purpose of this study was to employ the SSR markers to characterize the genetic diversity of sweet potato germplasm acquired from Bangladesh and Malaysia and determine the phylogenetic relationships among the twenty germplasm.
Twenty sweet potato genotypes employed in this study were obtained from the Tuber Crops Research Center (TCRC) of the Bangladesh Agricultural Research Institute, Gazipur, Joydebpur 1701, Bangladesh, and Cameron Highlands in Malaysia (Table 1).

Extraction of genomic DNA from a plant sample
Young, fresh, and disease-free leaves were selected for DNA extraction in the Molecular Biology lab at the University Putra Malaysia, Malaysia. SSR markers were utilized to examine molecular diversity. The genomic DNA was isolated from a bulk of 3-week-old seedling leaf tissues taken from five plants from each germplasm (Rahman et al., 2011; Molla et al., 2015, 2017) using the cetyltrimethylammonium bromide technique (Kim and Hamada, 2005) with different modifications. The leaf samples were dipped in liquid nitrogen, chopped into tiny pieces, and digested using a homogenization buffer (Tris, 50 mM; EDTA, 25 mM; NaCl, 300 mM; SDS, 1%; deionized water). Then, a mixture of phenol, chloroform, and isoamyl alcohol (25:24:1) was added as extraction solvent and heated to 65°C for 30 min before precipitating with ice-cold, pure isopropyl alcohol. The precipitate was purified with 100% ethanol (also containing sodium acetate, 3 M) and 70% ethanol successively. Microfuge tubes containing 1.5 mL of TE buffer were used to dissolve each DNA sample. After completely dissolving the DNA pellet in TE buffer, 4 µL RNaseA (10 mg/mL) was added to the isolated DNA and incubated at 37°C for 30 min (Tilahun et al., 2013). Finally, the DNA sample was kept at −20°C.
DNA concentration quantification and optimization
The presence of genomic DNA was qualitatively verified on a 1% agarose gel. The band images were photographed and visualized under UV light using a photo documentation approach (UV Transilluminator, Uvitec, Unit 3.05, St John’s Innovation Centre, Cowley Rd, Cambridge CB4 OWS, UK). All the DNA samples used in this research were found to be of excellent quality. A UV spectrophotometer (Thermo Fisher Scientific, Waltham, Massachusetts, USA) was set to 260 nm, and a spectrophotometer was used to determine the quantity of genomic DNA (NanoDrop). Electrophoresis on a 1% agarose gel in Tris-acetate ethylenediamine tetraacetate buffer was used to validate the quality. Sumon et al. (2014) proposed a formula for determining the initial DNA concentrations of each genotype.
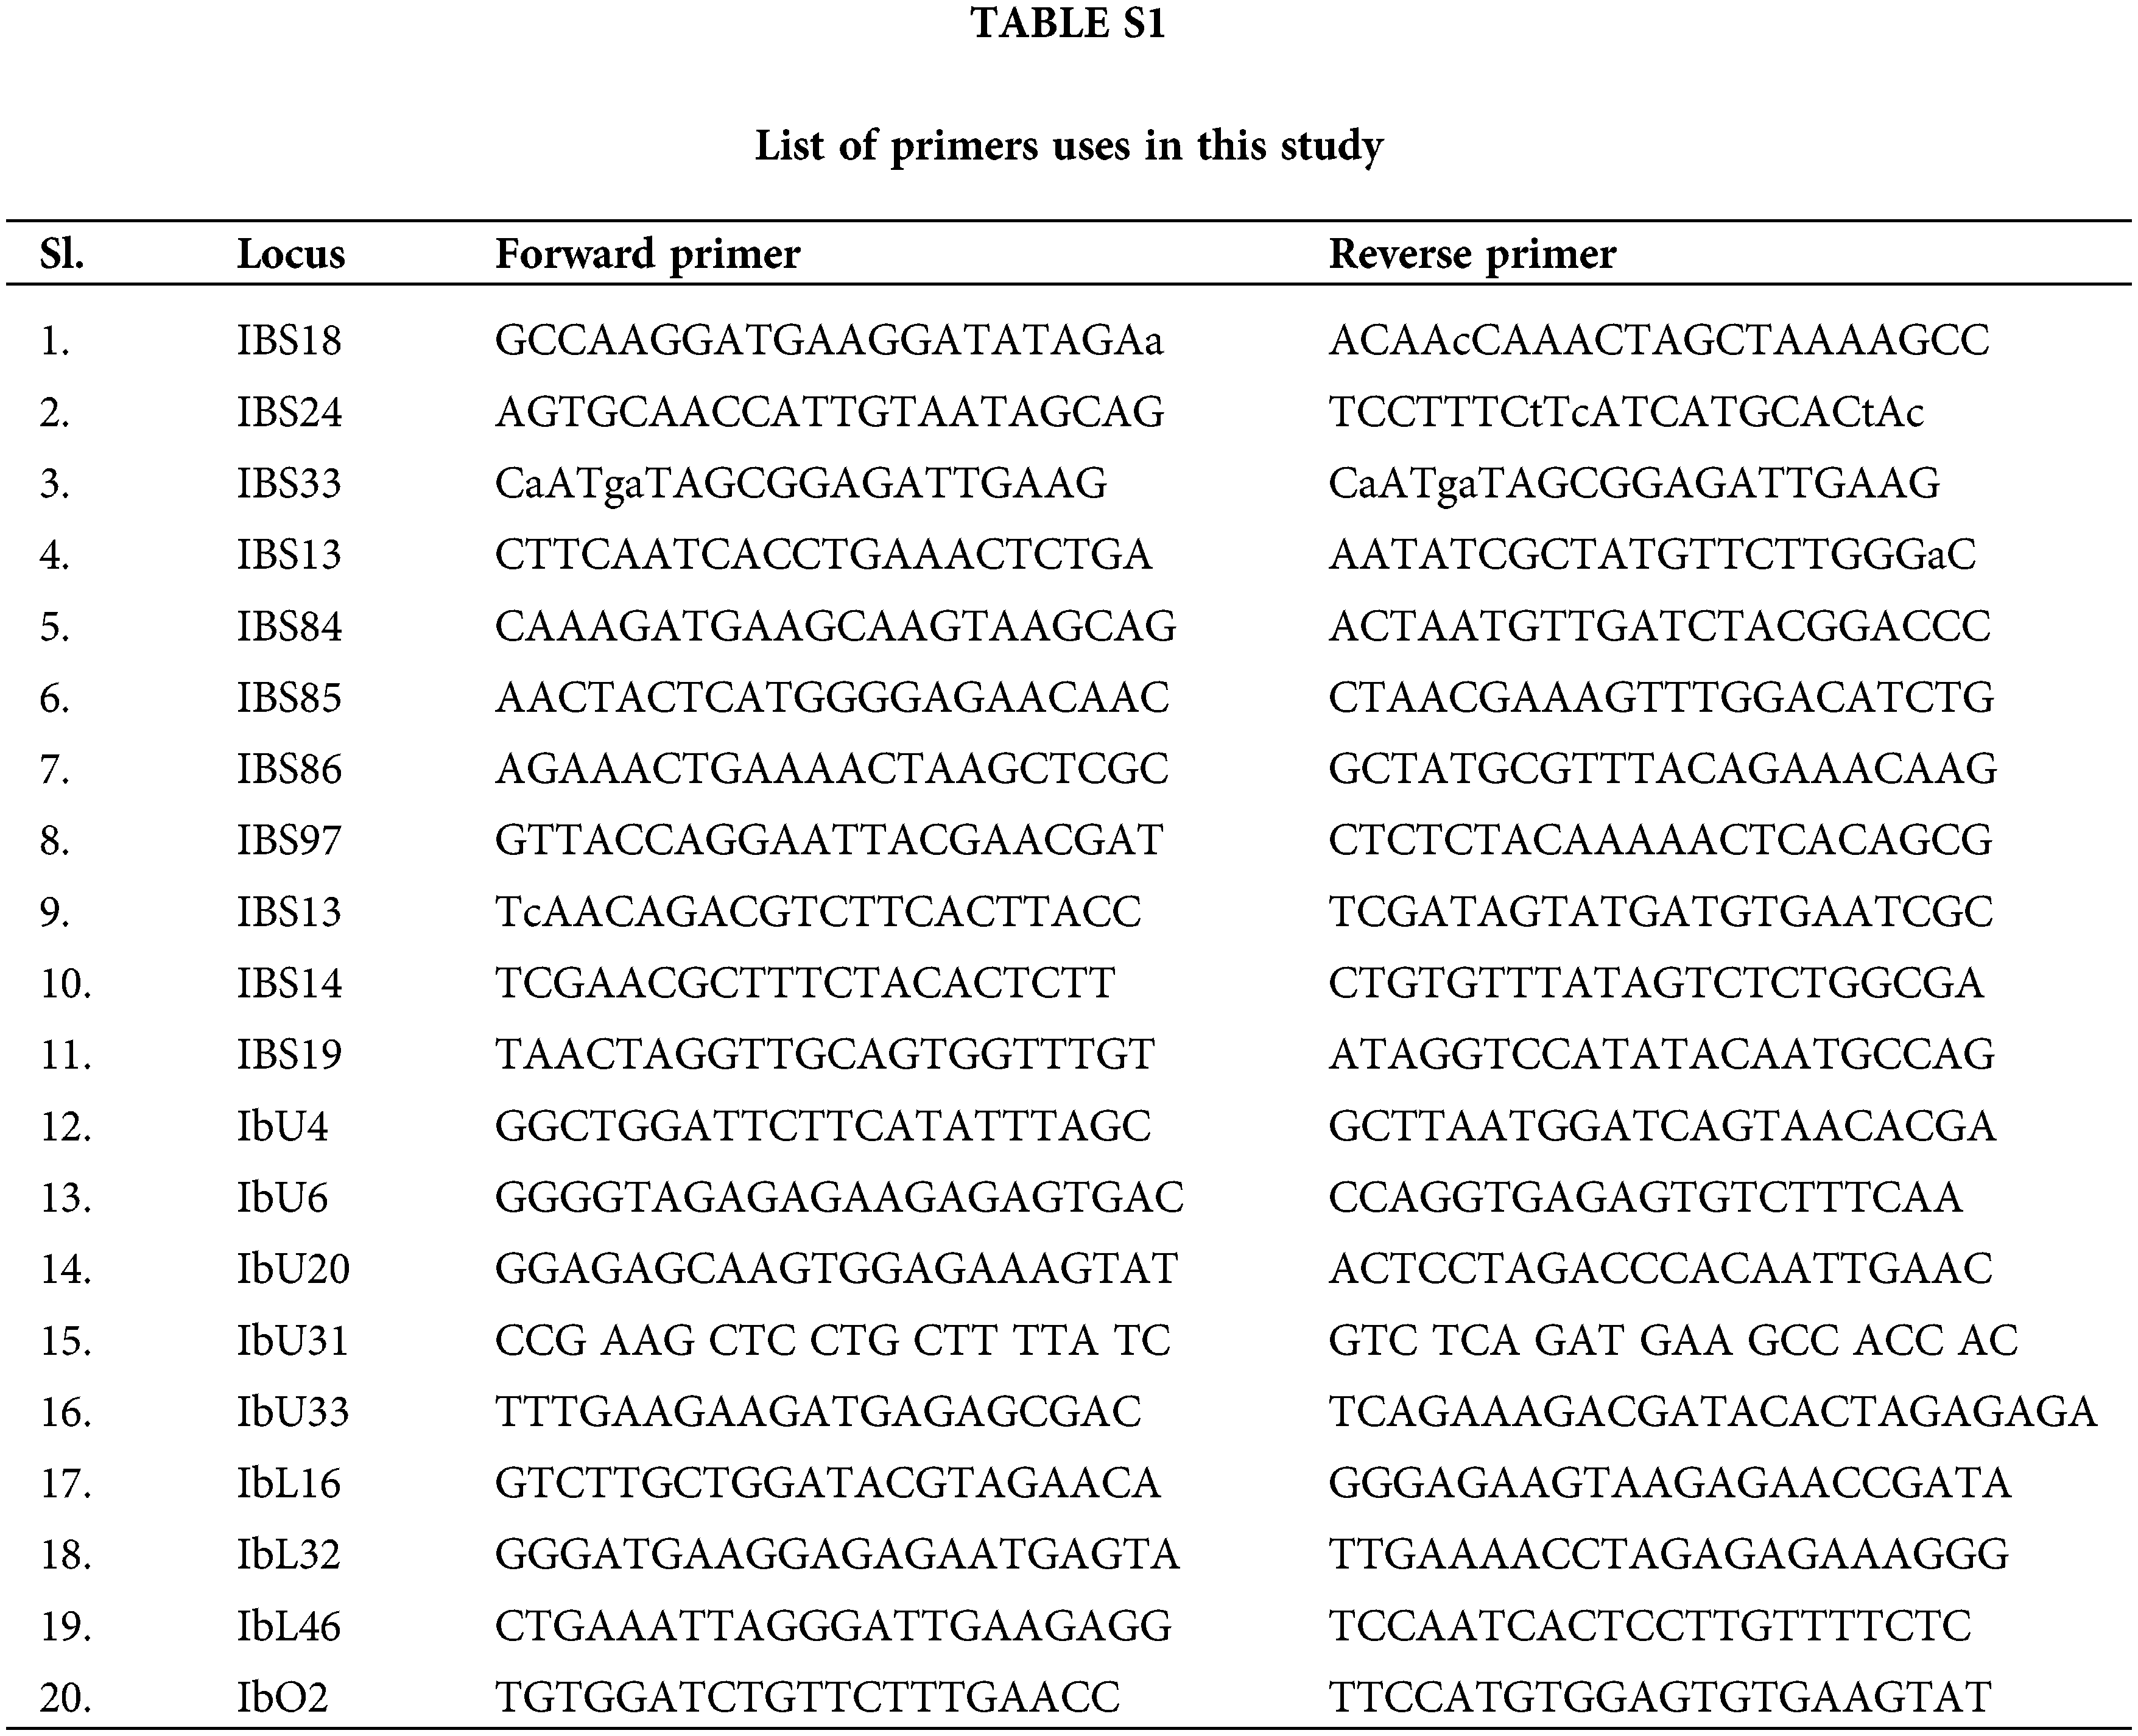
Selection of microsatellite/simple sequence repeat primers
Twenty SSR primer pairs previously stated in the literature (Koussao et al., 2014) were used for microsatellite analysis (Table S1). All 20 primer combinations exhibited better responsiveness with clearly and predicted expanded product sizes.
Amplification and standardization of polymerase chain reaction (PCR)
A total volume of 25 µL for PCR reaction contained 12.5 µL of Accuris Taq Master Mix Red, 1 µL each of forward and reverse primers (10 M), and 1 µL of template DNA. The mixtures were prepared at 0°C, then subjected to thermal cycling and cooled. PCR amplification of SSR loci was carried out in the Biometra (TPersonal) Thermal Cycler (Cole-Parmer Instrument Company Ltd., St Neots Cambridge shire PE19 8YX, UK), with a program of an initial denaturation step of 1 min and 30 s at 95°C, followed by 34 cycles of 15 s at 95°C, 15 s at 51°C−59°C and 30 s at 72°C, and a final elongation step at 72°C. The PCR products were stored at 4°C before analysis.
Visualization of polymerase chain reaction results via gel electrophoresis
PCR products were electrophoresed on a 2% agarose gel in 100 mL 1X TAE buffer with 2 g agarose (Vivantis, USA). After bringing the temperature of the solution to room temperature, add 3 µl Vi-Safe Red Gel Stain (Vivantis, USA) (Manufacturer by Vivantis Technologies Sdn. Bhd., Revongen Corporation Center, Level 17, Top Glove Tower, No. 16, Persiaran, Setia Dagang, Setia Alam, Seksyen U13, 40170 Shah Alam, Selangor Darul Ehsan, Malaysia). The Triple Wide Mini-Vertical Electrophoresis System was used for electrophoresis (BIO RAD Scientific, 1000 Alfred Nobel Drive, Hercules, California 94547, USA). The gel was electrophoresed for 90 min at 85 V. Finally, the stained gel was immersed for 5 min in deionized water. Individual bands were viewed and graded for analysis using the Gel Doc System (BIO RAD Scientific, USA) (Sumon et al., 2014).
Microsatellite data matrix preparation for analysis
Co-dominant microsatellite markers make it possible to identify homozygous and heterozygous genotypes in individual plants. Individual alleles (bands) at microsatellite loci were meticulously analyzed, and a single data matrix was constructed for all loci. Generic distance (Nei, 1972) created UPGMA dendrogram was used to calculate statistics of genetic variation, and cluster analyses were done using the POPGENE software (Version 1.31) (Yeh et al., 1999). The PIC value was computed as PIC = 1-f2ij, where fij is the frequency of the ith allele for the jth SSR locus and f2ij is the frequency of the ith allele for the jth SSR locus (Anderson et al., 1993). PIC values represent a person’s ability to discriminate. Many factors, including allele density and population density, impacted these results. Allelic lengths were calculated using the program DNA FRAG version 3.03 (Nash, 1991).
The investigation employed twenty SSR primers because of their repeatable and polymorphic DNA amplification patterns across genotypes. Fig. 1 depicts eight common SSR profiles.

Figure 1: Microsatellite profiles of 20 sweet potato genotypes at loci IbS18 (A), IbS24 (B), IbO2 (C), IbS97 (D), IbU20 (E), IbU6 (F), IbS24 (G), and IbU4 (H). M: molecular wt. marker (100 bp DNA ladder). Lane 01: SP-1, Lane 02: SP-2, Lane 03: SP-3, Lane 04: SP-4, Lane 05: SP-5, Lane 06: SP-6, Lane 07: SP-7, Lane 08: SP-8, Lane 09: SP-9, Lane 10: SP-10, Lane 11: SP-11, Lane 12: SP-12, Lane 13: SP-13, Lane 14: SP-14, Lane 15: SP-15, Lane 16: SP-16, Lane 17: SP-17, Lane 18: SP-18, Lane 19: SP-19, and Lane 20: SP-20.
Using the 20 microsatellite markers, a total of 64 alleles with an average number of 3.2 alleles per locus were found in this study. Of the twenty SSR markers, five were detected between four and five alleles, while fifteen were detected between two and three alleles. The number of alleles found ranged from two (IbU33) to five (IbU33) (IBS97). For the loci IbU31 and IBS34, the allele sizes ranged from 105 to 213 bp (Table 2).

All SSRs were determined as the percentage of polymorphic loci (PPL 100) and were polymorphic across sweet potato genotypes and hence valuable for determining genotypic variation (i.e., PIC values different from zero). The PIC values for SSRs varied between 0.445 and 0.730, with a mean of 0.583 (Table 2). Eleven of these SSRs were highly informative (PIC > 0.6), with IBS97 (0.730) having the highest PIC value, followed by IbO2 (0.675), IBS18 (0.645), and IBS33 (0.645).
IBS97 had the most effective number of alleles (3.704), with an average of 2.520. (Table 3). Shannon’s information index (I) was 1.003 on average, with values ranging from 0.673 in IbU3 to 1.432 in IBS97 (Table 3). Gene flow (Nm) values ranged from 0.000 to 0.005 with an average of 0.003 while genetic differentiation (Fst) values varied from 0.901 to 1.000 with an average of 0.970 (Table 3). The average value for Nei’s predicted heterozygosity (gene diversity) was 0.591, with the greatest value (0.730) at the locus IBS97, followed by 0.675 at the locus IbO2 (Table 3).

Nei’s genetic distance between the genotypes
Based on these results, SSR markers may be used to estimate genetic distances between genotypes. Among 190 pairs, Nei’s genetic distance ranged from 0.093 to 0.965, resulting from a permutation combination of 20 sweet potato genotypes (Table 4). SP1 vs. SP9 and SP12 vs. SP18 genotype pairs had the greatest genetic distance (0.965). The smallest genetic distance (0.093) was found between SP1 and SP2 (Table 4).

Genetic distance among the genotypes
The UPGMA dendrogram was constructed using genetic dissimilarity SSR markers data that were related to the dissimilarity coefficient between genotypes. The genotypes tested were divided into two groups, with 16 genotypes in group “A” and four genotypes in group “B,” namely SP10, SP18, SP19, and SP20 (Fig. 2).

Figure 2: UPGMA cluster analysis based on Nei’s (1972) genetic distance, showing diversity and relationship among 20 sweet potato genotypes.
Despite this, cluster “A” split into two sub-clusters, “A1” and “A2.” SP1 and SP2 were clustered together in sub-clusters “A1.a1,” while SP3 and SP4 were grouped together in sub-clusters “A1.a2.” Sub-cluster “A2” then split into two more sub-clusters, “A2.a3” and “A2.a4”, with sub-clusters “A2.a3” dividing into two more sub-clusters with genotype SP8 assembling exclusively in sub-clusters “A2.a3.a5”. Sub-clusters “A2.4” were split into two sub-clusters, and genotype SP13 was only found in sub-clusters “A2.a4.a7.” Sub-clusters A2.a4.a6.a8 and A2.a4.a8.a9 contained SP-11, SP-14, SP-12, SP-15, SP-16, and SP-17, while sub-clusters A2.a4.a6.a8 and A2.a4.a8.a9 included SP-11, SP-14, SP-12, SP-15, SP-16, and SP-17 (Fig. 2).
SSR markers have been widely employed to characterize genetic diversity in a range of economically important crops, including sweet potatoes. Several previous studies on the sweet potato have used SSR markers, which have shown significant population diversity as well as aided in the detection of duplicates (Koussao et al., 2014; Karuri et al., 2010). As a consequence, they proved to be the most effective tool for investigating genetic variation. Sweet potato is a hexaploid crop that exhibits a range of band patterns. Therefore, this intra-variety variability may be related to the high somatic mutation reported in this crop (Hernandez et al., 1964). Intra-varietal polymorphism related to vegetative crop species has also been reported for potato (Solanum tuberosum) by Quiroz et al. (1990) and cassava (M. esculenta) by Colombo et al. (2000) and Sambatti et al. (2001). The 100% PPL exhibited a significant amount of polymorphism in this research; an allele range of two to five alleles per SSR marker imparts the SSR markers’ discriminating power on sweet potatoes (Gichuru et al., 2006; Tumwegamire et al., 2011). This is in line with the findings of Yada et al. (2010). Buteler et al. (1999) found a high polymorphism range of three to 10 alleles. Somé et al. (2014) found one to eight alleles as well. Tumwegamire et al. (2011) found a range of two to eleven alleles. A lower amount of polymorphisms “seventeen” has also been documented, ranging from one to four alleles per SSR locus (Hwang et al., 2002). The variances might be explained using various SSR primers, sweet potato genotypes, and annealing temperatures. The number of SSR primers used in diversified experiments may account for some observed discrepancies. Aswathy et al. (2017) determined the genetic diversity of 40 sweet potato accessions from ICAR-CTCRI and CIP using 10 simple sequence repeat (SSR) primers.
These SSR primersdescribe the degree of variation in a population and how that variation is distributed across alleles at an investigated locus. Each genotype was evaluated, and expected heterozygosity (He, average 0.606) values for each SSR locus were always greater than actual heterozygosity (Ho); this indicated homozygous individuals in the population samples. Because of the breeding nature of sweet potatoes, where the fraction of heterozygous loci is anticipated to be large, higher levels of heterozygosity are expected. Self-incompatibility in flowers has also been observed to cause allogamy, which increases genetic heterozygosity (Thompson et al., 1997).
Polymorphism information content (PIC)
The discriminating potential of a marker is quantified by its PIC value (Jia et al., 2009). A PIC value larger than 0.5 is considered high by Heng-Sheng et al. (2012), and any marker with such a value may be useful in genetic diversity research. Herein, the PIC value was more than 0.5 for all 17 markers that indicated amplification, and the findings, which ranged from 0.445 to 0.730 with a mean of 0.583, were fairly high, indicating that the SSR markers used exhibited a high degree of discrimination. Primer IBS97 exhibited the greatest Nei’s genetic diversity in the present investigation, while IbL46 had the lowest genetic diversity of all the markers (Table 4). Koussao et al. (2014) identified a higher average PIC value for characterizing sweet potato germplasm using 30 SSR markers. The average PIC value of 12 SSR markers further demonstrated the enormous potential of polymorphism. As an indicator, heterozygosity may be used to assess genetic variation.
Nei’s genetic distance and phylogenetic dendrogram
The higher gene diversity (Nei’s projected heterozygosity) observed in this research might be a result of the enhanced genotype variety utilized. The majority of the genotypes investigated were of different geographic origins; therefore, the study results revealed a considerably higher level of genetic differentiation and a low level of gene flow values in 20 sweet potato genotypes, indicating variation among the genotypes. Palumbo et al. (2019) suggested that the combination of two different characterization methods, genetic markers, and agronomic traits, was effective in differentiating or clustering the sweet potato genotypes, in agreement with their geographical origin or phenotypic descriptors.
Based on Nei’s (1972) genetic distance, the analysis of molecular data revealed varying levels of genetic diversity among 20 sweet potato genotypes. The genotypes had genetic distances ranging from 0.093 to 0.965, indicating the substantial genetic heterogeneity of the sweet potato genotypes investigated (Table 4). Higher genetic distance scores between genotype pairs are associated with different genetic backgrounds. In the case of reverse genetic background, however, the lowest values may be discovered. This variation in genetic distance values could be crucial for improving sweet potato genetic resources and ensuring their long-term usage for genetic improvement. The UPGMA dendrogram is based on SSR marker data, which refers to the dissimilarity coefficient between germplasms. Based on cluster analysis, the total genotypes were divided into two main groups, A and B. Cluster B was subdivided into a total of 12 sub-groups. Upon subsequent separation, the genotypes had a distinct status in the dendrogram because of the possible effect of morphological traits and geographical sources. The origin and genetical status of the genotypes used in the study were different. For instance, closely related genotypes SP-6, SP-7, SP-8, and SP-9 were originated from a similar source like CIP (Table 1) and grouped together in sub-cluster A2.a3 (Fig. 2). However, the genotypes SP-1, SP-9, SP-12, and SP-18 grouped in different sub-cluster (A1.a1, A2.a3.a4, A2.a4.a8.a9, and B1, respectively) in the dendrogram (Fig. 2), these genotypes were collected from different sources such as Philippines and CIP (Table 1). Palumbo et al. (2019) found that the combination of these two approaches was very effective in differentiating or clustering the different clonal genotypes of sweet potato, as expected by their geographical origin or phenotypic characteristics when considering both morphological, qualitative, and genetic-molecular data. The high level of genetic diversity observed in sweet potato accessions may be a result of spontaneous mutations, which are common in this species, as well as the selection, regional, and environmental factors, making populations of this species a significant genetic resource (He et al., 2006).
Molecular assessment methodologies revealed a moderate to a high degree of genetic variation among the 20 sweet potato germplasm from Bangladesh, CIP, Philippines, Taiwan, and Malaysia in this study. A total of 20 SSR markers were examined, and the results were utilized to select cultivars for future research. To produce a valuable outcome, newer cultivars are needed, which may be obtained by introducing or collecting new species. The effort of this study will offer fresh insights into the categorization of sweet potatoes, as well as aid in the genetic research and breeding of this root crop to improve the existing germplasm.
Acknowledgement: We thank the National Agricultural Technology Program II Project (NATP-2), BARC Component Bangladesh Agricultural Research Council, Farmgate, Dhaka-1215, and Bangladesh Agricultural Research Institute, Joydebpur, Gazipur for providing the fellowship to conduct research. We express gratitude to all faculty members and staff at the Department of Crop Science, Faculty of Agriculture, Universiti Putra Malaysia. The authors would like to cover their truthful gratitude to the Researchers Supporting Project No. (TURSP-2020/39), Taif University, Taif, Saudi Arabia.
Authors’ Contribution: The authors confirm their contribution to the article as follows: KAMMR conducted the experiment, statistical analysis, and original draft writing. MRM, MAMH, ZBS, SS, AG, BB and AH designed the idea and helped with manuscript drafting and editing. All activities took place under the guidance and assistance of ASJ. All authors contributed to the experiment and article and finally approved the submitted version.
Availability of Data and Materials: The datasets generated during and/or analysed during the current study are available from the corresponding author on reasonable request.
Data Availability Statement: The data that support the findings of this study are available from the corresponding authors upon reasonable request.
Ethics Approval: Not applicable.
Funding Statement: The work was financially supported by National Agricultural Technology Program-II Project (NATP-2), BARC Component Bangladesh Agricultural Research Council, Farmgate, Dhaka-1215, and Bangladesh Agricultural Research Institute (BARI), Joydebpur, Gazipur 1701. The work was partially supported by the Taif University Researchers Supporting Project No. (TURSP-2020/39), Taif University, Taif, Saudi Arabia.
Conflicts of Interest: The authors declare that they have no conflicts of interest to report regarding the present study.
References
Anderson JA, Churchill GA, Autrique JE, Tanksley SD, Sorrels ME (1993). Optimizing parental selection for genetic linkage maps. Genome 36: 181–186. DOI 10.1139/g93-024. [Google Scholar] [CrossRef]
Buteler M, Jarret R, La Bonte D (1999). Sequence characterization microsatellites in diploid and polyploidy ipomoeas. Theoretical and Applied Genetics 99: 123–132. DOI 10.1007/s001220051216. [Google Scholar] [CrossRef]
CIP (International Potato Center) (2018). Sweet potato facts. Lima, Peru: International Potato Center. [Google Scholar]
Colombo C, Second G, Charrier A (2000). Genetic relatedness between Cassava (Manihot esculenta Crantz) and Manihot flabellifolia and M. peruviana based on RAPD and AFLP markers. Genetic and Molecular Biology 23: 417–423. DOI 10.1590/S1415-47572000000200030. [Google Scholar] [CrossRef]
Farooq S, Azam F (2002). Molecular markers in plant breeding-I: Concepts and characterization. Pakistan Journal of Biological Sciences 5: 1135–1140. DOI 10.3923/pjbs.2002.1135.1140. [Google Scholar] [CrossRef]
Feng J, Zhao S, Li M, Zhang C, Qu H, Li Q, Li J, Lin Y, Pu Z (2020). Genome-wide genetic diversity detection and population structure analysis in sweetpotato (Ipomoea batatas) using RAD-seq. Genomics 112: 1978–1987. DOI 10.1016/j.ygeno.2019.11.010. [Google Scholar] [CrossRef]
Gao M, Ashu GM, Stewart L, Akwe WA, Njiti V, Barnes S (2011). Wx intron variations support an allohexaploid origin of the sweetpotato [Ipomoea batatas (L.) Lam]. Euphytica 177: 111–133. DOI 10.1007/s10681-010-0275-z. [Google Scholar] [CrossRef]
Gichuru V, Aritua V, Lubega GW, Edema R, Adipula E, Rubaihayo PR (2006). A preliminary analysis of diversity among East African sweet potato landraces using morphological and simple sequence repeats (SSR) markers. Acta Horticulturae 703: 159–164. DOI 10.17660/ActaHortic.2006.703.18. [Google Scholar] [CrossRef]
He X, Liu Q, Ishiki K, Zhai H, Wang Y (2006). Genetic diversity and genetic relationships among Chinese sweetpotato landraces revealed by RAPD and AFLP markers. Breeding Science 56: 201–207. DOI 10.1270/jsbbs.56.201. [Google Scholar] [CrossRef]
He X, Liu Q, Ishiki K, Zhai H, Wang Y (2007). SSR analysis of genetic diversity and relationships among sweet potato (Ipomoea batatas L.) landraces in China. Plant Genetic Resources Newsletter 150: 35–41. [Google Scholar]
Heng-Sheng L, Chih-Yun C, Song-Bin C, Gwo-Ing L, Chang-Sheng K (2012). Genetic diversity in the foxtail millet (Setaria italic L.) germplasm as determined by agronomic traits and microsatellite markers. Australian Journal of Crop Science 6: 342–349. [Google Scholar]
Hernandez TP, Hernandez T, Miller JC (1964). Frequency of somatic mutations in several sweet potato varieties. Journal of the American Society of Horticultural Science 85: 430–433. [Google Scholar]
Hu J, Nakatani M, Lalusin AG, Kuranouchi T, Fujimura T (2003). Genetic analysis of sweet potato and wild relatives using inter-simple sequence repeats (ISSRs). Breeding Science 53: 297–304. [Google Scholar]
Hwang SY, Tseng YT, Lo HF (2002). Application of simple sequence repeats in determining the genetic relationships of cultivars used in sweet potato poly-cross breeding in Taiwan. Scientia Horticulturae 93: 215–224. DOI 10.1016/S0304-4238(01)00343-0. [Google Scholar] [CrossRef]
Jarret RL, Austin DF (1994). Genetic diversity and systematic relationships in sweet potato [Ipomoea batatas (L.) Lam.] and related species as revealed by RAPD analysis. Genetic Resources and Crop Evolution 41: 165–173. [Google Scholar]
Jia X, Zhang Z, Liu Y, Zhang C, Shi Y, Song Y, Wang T, Li Y (2009). Development and genetic mapping of SSR markers in foxtail millet [Sataria italica (L.) p. Beauv.]. Theoretical and Applied Genetics 118: 821–829. DOI 10.1007/s00122-008-0942-9. [Google Scholar] [CrossRef]
Kaplan DR (2001). The science of plant morphology: Definition, history, and role in modern biology. American Journal of Botany 88: 1711–1741. DOI 10.2307/3558347. [Google Scholar] [CrossRef]
Karuri HW, Ateka EM, Amata R, Nyende AB, Muigai AWT, Mwasame E, Gichuki ST (2010). Evaluating diversity among Kenyan sweet potato genotypes using morphological and SSR markers. International Journal of Agriculture and Biology 12: 33–38. DOI 10.1007/s11032-009-9264-0. [Google Scholar] [CrossRef]
Kawuki SR, Morag F, Maryke L, Liezel H, Dong-Jin K (2009). Identification, characterisation and application of single nucleotide polymorphisms for diversity assessment in cassava (Manihot esculentacrantz). Molecular Breeding 23: 669–684. DOI 10.1007/s11032-009-9264-0. [Google Scholar] [CrossRef]
Kim SH, Hamada T (2005). Rapid and reliable method of extracting DNA and RNA from sweetpotato, Ipomoea batatas (L). Lam. Biotechnology Letters 27: 1841–1845. DOI 10.1007/s10529-005-3891-2. [Google Scholar] [CrossRef]
Koussao S, Baptiste TJ, Gracen V, Asante I, Danquah EY, Ouedraogo JT, Jerome B, Vianney TM (2014). Diversity analysis of sweet potato [(Ipomoea batatas L.) Lam] germplasm from Burkina Faso using morphological and simple sequence repeats markers. African Journal of Biotechnology 13: 729–742. DOI 10.5897/AJB2013.13234. [Google Scholar] [CrossRef]
Li P, Wang Y, Sun X, Han J (2009). Using microsatellite (SSR) and morphological markers to assess the genetic diversity of 12 falcata (Medica gosativa spp. falcata) populations from Eurasia. African Journal Biotechnology 8: 2102–2108. [Google Scholar]
Meng Y, Su W, Ma Y, Liu L, Gu X et al. (2021). Assessment of genetic diversity and variety identification based on developed retrotransposon-based insertion polymorphism (RBIP) markers in sweet potato (Ipomoea batatas (L.) Lam.). Scientific Reports 11: 17116. DOI 10.1038/s41598-021-95876-w. [Google Scholar] [CrossRef]
Molla MR, Ahmed I, Rahman S, Hossain MA, Salam MA, Chowdhury MAZ, Rohman MM (2017). Genetic diversity among Muskmelon (Cucumis melo L.) germplasm in Bangladesh as revealed by microsatellite markers. African Journal of Agricultural Research 12: 3203–3213. DOI 10.5897/AJAR2017.12617. [Google Scholar] [CrossRef]
Molla MR, Rohman MM, Amiruzzaman M, Banik BR, Sultan MK (2015). Microsatellite markers for determining genetic identities and relationship among Maize hybrids and their parents. Bothalia Journal 45: 83–97. [Google Scholar]
Monden Y, Hara T, Okada Y, Jahana O, Kobayashi A, Tabuchi H, Onaga S, Tahara M (2015). Construction of a linkage map based on retrotransposon insertion polymorphisms in sweet potato via high-throughput sequencing. Breeding Science 65: 145–153. DOI 10.1270/jsbbs.65.145. [Google Scholar] [CrossRef]
Nair AG, Vidya P, Ambu V, Sreekumar J, Mohan C (2017). Genetic diversity studies in cultivated sweet potato (Ipomoea Batatas (L.) Lam) revealed by simple sequence repeat markers. International Journal of Advanced Biotechnology Research 7: 33–48. [Google Scholar]
Nair, AG., Vidya, P., Ambu, V., Sreekumar J, Mohan C. (2017). Genetic diversity studies in cultivated sweet potato (Ipomoea batatas (L.) Lam) revealed by simple sequence repeat markers. International Journal of Advanced Biotechnology Research 7: 33–48. [Google Scholar]
Nash JHE (1991). DNA-frag, version 3.03. Institute for Biological Sciences. Ottawa, Ontario, Canada: National Research Council of Canada. [Google Scholar]
Nei M (1972). Genetic distance between populations. American Naturalist 106: 283–292. [Google Scholar]
Ngailo S, Shimelis H, Sibiya J, Amelework B, Mtunda K (2016). Genetic diversity assessment of Tanzanian sweetpotato genotypes using simple sequence repeat markers. South African Journal of Botany 102: 40–45. DOI 10.1016/j.sajb.2015.08.001. [Google Scholar] [CrossRef]
Palumbo F, Galla G, Martinez-Bello L, Barcaccia G (2017). Venetian local corn (Zea mays L.) germplasm: Disclosing the genetic anatomy of old landraces suited for typical cornmeal mush production. Diversity 9: 32. DOI 10.3390/d9030032. [Google Scholar] [CrossRef]
Palumbo F, Galvao AC, Nicoletto C, Sambo P, Barcaccia G (2019). Diversity analysis of sweet potato genetic resources using morphological and qualitative traits and molecular markers. Genes 10: 840. DOI 10.3390/genes10110840. [Google Scholar] [CrossRef]
Quiroz CF, Brush SB, Douches DS, Zimmerer KS, Huestis G (1990). Biochemical and folk assessment of variability of Andean cultivated potatoes. Economic Botany 44: 254–266. DOI 10.1007/BF02860490. [Google Scholar] [CrossRef]
Rahajeng W, Rahayuningsih SA (2017). Agronomic performance, variance component, and diversity of sixty two sweet potato accessions. Biodiversitas 18: 95–100. DOI 10.13057/biodiv/d180113. [Google Scholar] [CrossRef]
Rahman S, Molla MR, Rahman MS, Mian MAK (2011). Molecular diversity analysis of Grasspea through RAPD markers. Bangladesh Journal of Agriculture 36: 59–70. [Google Scholar]
Rodriguez-Bonilla L, Cuevas HE, Montero-Rojas M, Bird-Pico F, Luciano-Rosario D, Siritunga D (2014). Assessment of genetic diversity of sweet potato in Puerto Rico. PLoS One 9: e116184. DOI 10.1371/journal.pone.0116184. [Google Scholar] [CrossRef]
Sambatti JBM, Martins PS, Ando A (2001). Folk taxonomy and evolutionary dynamics of cassava: A case study in Ubatuba, Brazil. Economic Botany 55: 93–105. DOI 10.1007/BF02864549. [Google Scholar] [CrossRef]
Selaocoe ME, Adebola P, Pillay M, Laurie SM (2019). Genetic diversity of South African sweet potato germplasm using molecular markers. Journal of Crop Improvement 33: 814–833. DOI 10.1080/15427528.2019.1671930. [Google Scholar] [CrossRef]
Shih YH, Tseng YT, Lo HF (2002). Application of simple sequence repeats in determining the genetic relationships of cultivars used in sweet potato poly-cross breeding in Taiwan. Scientia Horticulturae 93: 215–224. DOI 10.1016/S0304-4238(01)00343-0. [Google Scholar] [CrossRef]
Soltis DE, Soltis PS (1999). Polyploidy: Recurrent formation and genome evolution. Trends in Ecology & Evolution 14: 348–352. DOI 10.1016/S0169-5347(99)01638-9. [Google Scholar] [CrossRef]
Somé K, Gracen V, Asante I, Danquah EY, Ouedraogo JT, Baptiste TJ, Jerome B, Vianney TM (2014). Diversity analysis of sweet potato [Ipomoea batatas (L.) Lam] germplasm from Burkina Faso using morphological and simple sequence repeats markers. African Journal of Biotechnology 13: 729–742. DOI 10.5897/AJB2013.13234. [Google Scholar] [CrossRef]
Sree L, Santha S, Pillai V, Sree KJ (2010). Molecular genotyping of Indian cassava cultivars using SSR markers. Advances in Environmental Biology 4: 224–233. [Google Scholar]
Su W, Wang L, Lei J, Chai S, Liu Y, Yang Y, Yang X, Jiao C (2017). Genome-wide assessment of population structure and genetic diversity and development of a core germplasm set for sweet potato based on specific length amplified fragment (SLAF) sequencing. PLoS One 12: e0172066. DOI 10.1371/journal.pone.0172066. [Google Scholar] [CrossRef]
Sumon MH, Habiba U, Bhuyan SI, Haque MS, Begum SN, Hossain MD (2014). DNA fingerprinting and genetic diversity analysis of chilli germplasm using microsatellite markers. Biotechnology 13: 174–180. DOI 10.3923/biotech.2014.174.180. [Google Scholar] [CrossRef]
Thompson PG, Hong LL, Ukoskit K, Zhu S (1997). Genetic linkage of randomly amplified polymorphic DNA (RAPD) markers in sweet potato. Journal of the American Society for Horticultural Science 22: 79–82. DOI 10.21273/JASHS.122.1.79. [Google Scholar] [CrossRef]
Tilahun S, Paramaguru P, Kannan Bapu JR (2013). Genetic diversity in certain genotypes of chilli and paprika as revealed by RAPD and SSR analysis. Asian Journal of Agricultural Sciences 5: 25–31. DOI 10.19026/ajas.5.2580. [Google Scholar] [CrossRef]
Tumwegamire S, Rubaihayo PR, Labonte DR, Diaz F, Kapinga R, Mwanga RO, Gruneberg WJ (2011). Genetic diversity in white-and orange-fleshed sweetpotato farmer varieties from East Africa evaluated by simple sequence repeat markers. Crop Science 51: 11321142. DOI 10.2135/cropsci2010.07.0407. [Google Scholar] [CrossRef]
Turyagyenda LF, Kizito EB, Ferguson ME, Baguma Y, Harvey JW, Gibson P, Wanjala BW, Osiru DSO (2012). Genetic diversity among farmer-preferred cassava landraces in Uganda. African Crop Science Journal 20: 15–30. [Google Scholar]
Veasey EA, Borges A, Rosa MS, Queiroz-Silva JR, Bressan EA, Peroni N (2008). Genetic diversity in Brazilian sweet potato [Ipomoea batatas (L.) Lam., Solanales, Convolvulaceae] landraces assessed with microsatellite markers. Genetics and Molecular Biology 31: 725–733. DOI 10.1590/S1415-47572008000400020. [Google Scholar] [CrossRef]
Wadl PA, Olukolu BA, Branham SE, Jarret RL, Yencho GC, Jackson DM (2018). Genetic diversity and population structure of the USDA sweetpotato (Ipomoea batatas) germplasm collections using GBSpoly. Frontiers in Plant Science 9: 1166. DOI 10.3389/fpls.2018.01166. [Google Scholar] [CrossRef]
Wang Z, Li J, Luo Z, Huang L, Chen X, Fang B, Li Y, Chen J, Zhang X (2011). Characterization and development of EST-derived SSR markers in cultivated sweetpotato (Ipomoea batatas). BMC Plant Biology 11: 139. DOI 10.1186/1471-2229-11-139. [Google Scholar] [CrossRef]
Wang S, Nie S, Zhu F (2016). Chemical constituents and health effects of sweet potato. Food Research International 89: 90–116. DOI 10.1016/j.foodres.2016.08.032. [Google Scholar] [CrossRef]
Wellmann R, Bennewitz J (2019). Key genetic parameters for population management. Frontiers in Genetics 10: 667. DOI 10.3389/fgene.2019.00667. [Google Scholar] [CrossRef]
Wu S, Lau KH, Cao Q, Hamilton JP, Sun H et al. (2018). Genome sequences of two diploid wild relatives of cultivated sweetpotato reveal targets for genetic improvement. Nature Communications 9: 4580. DOI 10.1038/s41467-018-06983-8. [Google Scholar] [CrossRef]
Yada B, Tukamuhabwa PS, Wanjala B, Kim DJ, Skilton RA, Alajo A, Mwanga ROM (2010). Characterization of Ugandan sweet potato germplasm using fluorescent labeled simple sequence repeat markers. HortScience 45: 225–230. DOI 10.21273/HORTSCI.45.2.225. [Google Scholar] [CrossRef]
Yeh FC, Yang RC, Boyle T (1999). POPGENE version 1.31: Microsoft Windows-based freeware for population genetic analysis. University of Alberta and Center for International Forestry Research, Alberta, Canada. [Google Scholar]
Zhang DP, Carbajulca D, Ojeda L, Rossel G, Milla S, Herrera C, Ghislain M (2001). Microsatellite analysis of genetic diversity in sweet potato varieties from Latin America. Lima: International Potato Center, pp. 295–301, Program Report 19992000. [Google Scholar]
Cite This Article
 Copyright © 2023 The Author(s). Published by Tech Science Press.
This work is licensed under a Creative Commons Attribution 4.0 International License , which permits unrestricted use, distribution, and reproduction in any medium, provided the original work is properly cited.
 Downloads
 Citation Tools