
 Submit a Paper
 Propose a Special lssue
 Open Access
ARTICLE

A novel prognostic gene signature, nomogram and immune landscape based on tanshinone IIA drug targets for hepatocellular carcinoma: Comprehensive bioinformatics analysis and in vitro experiments
1 School of Electronic Science and Engineering, Nanjing University, Nanjing, 210023, China
2 Department of Radiation Oncology, Sichuan Cancer Hospital & Institute, Chengdu, 610041, China
3 Radiation Oncology Key Laboratory of Sichuan Province, Chengdu, 610041, China
* Corresponding Author: GANG YIN. Email:
(This article belongs to the Special Issue: Bioinformatics Study of Diseases)
BIOCELL 2023, 47(7), 1519-1535. https://doi.org/10.32604/biocell.2023.027026
Received 24 October 2022; Accepted 15 February 2023; Issue published 21 June 2023
 View Full Text
 Download PDF
Abstract
Background: Tanshinone IIA, one of the main ingredients of Danshen, is used to treat hepatocellular carcinoma (HCC). However, potential targets of the molecule in the therapy of HCC are unknown. Methods: In this study, we collected the tanshinone IIA targets from public databases for investigation. We screened differentially expressed genes (DEGs) across HCC and normal tissues using mRNA expression profiles from The Cancer Genome Atlas (TCGA). Univariate Cox regression analysis and least absolute shrinkage and selection operator (LASSO) Cox regression models were used to identify and construct the prognostic gene signature. Results: Finally, we discovered common genes across tanshinone IIA targets and HCC DEGs. We reported Fatty acid binding protein-6 (FABP6), Polo-like Kinase 1 (PLK1), deoxythymidylate kinase (DTYMK), Uridine Cytidine Kinase 2 (UCK2), Enhancer of Zeste Homolog 2 (EZH2), and Cytochrome P450 2C9 (CYP2C9) as components of a gene signature. The six-gene signature’s prognostic ability was evaluated using the Kaplan-Meier curve, time-dependent receiver operating characteristic (ROC), multivariate Cox regression analysis, and the nomogram. The mRNA level and protein expression of UCK2 were experimentally validated after treatment with different concentrations of tanshinone IIA in HEPG2 cells. CIBERSORTx, TIMER2.0, and GEPIA2 tools were employed to explore the relationship between the prognostic signature and immune cell infiltration. Conclusion: We established a six-gene signature as a reliable model with significant therapeutic possibility for prognosis and overall survival estimation in HCC patients, which might also benefit medical decision-making for appropriate treatment.Keywords
Liver cancer ranks sixth in the number of new cases in both sexes. Asia reports the highest numbers in terms of incidence, mortality, and the 5-year prevalence (https://gco.iarc.fr/today/data/). Hepatocellular carcinoma (HCC) represents the most frequent kind of primary cancer, contributing to 90% of the cases (Torre et al., 2015). This incidence is expected to increase in the future, and HCC remains a worldwide health challenge (Llovet et al., 2016; Villanueva, 2019). Chronic liver diseases and fibrosis are the most prominent risk factors for the occurrence of HCC (Balogh et al., 2016), others being viral hepatitis (Choo et al., 1991; Ott et al., 2012), and alcohol consumption (Batey et al., 1992). Non-alcoholic fatty liver disease is emerging as a major reason for HCC in developed countries (Dyson et al., 2014; Kanwal et al., 2016), along with diabetes (Wang et al., 2012; Gao et al., 2013), and obesity (Calle et al., 2003; Reddy and Rao, 2006). It is suggested that obesity elevates the risk of HCC by 1.5 to 4-fold (Larsson and Wolk, 2007). Furthermore, the gender can sometimes influence HCC development, as males are more likely to develop HCC according to studies (Yuan et al., 1995; White et al., 2012). Excessive accumulation of iron status induces a tenfold increase in the likelihood of HCC compared to individuals with regular iron accumulation (Deugnier and Turlin, 2001). Moreover, smoking also was shown be another risk factor in a meta-analysis (Gandini et al., 2008).
Early detection is critical for achieving the best treatment outcome for HCC. Clinically, regenerated nodules arise as a result of hepatocyte proliferation. Ultrasound-detected nodules larger than 1 cm should be followed up with a radiography examination, such as an enhanced phase III or IV computed tomography (CT) or a magnetic resonance imaging (MRI) scan (Sangiovanni et al., 2010; Lee et al., 2015). Furthermore, serum alpha-fetoprotein (AFP) concentrations greater than 400 ng/mL have a substantial positive predictive ability (El-Serag, 2011). Percutaneous biopsies should be confined to nodules that are radiologically nontypical for HCC on CT or MRI (Verslype et al., 2012). Unfortunately, HCC is frequently only detected after patients have developed symptoms and show liver damage and also many individuals are even not thoroughly tested. Several surgical and nonsurgical therapy options are available at the moment for treatment. For example, surgical resection (Allemann et al., 2013), and liver transplantation (Mazzaferro et al., 1996) are suitable treatments for different patients. Other nonsurgical treatments include transarterial chemoembolization (Takayasu et al., 2006), transartetial radiation (Sangro et al., 2011), percutaneous local ablation (Crissien and Frenette, 2014), microwave ablation (Lencioni et al., 2005), and systemic therapy (Llovet et al., 2008; Bertot et al., 2011). Systemic therapies have challenged using conventional therapies for HCC (Bruix et al., 2012). Currently, there is a lot of promise in the molecular profiling-based discovery of new targets and prognostic prediction.
Tanshinone IIA is a representative component of Salvia miltiorrhiza, which has been used to treat cardiovascular diseases. It can reduce pain, enhance blood flow, and stop blood stasis progression (Hao et al., 2018). Pharmacological studies have reported the anti-inflammatory (Yin et al., 2012; Zhao et al., 2016), antioxidant (Gao et al., 2008; Li et al., 2008), and antiangiogenic (Lee et al., 2017) roles of tanshinone IIA. Many studies have also confirmed the newly researched role of tanshinone IIA as an anti-cancer agent (Fang et al., 2021). For example, tanshinone IIA could suppress bladder tumor progression by regulating the STAT3-CCL2 pathway (Huang et al., 2017). Tanshinone IIA could also reduce the growth of pancreatic tumor cells by suppressing the PI3K and MAPK-related signals (Su, 2018). Tanshinone IIA limited tumor growth and cell division by inhibiting the expression of STAT3 in gastric cancer (Zhang et al., 2018). Tanshinone IIA decreased colorectal cancer cell survival through the JNK-Mff signaling pathway (Jieensinue et al., 2018). In another study, tanshinone IIA suppressed the PI3K/Akt signaling pathway, which prevented non-small-cell lung cancer from developing (Liao et al., 2019). Tanshinone IIA inhibited the PI3K/AKT/JNK signaling pathways to cause apoptosis in ovarian cancer cells (Zhang et al., 2019). Additionally, tanshinone IIA restricted glucose metabolism in cervical cancer and promoted apoptosis (Liu et al., 2019b). Tanshinone IIA prevented the expansion of liver cancer by inactivating the transforming growth factor (TGF)-signaling pathway, which is mediated by the SMAD7-YAP connection (Ma et al., 2019). Tanshinone IIA triggered cellular damage in HCC cells by promoting the miR-30b-p53-PTPN11/SHP2 signaling pathway (Ren et al., 2017). Tanshinone IIA is predicted to have multiple targets and multiple pathways in its anticancer potential and function. However, the drug targets and the mechanism of action of Tanshinone IIA that may help improve the prognosis of HCC patients is not yet well understood.
We identified the common gene targets of tanshinone IIA and HCC in this investigation. The risk score of patients was calculated by a 6-gene signature and a nomogram was developed to predict patient survival. Finally, using CIBERSORT, TIMER, and GEPIA2, the correlation of predicted 6-gene signature and immune cell infiltration was investigated. Then, after assessing the possible mechanism, we subsequently confirmed the possible predictive signature of tanshinone IIA. We also validated the effect of tanshinone IIA on UCK2 in HEPG2 cells.
Our methodology flowchart is shown in Fig. 1.
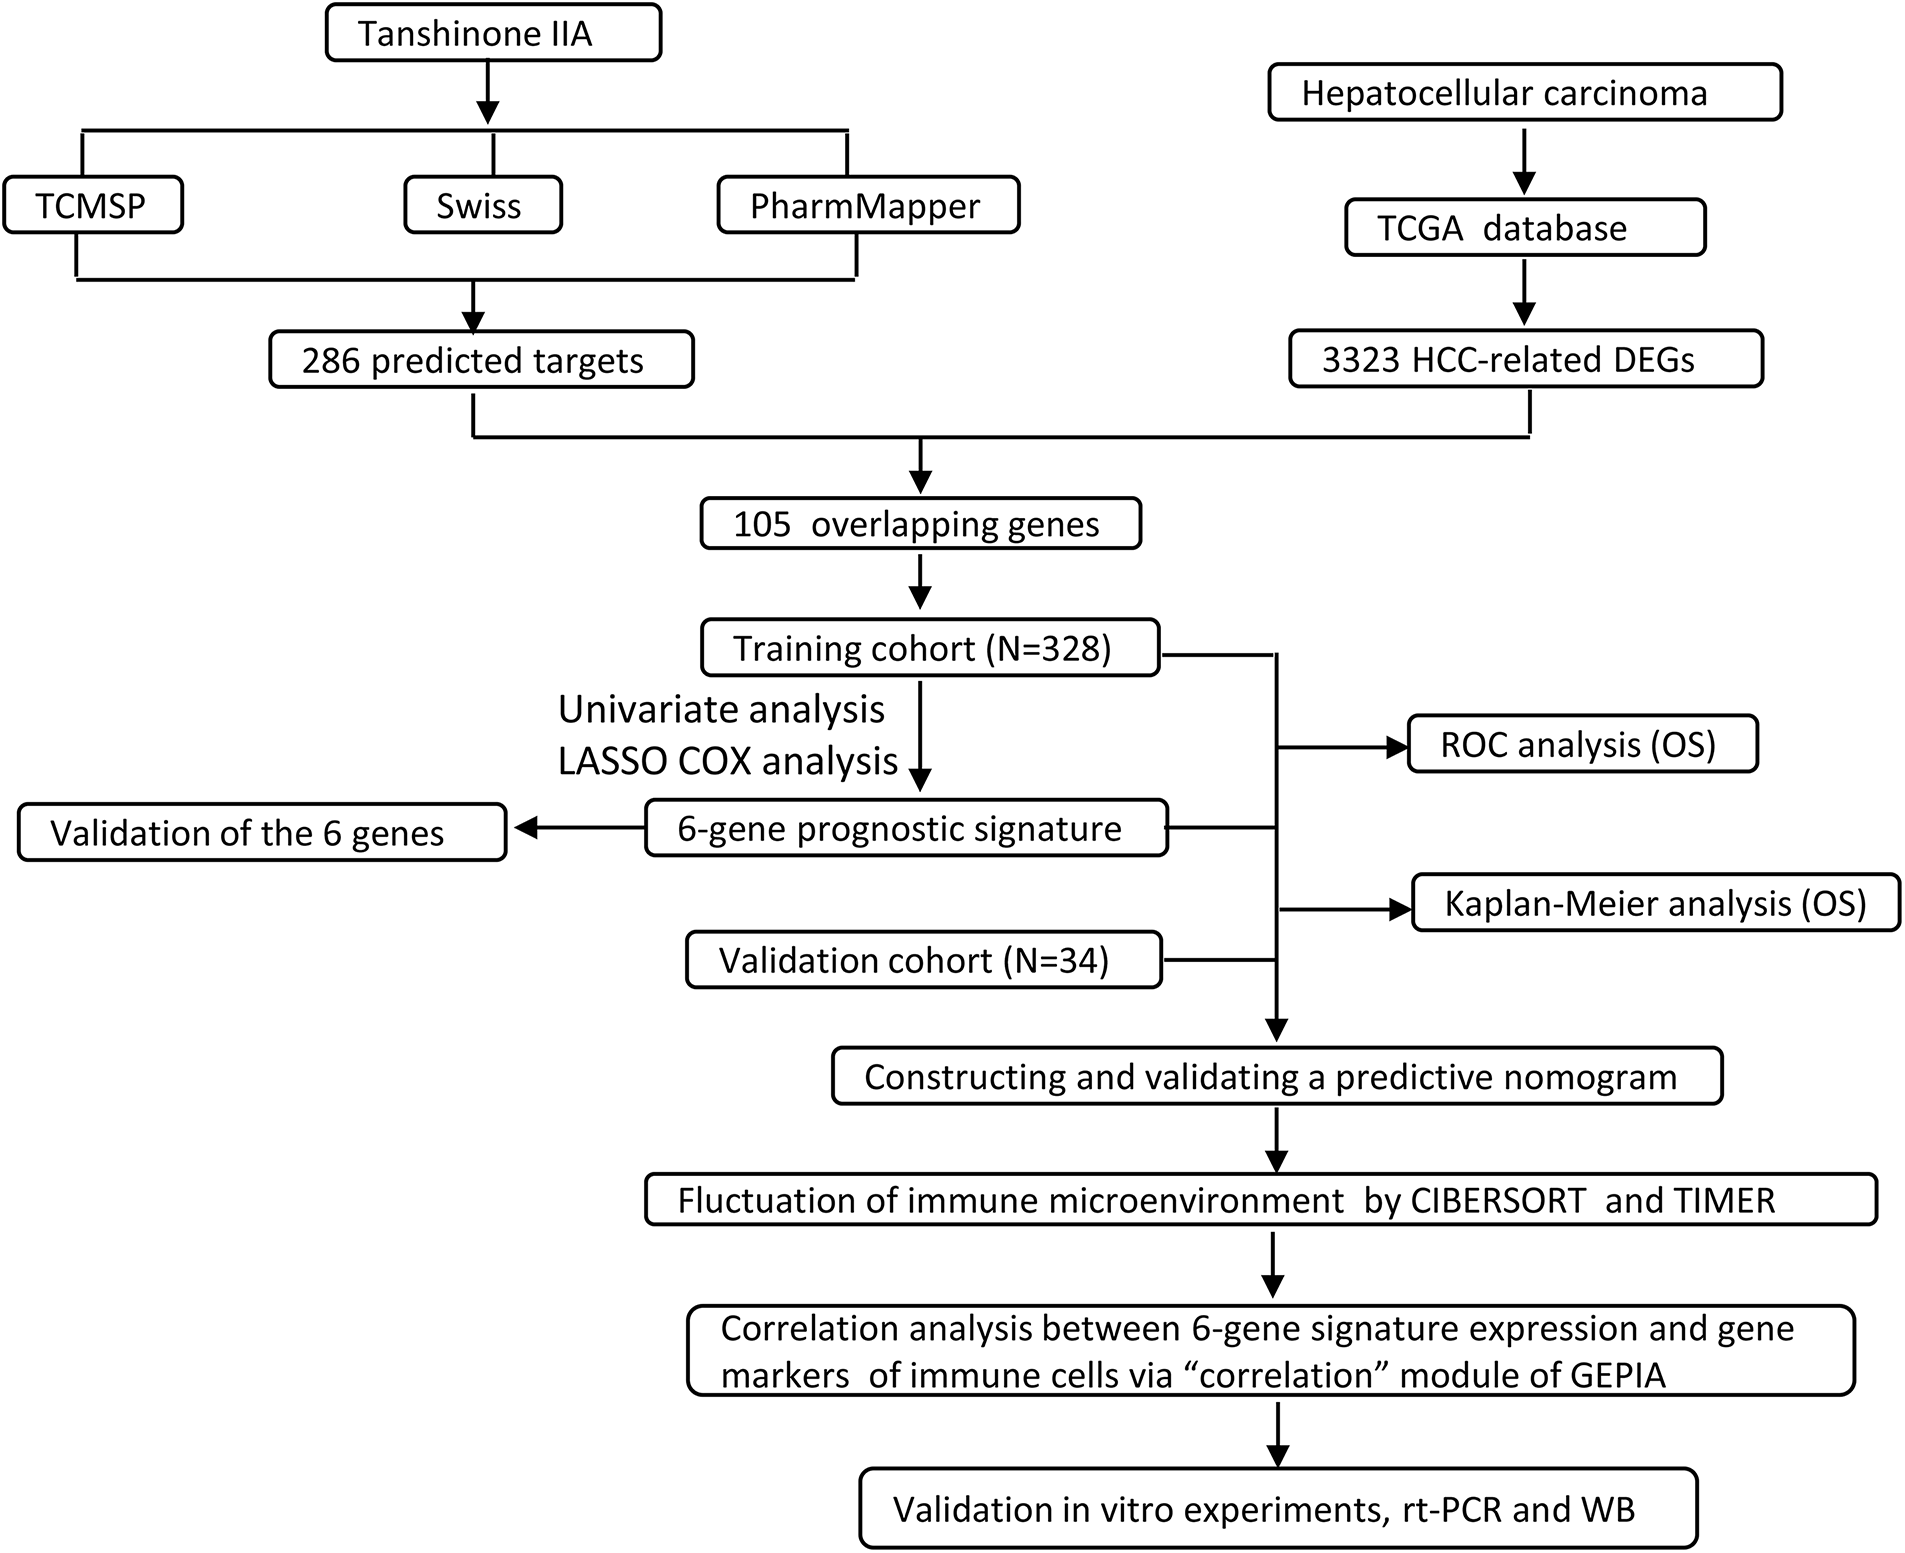
Figure 1: The overall flow chart of this study.
Analyzing common genes of tanshinone IIA and HCC
We identified the targets of tanshinone IIA using the TCMSP (Traditional Chinese Medicine Systems Pharmacology Database and Analysis Platform) database (https://old.tcmsp-e.com/tcmsp.php), Swiss target prediction (http://www.swisstargetprediction.ch/), and PharmMapper database (http://www.lilab-ecust.cn/pharmmapper/) by removing the duplicated genes from the three databases. Furthermore, we obtained the differentially expressed genes (DEGs) based on mRNA expression profiling of HCC and paracancerous tissues from the TCGA database. Finally, the overlapping shared genes were the common targets of tanshinone IIA against HCC.
The clinical characteristics of 362 HCC samples were retrieved from TCGA for subsequent analysis. The information including the survival status, age, gender, the Tumor, Node, Metastasis (TNM) stage, and the ISUP (international society of urologic pathology) grade was provided.
To analyze the overall survival, the Kaplan-Meier (K-M) and time-dependent receiver operating characteristic curve (ROC) curves were examined with R packages “survminer v0.4.6” and “survivalROC v1.0.3”, respectively. The ROC curve’s area under the curve (AUC) is the most essential parameter. The AUC cut-off value was close to 0.5. The closer the value was to 1, the better the diagnostic capabilities.
Development of the prognosis signature
We first separated the 362 HCC samples into training and validation cohorts. Univariate COX regression analysis was performed by R-package “survival v3.1-8”. LASSO analysis was conducted using the R package “glmnet v4.1-4” to further optimize the results. Then, a six-gene signature was proposed from the results of the LASSO analysis. The risk score (RS) was expressed as:
The patient’s risk score and several clinical factors were incorporated in univariate and multivariate COX regression analysis. Then, the factors meeting p < 0.05 in both COX analyses were used to create a nomogram with R package “rms v5.1-4” to predict patient survival.
Immune cell infiltration analysis
CIBERSORTx (https://cibersortx.stanford.edu/) is a machine learning tool that estimates gene expression profiles and the number of cell types among mixed cellular components using gene expression data (Newman et al., 2019; Steen et al., 2020). CIBERSORTx is a support vector machine (SVM) framework-based deconvolution algorithm, namely a linear combination of the expression level of the gene in different cell subpopulations and the weight of cell fractions in the sample. The algorithm is superior in identifying and estimating the abundance of immune cells. The approach provided a LM22 gene signature matrix file that can specifically discriminate 22 immune cell types by uploading the gene expression file of 362 HCC samples. We next assessed the percentage of 22 immune cells of the high- and low-risk groups with the Wilcoxon test.
TIMER2.0 (http://timer.cistrome.org/) is another comprehensive online tool for analyzing and visualizing immune infiltrates in the TCGA database. TIMER2.0 quantified 6 immune cells, including CD4+ T cells, CD8+ T cells, B cells, neutrophils, macrophages, and dendritic cells. The results of the CIBERSORTx analysis revealed that the overall fraction of the 22 immune cells combined was 100%. Unlike CIBERSORTx, TIMER2.0 did not normalize the predicted value to 1. Hence, the result could not be understood as cell proportion or compared across data sets. We investigated the relationship between the prognostic signatures and six immune infiltrates.
Additionally, the “Correlation Analysis” of the Gene Expression Profiling Interactive Analysis (GEPIA), in this work, GEPIA2 (http://gepia2.cancer-pku.cn/#correlation) was employed to assess the relationship of the suggested signatures of nine immune-related T cells with the prognostic signatures.
Validation of the expression of the prognostic signatures
We then acquired the expressions of prognostic signatures from UALCAN (http://ualcan.path.uab.edu) to further evaluate the prognostic signatures. The expression of the six genes was verified based on sample types and individual cancer stages.
Reverse transcription Polymerase Chain Reaction (PCR) assay
The effect of tanshinone IIA on HEPG2 cells was validated using the UCK2 gene. HEPG2 cells (Shanghai EK-Bioscience Biotechnology Co., Ltd., Shanghai, China) in each group were collected after 48 h without/with tanshinone IIA (Merck, Ltd., Chengdu, China) treatment, namely control group, 50 and 100 µM tanshinone IIA groups. The TRIzol solution (Thermo Fisher Scientific, Waltham, USA) was employed to obtain total RNA from cells. The RNA purity and concentration were assessed using an ultraviolet spectrophotometer (Shimadzu UV-3600i Plus). Subsequent to reverse transcription of the UCK2 mRNA to cDNA, which was utilized as a template and replicated in the real-time Polymerase Chain Reaction (RT-PCR) system. The detailed procedure can be found in the previous research for reference (Nolan et al., 2006; Green and Sambrook, 2018). The relative mRNA level of UCK2 was measured with β-actin provided as an internal reference.
The cells of all groups were treated with RIPA reagent (Thermo Fisher Scientific, Waltham, USA) for 30 min before being moved to the tube. The supernatant was removed after 10 min of centrifugation at 12,000 r/min. After sodium dodecyl-sulfate polyacrylamide gel electrophoresis (SDS-PAGE) separation, protein bands on the gel were transferred to a polyvinylidene difluoride (PVDF) membrane (Thermo Fisher Scientific, Waltham, USA) and then the membrane was coated with 5% nonfat milk for 1 h at room temperature. Anti-UCK2 antibodies(Abcam, Cambridge, UK) (ab167683, 1:1000) were added and incubated overnight at 4°C. This was followed by incubation with goat anti-mouse IgG HRP (Abcam, Cambridge, UK) (ab205719, 1:1000) and then stained with the ECL kit (Thermo Fisher Scientific, Waltham, USA). The Gel Imaging System was employed to examine the gray level. The relative expression of each protein band was analyzed to tubulin, which served as an internal control.
The R packages were conducted in R 4.1.3. The statistical data of real-time RT-PCR and western blotting were shown as mean ± standard deviation (SD). The data were analyzed and shown by GraphPad Prism 6 with the two tailed-student t-test. Statistical significance was defined at p < 0.05.
Overlapping genes between tanshinone IIA and hepatocellular carcinoma
The TCMSP showed that the OB (oral bioavailability) value was 49.89% (OB > 30%), and the DL (drug likeness) value was 0.40 (DL > 0.18), which meant that tanshinone IIA has a high absorbance and superior druggability. We searched tanshinone IIA targets in TCMSP, Swiss target prediction and PharmMapper databases. We found 38, 43, and 219 targets in each database, respectively. By deleting the duplicated genes from the three databases, we ultimately came up with 286 targets (Suppl. Table S1). Then, we found 3323 DEGs between the healthy cells and the HCC tissues and 105 genes shared by the DEGs of HCC, and the targets of tanshinone IIA.
Risk prognosis signature and nomogram development
The training cohort (n = 328) and validation cohort (n = 34) were selected at random from the 362 HCC patients. Univariate COX regression analysis was performed and we identified 26 genes that were substantially associated with the overall survival. LASSO COX analysis was employed to understand the outcomes even further. Consequently, we discovered 6 genes (FABP6, PLK1, DTYMK, UCK2, EZH2, and CYP2C9) that were highly significant for patient survival prediction (Figs. 2A and 2B). LASSO COX analysis findings were used to develop a 6-gene signature. The formula used was RS = 0.0057 × FABP6 + 0.0043 × PLK1 + 0.0501 × DTYMK + 0.3090 × UCK2 + 0.0795 × EZH2 − 0.0296 × CYP2C9. Hence, each individual had a risk score computed.
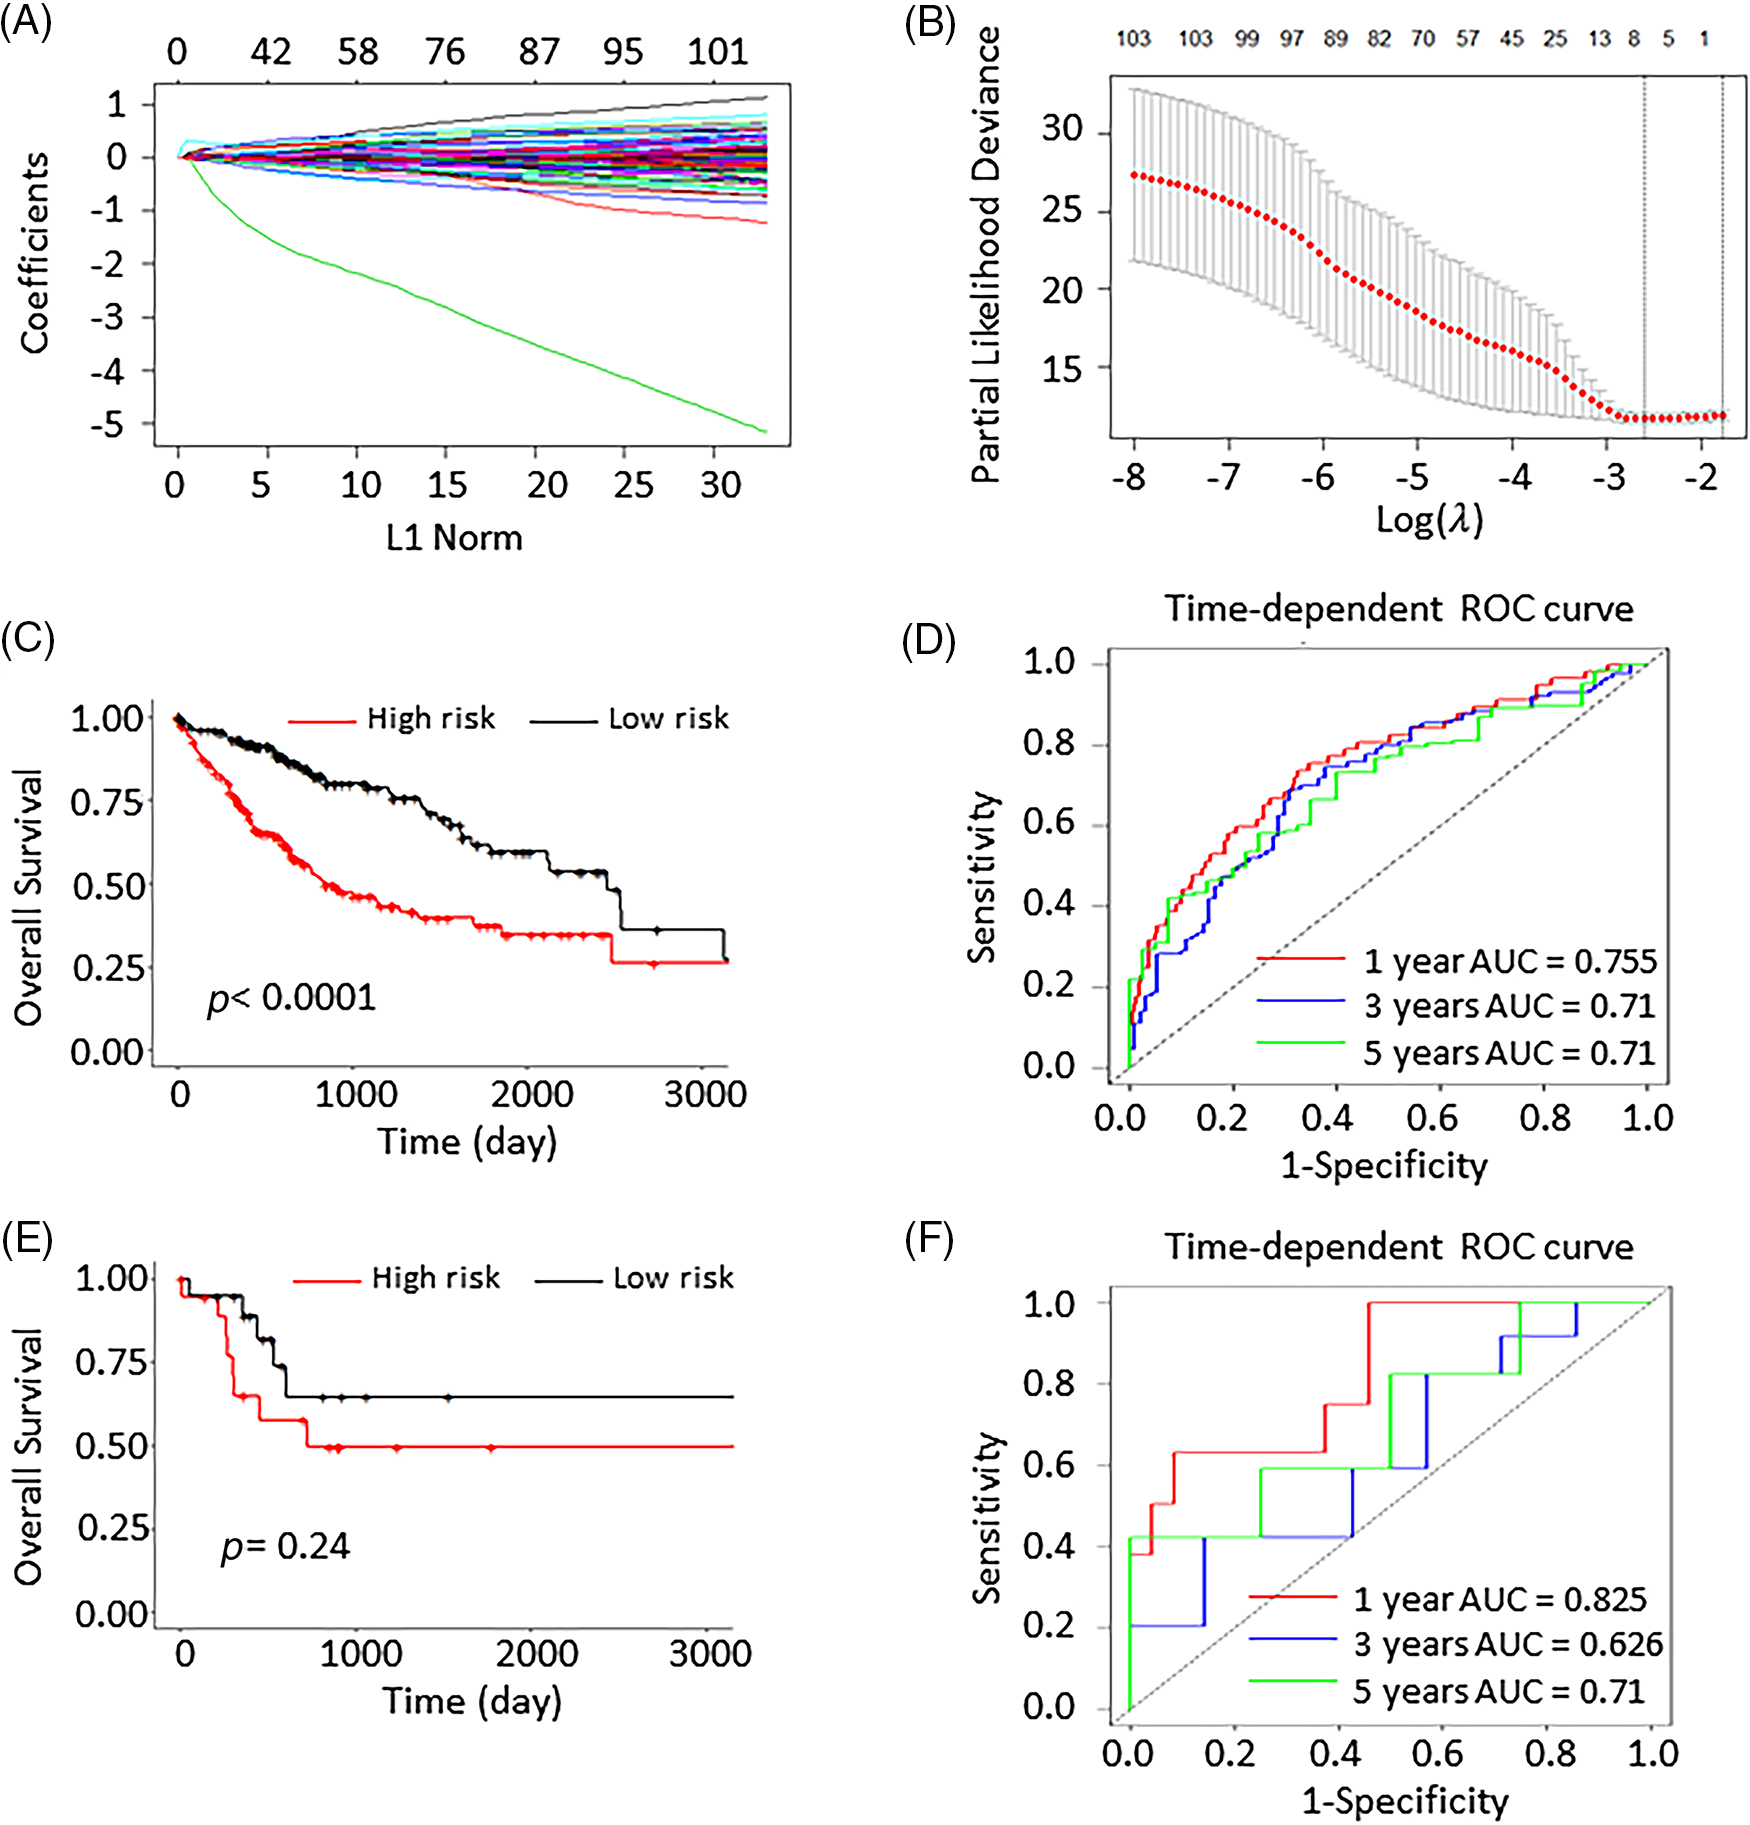
Figure 2: Least absolute shrinkage and selection operator (LASSO) analysis and the validation of the 6-gene prognostic signature. (A) The coefficients of 105 genes in LASSO analysis. (B) LASSO coefficients distribution deviation with partial likelihood. (C) The Kaplan Meier (K–M) curves of the high- and low-risk group scores predictions in the training group. (D) The 1-, 3-, and 5-year ROC curves in the training group. (E) The K-M curve of high- and low-risk group scores predictions in the validation group. (F) The 1-, 3-, and 5-year ROC curves in the validation cohort.
By computing the risk score, 328 patients in the training cohort were separated into 168 low-risk and 160 high-risk patients. In the validation cohort, the 34 patients were grouped into 11 low-risk and 23 high-risk individuals. Compared to the high-risk group, the low-risk had dramatically improved patients survival (p < 0.0001; Fig. 2C). The AUCs at 1-, 3-, and 5-years were 0.755, 0.71, and 0.71, respectively. This demonstrated that the risk prognosis signature has a significant prognostic value in the training cohort (Fig. 2D). The K-M curve analysis of the validation cohort (p = 0.24; Fig. 2E) validated these preceding findings. The AUCs of the 1-, 3-, and 5-year survival were 0.825, 0.626, and 0.71, respectively (Fig. 2F).
To verify the credibility of the model, the mean AUC values of the ROC curve were validated using a 5-fold validation (Suppl. Fig. S1). The GEO dataset GSE76427 was additionally searched for validation, and K-M curves and 1, 3, and 5-year AUC curves were plotted to validate the risk model, as shown in Suppl. Fig. S2.
The findings of univariate and multivariate COX regression analyses showed that the TNM stage and the risk score had a substantial connection with overall survival in both training and validation groups (Fig. 3). Subsequently, both these factors were included in the development of the nomogram. The prediction ability of the nomogram created by combining the TNM stage and risk score (C-index = 0.691; Fig. 4A) was superior to the only the risk score (C-index = 0.672) or TNM stage (C-index = 0.564). Furthermore, the results of validation cohorts indicated an almost matching prediction performance with the training cohort (Fig. 4B).
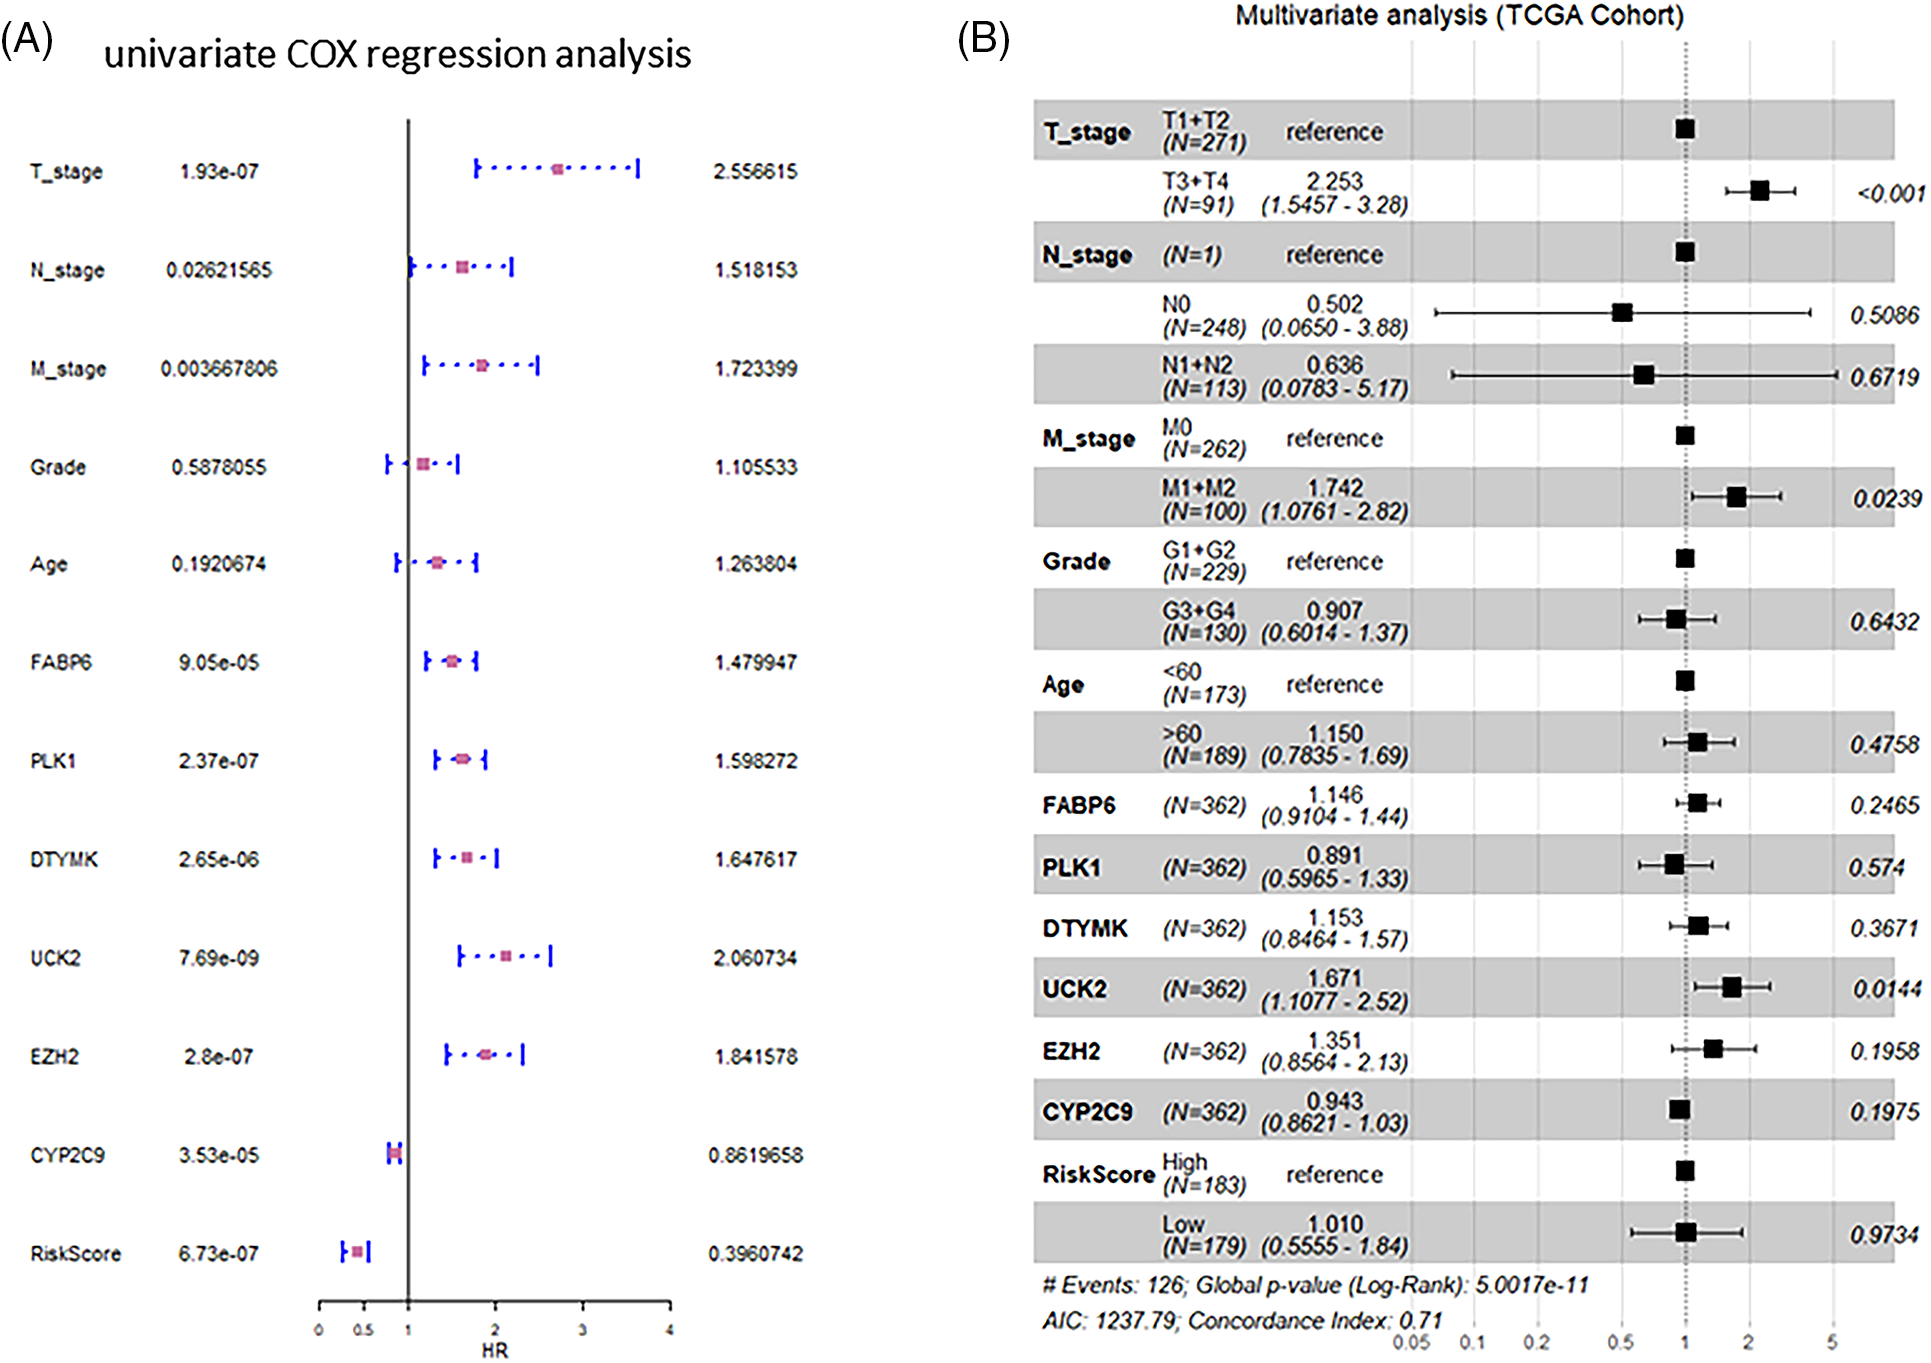
Figure 3: Forest graphs of univariate and multivariate Cox analysis. (A) Forest graphs depicting the findings of the univariate Cox regression analysis. (B) Forest plots displaying the results of the multivariate Cox regression analysis.
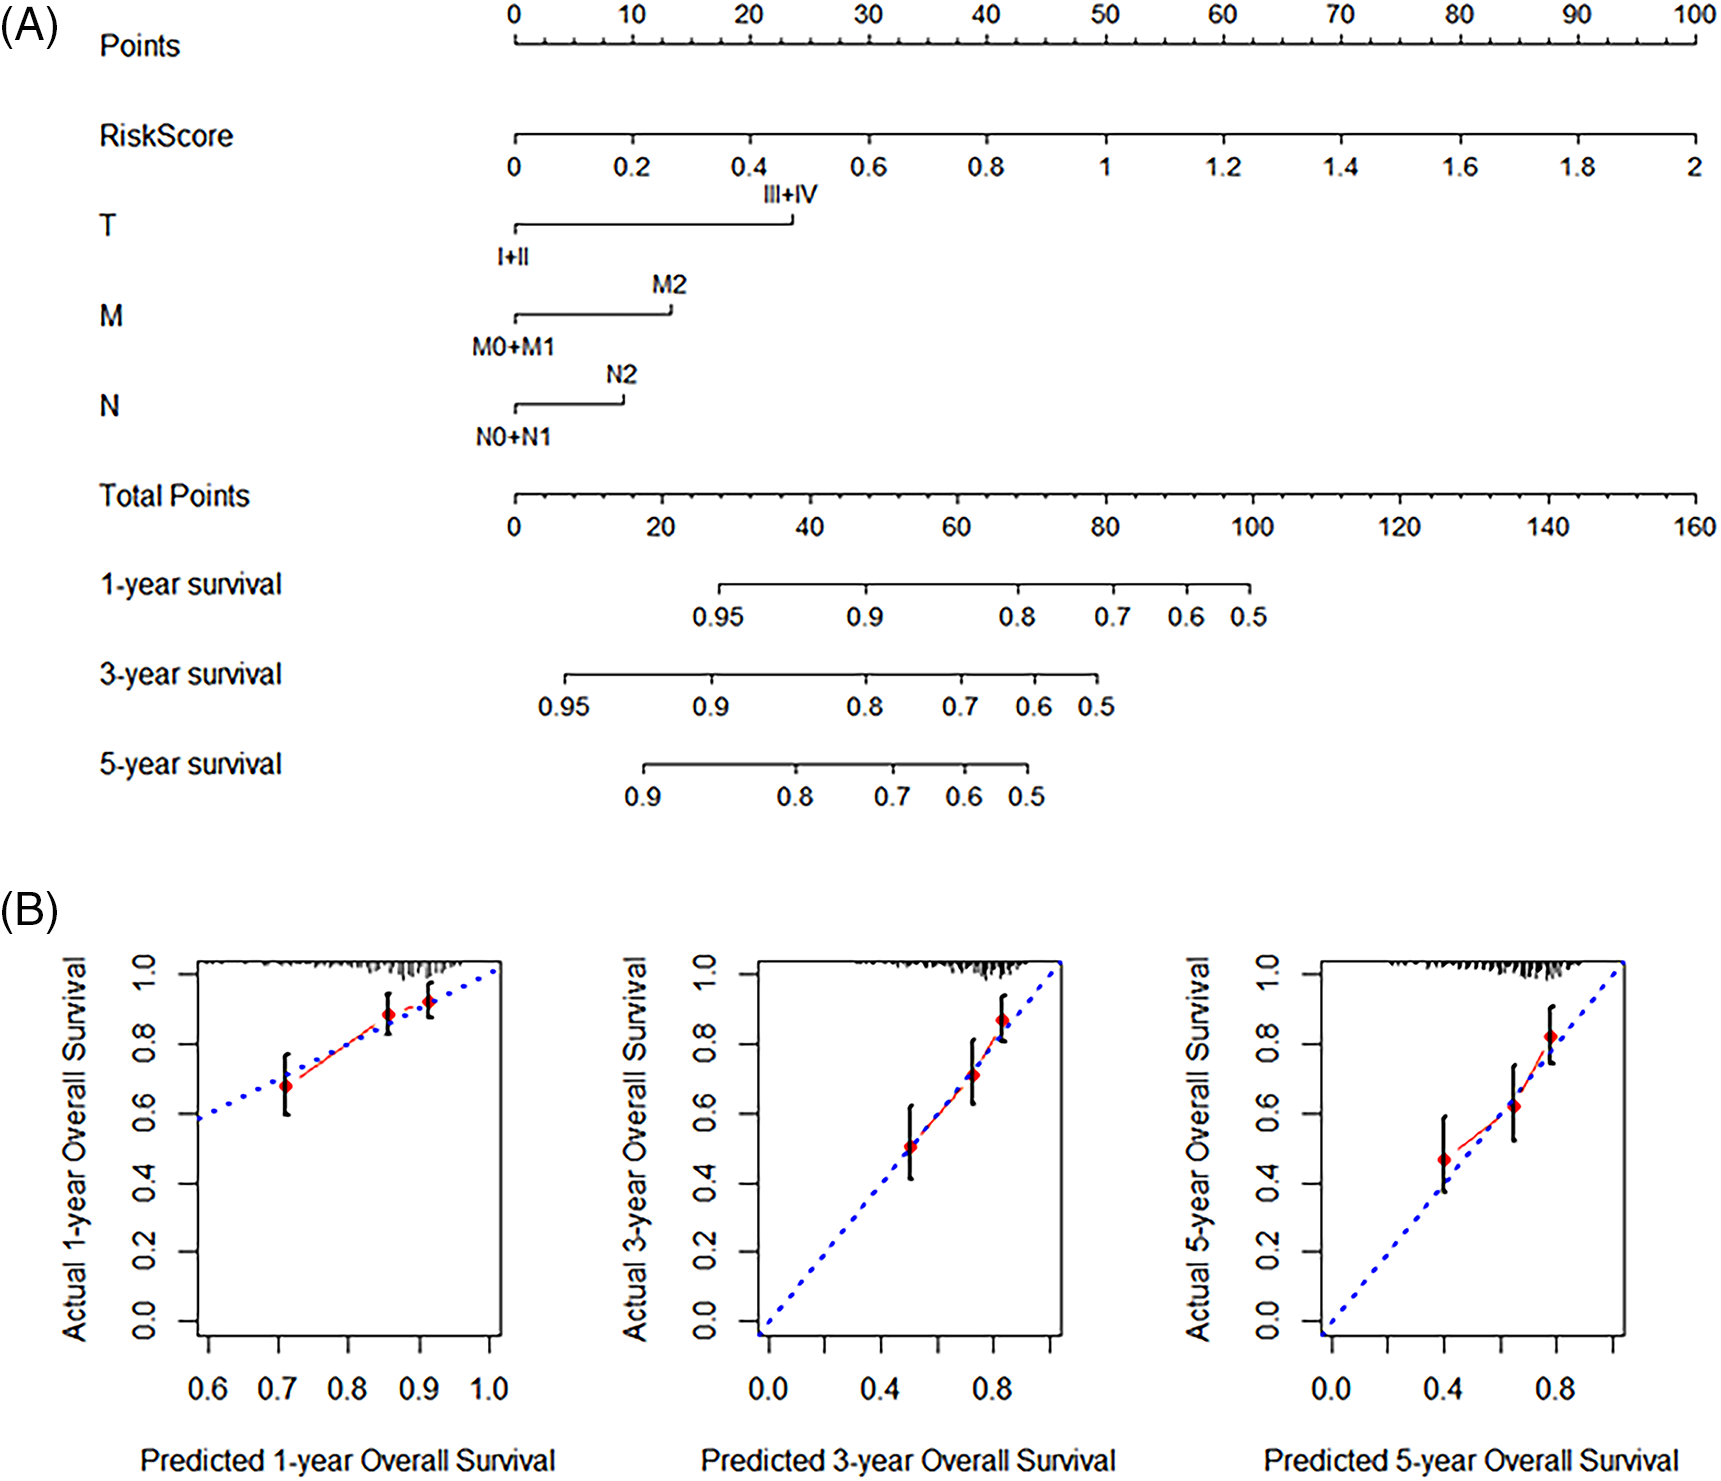
Figure 4: Nomogram development. (A) Nomogram with the combined (Tumor, Node, and Metastasis) TNM stage and the risk score. (B) The validation calibration curve of the nomogram for 1-, 3-, and 5-year survival, separately.
The immune cell infiltration status
The SVM-based CIBERSORTX method was used to calculate the abundance of immune cells infiltration in 362 patients. The abundance of 22 immune cells was shown in 362 distinct tumor samples (Fig. 5A). The overall infiltration percentages of these 22 immune cells was then demonstrated (Fig. 5B). Of these, T cells and macrophages had the largest infiltration ratio. As shown in Fig. 5B, the CD4 naive T cells (26.6506%), plasma cells (14.6888%), follicular helper T cells (Tfh; 7.3556%), M1 macrophages (6.4843%), and M2 macrophages (5.9386%) occupied the larger proportion in the tumor microenvironment. CD4 memory resting T cells (p = 0.021), resting NK cells (p = 0.034), and activated mast cells (p = 0.045) showed significant variations in high- and low-risk individuals (Fig. 6).
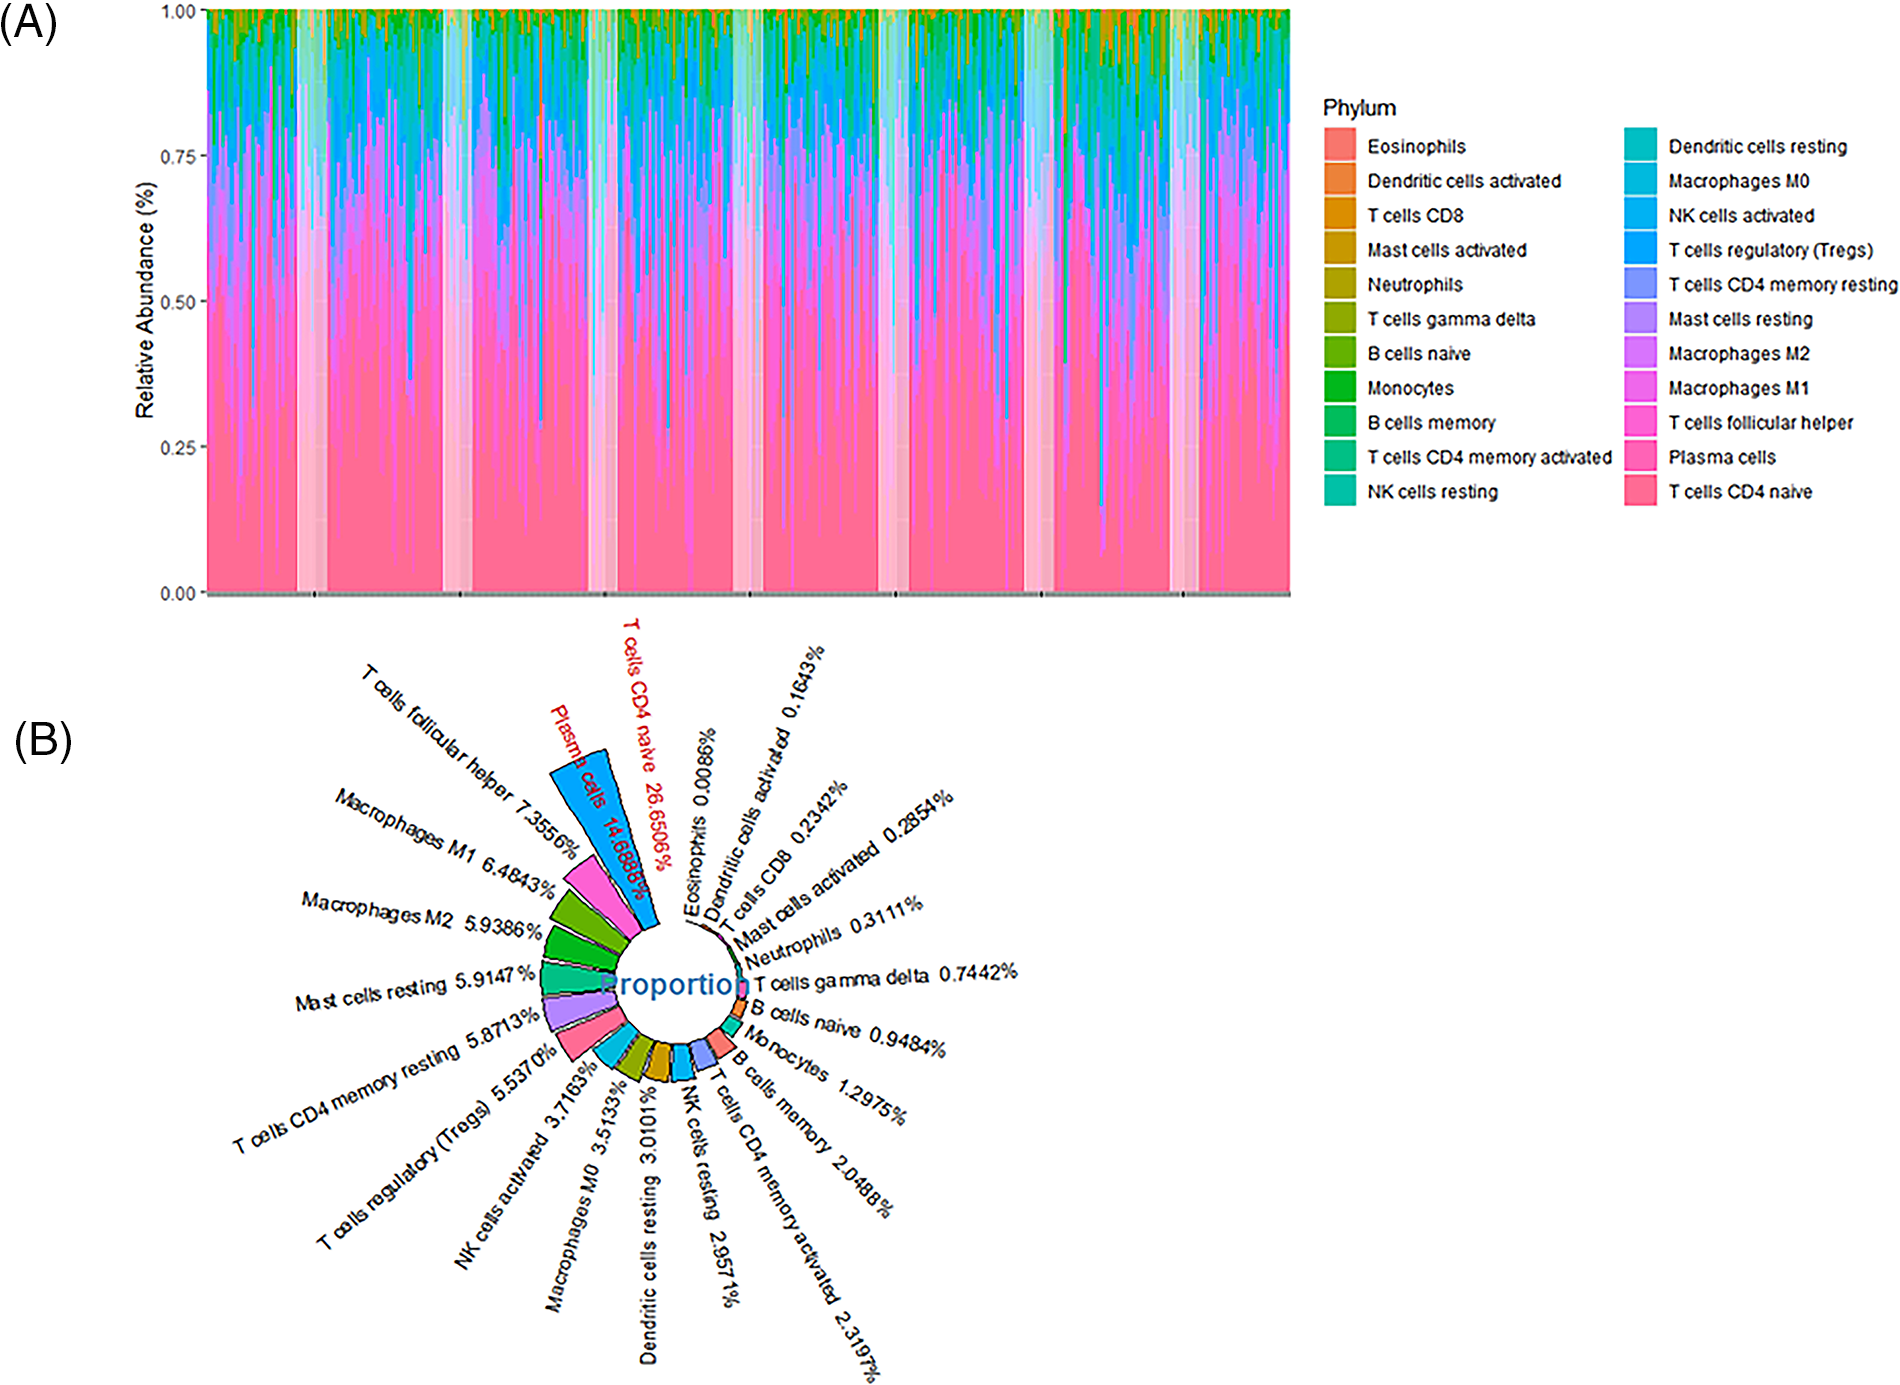
Figure 5: The infiltration ratio of 22 immune cells found in patients. (A) The abundance of immune cell (22 cell types) infiltration in 362 hepatocellular carcinoma (HCC) patients. (B) The mean infiltration ratios of 22 immune cell types in 362 HCC samples were then ranked.
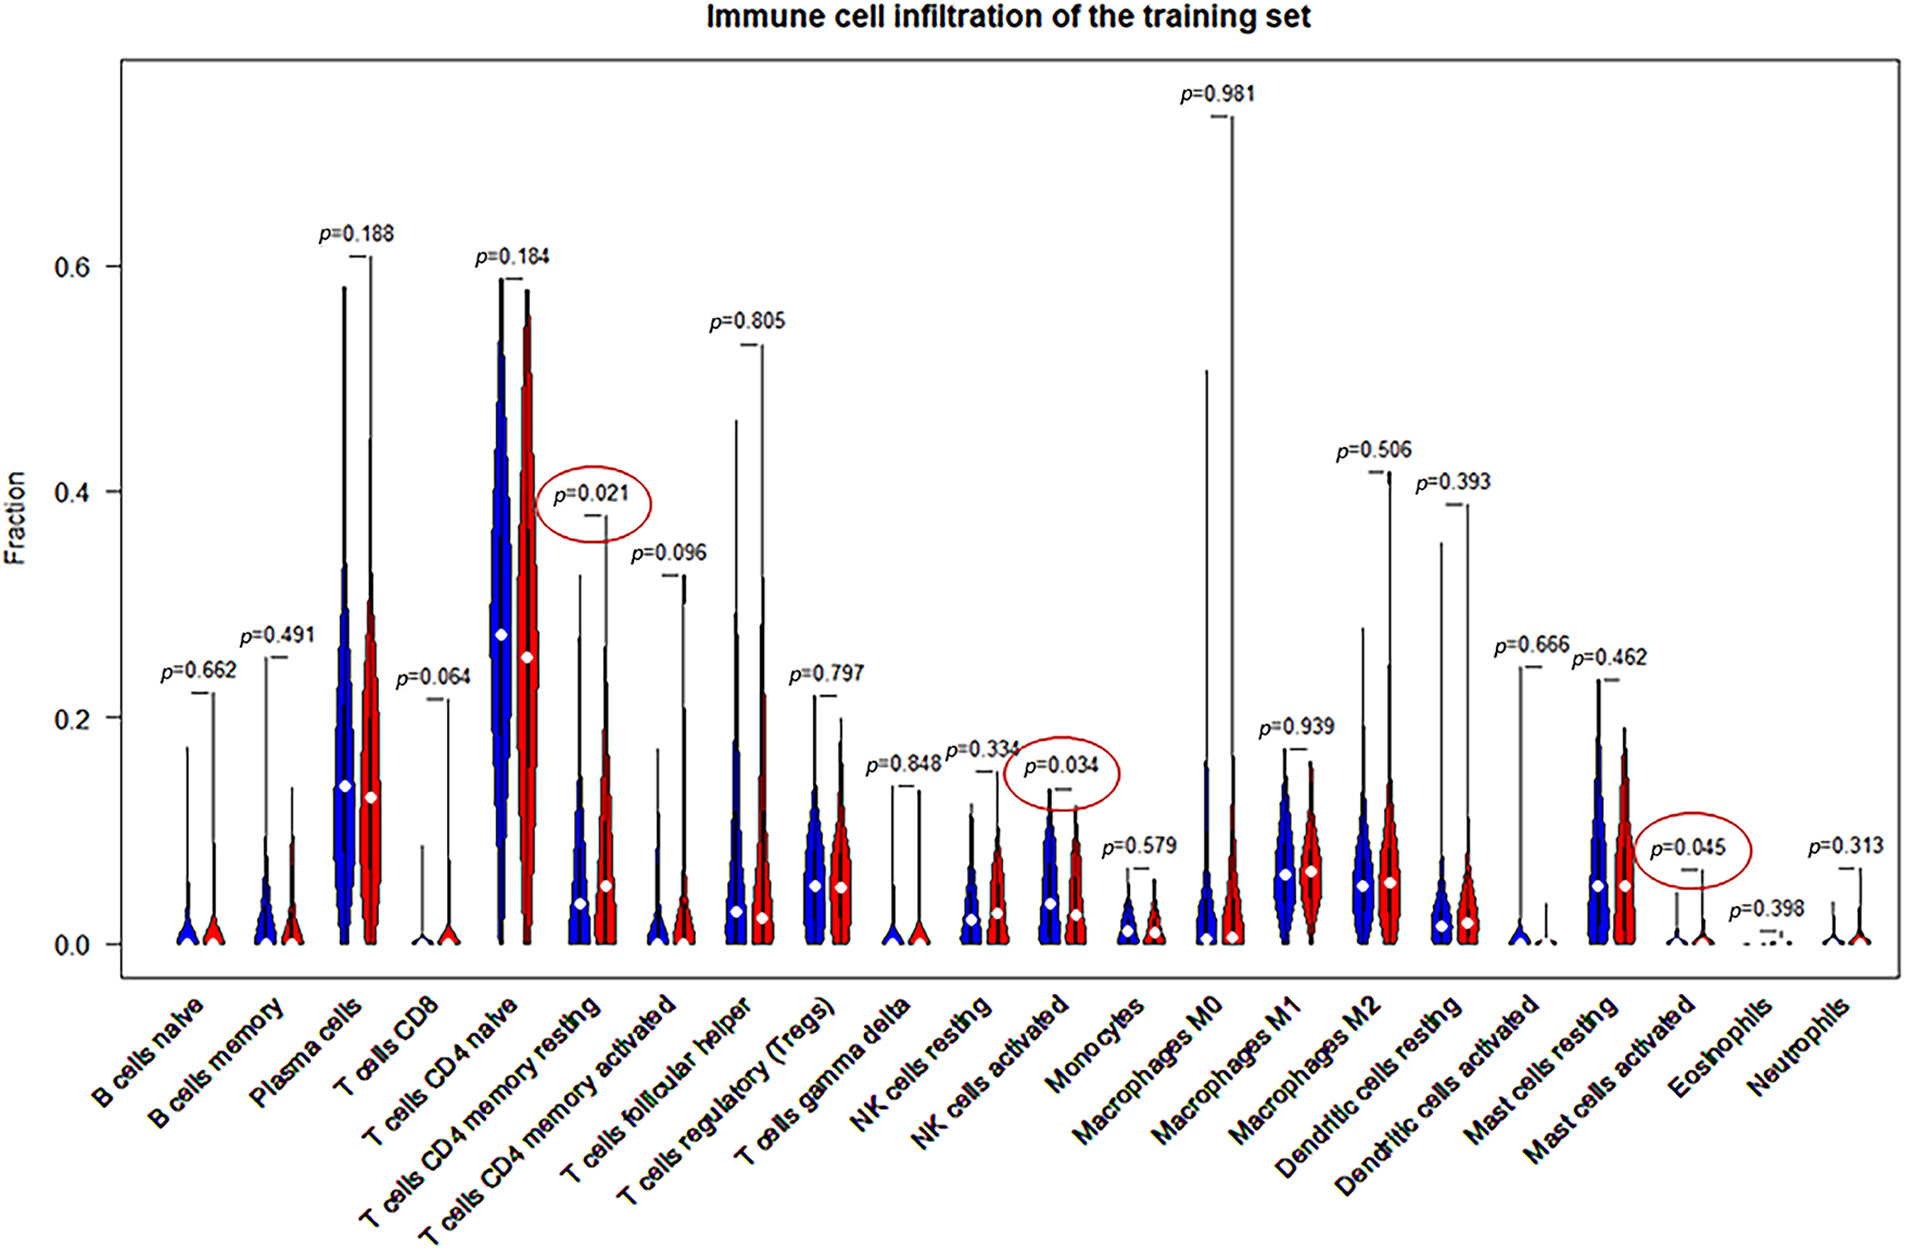
Figure 6: Comparison of the 22 immune cell types and their infiltration in high- and low-risk samples.
To further demonstrate innate gene regulation, we used TIMER2.0 to obtain prognostic signature-mediated changes in the immune cell infiltration profile. The infiltration of six immune cells (CD8+ T cells, CD4+ T cells, B cells, neutrophils, dendritic cells, and macrophages) was shown to be substantially linked with the expression of the 6 prognostic signature genes (FABP6, PLK1, DTYMK, UCK2, EZH2, and CYP2C9) (Fig. 7). The high expression of FABP6, PLK1, DTYMK, UCK2, and EZH2 considerably increased the extent of infiltration of the six immune cells. On the contrary, a high expression of CYP2C9 significantly lowered the degree of infiltration (Fig. 7).
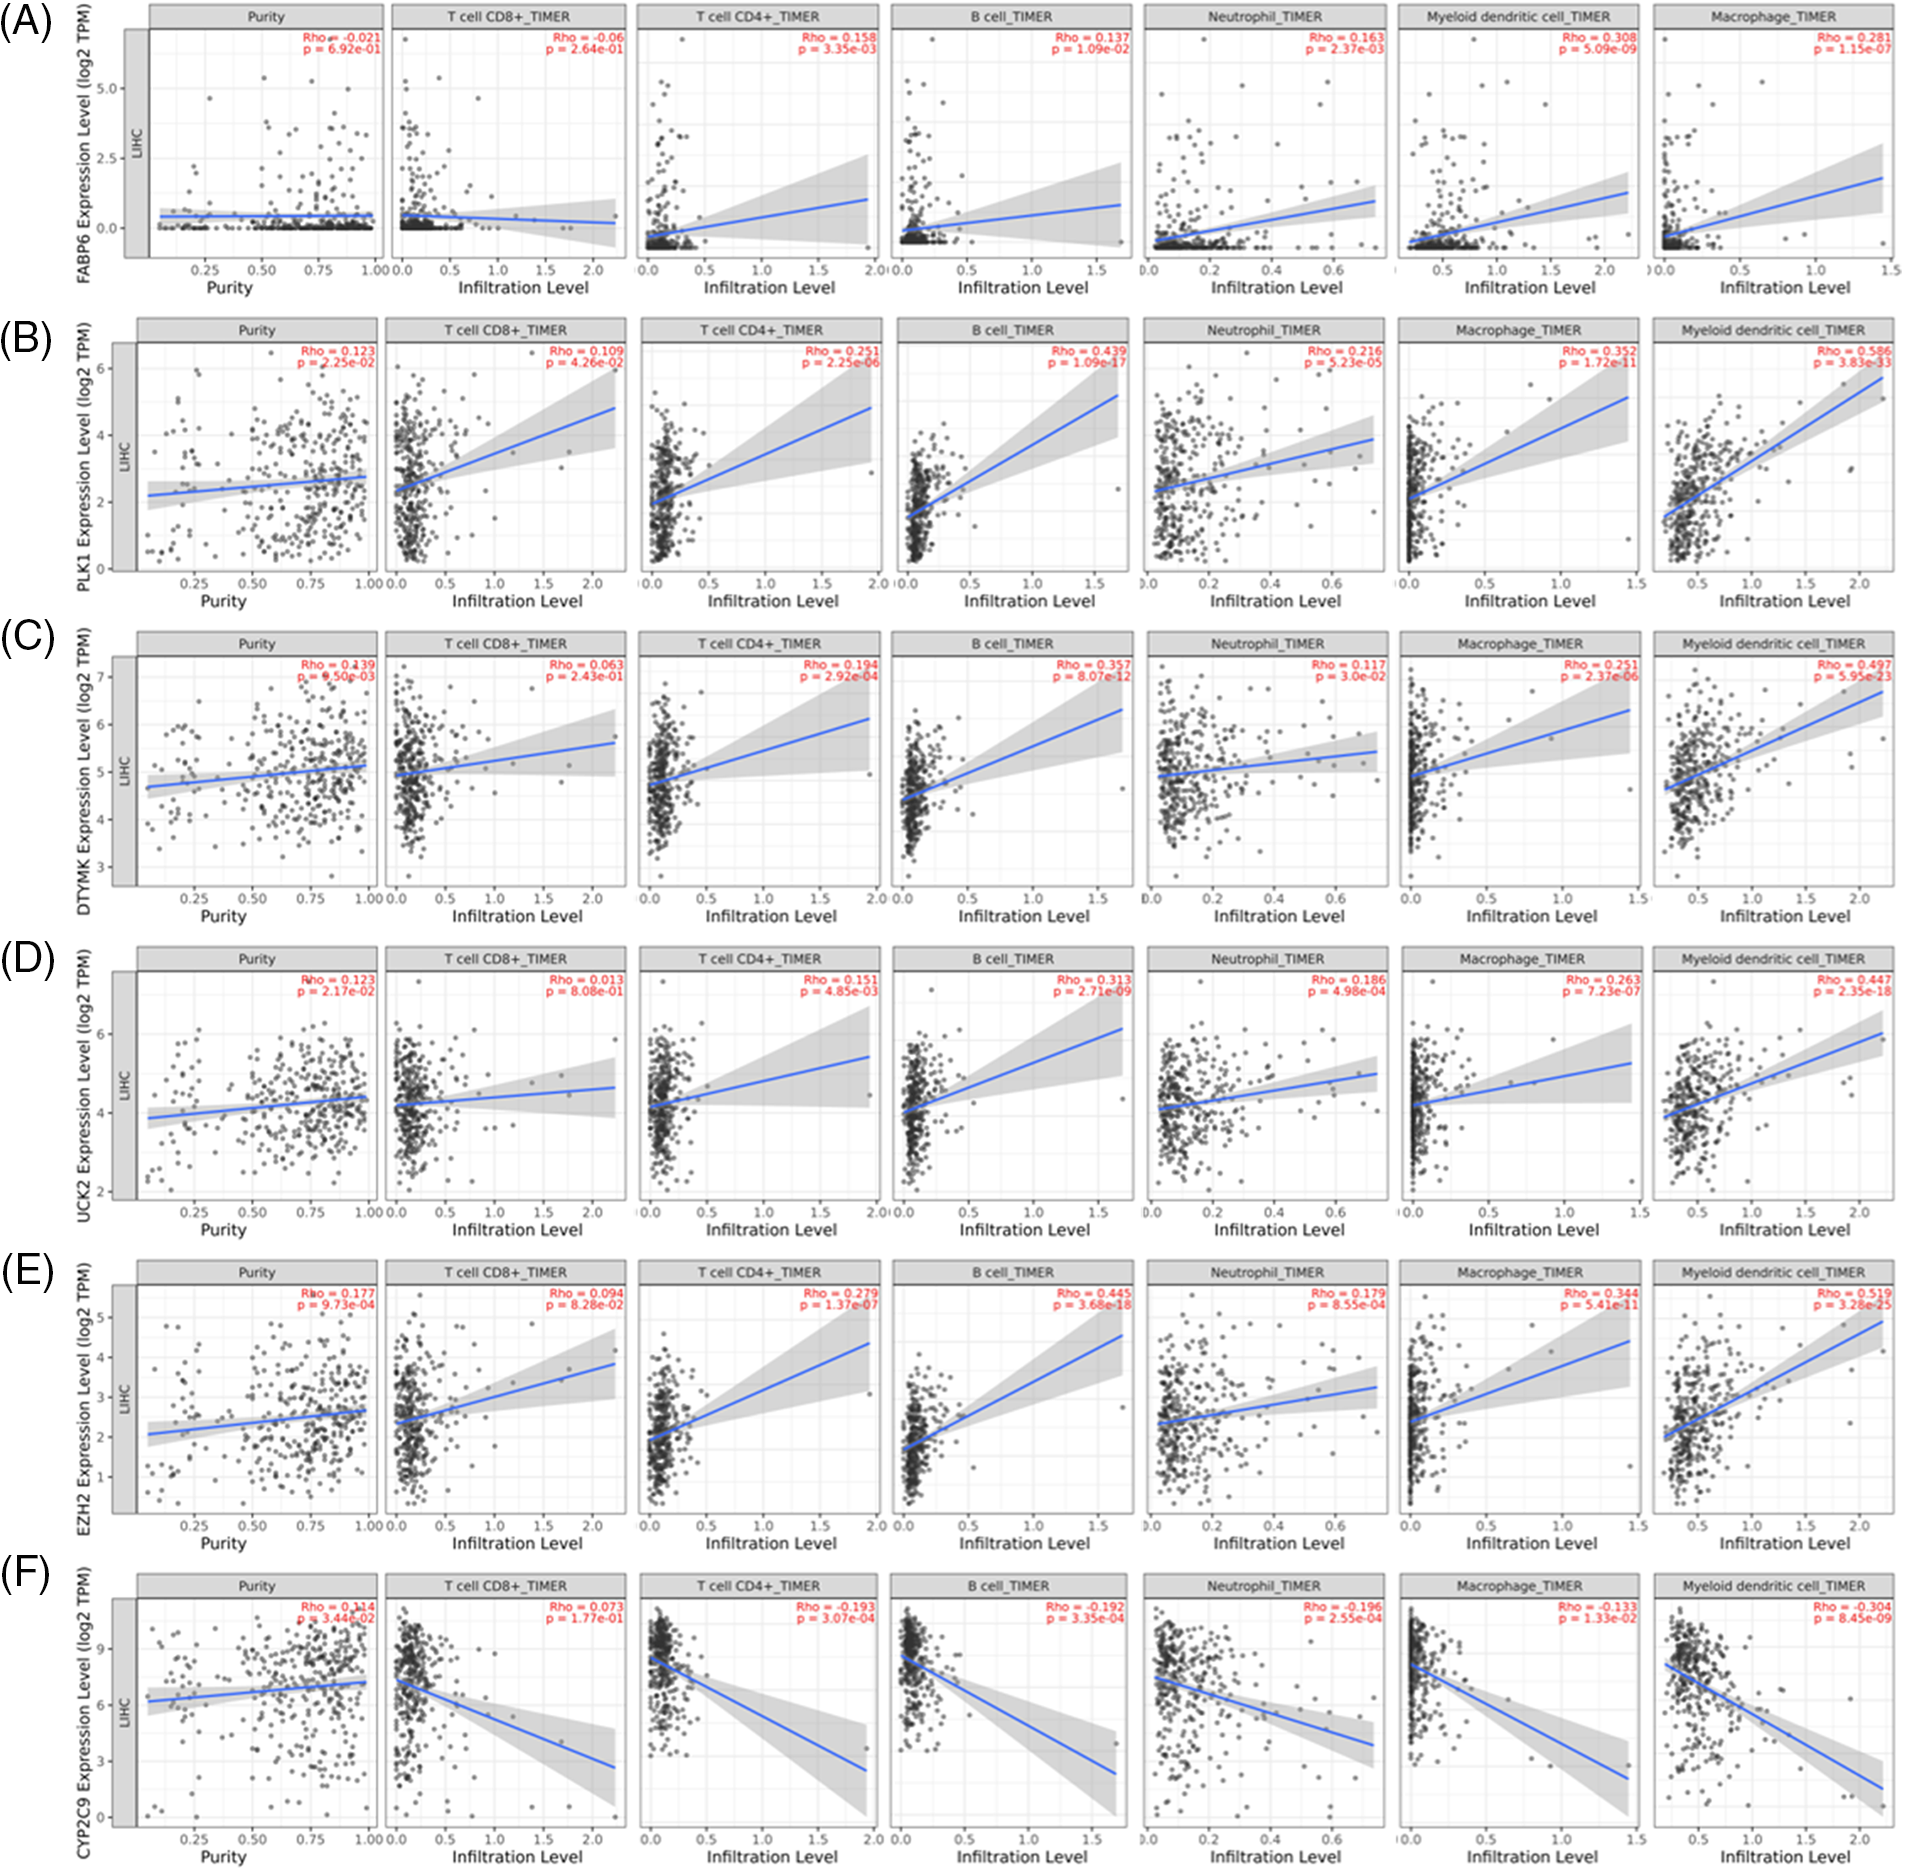
Figure 7: Correlation of the expression of six prognostic genes and the infiltration of six immune cells from the TIMER2.0 collection. (A) FABP6; (B) PLK1; (C) DTYMK; (D) UCK2; (E) EZH2 and (F) CYP2C9.
For “correlation analysis” in GEPIA2, we computed the correlation between the 6-gene signature (FABP6, PLK1, DTYMK, UCK2, EZH2, and CYP2C9) and the suggested gene set of each immune cell.
Validation of the six-gene signature
To confirm the importance of the gene signature based on FABP6, PLK1, DTYMK, UCK2, EZH2, and CYP2C9, we probed the mRNA expression based on sample types and individual cancer stages by UALCAN. The expression of FABP6, PLK1, DTYMK, UCK2, and EZH2 was increased in the primary tumor compared with the normal tissues, while the expression of CYP2C9 was decreased in the primary tumor group (Fig. 8). The expression of the 6 genes documented a similar trend in the individual cancer stages (Fig. 9).
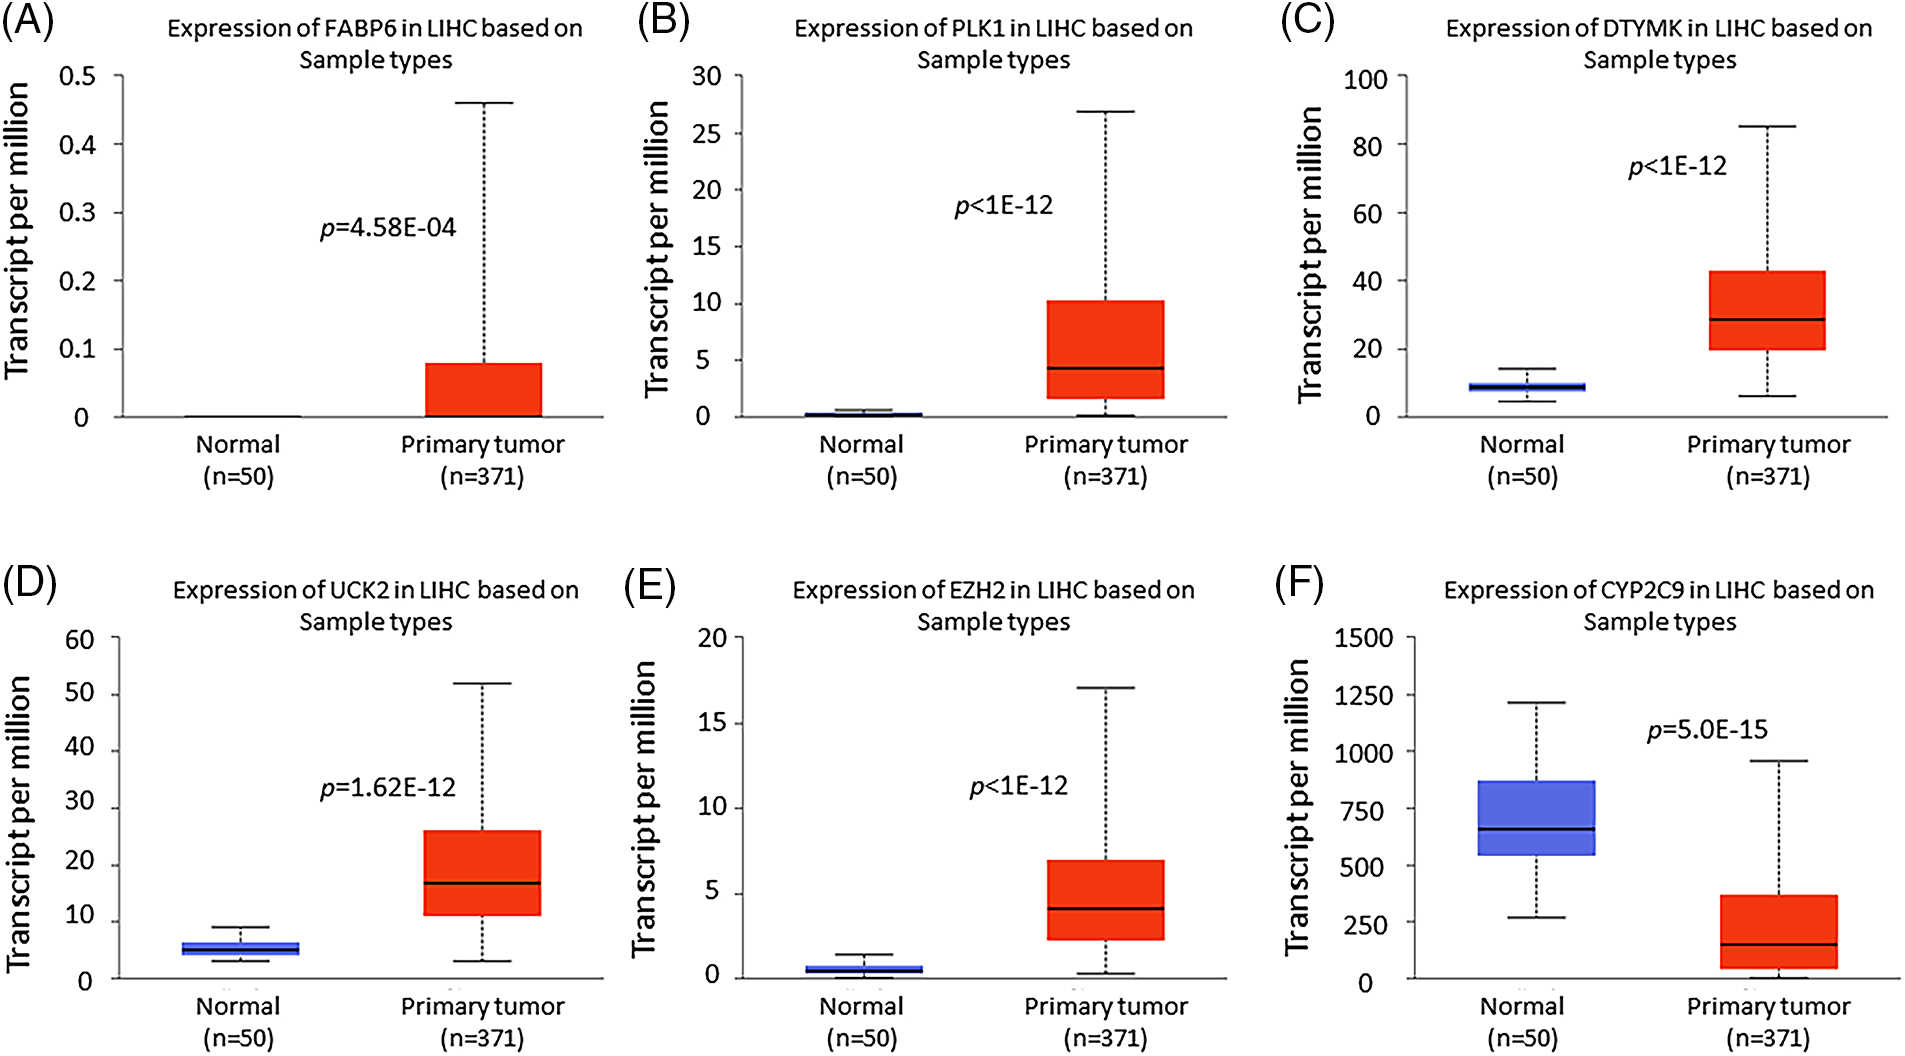
Figure 8: Box plots of the 6 prognostic gene expression obtained using UALCAN. Differential expression of FABP6 (A), PLK1 (B), DTYMK (C), UCK2 (D), EZH2 (E), and CYP2C9 (F) in normal tissues vs. primary tumors.
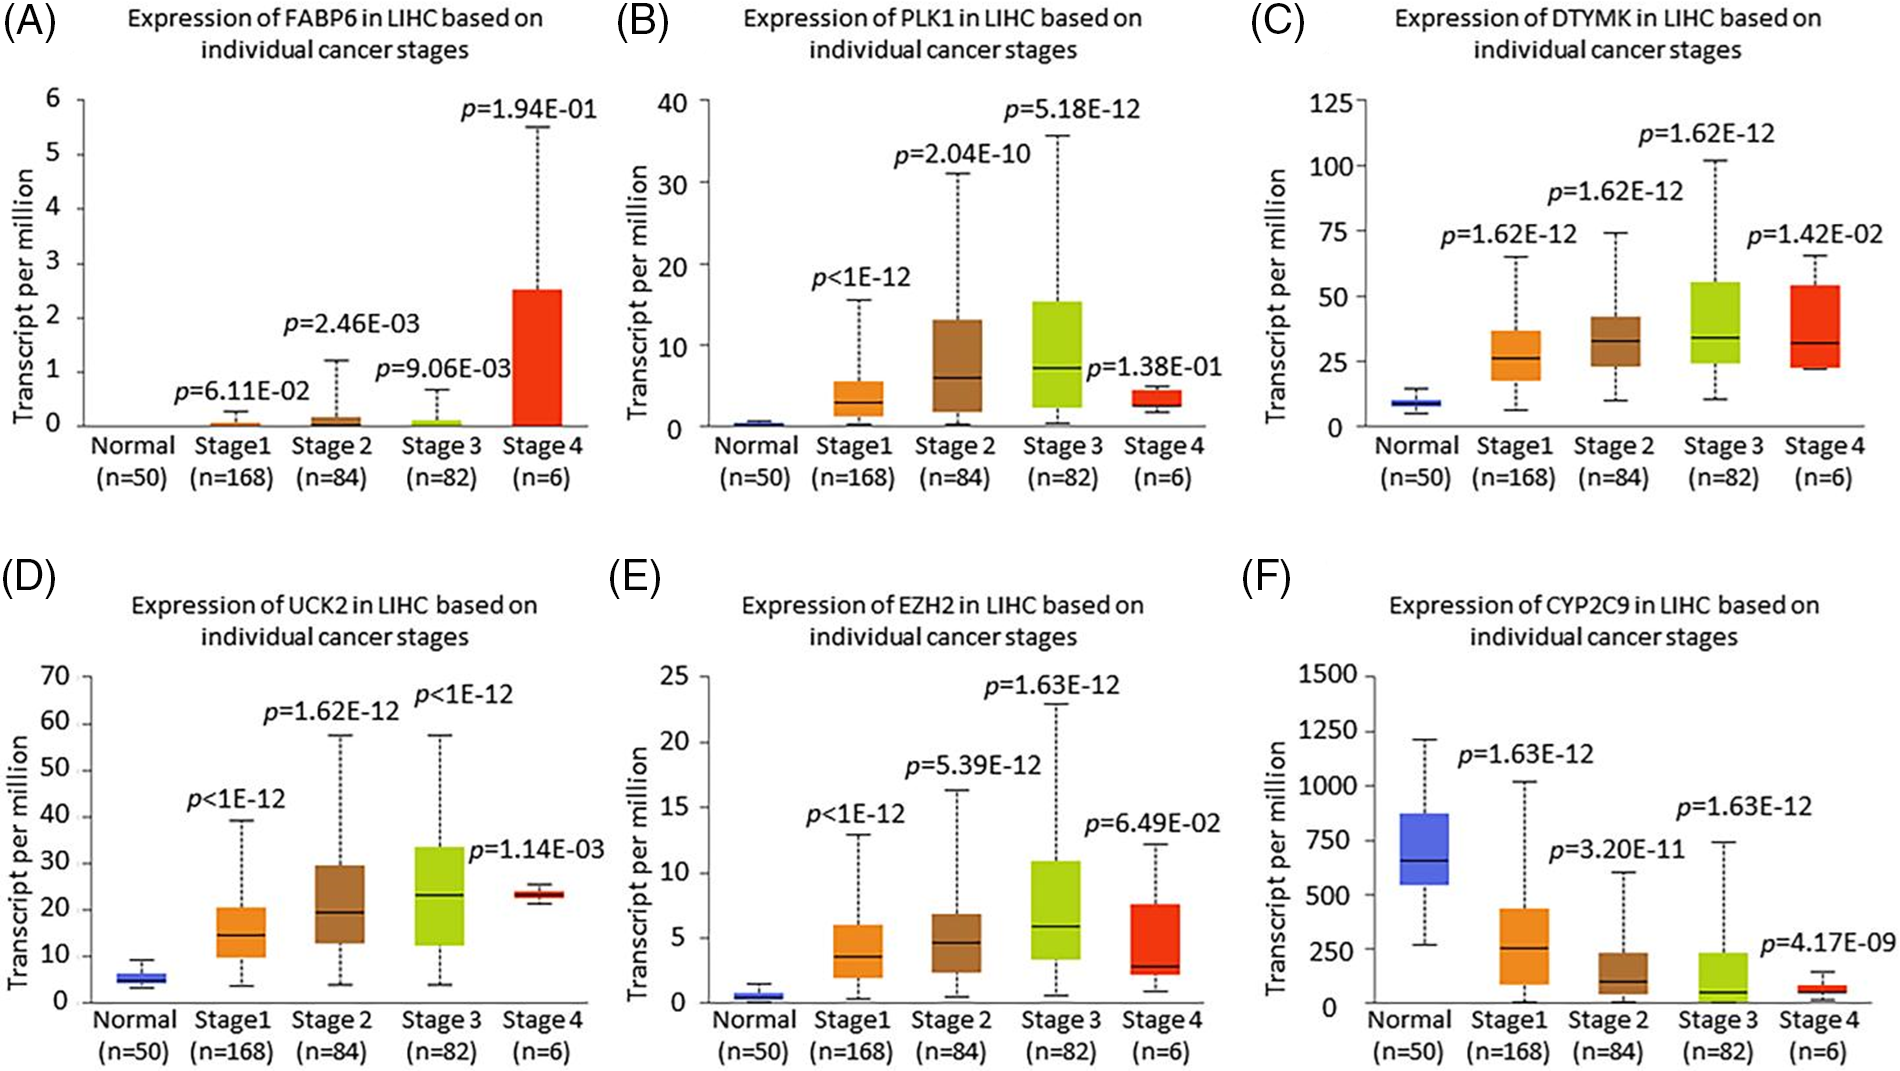
Figure 9: The expression of the 6 prognostic genes based on the stage using UALCAN. Differential expression of FABP6 (A), PLK1 (B), DTYMK (C), UCK2 (D), EZH2 (E), and CYP2C9 (F) based on the individual cancer stage.
Effect of Tanshinone IIA on UCK2 mRNA and protein expression levels in HEPG2 cells
As the p-value of the UCK2 gene was 0.0144 in the Cox model, which was the most significant it was considred to be the best choice for validation. Further, UCK2 plays a crucial role in liver cancer progression and represents a potential target for developing novel therapies. UCK2 has also been shown to promote cell proliferation, survival, invasion, and angiogenesis (Fu et al., 2022), leading to a more aggressive phenotype of cancer cells. Moreover, UCK2 has been shown to confer resistance to chemotherapy and radiation, making it a potential therapeutic target in liver cancer. Hence, the mRNA levels of UCK2 were validated in HEPG2 cells by RT-PCR. Tanshinone IIA treatment at both the concentrations was observed to lower the level of UCK2. Fig. 10A depicts these results. Further, the tanshinone IIA treatment decreased the protein expression of UCK2 in HEPG2 cells, as demonstrated by Western blot analysis (Fig. 10B).
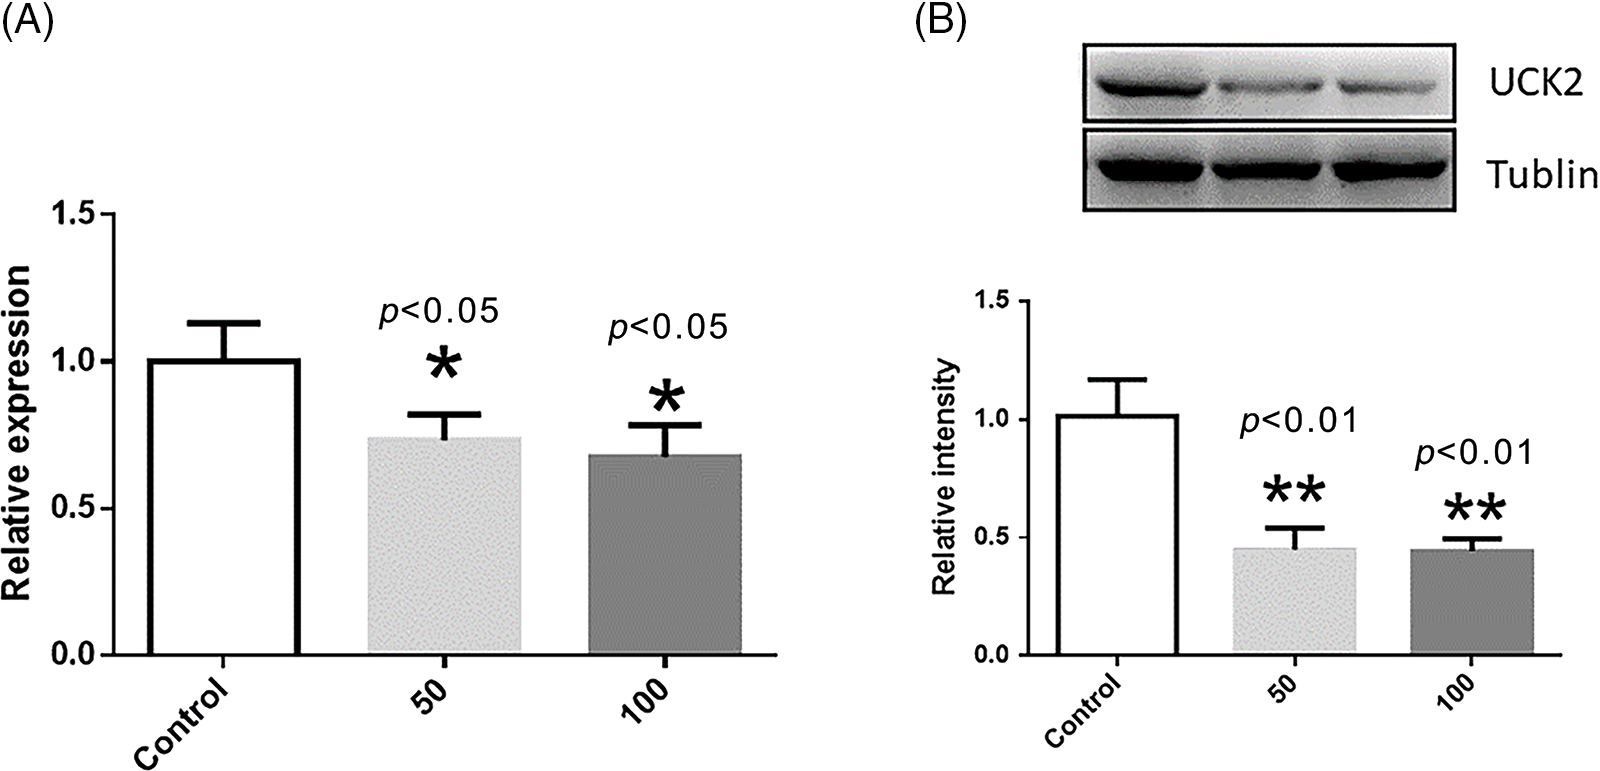
Figure 10: The mRNA level and protein expression of UCK2 after treatment with tanshinone IIA at different concentrations in HEPG2 cells. * represents p < 0.05, and ** represents p < 0.01. (A) The normalized mRNA level of UCK2 in the control (without tanshinone IIA), 50 and 100 µM of tanshinone IIA. (B) The normalized protein expression of UCK2 in the control (without tanshinone IIA), 50 and 100 µM tanshinone IIA.
In this study, we first searched for tanshinone IIA targets. TCGA database was then used to acquire mRNA expression profiles and clinical information. We report 105 tanshinone IIA target genes that overlap with DEGs of HCC. The gene signature was identified and modeled using univariate Cox regression analysis combined with the LASSO Cox regression model. Subsequently, a novel 6-gene signature (composed of FABP6, PLK1, DTYMK, UCK2, EZH2, and CYP2C9) was identified.
The risk score computed from the prognostic signature showed a significant impact on predicting the overall survival of a cancer patient. To elaborate, the high-risk patients had a poor prognosis. Subsequently, the nomogram based on the TNM stage and risk score was modeled to enhance this clinical diagnosis estimation. We discovered that the 6-gene signature was strongly correlated with the immune infiltration after studying the immune microenvironment. We identified six genetic features that were strongly associated with immune infiltration. Particularly, T cell and macrophage infiltration were highly related to the expression of the 6-gene signature.
Furthermore, the expression of the 6 genes was validated based on sample types and individual cancer stages. The results suggested that the novel 6-gene signature associated with immune infiltration can be a favorable potential biomarker. Meanwhile, the 6 genes are also the target genes of tanshinone IIA. Therefore, these 6 genes can be considered as anti-HCC therapeutic targets of tanshinone IIA. The mRNA and expression level of UCK2 were then confirmed by tanshinone IIA treatment in HEPG2 cells in the subsequent experiments.
As a machine learning algorithm, LASSO COX regression has been employed extensively in many studies (Liu et al., 2019a, Wang et al., 2020). The Cox proportional hazards regression model is the most commonly employed statistical model for survival analysis. Other traditional machine learning models, such as the Bayesian network, random forest, or artificial neural networks lack specific modules of survival analysis (Desai et al., 2020). This study utilized the LASSO Cox regression model to discover and build the reported prognostic gene signature. The LASSO COX algorithm was shown to identify potential risk factors and evaluate the prediction and goodness of fit and clinical outcomes (Kantidakis et al., 2020). The advantage of the LASSO COX algorithm model is that it can directly explain the relationship between risk factors and survival. Machine learning techniques are assumption-free and data-adaptive, which means they can be used effectively to model complex data. However, the LASSO COX algorithm also has some limitations. For example, the algorithm requires proper processing of input data and appropriate adjustment of parameters to avoid performance degradation (Scott et al., 2019). Yet, to date, little focus has been given to the aspect of immune-infiltration and signature genes. Our study obtained a 6 gene signature and a nomogram that combined LASSO Cox regression and SVM-based deconvolution algorithm effectively improved the prognosis prediction of HCC.
To corroborate the precision of the results, the LASSO COX algorithm was implemented to solve the risk of over-fitting the prediction model derived from the high-dimensional data of liver cancer and to build prognostic characteristics. The multivariate COX regression was applied to create a nomogram based on the risk score and related clinical features. Risk scores and prognostic signatures demonstrated the potential advantages of survival prediction. After identifying the characteristics of 6 genes, the prognostic models of 6 genes were constructed and their prognostic abilities were studied. In the training and validation groups, the high- and low-risk patients had significantly different outcomes. All high-risk patients had a lower OS than low-risk patients. A time-dependent ROC analysis revealed that the 6 gene signature was significantly predictive.
The progression of a tumor is not only affected by the characteristics of the tumor itself, but also by the tumor microenvironment (Hinshaw and Shevde, 2019; Anderson and Simon, 2020). It should be noted that prognostic genes in this study were highly correlated to immune infiltration in the tumor microenvironment. According to CIBERSORTx analysis, resting memory CD4 T cells, resting NK cells, and activated mast cells exhibited significant variations in the high- and low-risk groups. Hence, the findings of this research could pave the way for better treatment of HCC patients.
In conclusion, a novel 6-gene signature associated with tanshinone IIA drug targets was constructed and validated using the COX regression and LASSO regression algorithms in vitro experiments, and in prognostic analyses. The results showed that 6-gene signature associated with immune infiltration significantly improved the prediction outcomes in HCC patients. Therefore, the 6 gene signatures and nomograms proposed in this study have the potential to serve as predictive tools for HCC patients.
Funding Statement: This study was funded by the Sichuan Natural Science Foundation (No. 2022NSFSCO654); the Radiation Oncology Key Laboratory of Sichuan Province Open Fund (No. 2020FSZLX-03); and the UESTC-Sichuan Cancer Hospital 2021 Medical-Engineering Oncology Innovation Fund (No. ZYGX2021YGCX013).
Author Contributions: The authors confirm their contribution to the paper as follows: YG contributed to the conception and design of the study, and PW prepared the manuscript. GY analyzed the data and prepared some figures. All authors reviewed and approved the manuscript.
Availability of Data and Materials: The datasets generated during and/or analysed during the current study are available from the corresponding author on reasonable request.
Ethics Approval: Not applicable.
Conflicts of Interest: The authors declare that they have no conflicts of interest to report regarding the present study.
References
Allemann P, Demartines N, Bouzourene H, Tempia A, Halkic N (2013). Long-term outcome after liver resection for hepatocellular carcinoma larger than 10 cm. World Journal of Surgery 37: 452–458. https://doi.org/10.1007/s00268-012-1840-5 [Google Scholar] [PubMed] [CrossRef]
Anderson NM, Simon MC (2020). The tumor microenvironment. Current Biology 30: R921–R925. https://doi.org/10.1016/j.cub.2020.06.081 [Google Scholar] [PubMed] [CrossRef]
Balogh J, Victor DIII, Asham EH, Burroughs SG, Boktour M, Saharia A, Li X, Ghobrial RM, Monsour HPJr (2016). Hepatocellular carcinoma: A review. Journal of Hepatocellular Carcinoma 3: 41–53. https://doi.org/10.2147/JHC.S61146 [Google Scholar] [PubMed] [CrossRef]
Batey RG, Burns T, Benson RJ, Byth K (1992). Alcohol consumption and the risk of cirrhosis. The Medical Journal of Australia 156: 413–416. https://doi.org/10.5694/j.1326-5377.1992.tb139846.x [Google Scholar] [PubMed] [CrossRef]
Bertot LC, Sato M, Tateishi R, Yoshida H, Koike K (2011). Mortality and complication rates of percutaneous ablative techniques for the treatment of liver tumors: A systematic review. European Radiology 21: 2584–2596. https://doi.org/10.1007/s00330-011-2222-3 [Google Scholar] [PubMed] [CrossRef]
Bruix J, Raoul JL, Sherman M, Mazzaferro V, Bolondi L et al. (2012). Efficacy and safety of sorafenib in patients with advanced hepatocellular carcinoma: Subanalyses of a phase III trial. Journal of Hepatology 57: 821–829. https://doi.org/10.1016/j.jhep.2012.06.014 [Google Scholar] [PubMed] [CrossRef]
Calle EE, Rodriguez C, Walker-Thurmond K, Thun MJ (2003). Overweight, obesity, and mortality from cancer in a prospectively studied cohort of U.S. adults. The New England Journal of Medicine 348: 1625–1638. https://doi.org/10.1056/NEJMoa021423 [Google Scholar] [PubMed] [CrossRef]
Choo QL, Richman KH, Han JH, Berger K, Lee C et al. (1991). Genetic organization and diversity of the hepatitis C virus. Proceedings of the National Academy of Sciences of the United States of America 88: 2451–2455. https://doi.org/10.1073/pnas.88.6.2451 [Google Scholar] [PubMed] [CrossRef]
Crissien AM, Frenette C (2014). Current management of hepatocellular carcinoma. Gastroenterology & Hepatology 10: 153–161. [Google Scholar]
Desai RJ, Wang SV, Vaduganathan M, Evers T, Schneeweiss S (2020). Comparison of machine learning methods with traditional models for use of administrative claims with electronic medical records to predict heart failure outcomes. JAMA Network Open 3: e1918962. https://doi.org/10.1001/jamanetworkopen.2019.18962 [Google Scholar] [PubMed] [CrossRef]
Deugnier Y, Turlin B (2001). Iron and hepatocellular carcinoma. Journal of Gastroenterology and Hepatology 16: 491–494. https://doi.org/10.1046/j.1440-1746.2001.02430.x [Google Scholar] [PubMed] [CrossRef]
Dyson J, Jaques B, Chattopadyhay D, Lochan R, Graham J et al. (2014). Hepatocellular cancer: The impact of obesity, type 2 diabetes and a multidisciplinary team. Journal of Hepatology 60: 110–117. https://doi.org/10.1016/j.jhep.2013.08.011 [Google Scholar] [PubMed] [CrossRef]
El-Serag HB (2011). Hepatocellular carcinoma. The New England Journal of Medicine 365: 1118–1127. https://doi.org/10.1056/NEJMra1001683 [Google Scholar] [PubMed] [CrossRef]
Fang ZY, Zhang M, Liu JN, Zhao X, Zhang YQ, Fang L (2021). Tanshinone IIA: A review of its anticancer effects. Frontiers in Pharmacology 11: 611087. https://doi.org/10.3389/fphar.2020.611087 [Google Scholar] [PubMed] [CrossRef]
Fu Y, Wei XD, Guo L, Wu K, Le J, Ma Y, Kong X, Tong Y, Wu H (2022). The metabolic and non-metabolic roles of UCK2 in tumor progression. Frontiers in Oncology 12: 904887. https://doi.org/10.3389/fonc.2022.904887 [Google Scholar] [PubMed] [CrossRef]
Gandini S, Botteri E, Iodice S, Boniol M, Lowenfels AB, Maisonneuve P, Boyle P (2008). Tobacco smoking and cancer: A meta-analysis. International Journal of Cancer 122: 155–164. https://doi.org/10.1002/(ISSN)1097-0215 [Google Scholar] [CrossRef]
Gao C, Fang L, Zhao HC, Li JT, Yao SK (2013). Potential role of diabetes mellitus in the progression of cirrhosis to hepatocellular carcinoma: A cross-sectional case-control study from Chinese patients with HBV infection. Hepatobiliary & Pancreatic Diseases International 12: 385–393. https://doi.org/10.1016/S1499-3872(13)60060-0 [Google Scholar] [PubMed] [CrossRef]
Gao J, Yang G, Pi R, Li R, Wang P, Zhang H, Le K, Chen S, Liu P (2008). Tanshinone IIA protects neonatal rat cardiomyocytes from adriamycin-induced apoptosis. Translational Research: The Journal of Laboratory and Clinical Medicine 151: 79–87. https://doi.org/10.1016/j.trsl.2007.11.005 [Google Scholar] [PubMed] [CrossRef]
Green MR, Sambrook J (2018). Quantification of RNA by real-time reverse transcription-polymerase chain reaction (RT-PCR). Cold Spring Harbor Protocols 2018. https://doi.org/10.1101/pdb.prot095042 [Google Scholar] [PubMed] [CrossRef]
Hao DC, Ge GB, Xiao PG (2018). Anticancer drug targets of salvia phytometabolites: Chemistry, biology and omics. Current Drug Targets 19: 1–20. https://doi.org/10.2174/1389450117666161207141020 [Google Scholar] [PubMed] [CrossRef]
Hinshaw DC, Shevde LA (2019). The tumor microenvironment innately modulates cancer progression. Cancer Research 79: 4557–4566. https://doi.org/10.1158/0008-5472.CAN-18-3962 [Google Scholar] [PubMed] [CrossRef]
Huang SY, Chang SF, Liao KF, Chiu SC (2017). Tanshinone IIA inhibits epithelial-mesenchymal transition in bladder cancer cells via modulation of STAT3-CCL2 signaling. International Journal of Molecular Sciences 18: 1616. https://doi.org/10.3390/ijms18081616 [Google Scholar] [PubMed] [CrossRef]
Jieensinue S, Zhu H, Li G, Dong K, Liang M, Li Y (2018). Tanshinone IIA reduces SW837 colorectal cancer cell viability via the promotion of mitochondrial fission by activating JNK-Mff signaling pathways. BMC Cell Biology 19: 21. https://doi.org/10.1186/s12860-018-0174-z [Google Scholar] [PubMed] [CrossRef]
Kantidakis G, Putter H, Lancia C, Boer J, Braat AE, Fiocco M (2020). Survival prediction models since liver transplantation—comparisons between Cox models and machine learning techniques. BMC Medical Research Methodology 20: 277. https://doi.org/10.1186/s12874-020-01153-1 [Google Scholar] [PubMed] [CrossRef]
Kanwal F, Kramer JR, Duan Z, Yu X, White D, El-Serag HB (2016). Trends in the burden of nonalcoholic fatty liver disease in a United States cohort of veterans. Clinical Gastroenterology and Hepatology 14: 301-8.e1-2. https://doi.org/10.1016/j.cgh.2015.08.010 [Google Scholar] [PubMed] [CrossRef]
Larsson SC, Wolk A (2007). Overweight, obesity and risk of liver cancer: A meta-analysis of cohort studies. British Journal of Cancer 97: 1005–1008. https://doi.org/10.1038/sj.bjc.6603932 [Google Scholar] [PubMed] [CrossRef]
Lee HP, Liu YC, Chen PC, Tai HC, Li TM et al. (2017). Tanshinone IIA inhibits angiogenesis in human endothelial progenitor cells in vitro and in vivo. Oncotarget 8: 109217–109227. https://doi.org/10.18632/oncotarget.22649 [Google Scholar] [PubMed] [CrossRef]
Lee YJ, Lee JM, Lee JS, Lee HY, Park BH, Kim YH, Han JK, Choi BI (2015). Hepatocellular carcinoma: Diagnostic performance of multidetector CT and MR imaging–a systematic review and meta-analysis. Radiology 275: 97–109. https://doi.org/10.1148/radiol.14140690 [Google Scholar] [PubMed] [CrossRef]
Lencioni R, Cioni D, Crocetti L, Franchini C, Pina CD, Lera J, Bartolozzi C (2005). Early-stage hepatocellular carcinoma in patients with cirrhosis: Long-term results of percutaneous image-guided radiofrequency ablation. Radiology 234: 961–967. https://doi.org/10.1148/radiol.2343040350 [Google Scholar] [PubMed] [CrossRef]
Li YI, Elmer G, Leboeuf RC (2008). Tanshinone IIA reduces macrophage death induced by hydrogen peroxide by upregulating glutathione peroxidase. Life Sciences 83: 557–562. https://doi.org/10.1016/j.lfs.2008.08.003 [Google Scholar] [PubMed] [CrossRef]
Liao XZ, Gao Y, Huang S, Chen ZZ, Sun LL, Liu JH, Chen HR, Yu L, Zhang JX, Lin LZ (2019). Tanshinone IIA combined with cisplatin synergistically inhibits non-small-cell lung cancer in vitro and in vivo via down-regulating the phosphatidylinositol 3-kinase/Akt signalling pathway. Phytotherapy Research 33: 2298–2309. https://doi.org/10.1002/ptr.6392 [Google Scholar] [PubMed] [CrossRef]
Liu Z, Li M, Hua Q, Li Y, Wang G (2019a). Identification of an eight-lncRNA prognostic model for breast cancer using WGCNA network analysis and a Cox proportional hazards model based on L1-penalized estimation. International Journal of Molecular Medicine 44: 1333–1343. https://doi.org/10.3892/ijmm.2019.4303 [Google Scholar] [PubMed] [CrossRef]
Liu Z, Zhu W, Kong X, Chen X, Sun X, Zhang W, Zhang R (2019b). Tanshinone IIA inhibits glucose metabolism leading to apoptosis in cervical cancer. Oncology Reports 42: 1893–1903. https://doi.org/10.3892/or.2019.7294 [Google Scholar] [PubMed] [CrossRef]
Llovet JM, Ricci S, Mazzaferro V, Hilgard P, Gane E et al. (2008). Sorafenib in advanced hepatocellular carcinoma. The New England Journal of Medicine 359: 378–390. https://doi.org/10.1056/NEJMoa0708857 [Google Scholar] [PubMed] [CrossRef]
Llovet JM, Zucman-Rossi J, Pikarsky E, Sangro B, Schwartz M, Sherman M, Gores G (2016). Hepatocellular carcinoma. Nature Reviews Disease Primers 2: 16018. https://doi.org/10.1038/nrdp.2016.18 [Google Scholar] [PubMed] [CrossRef]
Ma L, Jiang H, Xu X, Zhang C, Niu Y et al. (2019). Tanshinone IIA mediates SMAD7-YAP interaction to inhibit liver cancer growth by inactivating the transforming growth factor beta signaling pathway. Aging 11: 9719–9737. https://doi.org/10.18632/aging.102420 [Google Scholar] [PubMed] [CrossRef]
Mazzaferro V, Regalia E, Doci R, Andreola S, Pulvirenti A, Bozzetti F, Montalto F, Ammatuna M, Morabito A, Gennari L (1996). Liver transplantation for the treatment of small hepatocellular carcinomas in patients with cirrhosis. The New England Journal of Medicine 334: 693–699. https://doi.org/10.1056/NEJM199603143341104 [Google Scholar] [PubMed] [CrossRef]
Newman AM, Steen CB, Liu CL, Gentles AJ, Chaudhuri AA et al. (2019). Determining cell type abundance and expression from bulk tissues with digital cytometry. Nature Biotechnology 37: 773–782. https://doi.org/10.1038/s41587-019-0114-2 [Google Scholar] [PubMed] [CrossRef]
Nolan T, Hands RE, Bustin SA (2006). Quantification of mRNA using real-time RT-PCR. Nature Protocols 1: 1559–1582. https://doi.org/10.1038/nprot.2006.236 [Google Scholar] [PubMed] [CrossRef]
Ott JJ, Stevens GA, Groeger J, Wiersma ST (2012). Global epidemiology of hepatitis B virus infection: New estimates of age-specific HBsAg seroprevalence and endemicity. Vaccine 30: 2212–2219. https://doi.org/10.1016/j.vaccine.2011.12.116 [Google Scholar] [PubMed] [CrossRef]
Reddy JK, Rao MS (2006). Lipid metabolism and liver inflammation. II. Fatty liver disease and fatty acid oxidation. American Journal of Physiology-Gastrointestinal and Liver Physiology 290: G852–858. https://doi.org/10.1152/ajpgi.00521.2005 [Google Scholar] [PubMed] [CrossRef]
Ren X, Wang C, Xie B, Hu L, Chai H, Ding L, Tang L, Xia Y, Dou X (2017). Tanshinone IIA induced cell death via miR30b-p53-PTPN11/SHP2 signaling pathway in human hepatocellular carcinoma cells. European Journal of Pharmacology 796: 233–241. https://doi.org/10.1016/j.ejphar.2016.11.046 [Google Scholar] [PubMed] [CrossRef]
Sangiovanni A, Manini MA, Iavarone M, Romeo R, Forzenigo LV et al. (2010). The diagnostic and economic impact of contrast imaging techniques in the diagnosis of small hepatocellular carcinoma in cirrhosis. Gut 59: 638–644. https://doi.org/10.1136/gut.2009.187286 [Google Scholar] [PubMed] [CrossRef]
Sangro B, Carpanese L, Cianni R, Golfieri R, Gasparini D et al. (2011). Survival after yttrium-90 resin microsphere radioembolization of hepatocellular carcinoma across Barcelona clinic liver cancer stages: A European evaluation. Hepatology 54: 868–878. https://doi.org/10.1002/hep.24451 [Google Scholar] [PubMed] [CrossRef]
Scott IA, Cook D, Coiera EW, Richards B (2019). Machine learning in clinical practice: Prospects and pitfalls. The Medical Journal of Australia 211: 203–205.e1. https://doi.org/10.5694/mja2.50294 [Google Scholar] [PubMed] [CrossRef]
Steen CB, Liu CL, Alizadeh AA, Newman AM (2020). Profiling cell type abundance and expression in bulk tissues with CIBERSORTx. Methods in Molecular Biology 2117: 135–157. https://doi.org/10.1007/978-1-0716-0301-7 [Google Scholar] [CrossRef]
Su CC (2018). Tanshinone IIA can inhibit MiaPaCa2 human pancreatic cancer cells by dual blockade of the Ras/Raf/MEK/ERK and PI3K/AKT/mTOR pathways. Oncology Reports 40: 3102–3111. https://doi.org/10.3892/or.2018.6670 [Google Scholar] [PubMed] [CrossRef]
Takayasu K, Arii S, Ikai I, Omata M, Omata K et al. (2006). Prospective cohort study of transarterial chemoembolization for unresectable hepatocellular carcinoma in 8510 patients. Gastroenterology 131: 461–469. https://doi.org/10.1053/j.gastro.2006.05.021 [Google Scholar] [PubMed] [CrossRef]
Torre LA, Bray F, Siegel RL, Ferlay J, Lortet-Tieulent J, Jemal A (2015). Global cancer statistics, 2012. CA: A Cancer Journal for Clinicians 65: 87–108. https://doi.org/10.3322/caac.21262 [Google Scholar] [PubMed] [CrossRef]
Verslype C, Rosmorduc O, Rougier P, ESMO Guidelines Working Group(2012). Hepatocellular carcinoma: ESMO-ESDO clinical practice guidelines for diagnosis, treatment and follow-up. Annals of Oncology 23: vii41–48. https://doi.org/10.1093/annonc/mds225 [Google Scholar] [PubMed] [CrossRef]
Villanueva A (2019). Hepatocellular carcinoma. The New England Journal of Medicine 380: 1450–1462. https://doi.org/10.1056/NEJMra1713263 [Google Scholar] [PubMed] [CrossRef]
Wang C, Wang X, Gong G, Ben Q, Qiu W, Chen Y, Li G, Wang L (2012). Increased risk of hepatocellular carcinoma in patients with diabetes mellitus: A systematic review and meta-analysis of cohort studies. International Journal of Cancer 130: 1639–1648. https://doi.org/10.1002/ijc.26165 [Google Scholar] [PubMed] [CrossRef]
Wang Z, Zhu J, Liu Y, Liu C, Wang W, Chen F, Ma L (2020). Development and validation of a novel immune-related prognostic model in hepatocellular carcinoma. Journal of Translational Medicine 18: 67. https://doi.org/10.1186/s12967-020-02255-6 [Google Scholar] [PubMed] [CrossRef]
White DL, Tavakoli-Tabasi S, Kuzniarek J, Pascua R, Ramsey DJ, El-Serag HB (2012). Higher serum testosterone is associated with increased risk of advanced hepatitis C-related liver disease in males. Hepatology 55: 759–768. https://doi.org/10.1002/hep.24618 [Google Scholar] [PubMed] [CrossRef]
Yin X, Yin Y, Cao FL, Chen YF, Peng Y, Hou WG, Sun SK, Luo ZJ (2012). Tanshinone IIA attenuates the inflammatory response and apoptosis after traumatic injury of the spinal cord in adult rats. PLoS One 7: e38381. https://doi.org/10.1371/journal.pone.0038381 [Google Scholar] [PubMed] [CrossRef]
Yuan JM, Ross RK, Stanczyk FZ, Govindarajan S, Gao YT, Henderson BE, Yu MC (1995). A cohort study of serum testosterone and hepatocellular carcinoma in Shanghai, China. International Journal of Cancer 63: 491–493. https://doi.org/10.1002/(ISSN)1097-0215 [Google Scholar] [CrossRef]
Zhang X, Zhou Y, Gu YE (2019). Tanshinone IIA induces apoptosis of ovarian cancer cells in vitro and in vivo through attenuation of PI3K/AKT/JNK signaling pathways. Oncology Letters 17: 1896–1902. https://doi.org/10.3892/ol.2018.9744 [Google Scholar] [PubMed] [CrossRef]
Zhang Y, Guo S, Fang J, Peng B, Zhang Y, Cao T (2018). Tanshinone IIA inhibits cell proliferation and tumor growth by downregulating STAT3 in human gastric cancer. Experimental and Therapeutic Medicine 16: 2931–2937. https://doi.org/10.3892/etm.2018.6562 [Google Scholar] [PubMed] [CrossRef]
Zhao D, Tong L, Zhang L, Li H, Wan Y, Zhang T (2016). Tanshinone IIA stabilizes vulnerable plaques by suppressing RAGE signaling and NF-κB activation in apolipoprotein-E-deficient mice. Molecular Medicine Reports 14: 4983–4990. https://doi.org/10.3892/mmr.2016.5916 [Google Scholar] [PubMed] [CrossRef]
Supplementary Materials
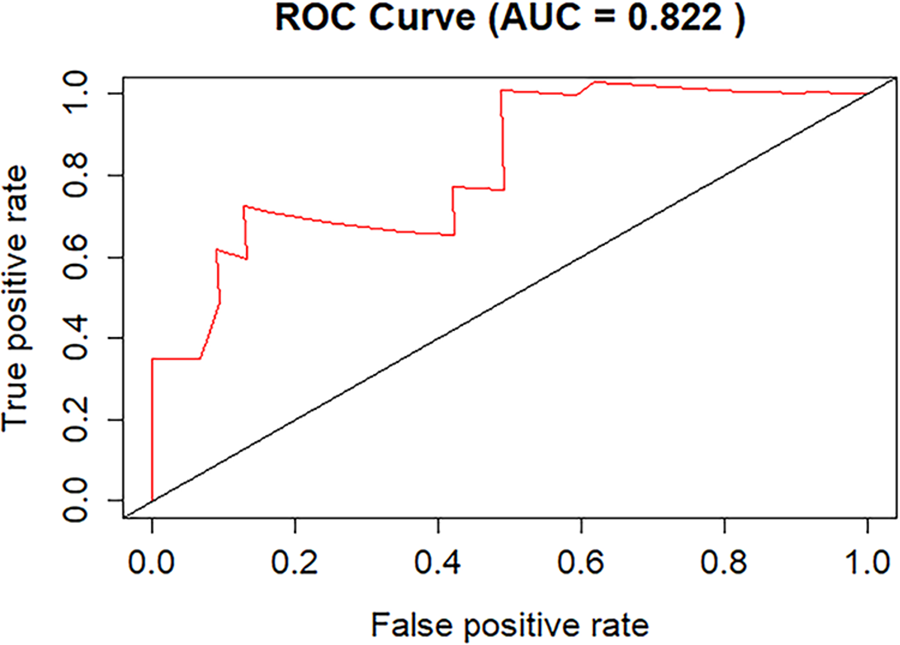
Figure S1: The mean area under the curve (AUC) values of the 5-fold cross-validation.
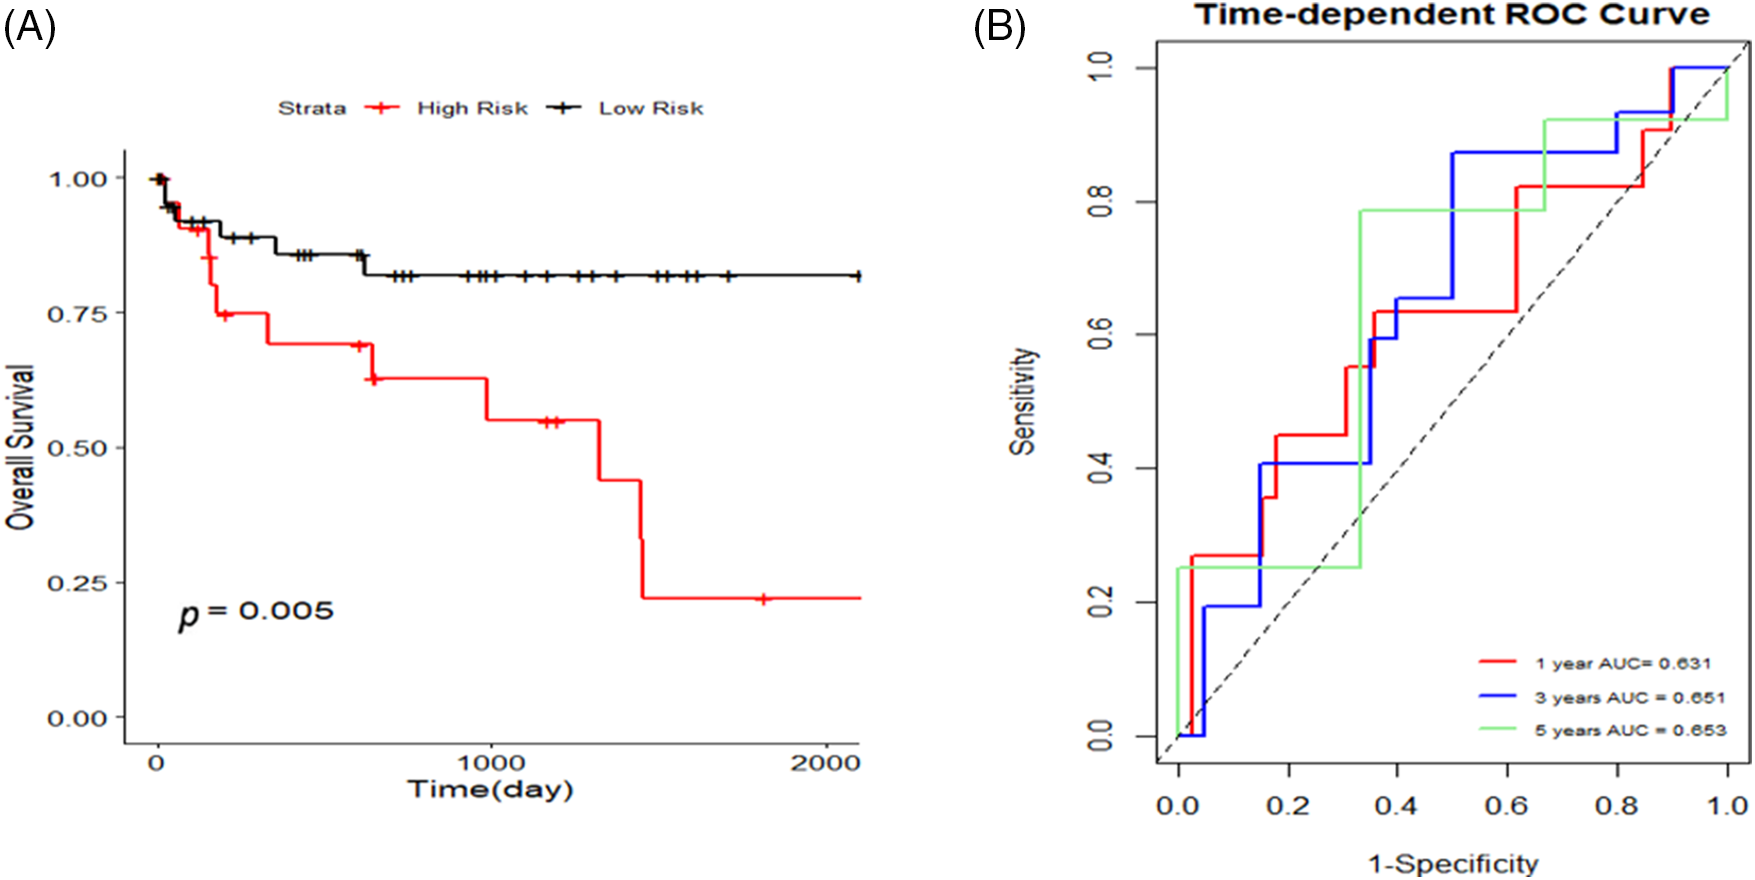
Figure S2: The Gene Expression Omnibus (GEO) dataset GSE76427 was additionally searched for validation, and K-M curves and 1, 3, and 5-year area under the curve (AUC) curves were plotted to validate the risk model.

Cite This Article
 Copyright © 2023 The Author(s). Published by Tech Science Press.
This work is licensed under a Creative Commons Attribution 4.0 International License , which permits unrestricted use, distribution, and reproduction in any medium, provided the original work is properly cited.
 Downloads
 Citation Tools