
 Submit a Paper
 Propose a Special lssue
 Open Access
ARTICLE

The whole-genome survey of Acer griseum, its polymorphic simple sequence repeats development and application
1 Life Science College, Luoyang Normal University, Luoyang, 471934, China
2 The Second Institute of Resources and Environment Investigation of Henan Province, Luoyang, 471000, China
* Corresponding Author: XIAO-JUN ZHOU. Email:
BIOCELL 2023, 47(8), 1907-1913. https://doi.org/10.32604/biocell.2023.030191
Received 27 March 2023; Accepted 08 May 2023; Issue published 28 August 2023
 View Full Text
 Download PDF
Abstract
Background: Acer griseum Pax is an endangered species endemic to China with both ornamental and economic value. However, the lack of information on its genome size and characteristics hinders further work at the genome level. Methods: This paper applied bioinformatics methods to predict the characteristics and patterns of the A. griseum genome, providing an important basis for formulating its whole-genome sequencing scheme. This study also characterized the simple sequence repeats (SSRs) of A. griseum, laying the foundation for the development and application of genome-wide SSR markers. In this study, PE150 sequencing was performed by the BGI MGISEQ platform, and the sequence files were analyzed by the K-mer method to estimate the characteristic information by GCE software. Results: The genome size was finally determined to be 739.63 Mb, its heterozygosity ratio was 1.33%, and the repetition ratio was 65.68%. A total of 825,960 SSR loci were identified in the assembled genome sequence, and primers were successfully designed for 526,020 loci. To verify the effectiveness of these primers, 100 pairs of primers were randomly selected and synthesized, and 81 pairs successfully amplified the target fragments. Fourteen pairs of primers with good polymorphism were selected for principal component analysis of 31 A. griseum individuals from two populations, showing favorable heterozygosity and PIC values. According to the findings, these SSRs might identify genetic variations based on geographic areas. Conclusion: It is suggested that Illumina + PacBio assembly strategy should be used for whole-genome sequencing due to the high heterozygosity rate and high repetition rate of the genome. In addition, the SSR primers designed in batches in this study laid a foundation for the in-depth study of population structure and population maintenance mechanism of A. griseum, which is helpful for the effective conservation and sustainable utilization of this germplasm resource.Keywords
Supplementary Material
Supplementary Material FileAcer is a group of woody plants that combines ornamental value with economic use and is classified as Sapindaceae in the latest APG IV system (Angiosperm Phylogeny Group et al., 2016). As a large genus containing more than 160 species, the intra-genus classification of Acer has not been uniformly concluded, and it still needs to be revised and requires multi-level studies such as fossil evidence, anatomy, morphology, and molecular biology (Grimm et al., 2006). Paperbark maple (Acer griseum Pax) is an endangered species endemic to China (Fang, 1981; Aiello and Crowley, 2019). It is mainly distributed in sparse forests at an altitude of 1500–2000 m in Southwestern Henan, Southern Shaanxi, Southeastern Gansu, Western Hubei, and Eastern Sichuan. Paperbark maple has high value and many uses. Its hardwood can be used to make a variety of valuable implements, and the bark has good fiber content to make rope and paper. In addition to the economic value, paperbark maple trees are beautiful, have a high ornamental value, and are a relatively rare green tree species in the garden (Fang, 1981; Fu, 2020).
So far, the research on A. griseum has focused on germplasm resources investigation, asexual propagation, seed propagation, new variety cultivation, and chemical composition (Maynard and Bassuk, 1990; Chen et al., 2013; Fu, 2020). At the molecular level, Sun (2014) developed 27 polymorphic simple sequence repeats (SSR) molecular markers by constructing a magnetic bead enrichment library, used 11 pairs of primers to study the genetic structure and genetic diversity of A. griseum populations, and preliminarily discussed the possible reasons for the decrease of them. Researchers have also sequenced the chloroplast genome of A. griseum, and studied the populations using cpDNA primers and comparing chloroplast genomes (Wang, 2015; Wang et al., 2017; Ye et al., 2017; Fu, 2020). However, the lack of information on the genome size and characteristics of A. griseum has hindered further work at the genomic level. Therefore, the whole genome sequence of A. griseum is necessary, which will help to reveal its phylogeny and resistance mechanism at the molecular level and provide scientific support for its genetic conservation and rational use of economic value.
Genome survey sequencing based on NGS (next-generation sequencing) technology can be used to cost-effectively assess genomic information such as heterozygosity levels, genome size, and repetitive sequence content, and can be used to develop molecular markers on a large scale. In this study, we aimed to predict the genomic characteristics of A. griseum by NGS technology and then identify SSRs from the genome survey sequencing for microsatellite marker development. This study will provide a framework for the whole genome sequencing in the future and will be useful for subsequent population genetics and molecular species identification of A. griseum.
Experimental materials and DNA extraction
Plant samples were collected from two wild populations of A. griseum in Longyuwan National Forest Park (LY) (33°41′42′N, 111°47′48′E; n = 17) and Duhuigou Ecotourism Area (DH) (34°6′30′N, 112°26′51′E; n = 14) in Henan Province of China. The voucher specimen of A. griseum was stored in the Herbarium of Luoyang Normal University (deposition number: BOT21063). Adult healthy A. griseum leaves were selected and put into a sealed bag. The leaves were dried and preserved by silica-gel desiccant. DNA was extracted from dried leaves by the CTAB method (Clarke, 2009).
Sequencing data and quality control
The qualified DNA samples were randomly interrupted into 300–500 bp long fragments by Covaris ultrasound instrument, and the whole library was prepared by the steps of end repair, A-tail addition, sequencing adaptor addition, purification, polymerase chain reaction, and so on. The constructed library was sequenced by the PE150 on BGI MGISEQ platform. Raw image data files obtained by high-throughput sequencing were analyzed by base calling and converted into raw reads in FASTQ format.
To improve the accuracy of the data, we used SOAPnuke software to filter all the raw reads and obtain clean reads (Chen et al., 2018). The main parameters were -low Qual = 20, -n Rate = 0.005, -qual Rate = 0.5, and other parameters by default. The data were processed as follows: (1) elimination of duplicated reads caused by PCR amplification and other related reasons, (2) removal of the paired reads with connectors, (3) removal of the paired reads with N ratio exceeding 0.5%, and (4) removal of the paired reads with low quality.
The filtered high-quality data were randomly selected from 10,000 pairs of Reads data and compared to the NCBI nucleotide database (NT) by the Basic Local Alignment Search Tool (BLAST) software (Altschul et al., 1990) to evaluate any possible contamination of the samples.
K-mer analysis was used to estimate genome size and heterozygosity as well as repetitive sequence information by pairing sequence files through the GCE software (Liu et al., 2013). In this study, K = 17 was selected for the analysis, thus ensuring that a sufficient number of K-mer were generated to cover the entire genome.
Simple sequence repeats analysis and validation
SSR loci were searched for assembled genomic sequences using MISA1.0 with parameters set to 1-10, 2-6, 3-5, 4-5, 5-5, 6-5 (e.g., 1-10, with a minimum number of repeats of 10 to be detected when mono-nucleotide is the repeat unit) (Beier et al., 2017). In addition, the distance between two SSRs was set to at least 100 bp. If the distance between two SSRs should be greater than or equal to 100 bp, otherwise treat them as one SSR marker. The obtained SSRs in A. griseum were analyzed in three ways: analysis of the microsatellite composition of the genome, the distribution of SSRs, and the dominant repeat motif types.
Primers were designed in the flanking region of the SSR loci using Primer Premier 3.0 software (Untergasser et al., 2012). To verify the validity of these primers, a total of 100 primer pairs were synthesized and verified by PCR amplification in 20 individuals of A. griseum (ten random samples were taken from each population of LY and DH). The PCR procedure was performed in a 15 μL volume containing 7.5 μL 2 × PCR mix (Tiangen, Beijing, China), 20 ng genomic DNA, and 0.25 μM forward and reverse primers under the following conditions: denaturation at 94°C for 5 min, followed by 30 cycles of denaturation at 94°C for 50 s, annealing for 45 s, 72°C for 30 s. The amplified products were subjected to 10% polyacrylamide gel electrophoresis and developed by silver staining.
Principal components analysis (PCoA)
Fourteen pairs of SSR primers with good polymorphism were selected for genetic analysis of 31 individuals from LY and DH populations. The amplified data were input into GenAlEx V6.5, and PCoA was performed according to the genetic distance between different individuals (Smouse and Peakall, 2012).
Evaluation of sequencing quality
The raw and filtered clean data obtained by sequencing are shown in Table 1. High-quality sequencing data were submitted to the NCBI (Registration Number: PRJNA881718). The BLAST results showed that the top five species comparisons with A. griseum were A. pentaphyllum (1.76%), Xanthoceras sorbifolium (0.745%), A. yangbiense (0.695), Pistacia vera (0.545%), and A. triflorum (0.515%). Results indicate that the data generated are reliable and accurate, without exogenous contamination, and can be utilized for further research.
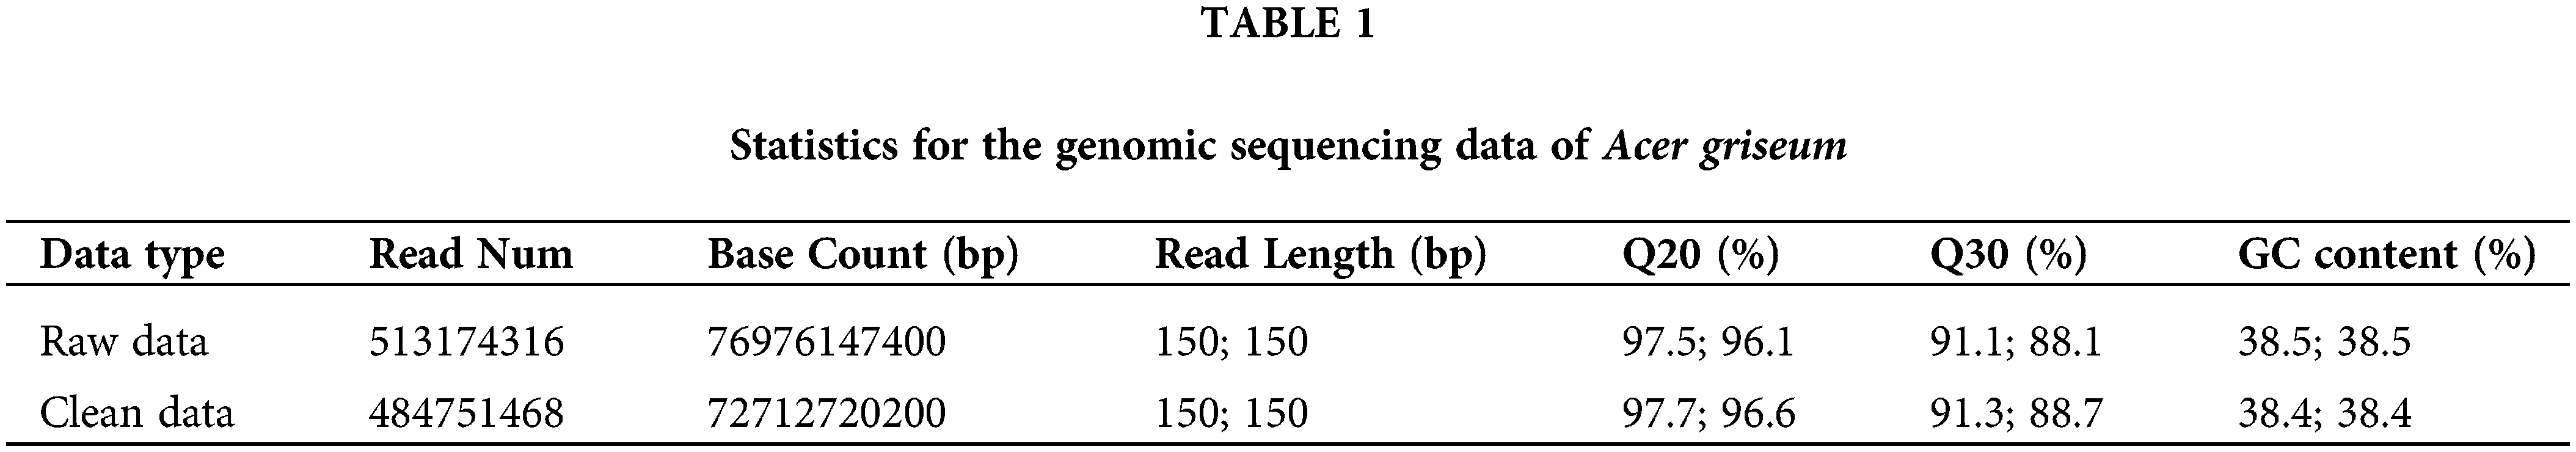
Q20 (%) and Q30 (%), respectively, refer to the percentage of bases with Phred values greater than 20 and 30 in the total base.
K-mer estimates genomic information
The genomic characteristics of A. griseum were analyzed using the K-mer analysis. The value of K was set to 17, and the total number of K-mer was 64,956,696,712. In the K-mer depth distribution shown in Fig. 1, the first peak is located at 41×, which is a heterozygous peak. The dominant peak is located at 82× and has a 2:1 relationship with the first peak, which is similar to the standard peak shape for diploids.
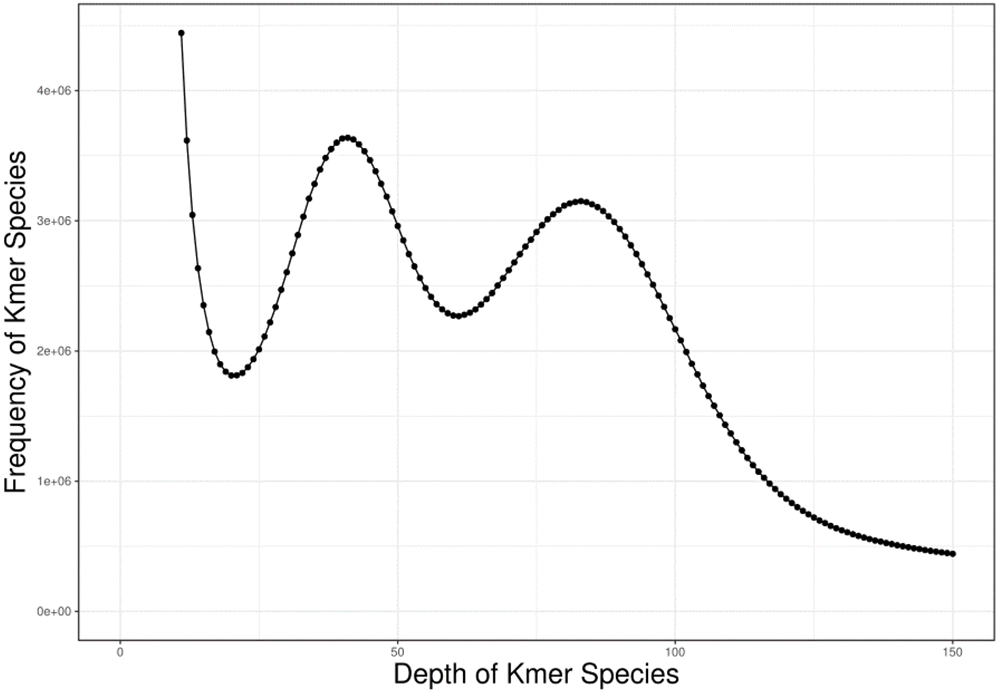
Figure 1: The distribution curve of K-mer (k = 17) of Acer griseum.
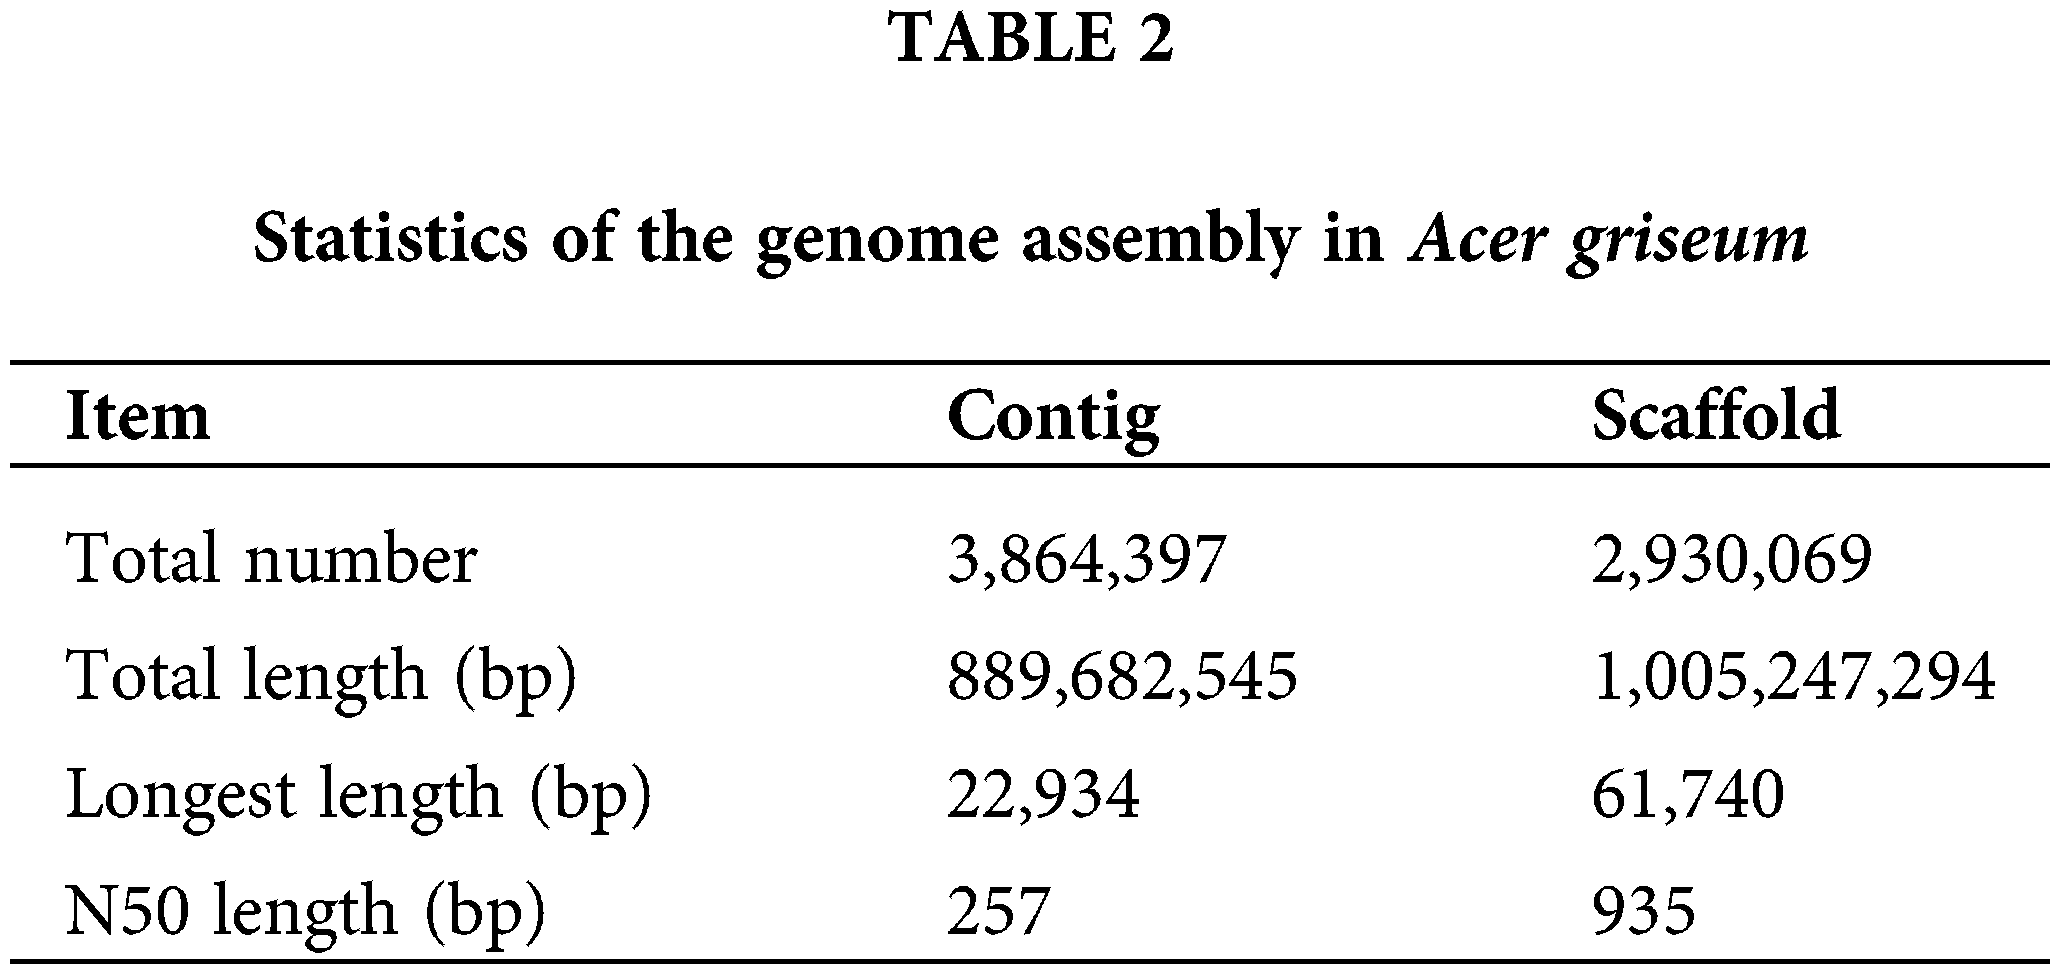
The genome size was the total number of K-mers /K-mer depth. The K-mer depth was calculated from the K-mer distribution curve using GCE software. The final genome size was 739.63 Mb, with a heterozygosity ratio of 1.33% and a repetitive sequences ratio of 65.68%. The software SOAPdenovo2 (Luo et al., 2012) was used for the preliminary assembly of the sequencing data, and the results are mentioned in Table 2.
Genomic simple sequence repeats composition analysis
In this study, a total of 825,960 SSR loci were detected in the 1005.2 Mb genome sequence of A. griseum, suggesting that one SSR locus appeared in 1217.1 bp on average.
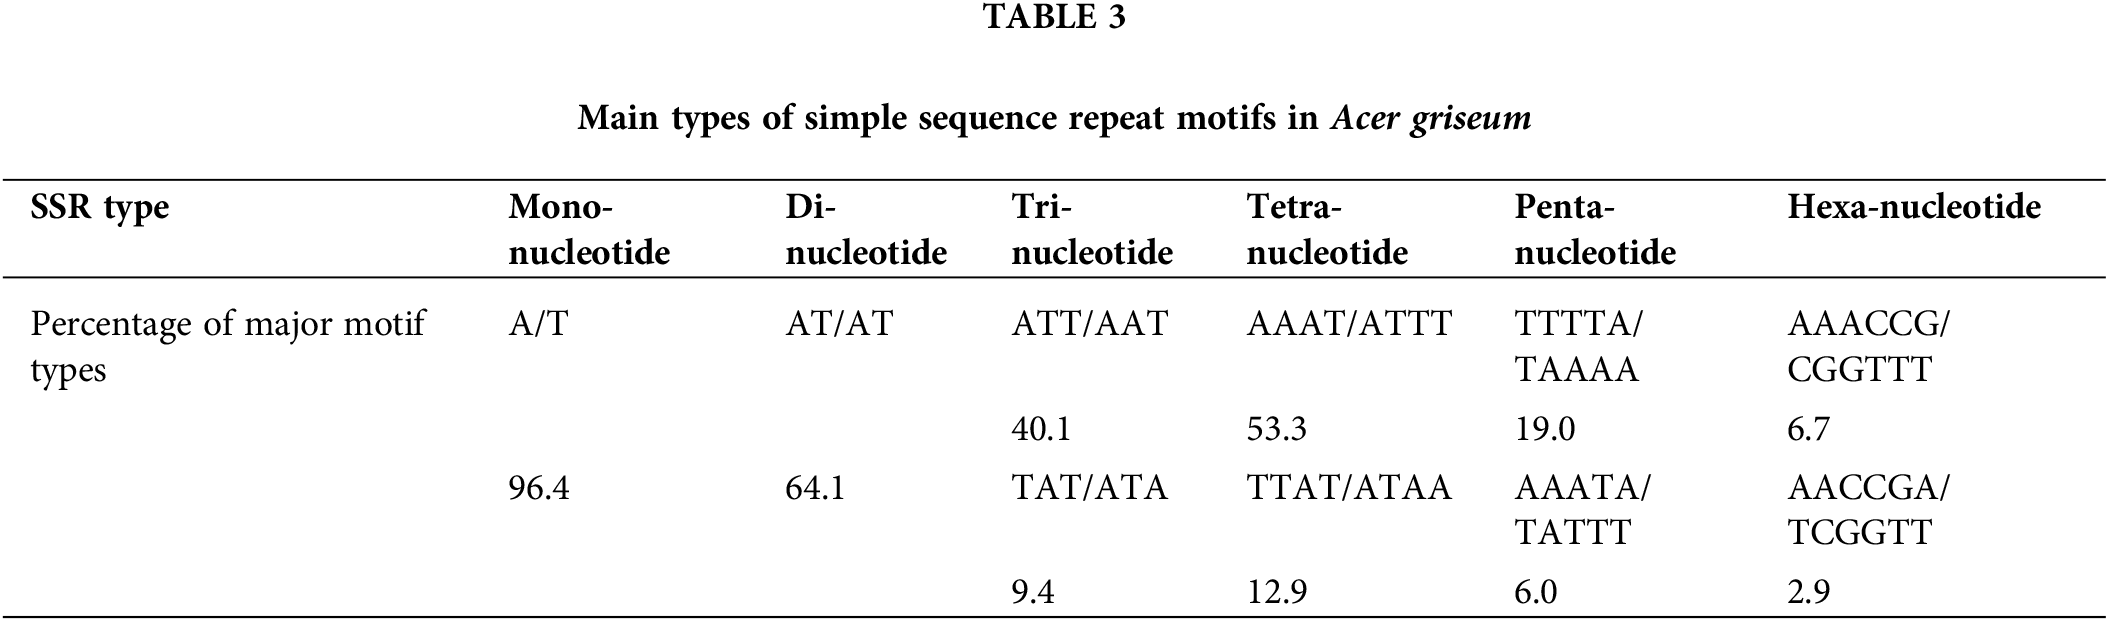
The statistics of different SSR types show that there were 509,385 mono-nucleotide types, accounting for 61.67% of the total, followed by 147,979 di-nucleotide (17.92%), 37,236 tri-nucleotide (4.51%), 10,173 tetra-nucleotide (1.23%), 3,270 penta-nucleotide (0.40%), and hexa-nucleotide type had 3,136 or 0.38% of the total. There were 114,780 composite SSRs, accounting for 13.90% of the total SSRs. The distribution of different types of SSR motifs in A. griseum is mentioned in Fig. 2, and the specific major motifs are shown in Table 3.
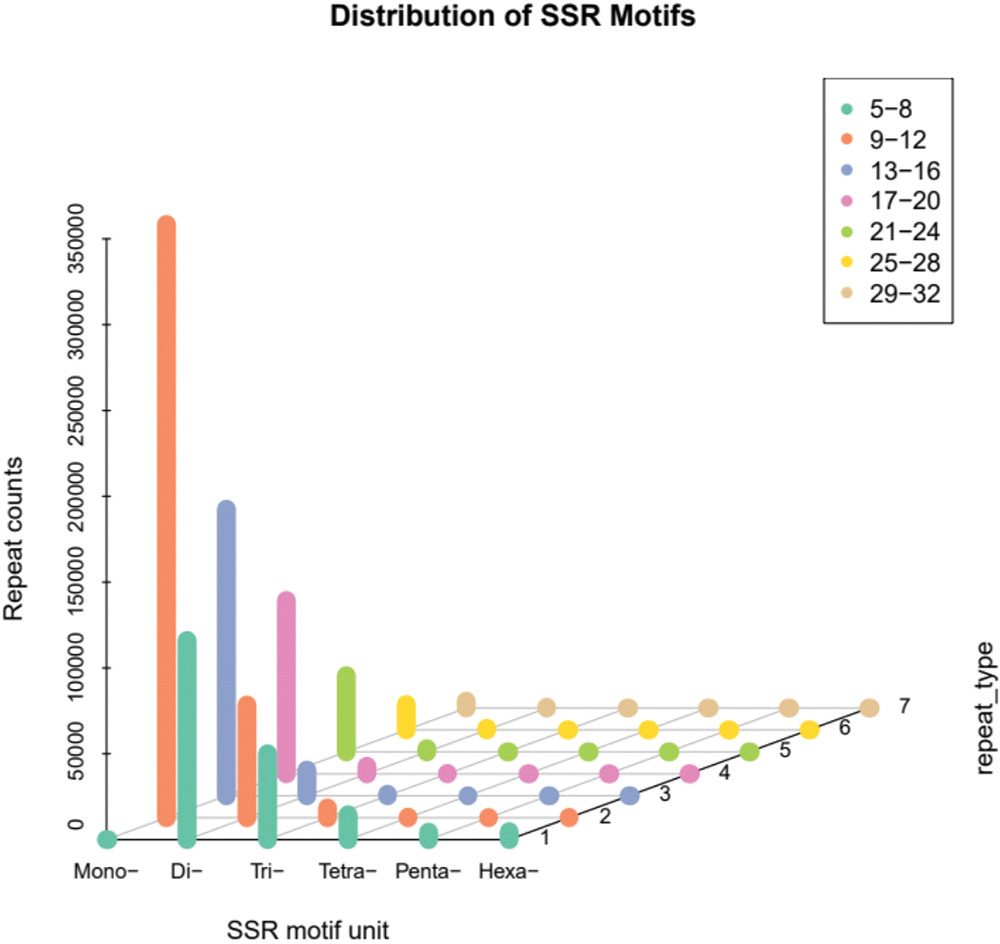
Figure 2: Distribution pattern of simple sequence repeat (SSR) motifs in Acer griseum.
Simple sequence repeats validation and principal component analysis
Among all 825,960 SSR loci, 526,020 were successfully designed with primers. A total of 100 primers were randomly chosen for validation in 20 DNA samples of A. griseum, 81 of which could amplify the target band (Suppl. Table S1). To further identify the effectiveness of these primers, 14 primers with good polymorphism and stable detection results were selected for PCoA analysis of 31 A. griseum individuals from two populations. SSR-PCR amplification profiles are shown in Fig. 3.
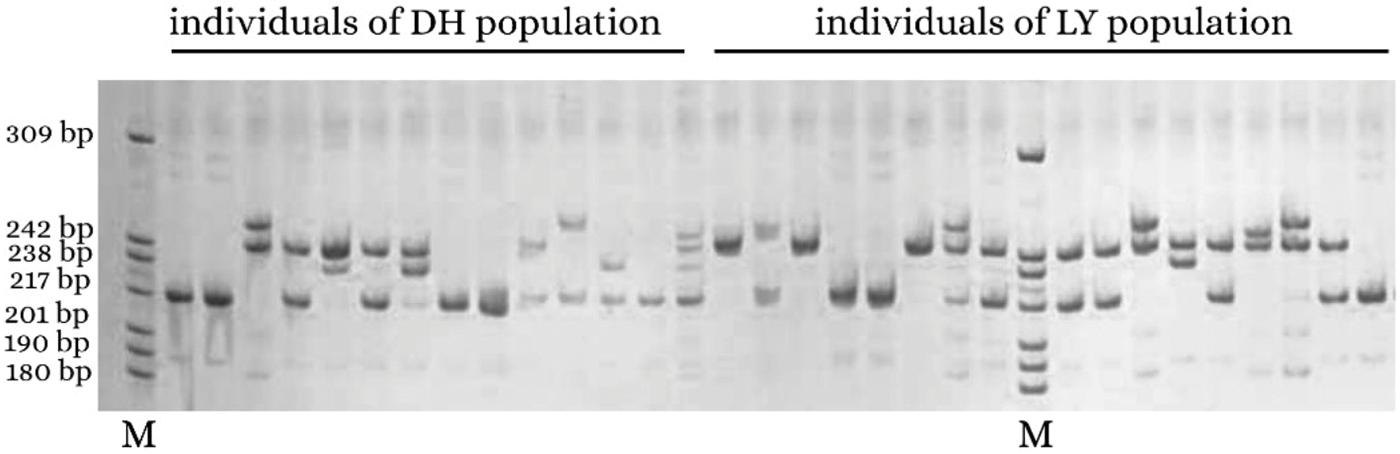
Figure 3: Simple sequence repeat-polymerase chain reaction amplification profile of AG31 primer. M is the DNA marker Pbr322 DNA/MspI.
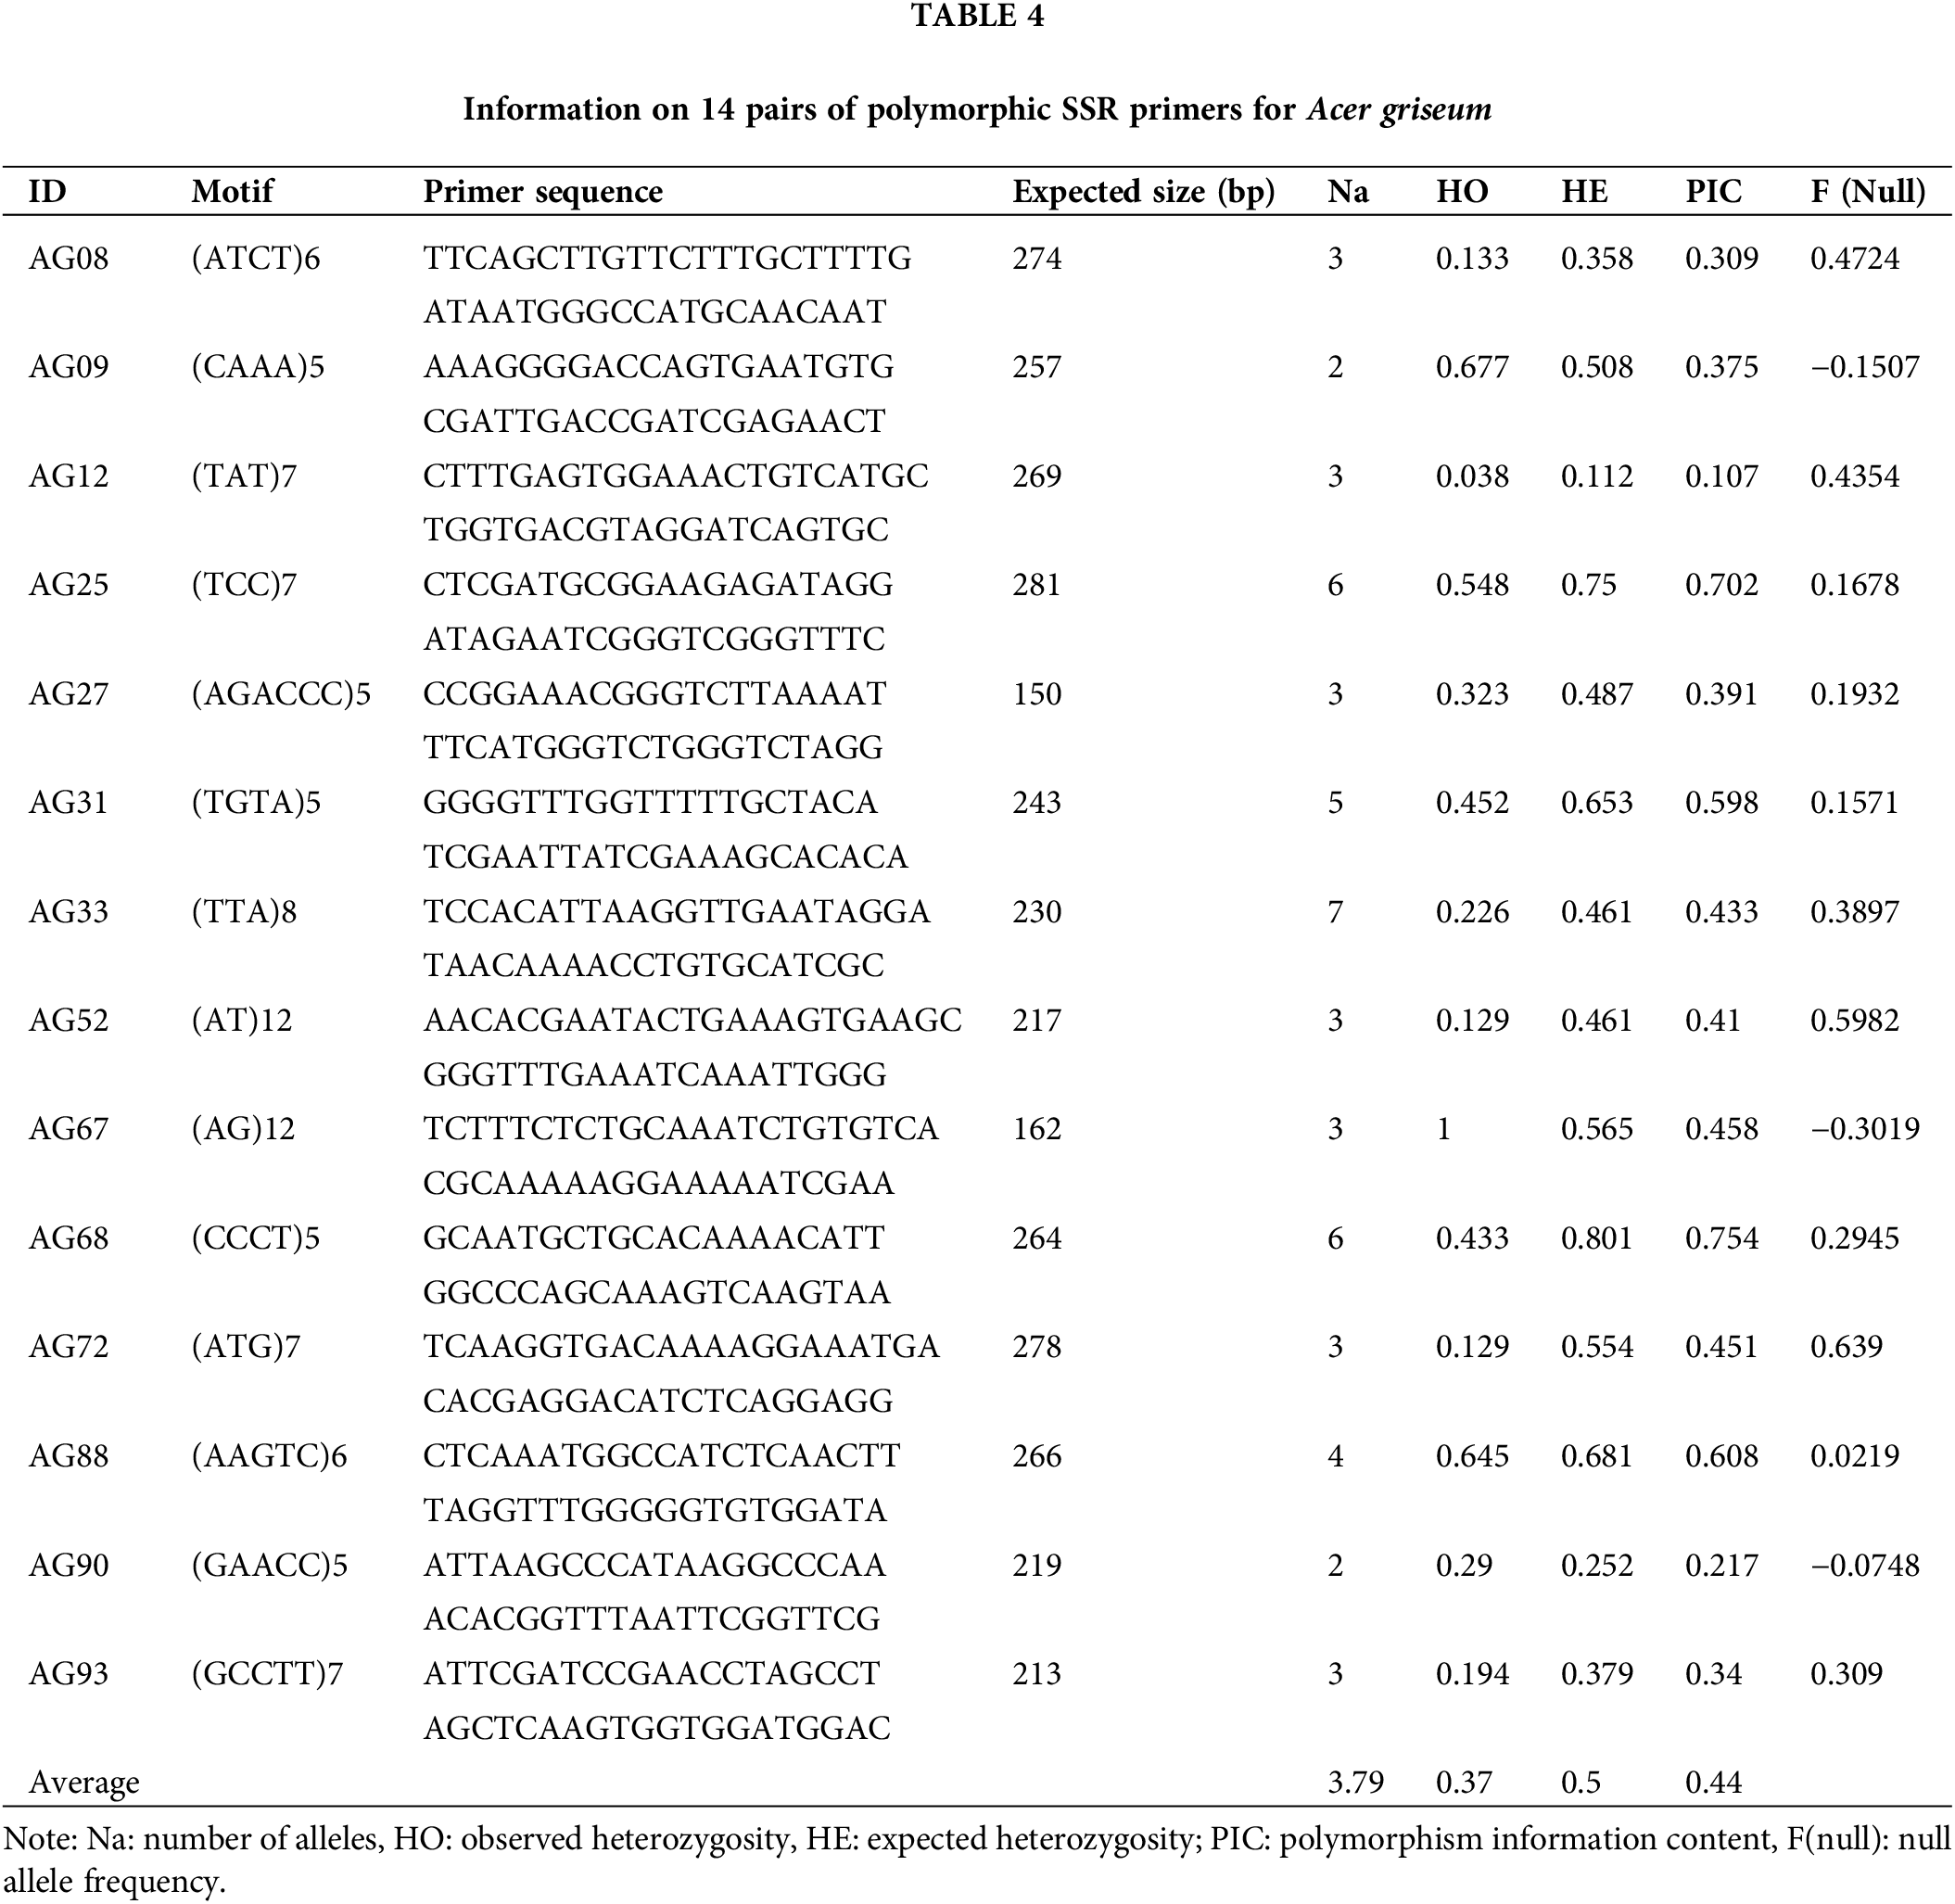
Seventeen individuals from the LY population clustered together and 14 individuals from the DH population clustered together (Fig. 4). The two coordinates represent 22.83% and 16.34%, respectively, of the overall genetic variation. These results indicated that SSR markers developed based on genomic research could identify genetic variation among populations of A. griseum in different geographical locations. Details of the 14 primers are shown in Table 4.
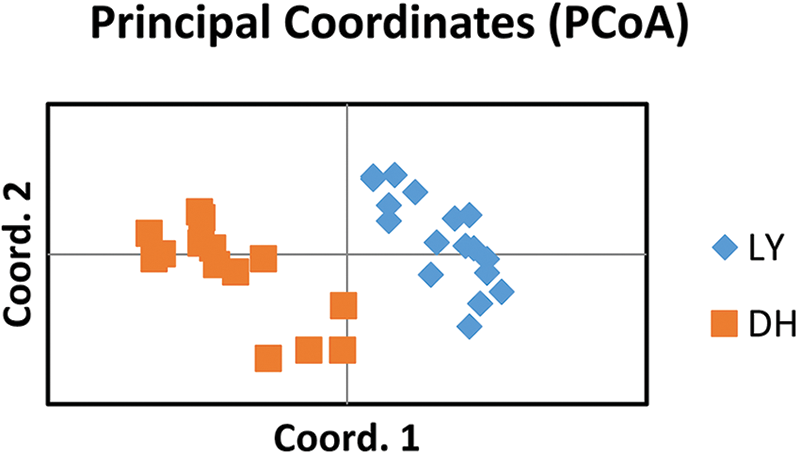
Figure 4: PCoA for the 31 individuals of Acer griseum from the LY and DH populations. Coordinate 1 represents 22.83% of the variation, and coordinate 2 represents 16.34% of the variation.
Before conducting whole genome sequencing work in plants, it is important to assess the genome size and complexity to develop a sequencing protocol. At present, the current methods for genome size determination include flow cytometry and genome survey analysis (Ma et al., 2018; Zhou et al., 2018). When plant genome size is determined by flow cytometry, differences in the results of the same species can occur due to different operations and testing conditions (e.g., lysis methods and internal standard selection) during the test (Doležel et al., 2007; Lin et al., 2019). Genome survey based on next-generation high-throughput sequencing technology has the advantage of obtaining a large number of gene sequences while determining genomic features and is increasingly valued and applied by researchers (Kirkness et al., 2003; Yang et al., 2022).
It is commonly believed that the greater the degree of heterozygosity and the more repetitive fragments in a species genome, the more difficult it is to assemble (Xu et al., 2020). Assembly is considered difficult if the heterozygosity is higher than 0.5% and more difficult if the heterozygosity is higher than 1%. In this study, the heterozygosity rate of A. griseum predicted by the genome survey was 1.33%, and the percentage of repetitive sequences was 65.68%. In case of large heterozygosity and high repetition rate, the de novo assembly of the genome is difficult, and it is recommended to follow up with Illumina + PacBio sequencing assembly strategy for whole genome sequencing.
In this study, different SSR types and the dominant motif of A. griseum were analyzed. The comparative analysis of SSR markers of A. griseum and its relatives showed that the number of mono-nucleotide SSR types was the highest among A. griseum, A. miaotaiense, and A. rubrum, followed by di-nucleotide types. Among them, the di-nucleotide SSR motif of A. griseum was dominated by AT/TA, the same as that of A. truncatum and A. rubrum, and different from that of A. miaotaiense and A. davidii with AG/CT as the main motif. Among the tri-nucleotide SSRs, the main motif of A. griseum, A. truncatum, and A. miaotaiense was AAT/ATT, while A. davidii and A. rubrum were GAA/TTC (Li et al., 2018; Wang et al., 2019; Guo et al., 2021; Mu et al., 2021). The differences in SSR types and main motifs of these plants may be related to the biological characteristics of the species, or different sequencing platforms, search criteria, and other factors.
The expected heterozygosity obtained using microsatellites was in the range of 0.3~0.8 for high genetic diversity (Takezaki and Nei, 1996; Zhou et al., 2022). The average observed heterozygosity (Ho = 0.37) and expected heterozygosity (He = 0.5) of the 14 polymorphic SSR loci in the study were consistent with the criteria set for high genetic diversity. When Bostein et al. (1980) proposed the polymorphic information content index (PIC) for measuring the degree of gene variation, they considered a locus to be highly polymorphic when PIC > 0.5, moderately polymorphic when 0.25 < PIC < 0.5, and less polymorphic when PIC < 0.25. In this study, all 13 loci except for the AG12 locus were moderately or highly polymorphic. PCoA is a powerful tool for assessing population genetic variation. The results indicate that the polymorphic SSR markers proposed in the study can be effectively used for the genetic analysis of A. griseum, laying the foundation for genetic variation research and effective conservation of this species.
Funding Statement: This work was supported by the National Natural Science Foundation of China [Grant No. 31870697].
Author Contributions: The authors confirm contribution to the paper as follows: study conception and design: X.J.Z.; data collection: Y.W.T.; analysis and interpretation of results: Y.W.T., R.H.L; draft manuscript preparation: X.J.Z., Y.W.T. All authors reviewed the results and approved the final version of the manuscript.
Availability of Data and Materials: All data generated or analyzed during this study are included in this published article and its supplementary information files.
Ethics Approval: Not applicable.
Conflicts of Interest: The authors declare that they have no conflicts of interest to report regarding the present study.
Supplementary Materials: The supplementary materials are available at DOI: 10.32604/biocell.2023.030191.
References
Aiello A, Crowley D (2019). Acer griseum. The IUCN red list of threatened species: e.T193593A2244567 https://doi.org/10.2305/IUCN.UK.2019-1.RLTS.T193593A2244567 [Google Scholar] [CrossRef]
Altschul SF, Gish W, Miller W, Myers EW, Lipman DJ (1990). Basic local alignment search tool. Journal of Molecular Biology 215: 403–410. https://doi.org/10.1016/S0022-2836(05)80360-2 [Google Scholar] [PubMed] [CrossRef]
Angiosperm Phylogeny Group, Chase MW, Christenhusz MJ, Fay MF, Byng JW et al. (2016). An update of the angiosperm phylogeny group classification for the orders and families of flowering plants: APG IV. Botanical Journal of the Linnean Society 181: 1–20. https://doi.org/10.1111/boj.12385 [Google Scholar] [CrossRef]
Beier S, Thiel T, Münch T, Scholz U, Mascher M (2017). MISA-web: A web server for microsatellite prediction. Bioinformatics 33: 2583–2585. https://doi.org/10.1093/bioinformatics/btx198 [Google Scholar] [PubMed] [CrossRef]
Bostein D, Whrite RL, Skolnick M, Davis RW (1980). Construction of a genetic linkage map in man using restriction fragment length polymorphisms. American Journal of Human Genetics 32: 314–331. [Google Scholar] [PubMed]
Chen Y, Chen Y, Shi C, Huang Z, Zhang Y et al. (2018). SOAPnuke: A MapReduce acceleration-supported software for integrated quality control and preprocessing of high-throughput sequencing data. GigaScience 7: 1–6. https://doi.org/10.1093/gigascience/gix120 [Google Scholar] [PubMed] [CrossRef]
Chen P, Yu XD, Zhang CH, Zheng YQ, Shun S, Cheng BB, Zhu CB (2013). Natural regeneration of Acer griseum, an endemic species in China. Scientia Silvae Sinicae 49: 159–164. https://doi.org/10.11707/j.1001-7488.20130322 [Google Scholar] [CrossRef]
Clarke JD (2009). Cetyltrimethyl ammonium bromide (CTAB) DNA miniprep for plant DNA isolation. Cold Spring Harbor Protocols 3: pdb.prot5177. https://doi.org/10.1101/pdb.prot5177 [Google Scholar] [PubMed] [CrossRef]
Doležel J, Greilhuber J, Suda J (2007). Estimation of nuclear DNA content in plants using flow cytometry. Nature Protocols 2: 2233–2244. https://doi.org/10.1038/nprot.2007.310 [Google Scholar] [PubMed] [CrossRef]
Fang WP (1981). Flora of China, vol. 46, pp. 69–273. Beijing, China: Science Press. [Google Scholar]
Fu QD (2020). Variation of Chloroplast Genomes in Acer griseum and Its Phylogenetic Relationship with Related Species. Beijing, China: Chinese Academy of Forestry. https://doi.org/10.27625/d.cnki.gzlky.2020.000123 [Google Scholar] [CrossRef]
Grimm GW, Renner SS, Stamatakis A, Hemleben V (2006). A nuclear ribosomal DNA phylogeny of Acer inferred with maximum likelihood, splits graphs, and motif analysis of 606 sequences. Evolutionary Bioinformatics 2: 7–22. https://doi.org/10.1177/117693430600200014 [Google Scholar] [CrossRef]
Guo C, Chen Y, Wang Y, Tan F, Ke PB, Sha WF, Li YJ (2021). Sequence analysis of SSR in transcriptome of American red maple. Journal of Central South University of Forestry & Technology 41: 132–141. https://doi.org/10.14067/j.cnki.1673-923x.2021.07.016 [Google Scholar] [CrossRef]
Kirkness EF, Bafna V, Halpern AL, Levy S, Remington K et al. (2003). The dog genome: Survey sequencing and comparative analysis. Science 301: 1898–1903. https://doi.org/10.1126/science.108643 [Google Scholar] [CrossRef]
Li X, Li M, Hou L, Zhang Z, Pang X, Li Y (2018). De novo transcriptome assembly and population genetic analyses for an endangered Chinese endemic Acer miaotaiense (Aceraceae). Genes 9: 378. https://doi.org/10.3390/genes9080378 [Google Scholar] [PubMed] [CrossRef]
Lin H, Han XW, Lan SR, Ma XK (2019). Estimation of genome size of two Cymbidium by flow cytometry. Journal of Forest and Environment. 39: 616–620. https://doi.org/10.13324/j.cnki.jfcf.2019.06.008 [Google Scholar] [CrossRef]
Liu B, Shi Y, Yuan J, Hu X, Zhang H, Li N, Li Z, Chen Y, Mu D, Fan W (2013). Estimation of genomic characteristics by analyzing k-mer frequency in de novo genome projects. arXiv preprint arXiv: 1308.2012 https://doi.org/10.48550/arXiv.1308.2012 [Google Scholar] [CrossRef]
Luo R, Liu B, Xie Y, Li Z, Huang W et al. (2012). SOAPdenovo2: An empirically improved memory-efficient short-read de novo assembler. GigaScience 1: 8. https://doi.org/10.1186/2047-217X-1-18 [Google Scholar] [PubMed] [CrossRef]
Ma QY, Li SS, Ma X, Wen J, Zhu L, Tang L, Li R, Guo W, Li Q (2018). Estimation of genome size of two Acer Linn. by flow cytometry. Journal of Nanjing Forestry University 61: 201–205. https://doi.org/10.3969/j.issn.1000-2006.201711030 [Google Scholar] [CrossRef]
Maynard BK, Bassuk NL (1990). Rooting softwood cuttings of Acer griseum: Promotion by stock plant etiolation, inhibition by catechol. HortScience 25: 200–202. https://doi.org/10.21273/HORTSCI.25.2.200 [Google Scholar] [PubMed] [CrossRef]
Mu Y, Bai YH, Wu J, Dou DQ, Zhang RL (2021). Development and versatility analysis of EST-SSR markers based on transcriptome sequence of Acer davidii. Molecular Plant Breeding. https://kns.cnki.net/kcms/detail/46.1068.S.20211223.1936.017.html [Google Scholar]
Smouse RPP, Peakall R (2012). GenAlEx 6.5: Genetic analysis in Excel. Population genetic software for teaching and research-an update. Bioinformatics 28: 2537–2539. https://doi.org/10.1093/bioinformatics/bts460 [Google Scholar] [PubMed] [CrossRef]
Sun S (2014). Study on Genetic Variation of Natural Populations in Acer griseum Based on SSR Markers. Beijing, China: Chinese Academy of Forestry. [Google Scholar]
Takezaki N, Nei M (1996). Genetic distances and reconstruction of phylogenetic trees from microsatellite DNA. Genetics 144: 389–399. https://doi.org/10.1093/genetics/144.1.389 [Google Scholar] [PubMed] [CrossRef]
Untergasser A, Cutcutache I, Koressaar T, Ye J, Faircloth BC, Remm M, Rozen SG (2012). Primer3-new capabilities and interfaces. Nucleic Acids Research 40: e115. https://doi.org/10.1093/nar/gks596 [Google Scholar] [PubMed] [CrossRef]
Wang JH (2015). Preliminary Study on Growth Performance and Molecular Phylogeography of Natural Populations in an Endangered Maple, Acer griseum (Dicotyledoneae: SapindaceaeEndemic to China. Beijing: Chinese Academy of Forestry. [Google Scholar]
Wang WC, Chen SY, Zhang XZ (2017). The complete chloroplast genome of the endangered Chinese paperbark maple, Acer griseum (Sapindaceae). Conservation Genetics Resources 9: 527–529. https://doi.org/10.1007/s12686-017-0715-3 [Google Scholar] [CrossRef]
Wang R, Fan J, Chang P, Zhu L, Zhao M, Li L (2019). Genome survey sequencing of Acer truncatum Bunge to identify genomic information, simple sequence repeat (SSR) markers and complete chloroplast genome. Forests 10: 87. https://doi.org/10.3390/f10020087 [Google Scholar] [CrossRef]
Xu YL, Jin JJ, Zhao YZ, Wei P, Xi JQ, Yang J, Cao PJ, Zhang JF (2020). Genome survey of Lasioderma serricorne based on high-throughput sequencing. Tobacco Science & Technology 53: 1–6. https://doi.org/10.16135/j.issn1002-0861.2020.0211 [Google Scholar] [CrossRef]
Yang T, Ning Z, Liu Y, Zhang S, Gao T (2022). Genome-wide survey and genetic characteristics of Ophichthus evermanni based on illumina sequencing platform. Bioscience Reports 42: BSR20220460. https://doi.org/10.1042/BSR20220460 [Google Scholar] [PubMed] [CrossRef]
Ye XM, Yu XD, Fu QD (2017). Differential analysis of non-coding chloroplast DNA sequences in Acer griseum. Forest Research 30: 674–678. https://doi.org/10.13275/j.cnki.lykxyj.2017.04.020 [Google Scholar] [CrossRef]
Zhou W, Li B, Li L, Ma W, Liu Y, Feng S, Wang Z (2018). Genome survey sequencing of Dioscorea zingiberensis. Genome 61: 567–574. https://doi.org/10.1139/gen-2018-0011 [Google Scholar] [PubMed] [CrossRef]
Zhou X, Lu X, Wang X (2022). Development of polymorphic SSR markers and their applicability in genetic diversity evaluation in Euptelea pleiosperma. BIOCELL 46: 2489–2495. https://doi.org/10.32604/biocell.2022.020311 [Google Scholar] [CrossRef]
TABLE S1. The information for 81 pairs of simple sequence repeat (SSR) primers in Acer griseum
Cite This Article
 Copyright © 2023 The Author(s). Published by Tech Science Press.
This work is licensed under a Creative Commons Attribution 4.0 International License , which permits unrestricted use, distribution, and reproduction in any medium, provided the original work is properly cited.
 Downloads
 Citation Tools