
 Submit a Paper
 Propose a Special lssue
 Open Access
ARTICLE

Integrative Analysis of scRNA-Seq and Bulk RNA-Seq Reveals Novel Transcription Factor Regulating Endothelial Heterogeneity Induced by Lrg1 Following Cerebral Ischemia-Reperfusion
1 Department of pharmacy, The First Affiliated Hospital, Jiangxi Medical College, Nanchang University, Nanchang, 330006, China
2 School of Pharmacy, Jiangxi Medical College, Nanchang University, Nanchang, 330036, China
3 Institute of Chinese Materia Medica, Jiangxi Provincial Institute of Traditional Chinese Medicine, Nanchang, 330077, China
4 College of Pharmacy, Hubei University of Chinese Medicine, Wuhan, 430000, China
5 Key Laboratory of Rare Neurological Diseases of Jiangxi Provincial Health Commission, The First Affiliated Hospital, Jiangxi Medical College, Nanchang University, Nanchang, 330036, China
* Corresponding Author: YANNI LV. Email:
BIOCELL 2026, 50(1), 12 https://doi.org/10.32604/biocell.2025.073401
Received 17 September 2025; Accepted 26 November 2025; Issue published 23 January 2026
 View Full Text
 Download PDF
Abstract
Objective: Leucine-rich alpha-2 glycoprotein 1 (Lrg1) could regulate diverse cells in cerebral ischemia-reperfusion. Our study seeks to uncover Lrg1’s impact on endothelial cell heterogeneity via differentiation pathways and transcription factors. Method: The CSOmap model measured cell-to-brain-center distances using single-cell RNA sequencing (scRNA-seq) data in middle cerebral artery occlusion reperfusion (MCAO/R). Monocle2 mapped endothelial differentiation paths. Gene set enrichment analysis (GSEA) analyzed endothelial subcluster variations. Database searches revealed a zinc finger MIZ-type containing 1 protein-frizzled 3 (Zmiz1-Fzd3) promoter interaction. Endothelial cells were transfected with a Fzd3 promoter-luciferase plasmid. Polymerase chain reaction (PCR) and western blotting assessed MCAO/R or Zmiz1 overexpression effects on Fzd3-related mRNA and proteins. A retroviral vector carrying Zmiz1 was injected into the brains of mice to study its effect on Fzd3. Result: Lrg1−/− mice exhibited elevated cell adhesion proteins and decreased microvascular leakage after MCAO/R. CSOmap showed widened astrocyte spacing in these mice. RSS revealed Zmiz1 overexpression in MCAO/R+Lrg1−/− mice. MCAO/R and pcDNA3-Zmiz1 transfection both enhanced luciferase activity with Fzd3, indicating Zmiz1 binding to Fzd3. Retroviral Zmiz1 injection or knockdown disrupted ischemic brain tight junctions, highlighting Zmiz1’s key role in blood-brain barrier protection, likely through Fzd3 pathway modulation. Conclusion: The findings indicate Lrg1 knockout induces endothelial differentiation by activating Zmiz1, which is crucial for maintaining blood-brain barrier function, possibly via modulating the Fzd3 pathway.Keywords
Supplementary Material
Supplementary Material FileAbbreviations
| scRNA-seq | Single-cell RNA sequencing |
| Lrg1 | Leucine-rich alpha-2 glycoprotein 1 |
| Zmiz1 | Zinc finger MIZ-type containing 1 |
| CSOmap | Cell spatial organization |
| GSEA | Gene Set Enrichment Analysis |
| Myd88 | Myeloid differentiation primary response gene 88 |
| NF-κB | Nuclear factor kappa B |
| Map | Microtubule-associated proteins |
| Fzd3 | Frizzled class receptor 3 |
| Lrp5 | LDL receptor related protein 5 |
| Ifn-I | Type I interferon |
| MCAO/R | Middle cerebral artery occlusion/reperfusion |
| Ets1 | ETS proto-oncogene 1 |
| Znf281 | Zinc finger protein 281 |
| Znf672 | Zinc finger protein 672 |
| Ppar-γ | Peroxisome proliferator activated receptor gamma |
| Tcf4 | Transcription factor 4 |
| Sox4 | SRY-box 4 |
| Smad1 | SMAD family member 1 |
| Gsk-3β | Glycogen synthase kinase 3 beta |
| cAMP | cAMP cyclic adenosine monophosphate |
Endothelial cells serve as the fundamental structural and functional cornerstone of the blood-brain barrier. Endothelial cells are not only blood vessel barriers, but also functional organs, involved in the regulation of vascular tension, coagulation, angiogenesis, inflammation, immune response, matrix synthesis, and other pathological processes. A recently published Nature paper overviewed recent research on endothelial cell senescence. The phenomenon of endothelial cell senescence has emerged as a crucial predisposing factor for a wide spectrum of cardiovascular and metabolic disorders [1]. Several studies pointed out that endothelial cells are heterogeneous populations. Endothelial cells are highly sensitive to perturbations from the central nervous system, and their phenotype and function change over different times based on the responses [2]. Under conditions of chronic cerebral hypoperfusion, the dysfunction of specific venous endothelial cells acts as a pivotal initiating factor in the pathogenesis of cerebrovascular diseases and cognitive impairment [3]. According to the new report, the key phenotypic population of vascular endothelial heterogeneity could release pro-inflammatory factors, leading to cardiovascular and cerebrovascular diseases [1].
The breakthrough in single-cell RNA sequencing (scRNA-seq) technology makes it a potent tool for studying vascular endothelium mechanisms, revealing the molecular basis of endothelial cell heterogeneity across organs, their organ-specific functions, and disease roles. Endothelial cell heterogeneity varies greatly with physiological states, crucial for organ development, function, and closely linked to cardiovascular, cerebrovascular, and neurodegenerative diseases [4]. For example, studies have shown that among the endothelial cell lineages, mitotic endothelial cells initially give rise to vein endothelial cells, which subsequently differentiate into intermediate capillary endothelial cells and tip cells, ultimately maturing into arterial endothelial cells [5]. A total of 6 vascular endothelial cell subsets have been identified in the brain tissue of cerebral ischemic mice, of which capillary endothelial cell subsets and arterial endothelial cell subsets expressed IFN signaling genes, which are closely related to brain cell apoptosis, hypoxia, oxidative phosphorylation, and inflammation regulation [6]. Using scRNA-seq, researchers comprehensively analyzed endothelial cell heterogeneity across the cerebral cortex, hippocampus, cerebellum, spinal cord, striatum, thalamus, hypothalamus, midbrain, and medulla in the male mice brain [7]. However, the current literature on transcription factors regulating endothelial cell heterogeneity remains limited, warranting further investigation.
Lrg1 (Leucine-rich α2-glycoprotein 1) is the most important protein in its leucine-rich repeating family. Previous research indicated that Lrg1 induced upregulation of Alk1 and facilitates cell apoptosis and autophagy via the Tgfβ-Smad1/5 signaling cascade, consequently aggravating ischemia reperfusion-induced injury [8]. Following ischemic brain injury caused by MCAO in rats, Lrg1 potentially stimulates angiogenesis through upregulation of the Tgf-β1 signaling pathway [9]. In recent years, the link between Lrg1 and stroke patients’ clinical prognosis has become a research focus. Plasma Lrg1 levels were measured in 150 acute ischemic stroke patients at admission and on days 3, 7, and 30 post-admission. Lrg1 correlated with blood lipids, inflammatory markers, and short-term acute ischemic stroke prognosis. Patients with stroke recurrence had notably higher Lrg1 levels on days 7 and 30 post-admission compared to non-recurrent cases [10]. In acute ischemic stroke, Lrg1 was associated with reduced Th2 and Treg cells, increased Th17 cells, cognitive impairment, and poor neurological recovery [11]. Additionally, Lrg1 shows promise as a biomarker for disease severity, delayed cerebral ischemia prediction, and functional outcome assessment after subarachnoid hemorrhage [12]. We have made a theoretical study of Lrg1 [13], especially on Lrg1−/− mice. Our findings have corroborated that Lrg1 modulates a myriad of pathological processes associated with cerebral ischemia-reperfusion injury by influencing the functional states of diverse cell types [14]. In the research process, we also discovered some new data unpublished in the previous paper. There existed 10 subclusters of endothelial cells in wild type (WT) type and Lrg1−/− mice brain after cerebral ischemia–reperfusion injury, breaking the single perspective of the endothelial concept.
We hoped that the Lrg1-modulated heterogeneous endothelial cell subclusters would enable us to see deeper into the related mechanism than before. To gain a deeper understanding of the differentiation trajectory and regulatory transcription factor dynamics of endothelial cells following cerebral ischemia-reperfusion, we adopt many methods, including scRNA-seq, bulk RNA-seq, CSOmap model, and experimental methods, to disclose the mechanism.
2.1.1 Animals and Ethics Approval
Wild-type C57BL/6 mice (male, 8–10 weeks) weighing 18–22 g were obtained from the College of Veterinary Medicine, Yangzhou University (Institute of Comparative Medicine) (certificate No. SCXK 2021–0003). Lrg1 knockout mice (strain designation: KOCMP-76905-Lrg1-B6N-VA) were obtained from Cyagen Biosciences Corporation on a C57BL/6N background (C57BL/6N-Lrg1em1cyagen). Targeted disruption was achieved by deleting a ~1940 bp genomic fragment encompassing exon 1 and the TGA stop codon within exon 2 (Transcript: NSMUST00000041357). A successful knockout was confirmed via PCR-based genotyping. The Lrg1−/− line was subsequently backcrossed for four generations to C57BL/6N mice to ensure genetic homogeneity. Experimental assays comprised 3-month-old animals (18–22 g) housed in a SPF-compliant IVC environment at Nanchang University. Environmental conditions were strictly regulated with a 12-h light-dark cycle, 22 ± 2°C, and relative humidity of 55 ± 10%. All animal procedures were performed in accordance with institutional ethical guidelines and ARRIVE criteria to ensure humane treatment and minimize distress. The primary sources of animal suffering in MCAO/R (middle cerebral artery occlusion reperfusion) models manifest as unilateral limb motor dysfunction, which, notably, does not impede normal behaviors like feeding and drinking. Additional procedures contributing to discomfort encompass tail clipping and ear tagging in mice. Throughout the experimental process, mitigating measures such as gentle petting are implemented to alleviate the pain and distress resulting from these procedures. The experimental ethics was in compliance with ARRIVE ethical guidelines, and was granted by the IACUC of The First Affiliated Hospital, Jiangxi Medical College, Nanchang University, with an approval number of CDYFY-IACUC-202306QR028.
2.1.2 Middle Cerebral Artery Occlusion/Reperfusion Model
MCAO/R was conducted on mice, followed by 1 h of occlusion and 24 h of reperfusion. The cohort included wild-type and Lrg1 knockout underwent sham-treated or MCAO/R-treated groups. Routine sequencing assay used n = 3 mice, while basic experiments typically n = 6 mice. Animals, according to the wild type and Lrg1 knockout mice, were randomly assigned a random number utilizing Excel software. The investigators were blinded to the pretreatment groups and remained so throughout the data analysis process. This method is considered an optimal choice currently for both basic and clinical research into cerebral and vascular diseases. Mice were anesthetized with 2.5% sevoflurane (Shanghai Hengrui Pharmaceutical Co., Ltd., 23122931, 24051131, Shanghai, China). This anesthetic protocol induces reversible effects on the physiological functions of mice. Animals were evaluated using laser Doppler flowmeters (LDF, FLPI2, Moor, UK), and only those with blood flow reduced to below 30% of pre-ischemia levels were selected for further experimentation. Following MCAO/R, mice exhibited unilateral motor deficits without compromising routine behaviors, such as feeding and drinking; thus, postoperative analgesics were not administered. After all procedures were completed, the mice were euthanized by cervical dislocation. All procedures strictly adhered to Standard Operating Protocols, including animal handling, weighing, and ear tagging, to minimize additional distress. Animals were promptly returned to comfortable housing post-surgery. Throughout the study, animals received gentle handling, assisted mobility support, and extended physical restraint, which was accompanied by post-procedural emotional comfort measures. In cases of unmanageable stress responses, immediate cervical dislocation euthanasia was implemented.
2.1.3 Immunofluorescence Staining Analysis
Coronal brain sections, each with a thickness of 5 μm, were carefully prepared from the ischemic area. These tissue sections were first thoroughly rinsed using PBS (pH 7.4), followed by immediate fixation in ice-cold 4% paraformaldehyde for a duration of 10 min. Subsequently, they underwent a blocking and permeabilization procedure, employing a solution comprising 10% normal goat serum (Gibco, 16210064, Frederick, MA, USA), 3% bovine serum albumin (HYclone, GCC070103, Logan, UT, USA), and 0.1% Triton X-100 dissolved in PBS, with an incubation period lasting 1 h. Then, primary antibodies were applied to the sections. These included antibodies targeting anti-Fzd3 (ab217032, Abcam, Cambridge, UK, 1:200), Zmiz1 (89500, CST, Danvers, MA, 1:50), GAPDH (ab9485, Abcam, 1:50), Occludin (ab216327, Abcam, 1:100), Claudin-5 (ab131259, Abcam, 1:20), and ZO-1 (ab307799, Abcam, 1:500). The sections were then incubated at 4°C for 48 h. Following this step, the brain tissues were treated with an Alexa Fluor®488-conjugated donkey anti-goat IgG H&L secondary antibody (Abcam, ab150129, 1:1000) and incubated overnight at 4°C. Subsequently, the cell nuclei were stained with 4′,6-diamidino-2-phenylindole (DAPI, Abcam, ab104139, 1:500) for 15 min. Finally, the immunostained brain sections were visualized using a confocal microscope (Olympus, FV300, Tokyo, Japan).
After successfully establishing the MCAO/R model, the mice were anesthetized using 2.5% sevoflurane (Shanghai Hengrui Pharmaceutical Co., Ltd., 23122931, 24051131) before being euthanized through cervical vertebra dislocation. The hemibrains were then collected and rinsed repeatedly with ice-cold saline to eliminate the remaining blood. After that, they were gently blotted dry with absorbent paper. These processed hemibrains were subsequently prepared for both immunofluorescence staining and western blot analysis. In the western blot analysis, a 40 μg protein sample extracted from the ischemic area of the brain was separated by 12.5% SDS-PAGE. After separation, the proteins were transferred onto PVDF (polyvinylidene fluoride) membranes within a Tris-glycine buffer system. The membranes were first blocked with 5% nonfat dry milk at room temperature for 2 h. Then, they were incubated with primary antibodies in an ice bath for 24 h. The primary antibodies included anti-Fzd3 (ab217032, Abcam, Cambridge, UK, 1:1000, 76 kDa), Zmiz1 (89500, CST, Danvers, MA, USA, 1:1000, 120 kDa), GAPDH (ab9485, Abcam, 1:1000, 36 kDa), Occludin (ab216327, Abcam, 1:1000, 65 kDa), Claudin-5 (ab131259, Abcam, 1:1000, 23 kDa), and ZO-1 (ab307799, Abcam, 1:1000, 225 kDa). Following the primary antibody incubation, the membranes were further incubated with an HRP-conjugated secondary antibody (ab205718, Abcam, 1:2000) at room temperature for 50 min. Enhanced chemiluminescence was employed to visualize the bands, and the protein bands were captured using a biological image system (Bio-Rad, 1658001, Hercules, CA, USA).
2.1.5 Microvascular Albumin Leakage Test
The mice were rendered unconscious using 2.5% sevoflurane (Shanghai Hengrui Pharmaceutical Co., Ltd., 23122931, 24051131). After being anesthetized, the mice were placed in a prone position with their skulls held steady. The fur covering the fixed head surface was carefully shaved off to expose the underlying skull. Using a skull drill, a circular region with a diameter of 5 mm was delicately thinned along the cranial suture. The exposed pia mater was then precisely positioned beneath the Lan-MC real-time vascular injury imaging system, which facilitated clear visualization of the microvasculature. Within this visual field, venules with widths between 20 and 40 μm were specifically chosen for observation [15]. Before ten minutes of the experiment, FITC-albumin was diluted in saline to reach a concentration of 1 mg/mL. This solution was then injected into the femoral vein at a dose of 50 mg/kg. This injection was timed to occur approximately ten minutes before the start of the procedure to ensure optimal circulation and labeling of the FITC-albumin. Video recording was conducted using a fluorescence microscope, enabling the capture of dynamic changes in fluorescent signals. The recorded images were subsequently analyzed using the Image-Pro Plus software package (Media Cybernetics, Version 6, Rockville, MD, USA) for quantitative evaluation. To maintain temporal precision, the video recording speed was adjusted to capture 5 frames per second. From each experimental group, nine representative frames were methodically chosen for in-depth analysis. To quantify fluorescence intensity, regions of identical size were delineated both within the vessel lumen (representing venule fluorescence intensity, Iv) and in the adjacent interstitial area (representing interstitial area fluorescence intensity, Ii). The ratio of Ii to Iv was calculated for each frame, providing an indicator of vascular permeability and the degree of FITC-albumin leakage into the interstitial space. This ratio was then compared to the baseline fluorescence level of venules observed under sham operation conditions, which served as a control for non-pathological states. After the experiment concluded, mice were anesthetized again with 2.5% sevoflurane before being euthanized by cervical vertebra dislocation.
Endothelial cell BEND.3 (STCC2003) was purchased from Zeesan Biotech (Wuhan, China) and cultured with glucose-free medium (RPMI 1640, L270, Gbico). Cells were subjected to oxygen-glucose deprivation 3 h/reperfusion 12 h (OGD/R) conditions to establish the experimental model. The Oxygen-glucose deprivation model was simulated with a premixed gas atmosphere (1% O2, 94% N2, 5% CO2) at 37°C. After OGD/R, the cells were perfused with DMEM with glucose and glutamine (10566016, Thermo Fisher Scientific, Waltham, MA, US) and transferred to a 5% CO2, 95% O2 air incubator for 12 h. The endothelial cells were treated for 24 h with a luciferase reporter plasmid containing the Fzd3 promoter, along with siRNA-Zmiz1 (Forward: GGAGGGCGTTGAAGAATTA and Reverse: GCATTGCCTATACCACAGG) or pcDNA3-Zmiz1 (p1017, Servicebio Technology Co., Ltd., Wuhan, China). The control plasmid employed Renilla luciferase as an internal control for the experiment. The luciferase activity of the reporter gene was then assessed using a dual-luciferase reporter assay kit (Promega, E1910, Madison, US). After treating the cells, wash them with PBS, and then add 200 μL of lysis buffer to each well. Collect the lysed cells into 1.5 mL EP tubes and centrifuge at 1000× g for 0.5 min. After collecting the supernatant, add the Stop solution. The detection was carried out using a multifunctional microplate reader (Varioskan LUX, Thermo Fisher Scientific), with the difference between the measured value and the background value representing the luciferase activity of the reporter gene.
The processing of endothelial cell samples was carried out as described in Section 2.1.6. The processed cells with the Fzd3 promoter, OGD/R, or other relevant conditions for 24 h, the cells were collected and processed using a chromatin immunoprecipitation (ChIP) Kit (Servicebio, GM1008, Wuhan, China) according to the following protocol. The cells were sonicated and centrifuged at 8000× g for 10 min at 4°C. Insoluble materials were discarded, and the supernatant was collected. Then, 50 μL of the product was mixed with 5 μL proteinase K and 2 μL 5 M NaCl, and incubated at 55°C overnight for decrosslinking. Afterwards, 100 μL of the sonicated product stored at −80°C was combined with 900 μL ChIP Dilution Buffer (1 mM PMSF, 20 μL 50 × PIC). Next, 60 μL Protein A+G Agarose/Salmon Sperm DNA was added to each sample, gently inverted and mixed at 4°C for 1 h, then incubated at 4°C for 10 min to precipitate. After centrifugation at 4000× g for 5 min, the samples were split into two 1.5 mL EP tubes. One tube got 1 μg IP antibody specific to the target protein, the other 1 μg corresponding IgG. They were gently inverted and incubated overnight at 4°C. Finally, immune complexes were precipitated, washed, and the DNA samples were recovered for RT-PCR detection. We query the binding sites of Zmiz1 on the hTFtarget database website (https://guolab.wchscu.cn/hTFtarget/#!/targets/integrate?tf=ZMIZ1, accessed on 26 November 2025). For Chromatin immunoprecipitation combined with quantitative polymerase chain reaction (ChIP-PCR), the sample volume in each well was adjusted to 2 μL of reverse primer, 2 μL of forward primer, and 25 μL of Taq Mix. The samples were then placed in a PCR machine (Eppendorf, 6336, Hamburg, Germany) for amplification. To prepare a 1% agarose gel, 1 g of agarose was dissolved in 50 mL of 1× TAE buffer by heating in a microwave until fully melted. The solution was then allowed to cool to room temperature, after which 2 μL of an ethidium bromide substitute was added and mixed thoroughly. The mixture was poured into a horizontal gel casting tray and allowed to solidify for 30 min. The prepared agarose gel was then placed in a horizontal electrophoresis tank, and an appropriate volume of 1× TAE buffer was added to cover the gel. Set the PCR reaction conditions as follows: initial denaturation at 95°C for 10 min, followed by denaturation at 95°C for 60 s, annealing at 95°C for 30 s, and extension at 72°C for 30 s, with a temperature increase rate of 0.3°C every 15 s during the ramp-up phases, then underwent 40 cycles. After the PCR reaction is completed, remove the reaction tubes and allow them to cool to room temperature. After loading the samples, electrophoresis was performed at a constant voltage of 120 V for 50 min. Upon completion, the gel was visualized for analysis. After data collection, the target genes were analyzed using Prism Demo software via the 2−∆∆Ct method.
2.1.8 Construction and Injection of shRNA-Zmiz1
Mice were anesthetized with 2.5% sevoflurane (Shanghai Hengrui Pharmaceutical Co., Ltd., 23122931, 24051131). We designed mouse Zmiz1 gene short hairpin RNA (shRNA) via the MERCK website (https://www.sigmaaldrich.cn/CN/zh/semi-configurators/shrna?-activeLink=selectClones, accessed on 26 November 2025). The reverse complementary sequence was generated via a website (https://www.detaibio.com/sms2/rev_comp.html, accessed on 26 November 2025). The adenovirus vector encoding shRNA-Zmiz1 (sense: CGACCTTCCAAGCAATAGCAA, antisense: TTGCTATTGCTTGGAAGGTCG) and negative control-shRNA adenovirus empty vector (sense: CCGGCAACAAGATGAAGAGCA, antisense: CCAACTCGAGTTGGTGCTCTT) (Serotype: Adeno-associated virus, AAV9; Promoter: CAG) were constructed by Wuhan Servicebio Biotechnology Co., Ltd.
Mice were anesthetized with 2.5% sevoflurane (Shanghai Hengrui Pharmaceutical Co. 23122931, 24051131) and fixed in a brain solid positioner (Jiangwan I-C stereotactic device). Adjust the positioner parameters to ensure the cerebral midline is aligned symmetrically in all planes, then perform a midline incision disinfected with iodophor along the cranial sagittal suture to expose the bregma landmark. Set the stereotaxic positioning needle to the bregma landmark as the zero reference point: the injection coordinates are as follows: anterior posterior −0.9 mm, medio lateral ±1.5 mm, dorso ventral −0.9 mm, depth 3.0 mm. Fix the injection needle on the locator, carefully lower it, and insert the needle vertically into the hole of the locator. Inject 2 μL shRNA-Zmiz1 or shRNA-Zmiz1 NC (negative control) into each mouse, with the virus concentration 1 × 10¹⁰ vg/μL and the injection rate of 0.2 μL/min. At the end of the injection, hold the needle for 5 min, then slowly move the syringe up and out of the needle. The wound of operation ensures minimal discomfort and optimal recovery conditions for the animals. After all experimental results were obtained, mice were anesthetized with sevoflurane prior to euthanasia by cervical vertebra dislocation.
The t-test or Wilcoxon rank-sum test was employed to detect significant differences between two continuous groups of variables, depending on the data distribution. For the comparison of multiple groups of continuous variables, a two-way ANOVA or the Kruskal-Wallis test was utilized, with the choice guided by the data’s suitability for parametric or non-parametric analysis. To account for multiple comparisons, the Bonferroni method was applied for p-value correction, ensuring the robustness of statistical inferences. All statistical analyses were conducted using R Studio (version 4.1.3), a powerful and versatile platform for statistical computing and graphics. Statistical significance was defined as a p-value less than 0.05, unless otherwise explicitly stated, adhering to common conventions in scientific research. Prism Demo software was applied to analyze the target genes obtained from ChIP-PCR via the 2−∆∆Ct method.
Brain tissue samples destined for analysis were carefully extracted, and a precise amount was weighed into a mortar previously chilled with liquid nitrogen. 1 mL of TRIzol reagent was meticulously added per 50–100 mg of tissue sample to isolate RNA from the brain samples. Subsequent to the quantification of RNA concentration, an amount of 1 μg of total RNA from each group was selected for the construction of cDNA libraries. The transcriptome sequencing was expertly handled by the Nova6000 high-throughput sequencer (Illumina Co., Ltd., San Diego, CA, USA). The resulting bulk RNA-seq data, a testament to the rigor of the process, have been publicly accessible in NCBI’s Sequence Read Archive (assigned the unique accession number PRJNA1147915). Genes exhibiting a |log2 fold change (FC)| ≥ 1 and an adjusted p-value (Padj) < 0.05 were rigorously scrutinized and identified as differentially expressed genes (DEGs). To provide a clear and intuitive visualization of their expression patterns, hierarchical clustering analysis was meticulously carried out. Additionally, enrichment analyses were conducted to delve deeper into the biological functions and pathways associated with these DEGs.
2.2.2 Single–Cell Suspension Preparation, Library Construction, and RNA Sequencing
Brain tissue from the right hemisphere was obtained from each mice group and subjected to two washes with precooled RPMI 1640 medium (12633020, Thermo Fisher Scientific) supplemented with 0.04% BSA. The cleaned tissue was then processed into a single-cell suspension. This suspension was then resuspended in a red blood cell lysis buffer (10× Genomics, MACS, Catalog #130-094-183, Catalog#000268, Miltenyi Biotec, Bergisch Gladbach, Germany) to eliminate erythrocytes. After erythrocyte lysis, the lysis was incubated at 4°C for 10 min in a refrigerator, followed by centrifugation at 500× g for 5 min. Following centrifugation, the cell pellet was rinsed once more with RPMI 1640 medium (12633020, Thermo Fisher Scientific) and subjected to a second centrifugation step. The freshly prepared single-cell suspension was adjusted to the appropriate concentration as detailed in the protocol. The library preparation procedure was meticulously executed, adhering to the manufacturer’s protocols for the 10× Genomics Chromium Next GEM Single Cell 3’ Reagent Kit v3.1 (10× Genomics, Catalog#000268). Subsequently, the constructed libraries underwent high-throughput sequencing on the Illumina NovaSeq 6000 PE150 platform, guaranteeing comprehensive and precise transcriptome profiling of each individual cell.
2.2.3 Single–Cell Data Cell Identification
The data was analyzed utilizing the Seurat pipeline (version 4.1.1, available at https://github.com/satijalab/seurat/, accessed on 26 November 2025) to conduct quality control measures, incorporating dimensionality reduction techniques and unsupervised clustering approaches [16]. The quality control criteria in this project are as follows: high-quality cells are retained if their gene count and UMI count fall within the range of the median ±2 times the median absolute deviation, and their mitochondrial UMI proportion is below 10%. Doublets are subsequently removed. To mitigate potential batch effects across different experimental groups, the BBKNN tool (Version 1.5.1, accessible via https://github.com/immunogenomics/harmony, accessed on 26 November 2025) was employed [17], with parameter settings as batch = 20, n_neighbors = 40, trim = 50. This correction step ensured the integrity of the data for downstream analyses. Subsequently, we identified individual cells based on universal markers (Supplementary file S1) specific to various cell types, leveraging established knowledge from textbooks and published literature. The identified cell clusters were then classified according to their expression of generic markers, providing a comprehensive characterization of the cellular composition within the analyzed samples.
We calculated the ROGUE index using ROGUE (version 1.0, https://github.com/PaulingLiu/ROGUE, accessed on 26 November 2025) [18]. The permutation test, a widely employed statistical method for analyzing small–sample data, was employed to assess differences in ROGUE values among distinct groups with 1000 permutations [19]. To conduct a rigorous assessment of the variations in ROGUE values (The input expression matrix: formatted with genes as rows and cells as columns. The matr.filter() function is applied to filter out: set as low-abundance genes (min.genes = 10) and low-quality cells (min.cells = 10). Default parameter: 0.6; Permutation test settings: number of permutations: 1000, UMI: k = 45, full-length transcript data: k = 500. ROGUE >0.9 means high consistency, <0.9 needs more clustering or data check) among different groups.
Complex cell–cell communication plays a crucial role in the interactions between cells. The CellphoneDB package (version 5.0.0) in Python (version 3.9.0) was used to infer and analyze cell–cell communication by identifying potential mechanisms of interaction through ligand-receptor pairs. Single-cell transcriptome data in Hdf5 format was set as the input file; the parameters should be set to the default values, requiring that at least 10% of the cells express genes related to a specific interaction; otherwise, that interaction will be excluded. Additionally, the CSOmap tool was employed to simulate direct cell-to-cell communication in spatial contexts based on single-cell sequencing data. In this study, the CSOmap R package (version 1.0) was utilized to identify cell communication networks within the brain tissues, providing deeper insights into the nature of intercellular interactions. Use the gene-cell expression matrix generated from scRNA-seq as the input file for CSOmap, with the parameters set as follows: Enriched interactions arise when one cell type is significantly overrepresented near another (right-tailed p < 0.05, q < 0.05), while depleted interactions occur when one type is significantly underrepresented (left-tailed p < 0.05, q < 0.05). Cell-cell interaction significance is assessed via 1000 random permutations of cluster labels to generate expected interaction distributions. Right/left-tailed tests compute p-values for enrichment (observed > expected) and depletion (observed < expected). Benjamini-Hochberg correction estimates q-values; pairs with enrichment/depletion q < 0.05 are deemed significant (interacting/dispersing), while those with both q > 0.05 are labeled “other”.
2.2.6 Calculation of Cell Function Scores
To evaluate the functional differences among different groups of cells, we utilized Seurat’s AddModule Score function at the single–cell level to calculate the scores of functional modules in cell clusters. Convert CSV and other files into list files for import into R software. We referenced the macrophage functional gene set summarized by Cheng et al. [20] to assess the function of microglial cells and macrophages. The calculated functional modules included the M1 score and the M2 score. In the AddModuleScore function, setting ctrl = 100 means randomly selecting 100 control genes from the expression data for normalization. Higher scores of various functional assessments indicate stronger corresponding functions of the cell. To unravel the functional differences among diverse cell groups, we leveraged Seurat’s AddModuleScore function at the single-cell level, enabling us to quantify the scores of functional modules within the identified cell clusters. For this purpose, we referenced the endothelial-relevant functional gene sets curated in the Gene Set Enrichment Analysis (GSEA) database (Supplementary file S2), encompassing critical processes like hypoxia response, oxidative phosphorylation, adhesion, and chemotaxis. These functional assessments aimed to evaluate the specialized roles of endothelial cells. Notably, higher scores across various functional evaluations indicate a more pronounced manifestation of the respective cellular functions.
2.2.7 Inference of Cellular Differentiation Trajectories
To gain insights into the intricate lineage differentiation dynamics among cells, we adopted a comprehensive analytical approach that uses Monocle2 version 2.26.0 (a widely available tool, but generally available at https://github.com/cole-trapnell-lab/monocle-release, accessed on 26 November 2025, for trajectory analysis) [21]. These tools facilitated the examination of cellular differentiation trajectories, providing insights into the progression of cells from one state to another. We have prepared the metadata file for input. Additionally, we utilized Ro/e as a quantitative metric to assess the degree of preference exhibited by cells towards individual subpopulations. We utilize the calculate Ro/e function, with the calculation formula defined as: Ro/e = Observed/Expected. The calculation of the Ro/e ratio is based on the following approach: Both the observed and expected frequencies were derived using the chisq.test function (which performs a chi-square test). An Ro/e value exceeding 1 indicates that the specific cell cluster is overrepresented (enriched) within the group, whereas an Ro/e value below 1 suggests that the cell cluster is underrepresented (not enriched) in the group.
To detect differences between two continuous variable groups, we employed either the t-test or the Wilcoxon test. For comparing differences across multiple groups of continuous variables, ANOVA (when data met parametric assumptions) or the Kruskal-Wallis test (for non-parametric data) was utilized. To address the issue of multiple comparisons, the Bonferroni method was applied for p-value correction. All statistical analyses were conducted using R Studio (version 4.1.3) or Python (version 3.9.12), ensuring the rigor and reproducibility of our findings. Statistical significance was defined as a p-value less than 0.05.
3.1 Conventional Knockout of Lrg1 Restricts the Tight Junction (TJ) Injury of the Blood-Brain Barrier after Cerebral Ischemia–Reperfusion Injury
Previous studies have shown that Lrg1 knockout in cerebral ischemia-reperfusion brain has a smaller infarct volume and decreased cerebral edema than WT mice after MCAO/R [14]. Here, the findings confirm previous studies which have found that the tight junction (TJ) was reinstated in Lrg1−/− mice following by MCAO/R. Replication experiments in cerebral edema of Lrg1−/− and WT mice after MCAO/R showed the same results (Fig. 1A,B). An immunofluorescence staining experiment has been done, and the results demonstrated that compared to WT mice. Following MCAO/R, Lrg1−/− mice displayed elevated protein levels of cell adhesion related molecules such as Claudin-5 (Fig. 1C,F), Occludin (Fig. 1D,G), and ZO-1 (Fig. 1E,H) in endothelial cells (Fig. 1I,J). Additional evidence from the microvascular albumin leakage test [14] suggests that Lrg1 knockout diminishes the ratio of the surrounding interstitial area (Ii) fluorescence intensity to the fluorescence intensity of the lumen of selected venules (Iv) in the same region, subsequent to MCAO/R (Fig. 1K,L). These findings imply that Lrg1 knockout contributes to the recovery of tight junction (TJ) injury following MCAO/R.
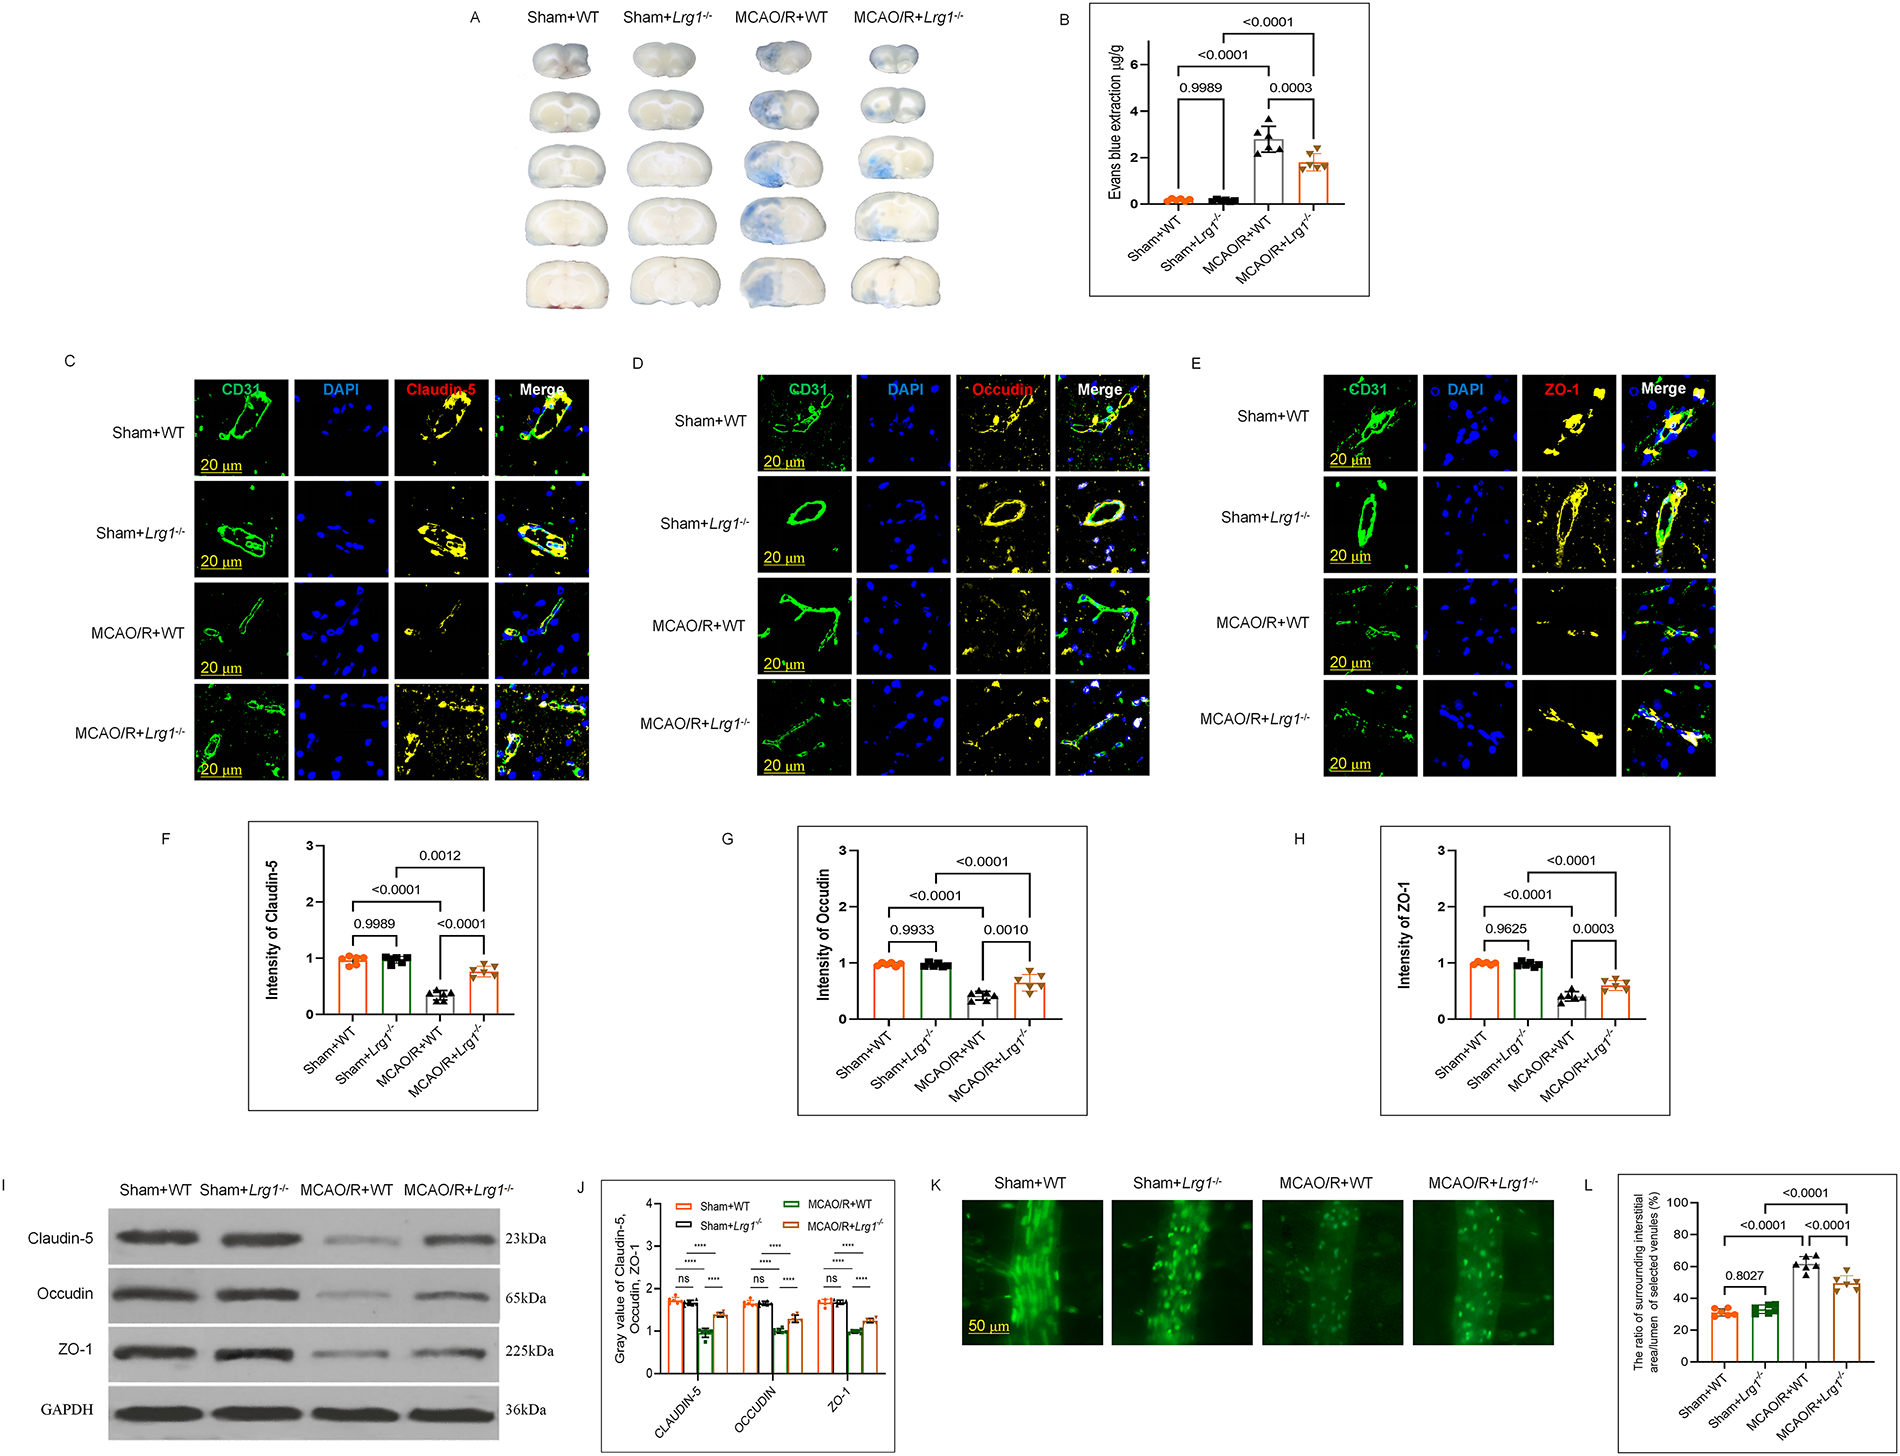
Figure 1: Lrg1 knockout restricts the tight junction injury of the blood-brain barrier after cerebral ischemia–reperfusion injury. (A) The gross appearance of brains subjected to 1 h of ischemia followed by 24 h of reperfusion was performed utilizing Evans blue staining. (B) Error bar graph illustrating the quantitative results of Evans blue staining in different groups. Data are expressed as the mean ± SD, n = 6. (C–E) Representative immunofluorescence images depicting the tight junction protein expression of (C) Claudin-5, (D) Occludin, (E) ZO-1 in brain tissues of mice from distinct groups. Scale bar = 20 μm. (F–H) Error bar graph depicting (F) Claudin-5, (G) Occludin, (H) ZO-1 quantification. Data are presented as mean ± SD, n = 6. (I) Western blotting was conducted to quantitatively determine the protein expression of Claurdin-5, Occludin, and ZO-1 in brain tissues in MCAO/R mice. (J) Error bar graph displaying the results of protein expression in different groups. Data are expressed as the mean ± SD, n = 6. (K) Microvascular albumin leakage test assessing the change in albumin leakage within the venules of the brain tissues from different mouse groups. (L) Error bar graph presenting the results of the microvascular albumin leakage test in different groups. Data are expressed as the mean ± SD, n = 6. Scale bar = 50 μm. NS: no significance, ****p < 0.0001
3.2 Analysis for the Reconstruction of Cell Spatial Organization from Single-Cell RNA Sequencing Data for the Neurovascular Unit after Cerebral Ischemia–Reperfusion Injury
As a typical representative of the neurovascular unit, we used single-cell RNA sequencing data of astrocyte, microglial cell, oligodendrocyte, pericyte, endothelial cell, and neuron, and the data are mapped to a cell spatial organization model to reconstruct the neurovascular unit via the CSOmap R package (version 1.0). Our analysis of the CSOmap model of the neurovascular unit found that: Astrocytes and pericytes occupy the outer spatial units and are topologically equivalent to the tissue edges, while microglial cells and oligodendrocytes occupy the intermediate positions between the outer and inner spatial units, which are mostly scattered topologically; Endothelial cells occupy the inner spatial units. The topological structure is equivalent to the unit base, and the cell distribution in the topological structure is consistent with the actual neurovascular unit, indicating the validity of the model of the CSOmap model of neurovascular unit.
By quantifying the distance between astrocytes and pseudo-unit centers (Fig. 2A), the CSOmap model shows that astrocytes are distributed in outer space units based on the scRNA-seq data of WT mice, while the distance in Lrg1−/− mice increases. It has also been found that, although astrocytes disperse in outer space units, no obvious significant interaction has been seen within endothelial cells (Fig. 2B). Moreover, there were also differences between the two groups in terms of the changes in positive and negative correlation distances among the 6 types of cells (Fig. 2C,D). Through a quantitative analysis on intercellular distance of WT type and Lrg1−/− spatial neurovascular unit showed that the spatial distance between astrocyte and endothelial cell, microglial cell and neuron, oligodendrocyte and astrocyte, endothelial cell and microglial cell, endothelial cell and oligodendrocyte decreased in neurovascular unit of Lrg1−/− mice (Fig. 2E,F,I–K). We also observed a decrease in the spatial distance between oligodendrocyte and pericyte, astrocyte and microglial cell, neuron and endothelial cell in the neurovascular unit of WT mice (Fig. 2G,H,L).
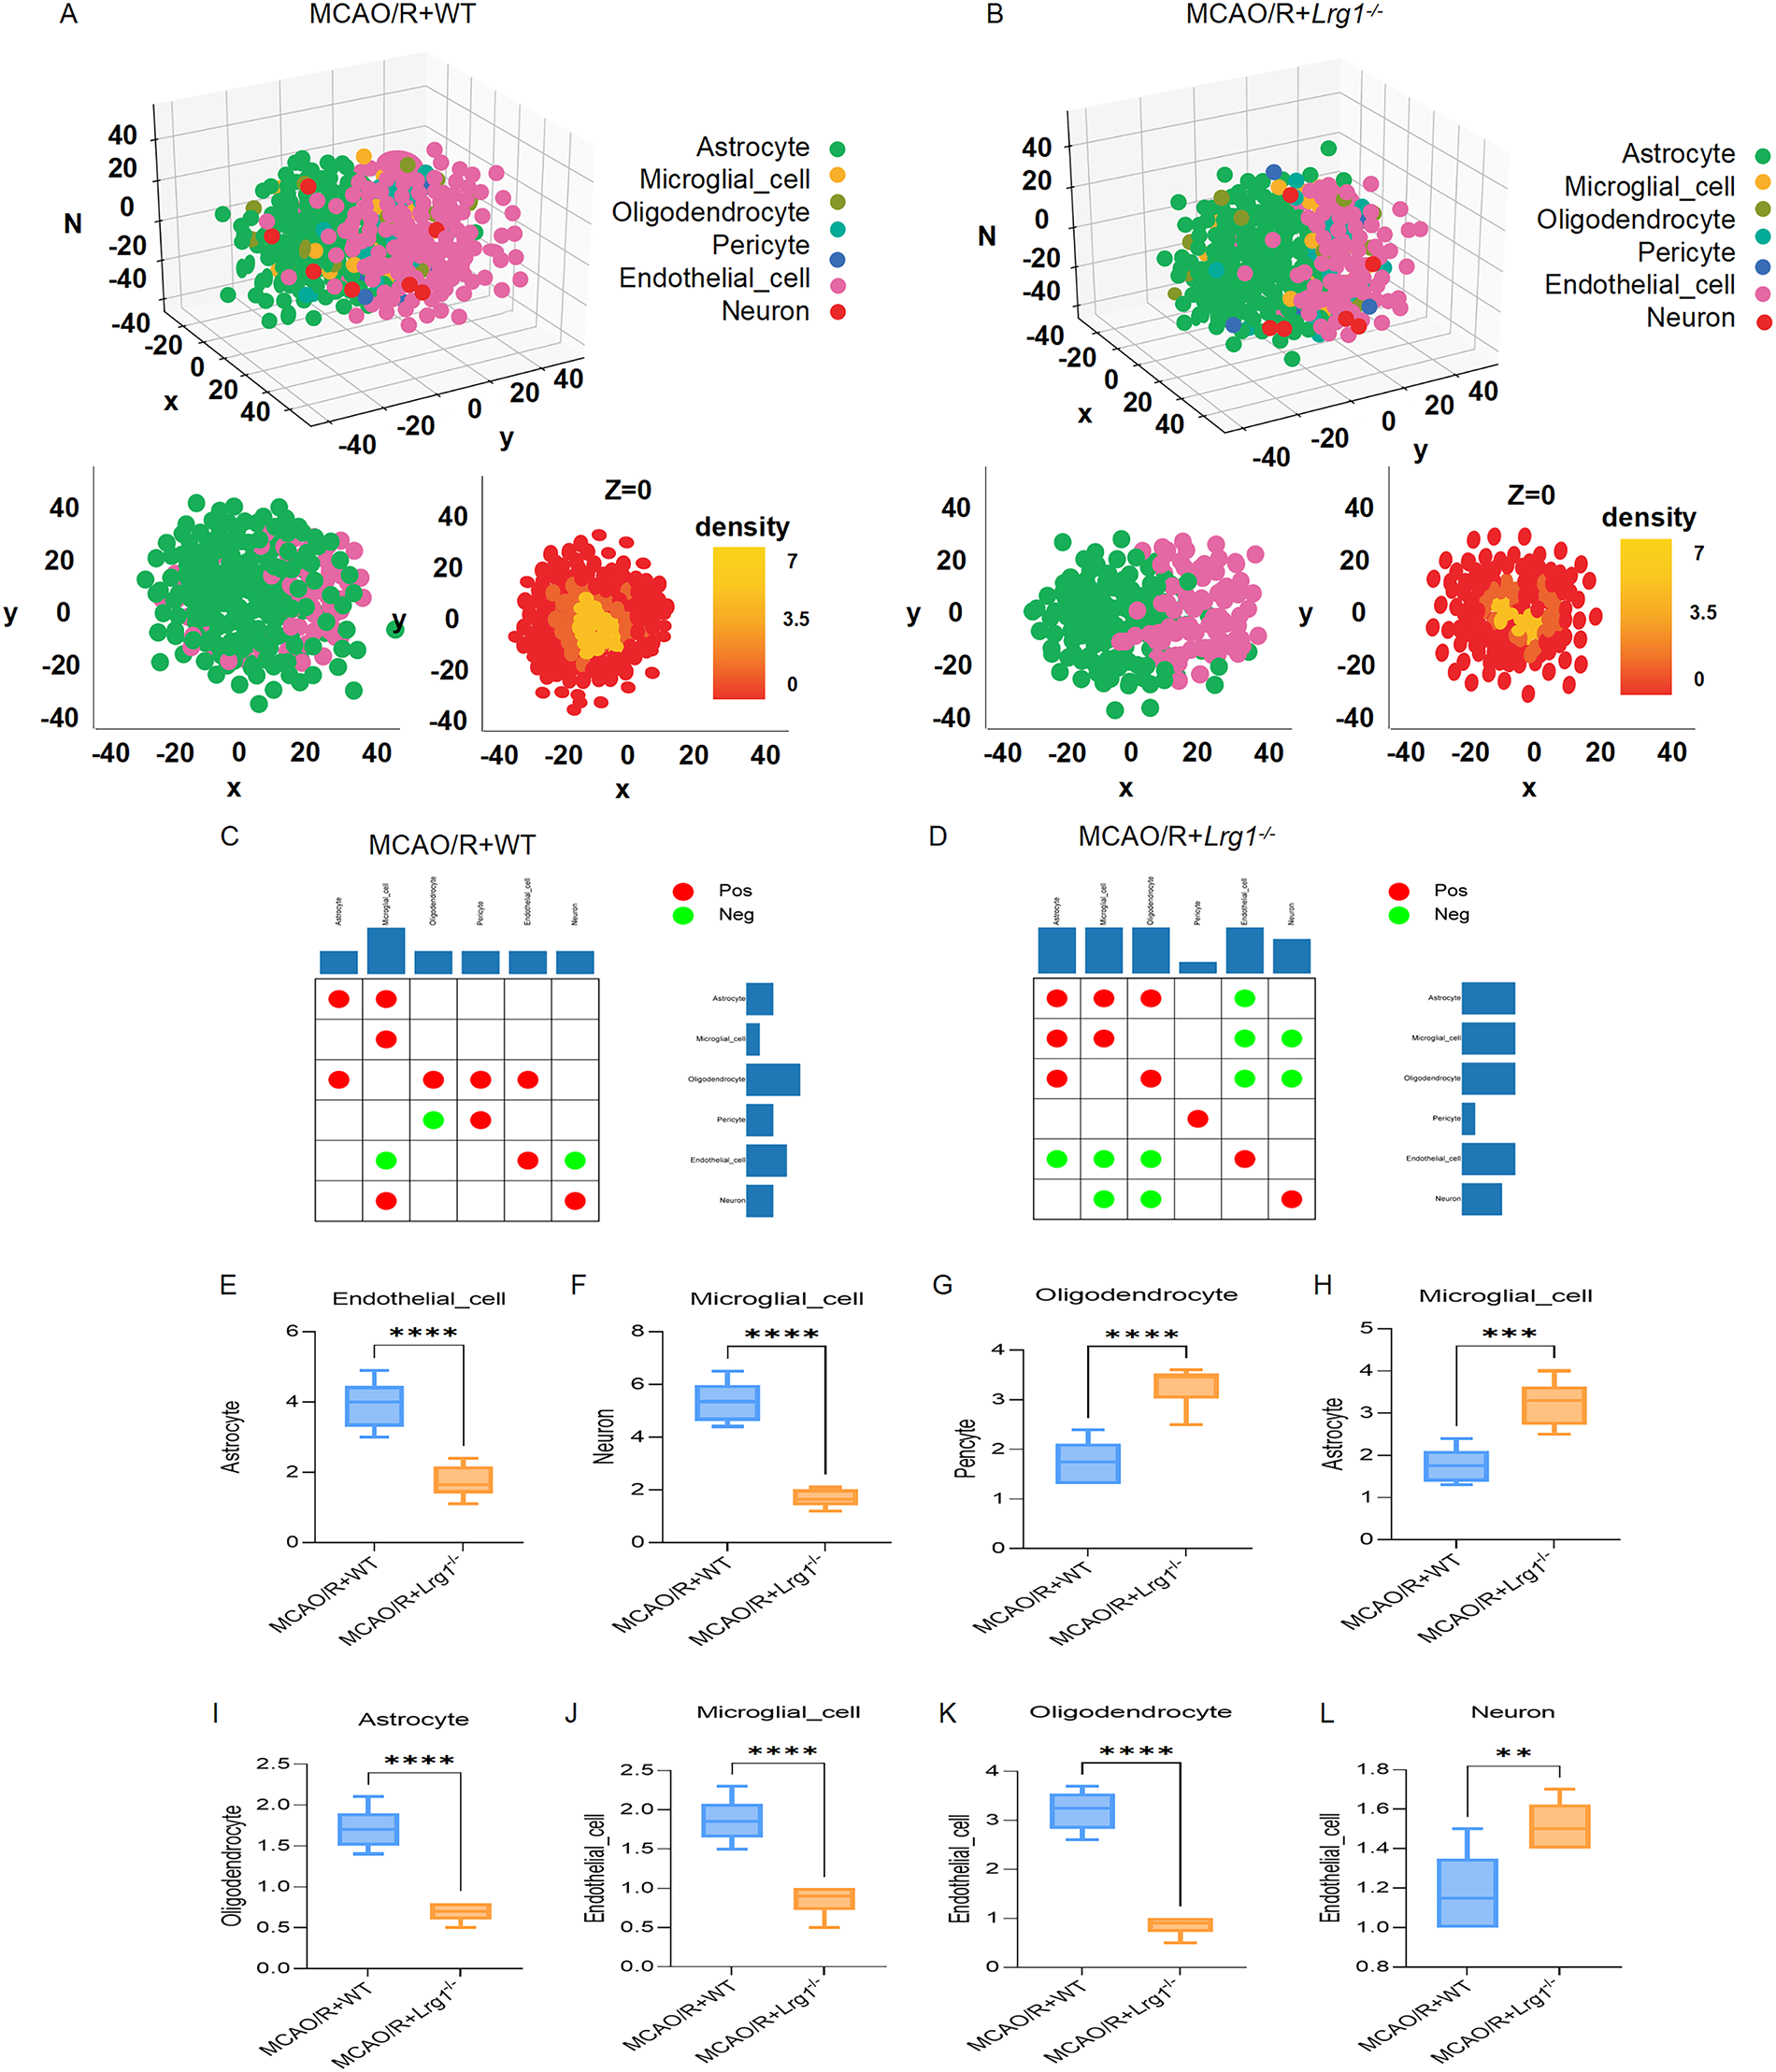
Figure 2: The neurovascular unit of cerebral ischemia-reperfusion injury reconstructed based on CSOmap. (A) The 3D visualization of CSOmap prediction of the WT mice brain scRNA-seq data (above) after MCAO/R. Cellular type: astrocyte, microglial cell, oligodendrocyte, pericyte, endothelial cell, and neuron. The cross-section of z = 0 of the 3D visualization (bottom right). (B) The 3D visualization of CSOmap prediction of the Lrg1−/− mice brain scRNA-seq data (above) after MCAO/R. Cellular type: astrocyte, microglial cell, oligodendrocyte, pericyte, endothelial cell, and neuron. The cross-section of z = 0 of the 3D visualization (bottom right). (C) Matrix and bilateral bar graphs exhibited the intercellular distance relationship between the cells of the neurovascular unit in WT mice after MCAO/R. Red coloring signifies a positive correlation, whereas green coloring denotes a negative correlation. (D) Matrix and bilateral bar graphs exhibited the intercellular distance relationship between the cells of the neurovascular unit in Lrg1−/− mice after MCAO/R. Red coloring signifies a positive correlation, whereas green coloring denotes a negative correlation. (E–L) Error bar graph showing the results of the spatial distance between cells of the neurovascular unit with the changes. n = 3, **p < 0.01; ***p < 0.001; ****p < 0.0001
3.3 Bulk RNA-Seq Analysis of the Brains against Cerebral Ischemia-Reperfusion
The accessible online scRNA-seq data comprises sequencing information derived from the left cerebral hemispheres of three mice belonging to both WT and Lrg1−/− mice, subsequent to MCAO/R. RNA-seq was subjected to identify the changes in overall gene expression after cerebral ischemic-reperfusion (Fig. 3A). It was found that two groups exist with significant sample distribution in the PCA field (Fig. 3B), 143 differentially expressed genes (DEGs) were downregulated, and 135 DEGs were upregulated in Lrg1−/− mice after MCAO/R compared with WT mice (Fig. 3C). There are striking differences in gene expression files shown within the hierarchical heatmap (Fig. 3E). Based on DEGs obtained from different groups, we analyze the common and different elements in the interactive genes through the Venn diagram (Fig. 3D). The Venn diagram analysis revealed numerous non-overlapping DEGs among various groups, signifying distinct changes in gene expression patterns (Fig. 3D). Notably, these DEGs are significantly enriched in pathways such as toll-like receptor cascades, the myd88 cascade initiated on the plasma membrane, traf6-mediated induction of NF-κB and MAP kinases, and interleukin-1 signaling, all of which contribute to the enhancement of brain function (Fig. 3F). As shown in Fig. 3G, the DEGs from all the groups went through the activation of immune response, cytokine-mediated signaling pathway, positive regulation of defense response, wound healing, etc.
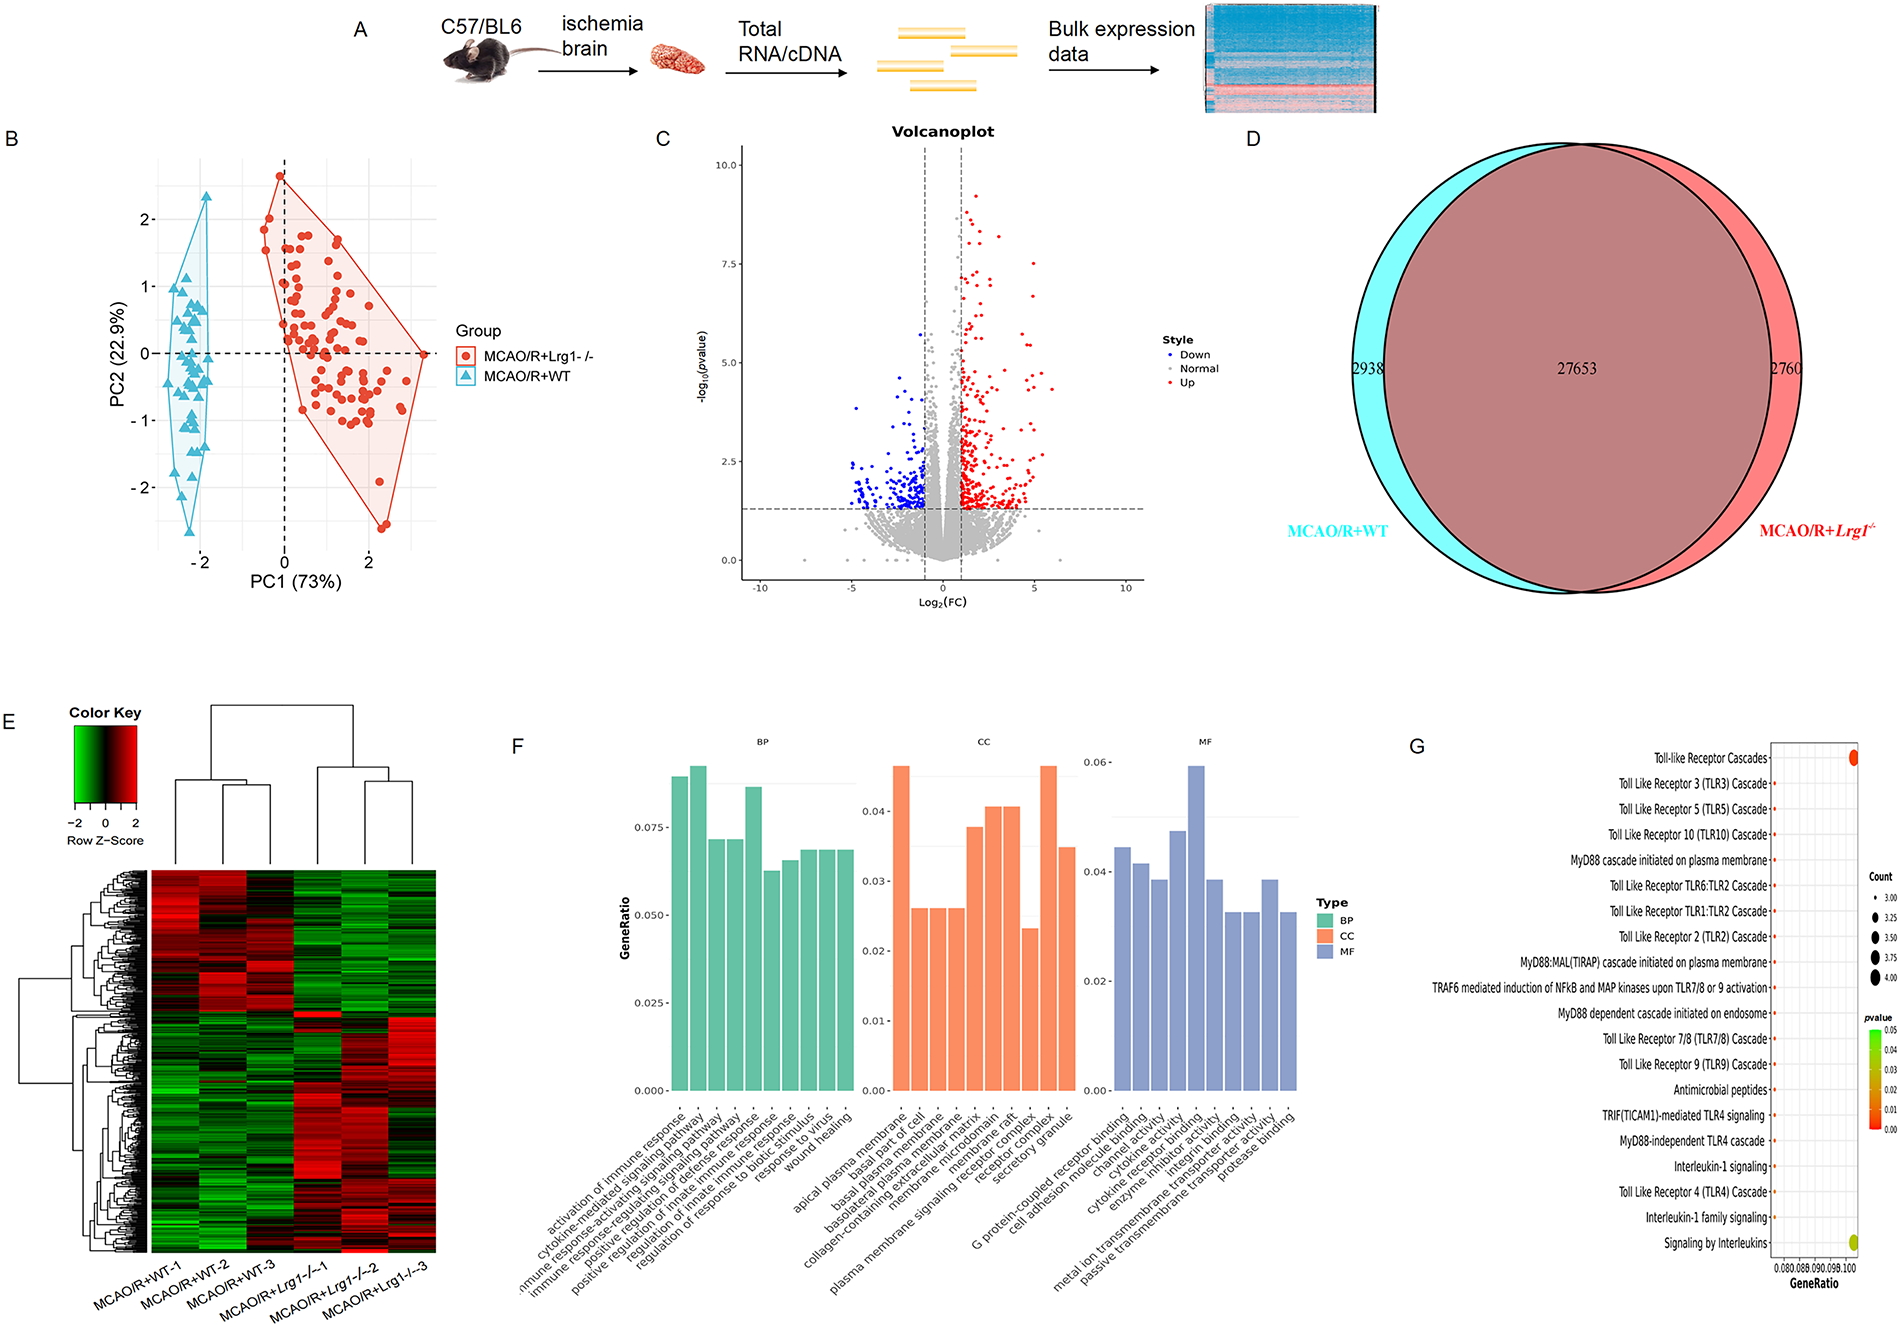
Figure 3: Bulk RNA-seq analysis of the brains against cerebral ischemia-reperfusion. (A) A flowchart outlines the RNA sequencing (RNA-seq) process. (B) The PCA scores plot of MCAO/R+WT mice and MCAO/R+Lrg1−/− mice. (C) A volcano map of differentially upregulated expressed genes compared between MCAO/R+WT mice and MCAO/R+Lrg1−/− mice. |Log2(fold change)| > 1; padj < 0.05; (D) Venn diagram representing the overlapping differentially expressed compared between MCAO/R+WT mice and MCAO/R+Lrg1−/− mice. (E) A hierarchical heatmap of differentially expressed genes between MCAO/R+WT mice and MCAO/R+Lrg1−/− mice. (F) Gene ontology (GO) annotation of upregulated differentially expressed genes in endothelial cells of brain tissues in MCAO/R+WT mice compared with MCAO/R+Lrg1−/− mice. BP: biological process; CC: cellular component; MF: molecular function; (G) Kyoto encyclopedia of genes and genomes (KEGG) pathway enrichment analysis of upregulated differentially expressed genes in endothelial cells of brain tissues in MCAO/R+WT mice compared with MCAO/R+Lrg1−/− mice
3.4 Lrg1 Knockout Impacts Endothelial Cell Differentiation after Cerebral Ischemia–Reperfusion Injury
We performed scRNA-seq on cells isolated from the brains of four distinct mice groups: Sham+WT, Sham+Lrg1−/−, MCAO/R+WT, and MCAO/R+Lrg1−/−. Following rigorous quality control, we isolated 170,069 high-quality cells. 13 cell types were subsequently classified according to marker, including endothelial cell, astrocyte, oligodendrocyte, microglial cell, macrophage, fibroblast-like cell, vascular smooth muscle cell, choroid plexus cell, ependymocyte, neutrophil, neuron, T cell, and pericyte (Fig. 4A). Subsequently, we delved into the impact of Lrg1 knockout on endothelial cells. Our analysis revealed that Lrg1 expression was ubiquitously detected in all 13 cell types (Fig. 4B). We identified a total of 23,499 endothelial cells, which were further categorized into 10 distinct clusters based on unsupervised clustering analysis (Fig. 4C,D). These clusters exhibited notable differences in their expression profiles, as evident from the heatmap visualization of their signature genes (Fig. 4E). Due to the differences between microglial clusters, 10 clusters manifested in the proportion of expression differences in different groups (Fig. 4F). Subsequently, we embarked on investigating the differentiation trajectories of endothelial cells. Utilizing Monocle 2, we independently computed the differentiation pathways of endothelial cells across various groups. By integrating these results (Fig. 4G), we determined the specific differentiation trajectories of microglial cells within each group. Specifically, we observed a progression from Endothelial_6, Endothelial_7, and Endothelial_10 to Endothelial_3 and Endothelial_8, followed by Endothelial_9, and ultimately leading to Endothelial_1, Endothelial_2, Endothelial_4, and Endothelial_5 (Fig. 4H).
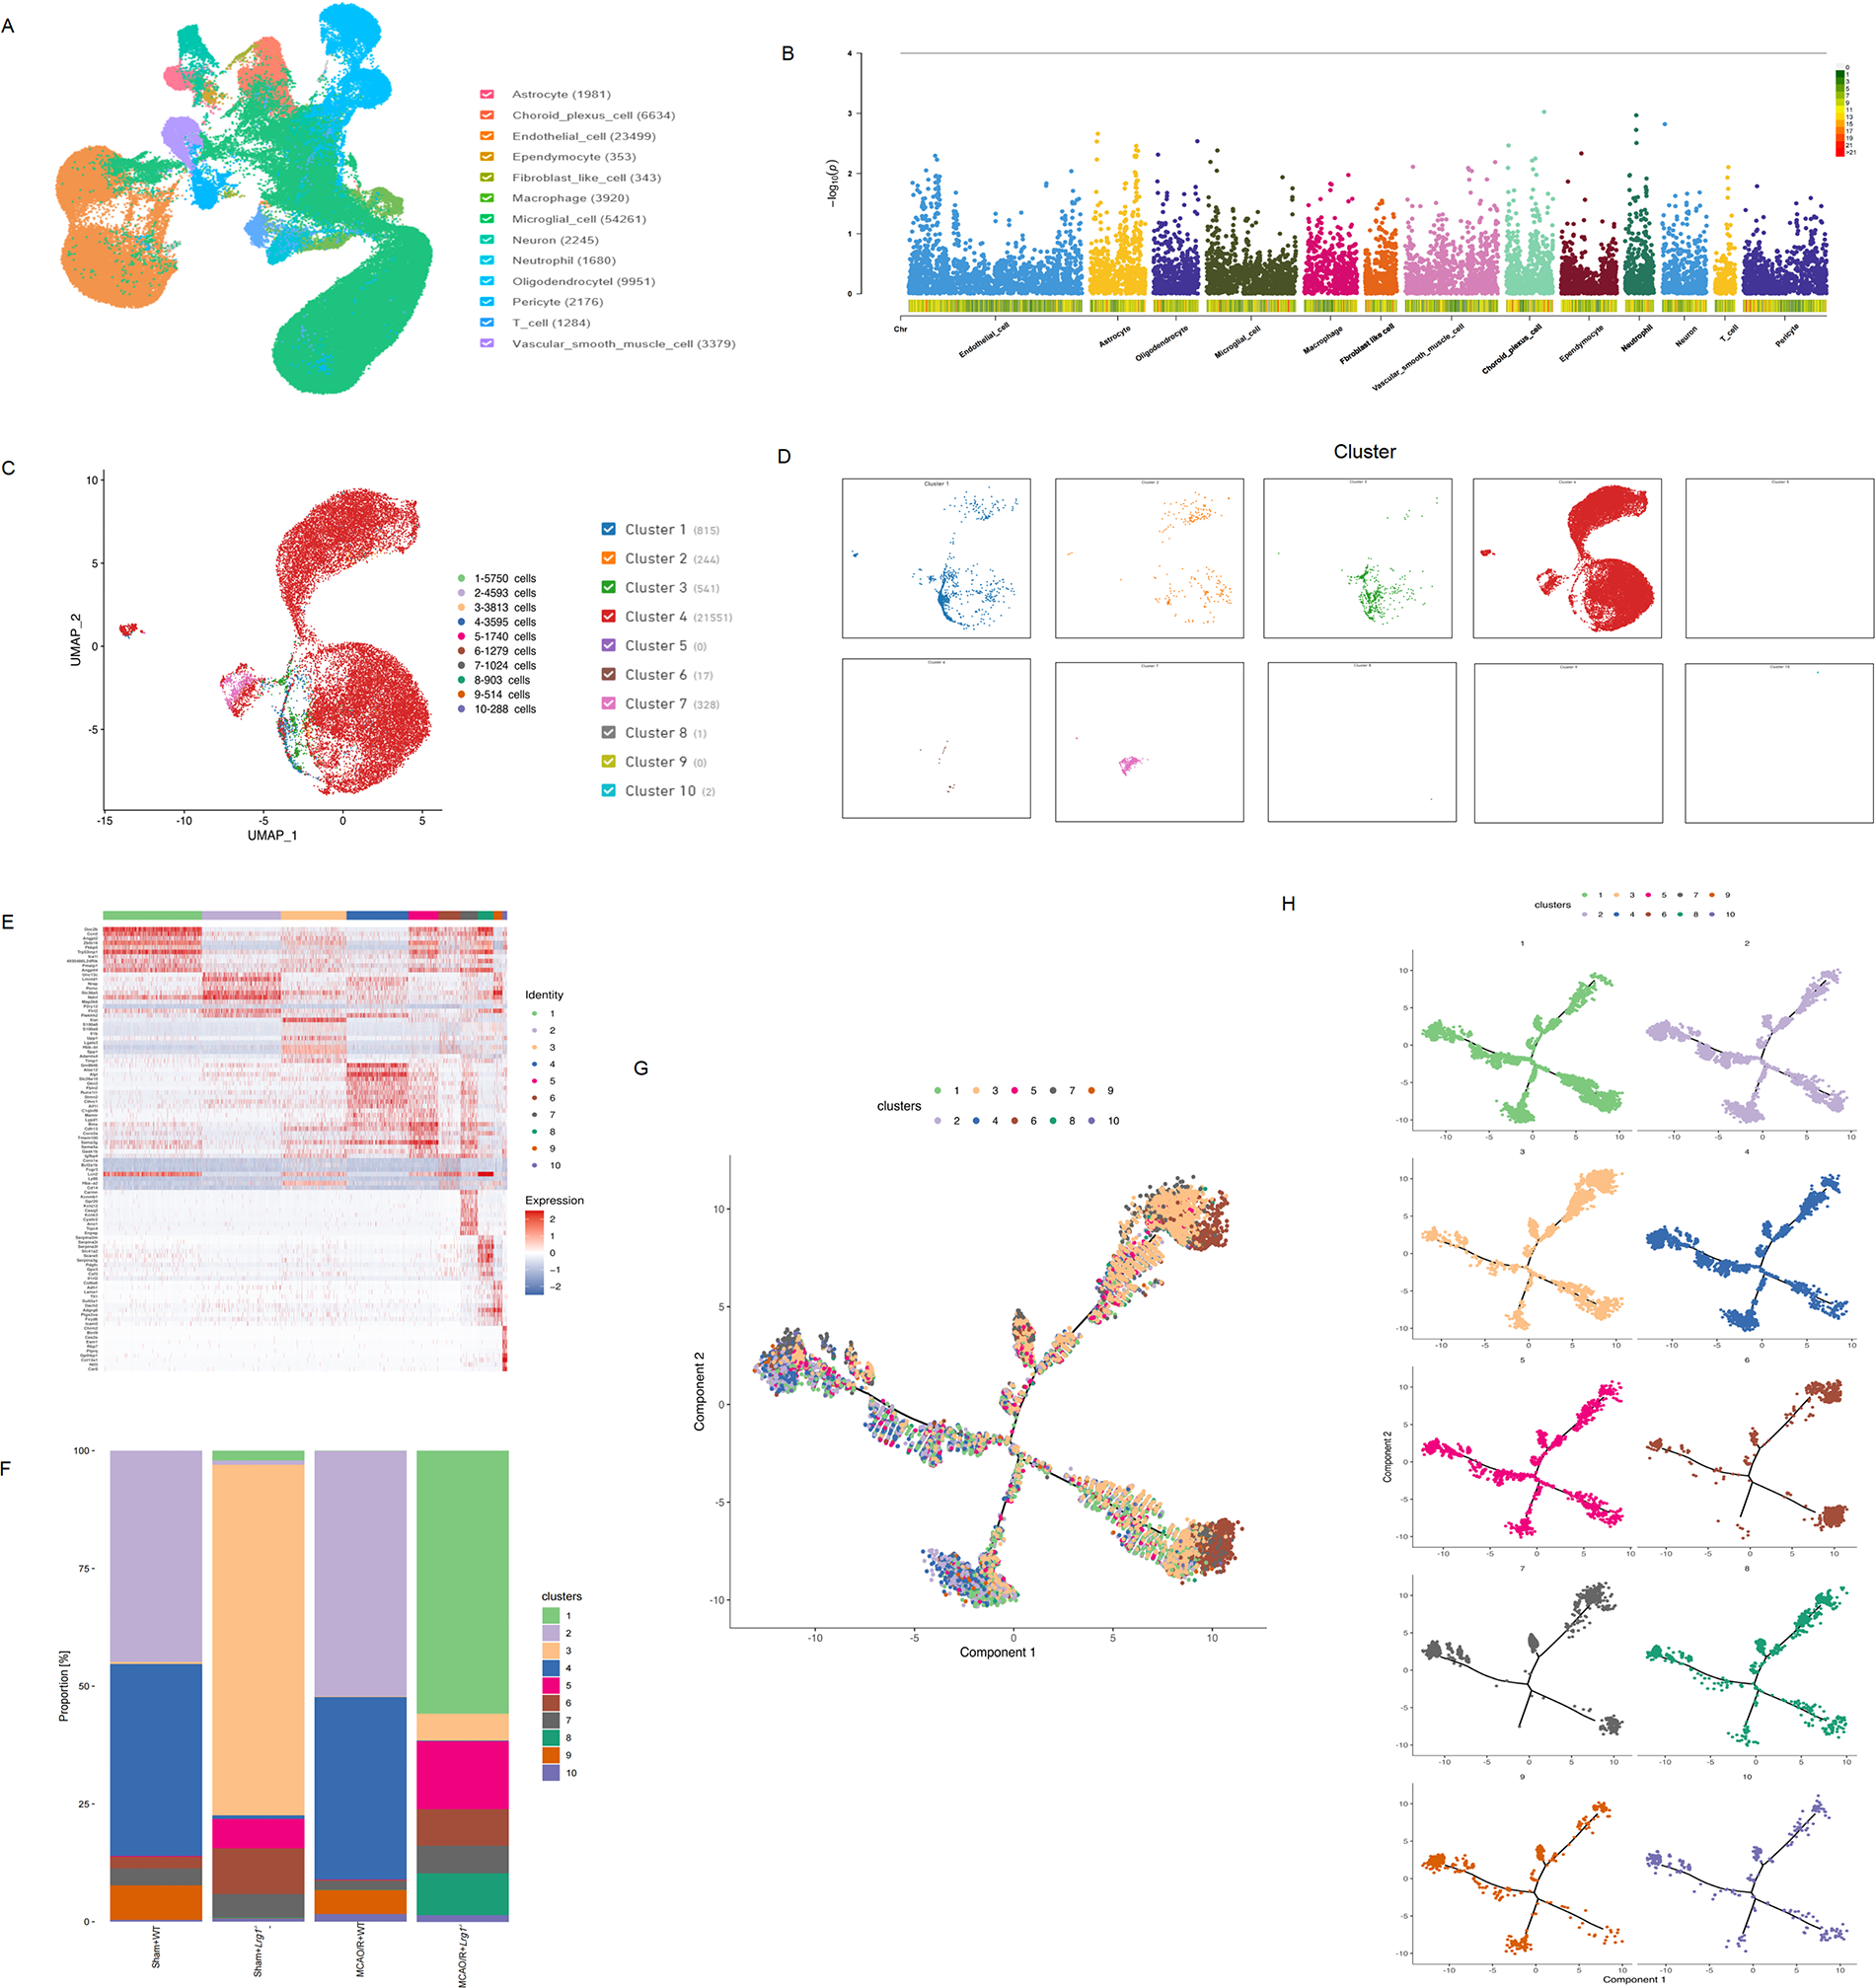
Figure 4: Lrg1 knockout affects endothelial cell maturation after cerebral ischemia–reperfusion injury in mice. (A) Uniform manifold approximation and projection (UMAP) plots of 170,069 cells from 12 mice, including 13 cell types. (B) The Manhattan map visually represents Lrg1 expression in different cell types. (C) The UMAP plot illustrates the clustering results of endothelial cells in brain tissue after MCAO/R. (D) The UMAP plot clarifying the distinct endothelial cells in brain tissue after MCAO/R. (E) The heatmap displays the expression patterns of the top 50 differentially expressed genes among distinct endothelial subpopulations. (F) Different proportions of the clusters of endothelial cells in different groups. (G) The dot plot demonstrates the distribution of different clusters in the differentiation trajectory plot of endothelial cells using monocle2. (H) Disaggrega-tired endothelial cell clusters in the differentiation trajectory plot using monocle2
3.5 Lrg1 Knockout Uncovers Significant Modifications in the Transcriptional Landscapes of Endothelial Cells within Brain Tissue after Cerebral Ischemia–Reperfusion Injury
To process the various functions of endothelial subtypes, it is compared the differences between endothelial subtypes are compared with the GSEA functional score. Endothelial_C7, Endothelial_C8, and Endothelial_C9 had higher hypoxia scores. (Fig. 5A,B). Endothelial_C3, Endothelial_C6, Endothelial_C9 had higher oxidative phosphorylation scores, whereas Endothelial_C1, Endothelial_C2, Endothelial_C4, Endothelial_C5, Endothelial_C8, Endothelial_C9, and Endothelial_C10 had lower oxidative phosphorylation scores (Fig. 5C,D). Additionally, we observed that Endothelial_C3, Endothelial_C7, and Endothelial_C10 had adhesion scores suggesting that they have a stronger adhesive capacity (Fig. 5E,F). We observed that Endothelial_C2, Endothelial_C4, Endothelial_C7, Endothelial_C9, Endothelial_C10 had higher cell chemotaxis scores, whereas Endothelial_C1, Endothelial_C3, Endothelial_C5, Endothelial_C6, Endothelial_C8 had lower chemotaxis scores (Fig. 5G,H). The functional score of the endothelial subcluster varies depending on the scoring indexes. RSS scoring showed that Nfic, Otx2, and Fos expression increased significantly in the sham+WT group, whereas the expression of Runx3, Irf8, and Sox4 transcription factors was increased in sham+MCAO/R group (Fig. 5I). After Lrg1 knockout, Ets1, Jun, and Fos expression increased significantly in the sham+Lrg1−/− group, whereas the expression of Fos, Zmiz1, and Sox4 transcription factors expressed in the MCAO/R+Lrg1−/− group based on RSS scoring (Fig. 5J). These transcription factors, which potentially govern the differentiation of endothelial cells, could also indirectly affect microglial differentiation by modulating the underlying transcriptional regulatory mechanisms.
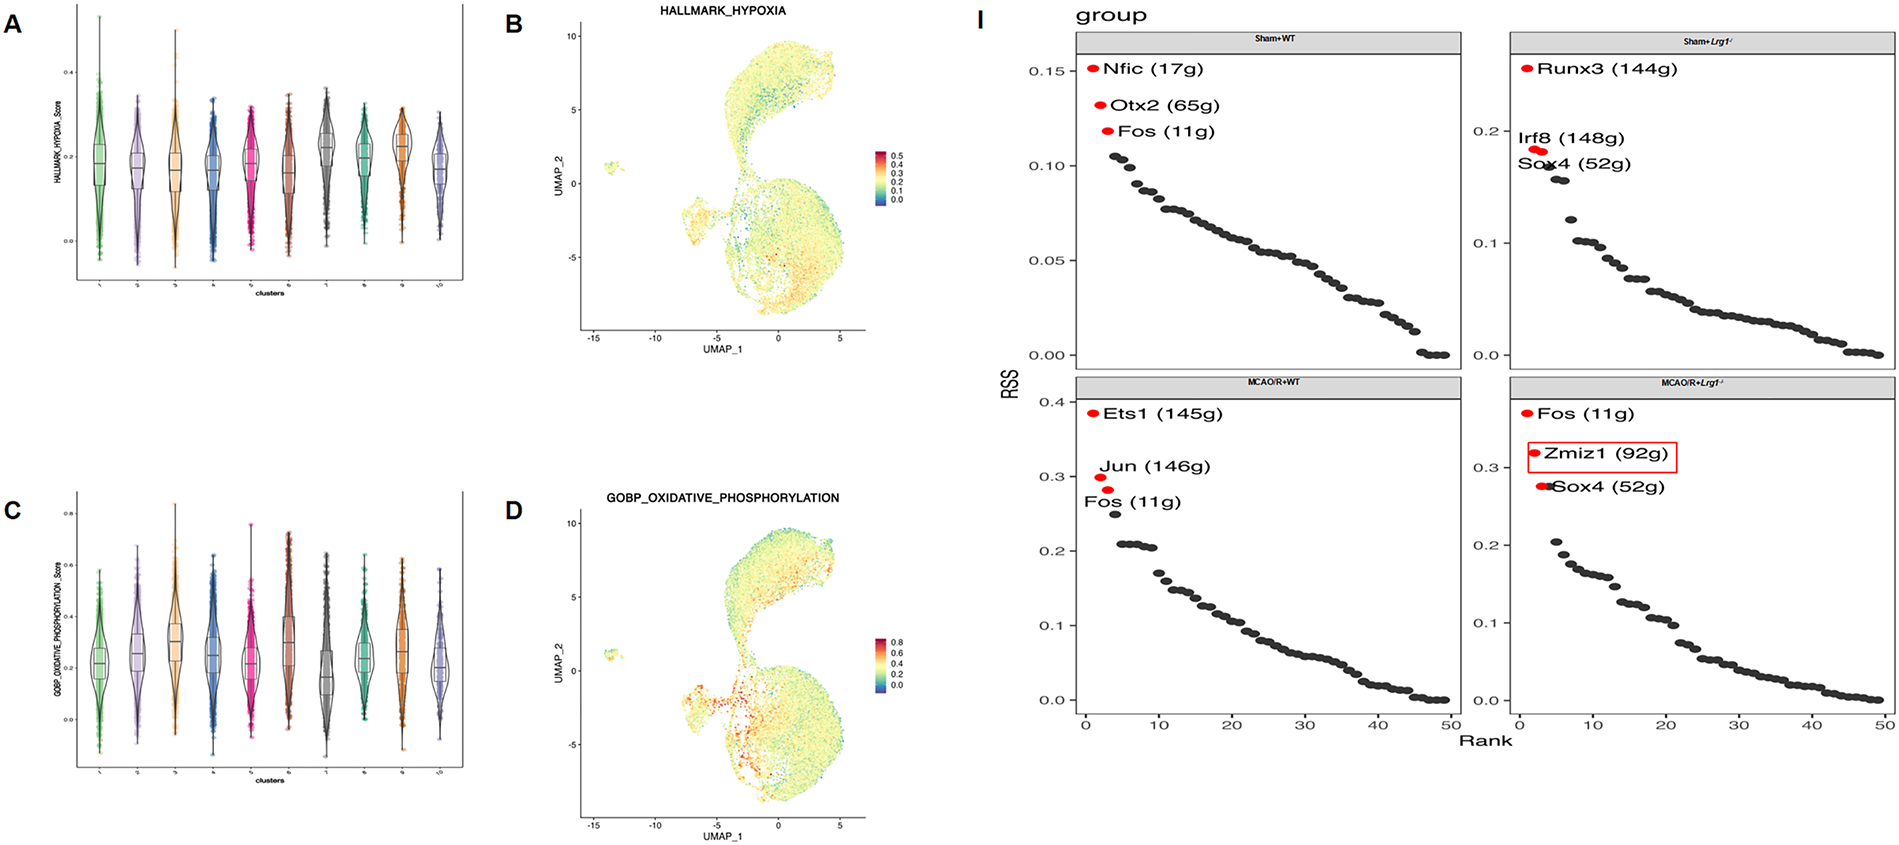
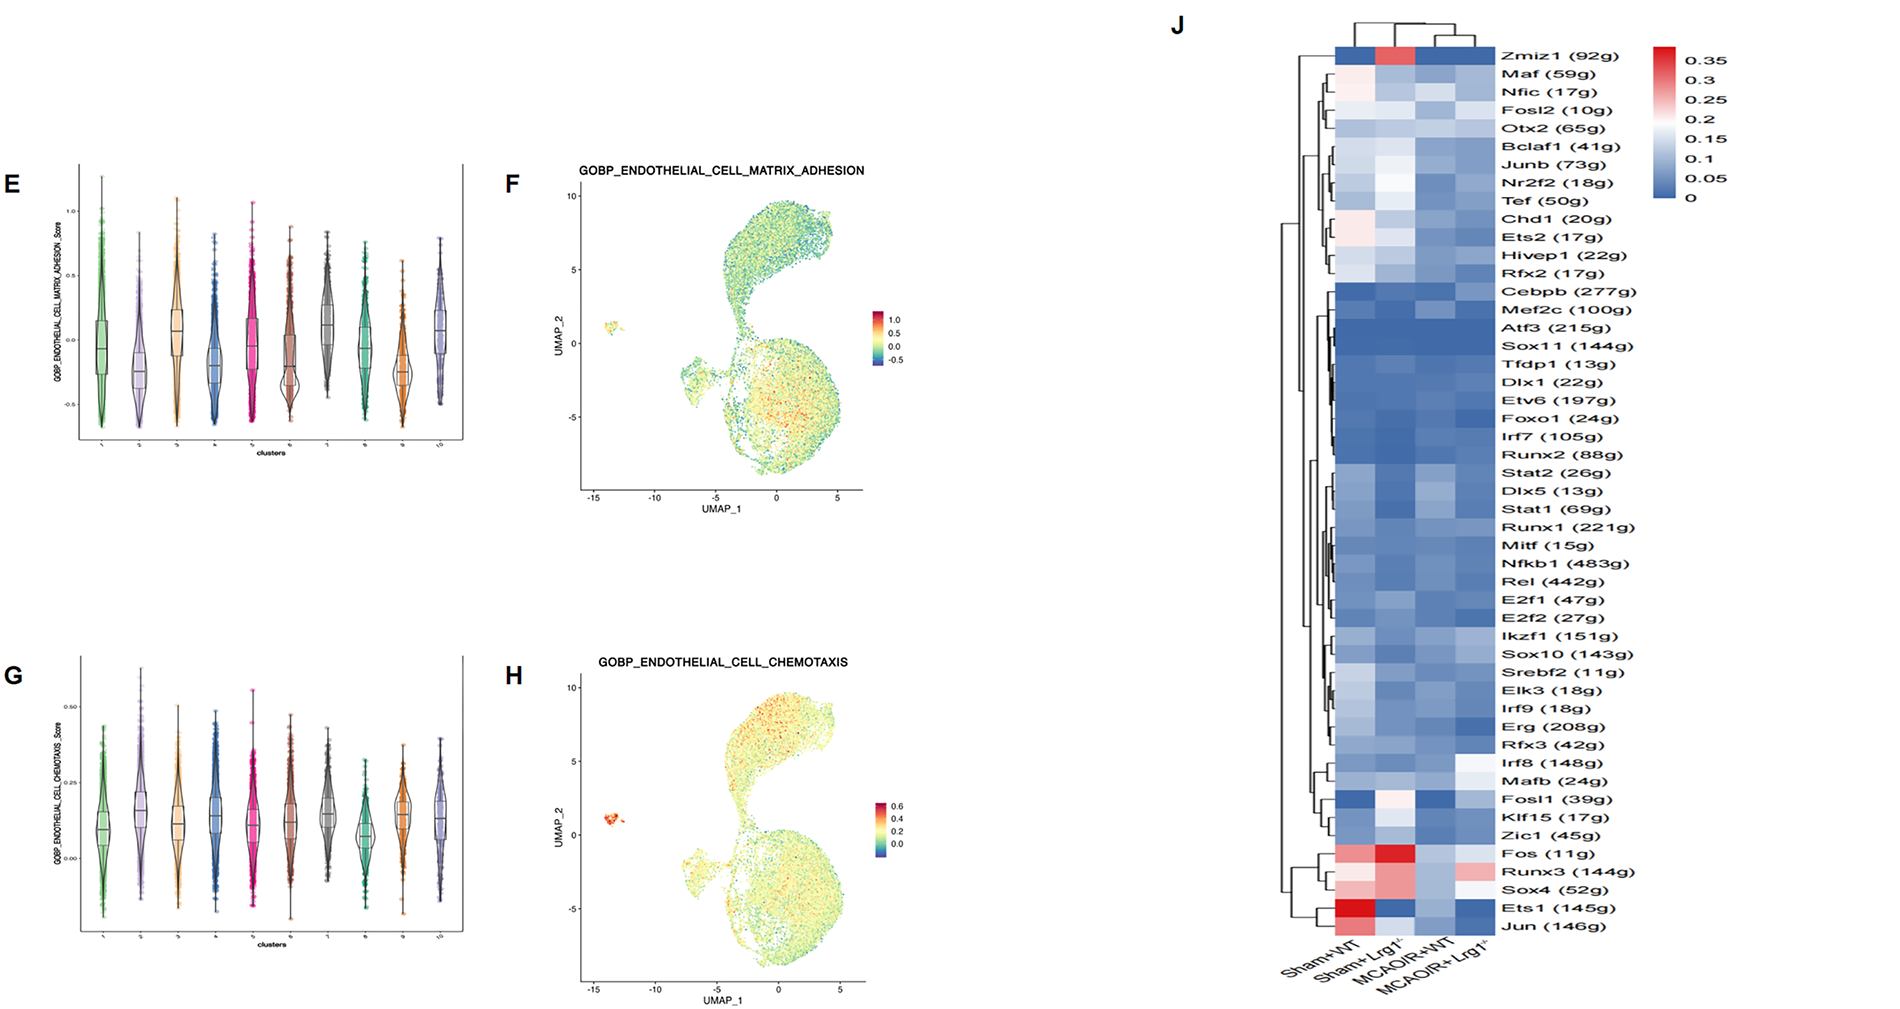
Figure 5: Lrg1 knockout uncovers significant modifications in the transcriptional profiles of endothelial cells in brain tissue after cerebral ischemia–reperfusion injury. (A) The box plot displays the hypoxia scores in endothelial cells across different clusters. (B) Hypoxia score featureplot. (C) The box plot displays oxidative phosphorylation scores in endothelial cells across different clusters. (D) Oxidative phosphorylation score score featureplot. (E) The box plot displays the adhesion scores in endothelial cells across different clusters. (F) Adhesion score featureplot. (G) The box plot displays the chemotaxis scores in endothelial cells across different clusters. (H) Chemotaxis score featureplot. (I) The heatmap illustrates the transcription factors that varied along the endothelial differentiation trajectory in different groups. (J) RSS score for the transcription factors in different groups
3.6 Transcription Factor Zmiz1 Regulates the Transcription of Fzd3
On the hTFtarget database website (https://guolab.wchscu.cn/hTFtarget/#!/targets/integrate?tf=ZMIZ1, accessed on 26 November 2025), we conducted a query to identify proteins regulated by the transcription factor Zmiz1. Our investigation revealed a regulatory relationship between Zmiz1 and Fzd3 (Fig. 6A). In comparison to the control group, both oxygen-glucose deprivation/reperfusion (OGD/R) treatment and pcDNA-Zmiz1 transfection substantially enhanced the interaction between Zmiz1 and the promoter region of Fzd3. Following the fusion of the Fzd3 promoter with the luciferase reporter gene and subsequent co-transfection into endothelial cells, we detected notable luciferase activity, suggesting that overexpression of Zmiz1 activates Fzd3 transcription (Fig. 6B). Moreover, ChIP assays and western blot analyses provided compelling evidence that Zmiz1 can modulate Fzd3 transcription, thereby influencing its expression at both the mRNA and protein levels (Fig. 6C–G). Collectively, these findings substantiate the existence of specific binding sites for Zmiz1 on the Fzd3 promoter and firmly establish Zmiz1 as a critical regulator of Fzd3 expression.
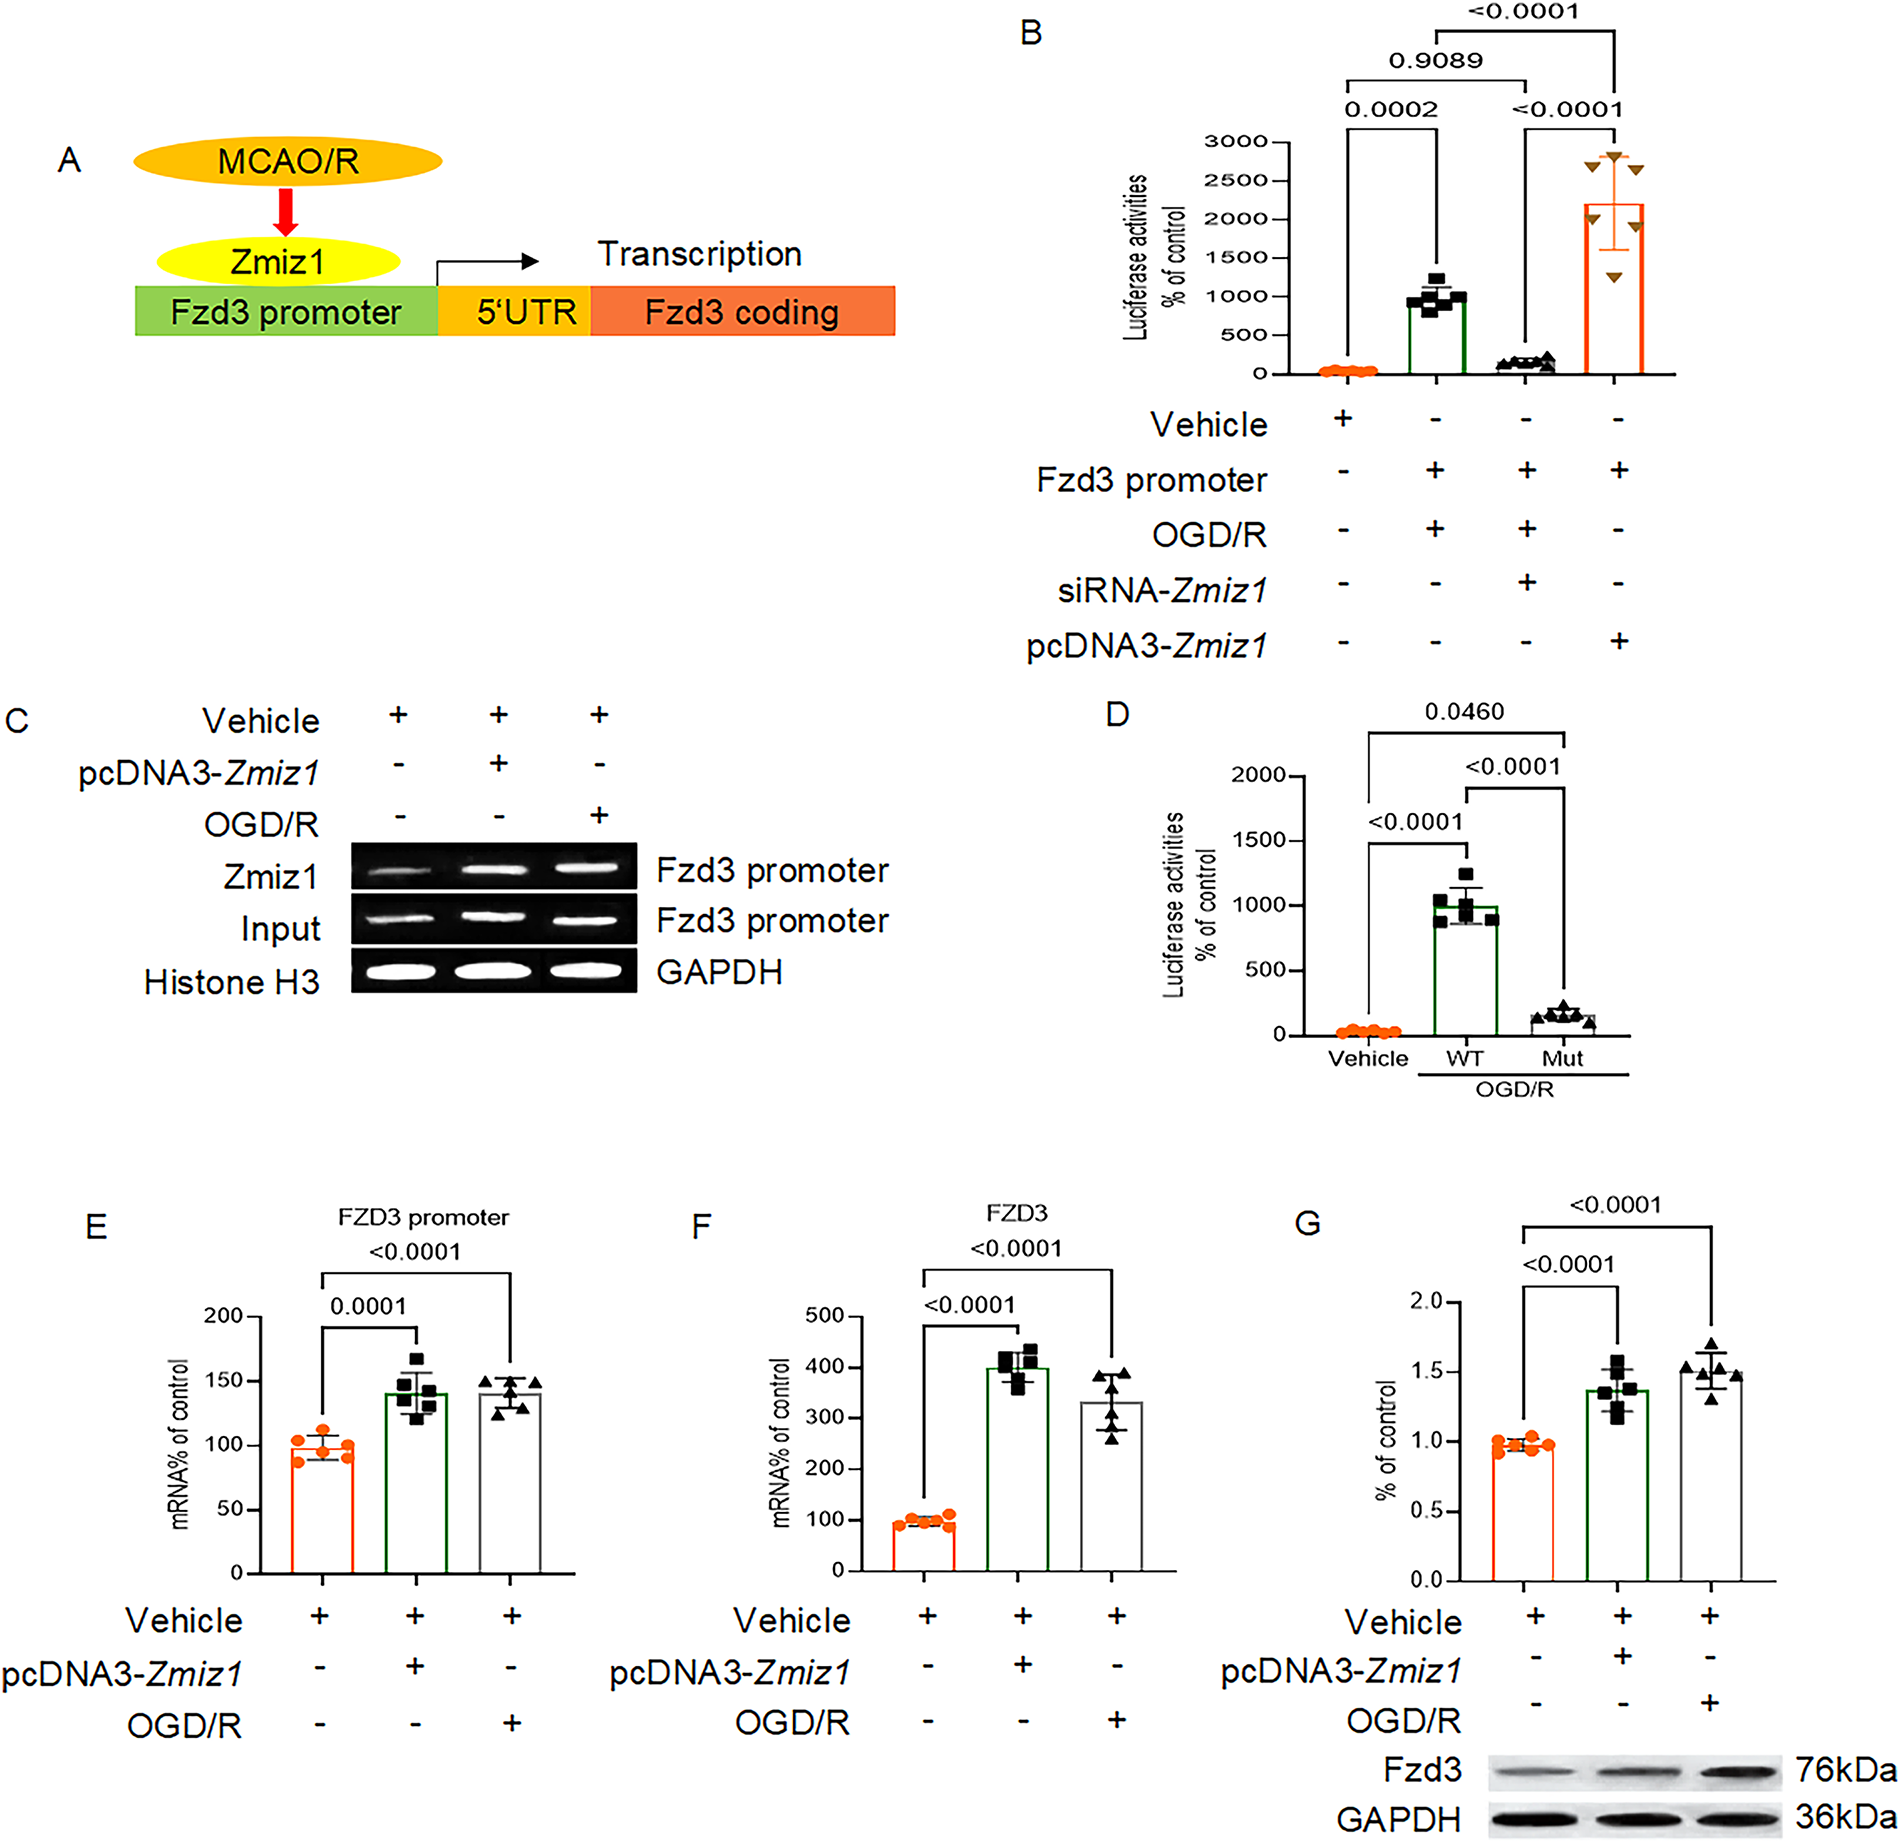
Figure 6: Transcription factor Zmiz1 regulates the transcription of Fzd3. (A) Schematic diagram of the regulatory mechanism of Zmiz1 on Fzd3. (B) Luciferase assay to detect the activation of the Fzd3 promoter sequence following MCAO/R and transfection with pcDNA3-Zmiz1 or siRNA-Zmiz1, n = 3. (C) ChIP-PCR analysis of the Fzd3 promoter sequence of endothelial cells in the control group, OGD/R treatment, or transfected with the pcDNA3-Zmiz1. (D) Luciferase assay of Fzd3 promoter activation under OGD/R treatment, n = 3. (E–G) Expression levels of the Fzd3 promoter sequence, Fzd3 mRNA, and Fzd3 protein in the control group, transfected with pcDNA3-Zmiz1, or subjected to MCAO/R, n = 3
3.7 The Knockdown of Zmiz1 on FZD3 in the Ischemic Brain after Cerebral Ischemia-Reperfusion
Compared with the Sham group, Zmiz1 expression was upregulated in both WT and Lrg1−/− groups after MCAO/R, suggesting Zmiz1 activation and expression post-cerebral ischemia-reperfusion (Fig. 7A,B). The induction of Zmiz1 exhibited a more robust upregulation in Lrg1−/− mice than in WT counterparts after cerebral ischemia reperfusion (Fig. 7A,B). We constructed a short hairpin RNA (shRNA) targeting Zmiz1 and evaluated its knockdown efficiency in brain tissue via lateral ventricular injection post-injury. The results showed that the knockdown of Zmiz1 reduced its expression in both WT and Lrg1−/− groups post-cerebral ischemia-reperfusion (Fig. 7C,D). Similarly, Fzd3 expression significantly increased in the WT group after MCAO/R, with a more pronounced upregulated in the Lrg1−/− group (Fig. 7E,F). We injected sh-Zmiz1 into the lateral ventricles of WT or Lrg1−/− mice post-MCAO/R to observe Fzd3 changes. Compared to sh-Zmiz1 NC, sh-Zmiz1 injection effectively reduced Fzd3 expression in both the MCAO/R+WT and MCAO+Lrg1−/− groups (Fig. 7G,H). Immunofluorescence analysis confirmed these results (Fig. 7I,J), highlighting Zmiz1 as a key upstream regulator in the Fzd3 signaling pathway.
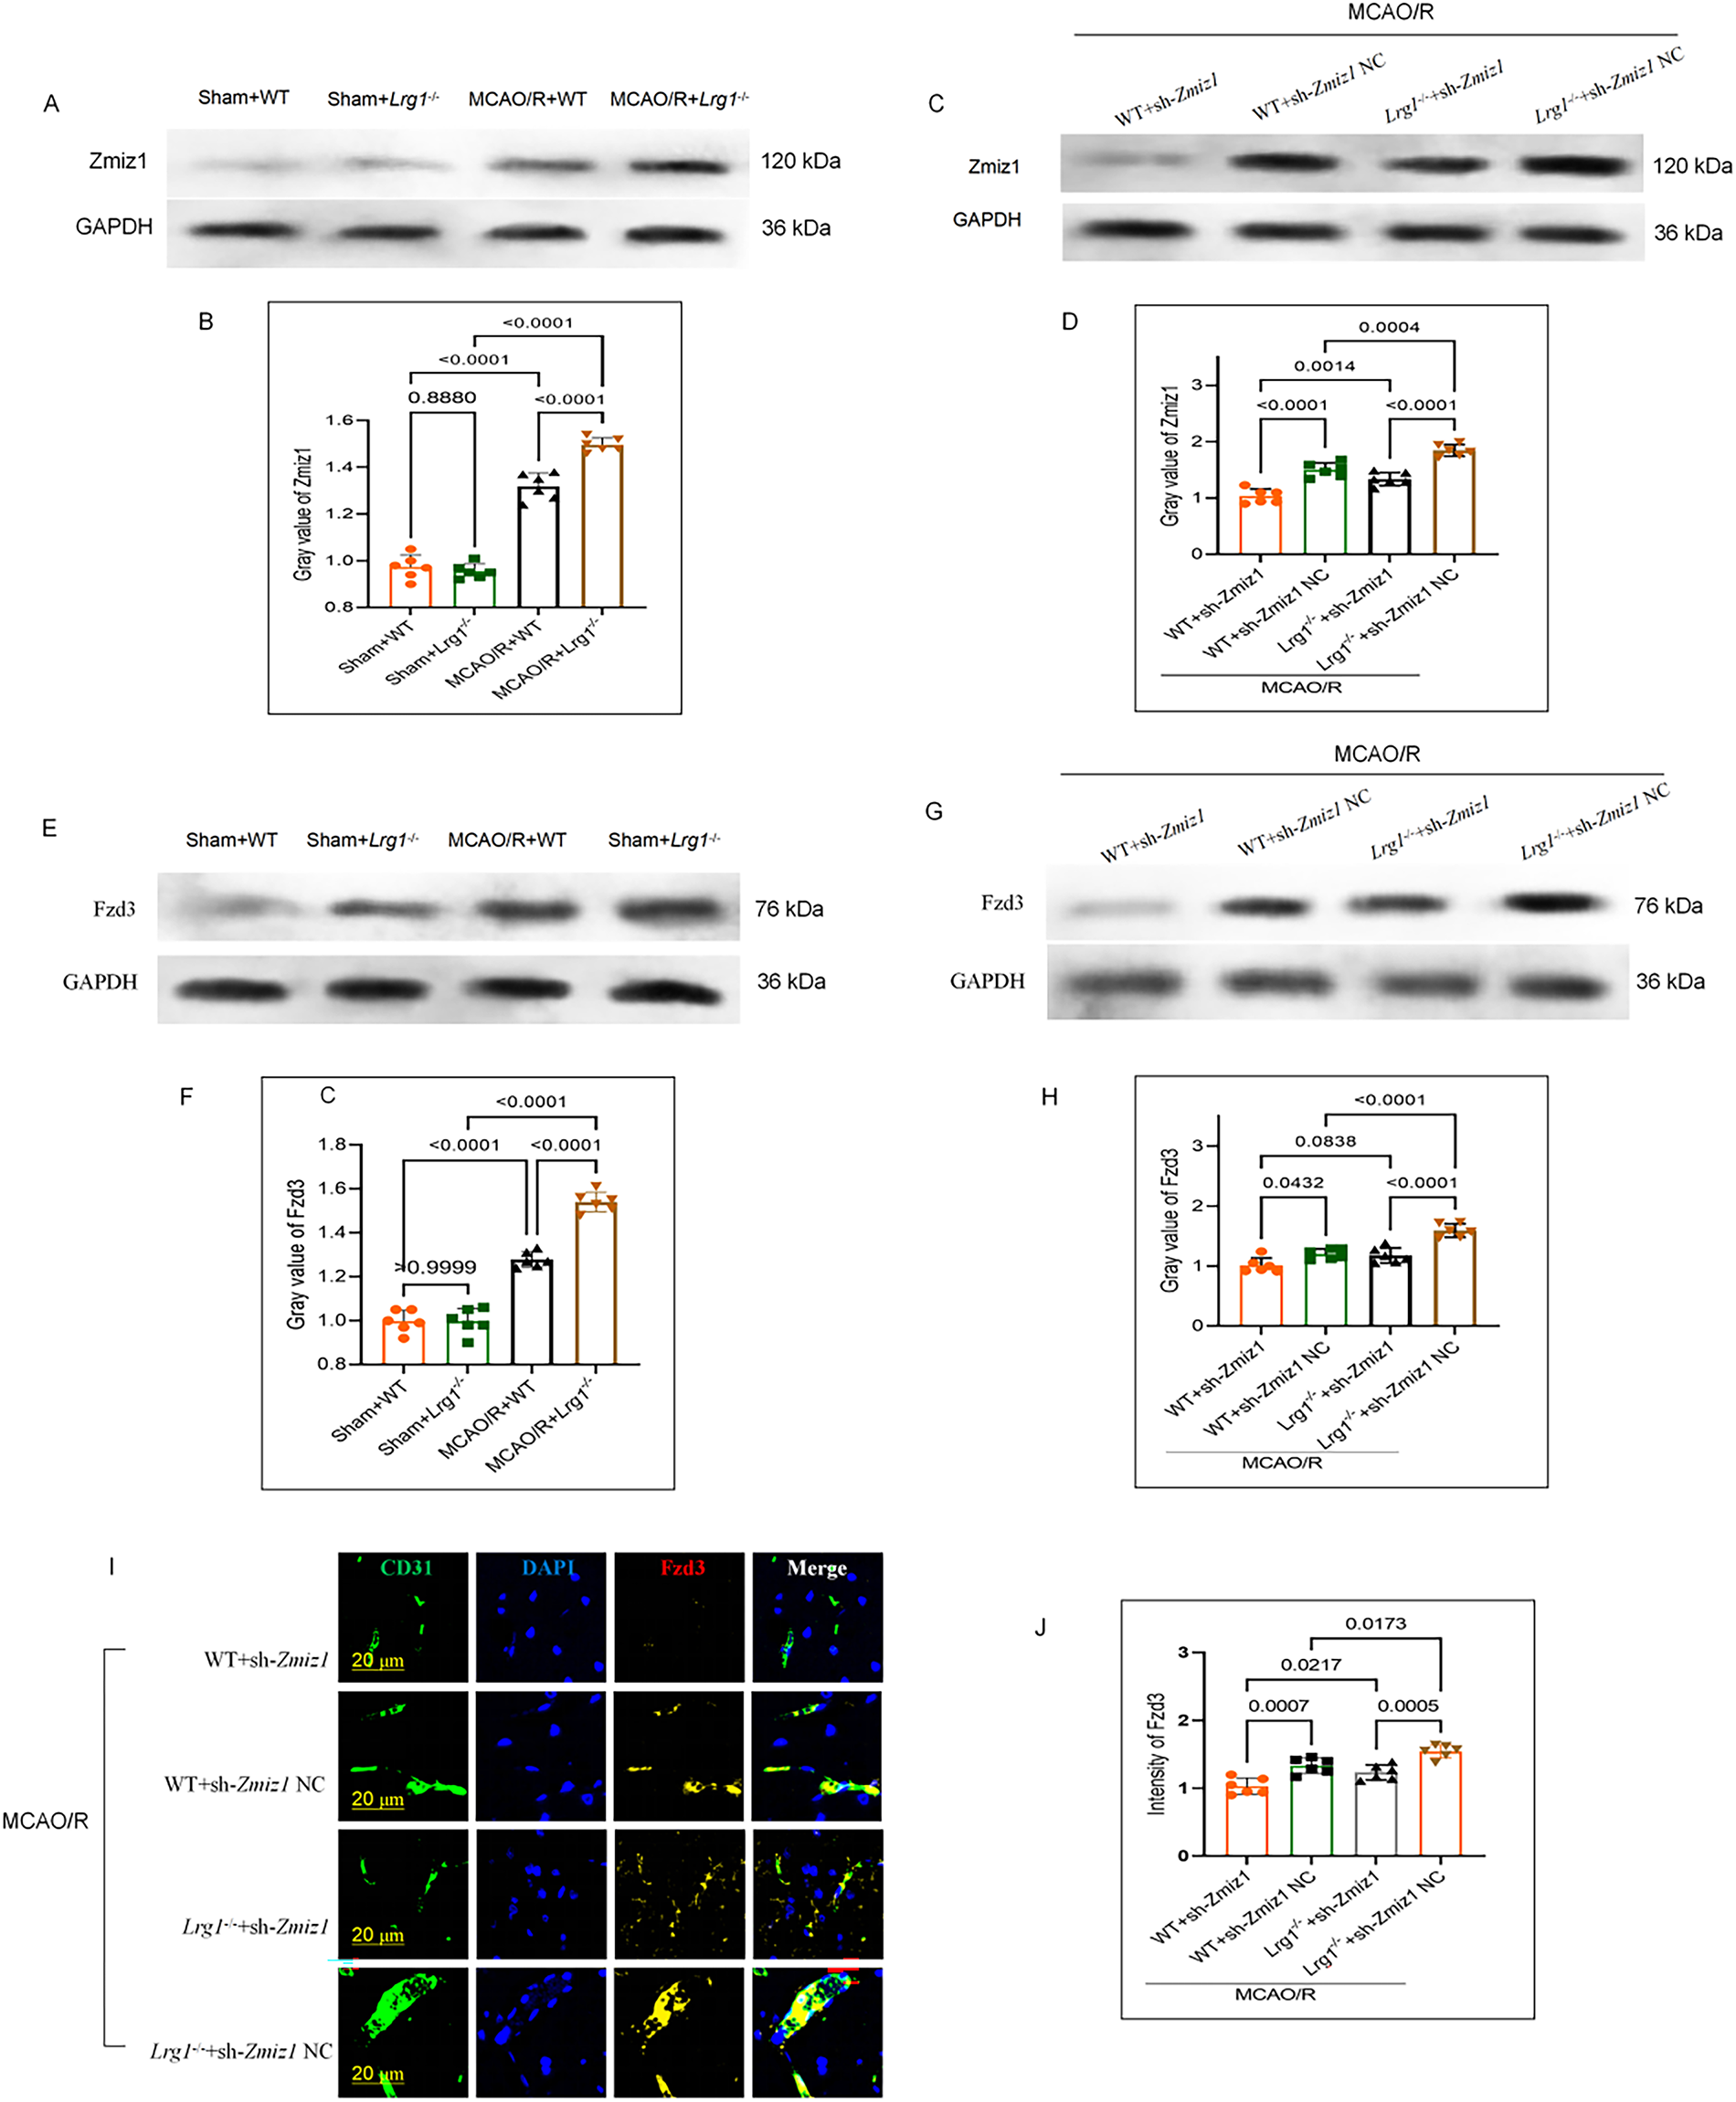
Figure 7: The knockdown of Zmiz1 on Fzd3 in the ischemic brain after cerebral ischemia-reperfusion. (A) Western blotting was employed to quantify the knockdown efficiency of sh-Zmiz1 via intraventricular injection in brain tissue after cerebral ischemia-reperfusion. (B) Error bar graph depicting the Zmiz1 expression of brain tissues in different groups. Data are the mean ± SD, n = 6. (C) Western blotting was performed to assess the protein expression of Zmiz1 in brain tissue after intraventricular injection of sh-Zmiz1. (D) Error bar graph showing the Zmiz1 expression of brain tissues in different groups. Data are the mean ± SD, n = 6. (E) Western blotting was employed to quantify the knockdown efficiency of sh-Zmiz1 via intraventricular injection in brain tissue after cerebral ischemia-reperfusion. (F) Error bar graph depicting the Fzd3 expression of brain tissues in different groups. Data are the mean ± SD, n = 6. (G) Western blotting was performed to assess the protein expression of Fzd3 in brain tissue after intraventricular injection of sh-Zmiz1. (H) Error bar graph shows the Fzd3 expression of brain tissues in different groups. Data are the mean ± SD, n = 6. (I) Representative images depicting Fzd3 protein expression after the injection of sh-Zmiz1 in the brain tissues of mice from different groups. Scale bar = 20 μm. (J) Error bar graph depicting Fzd3 quantification. Data are presented as mean ± SD, n = 6
3.8 The Knockdown of Zmiz1 Further Destroys the Tight Junction (TJ) in the Ischemic Brain after Cerebral Ischemia-Reperfusion
CellChat calculation provides predictive statistical abilities based on historical data gathered within the known receptor-ligand database. Intercellular communication analysis indicates that, compared with the sham-operated group, the interactions between endothelial cells and neutrophils are enhanced in the MCAO/R group (Fig. 8A). The most notable alterations in receptor-ligand pairs are detected in the MCAO/R+Lrg1−/− group within the Fzd3 signaling pathway, involving the key molecules Fzd3 and Lrp6 (Fig. 8B). From Fig. 7, transcription factor Zmiz1 plays a major role in cellular response via the knockdown of Zmiz1 after cerebral ischemia-reperfusion. The protective mechanism of Zmiz1 on the tight junction is also explored via immunofluorescent staining. Select the expression of Claudin-5 (Fig. 8C,D), Occludin (Fig. 8E,F), and ZO-1 (Fig. 8G,H) in endothelial cells as the tight junction (TJ) injury indexes; intraventricular injection of sh-Zmiz1 could enhance the destruction of immunofluorescent intensity of the tight junction gap. The above data indicated that the knockdown of Zmiz1 further destroys the tight junction (TJ) in the ischemic brain after cerebral ischemia-reperfusion.
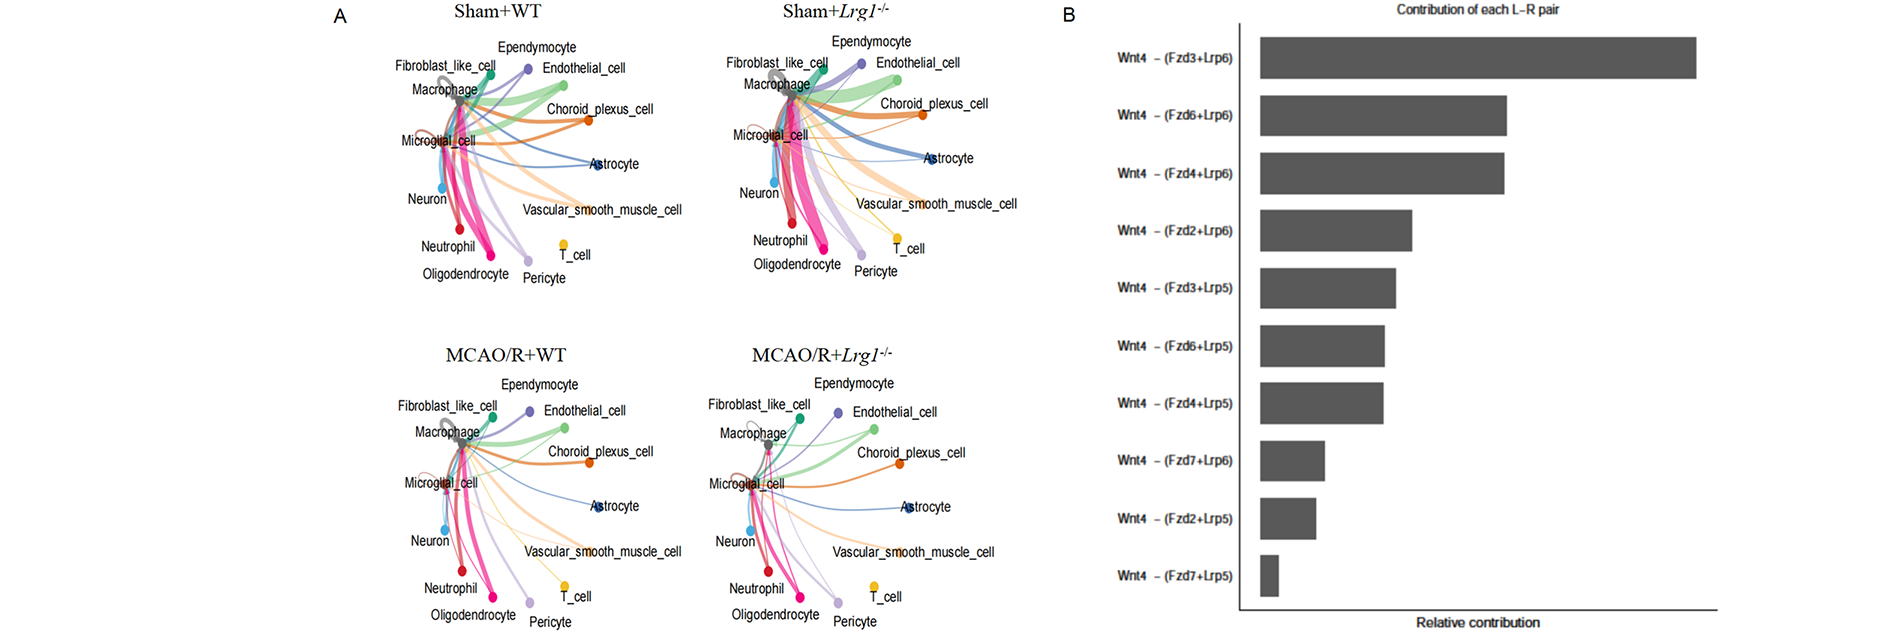
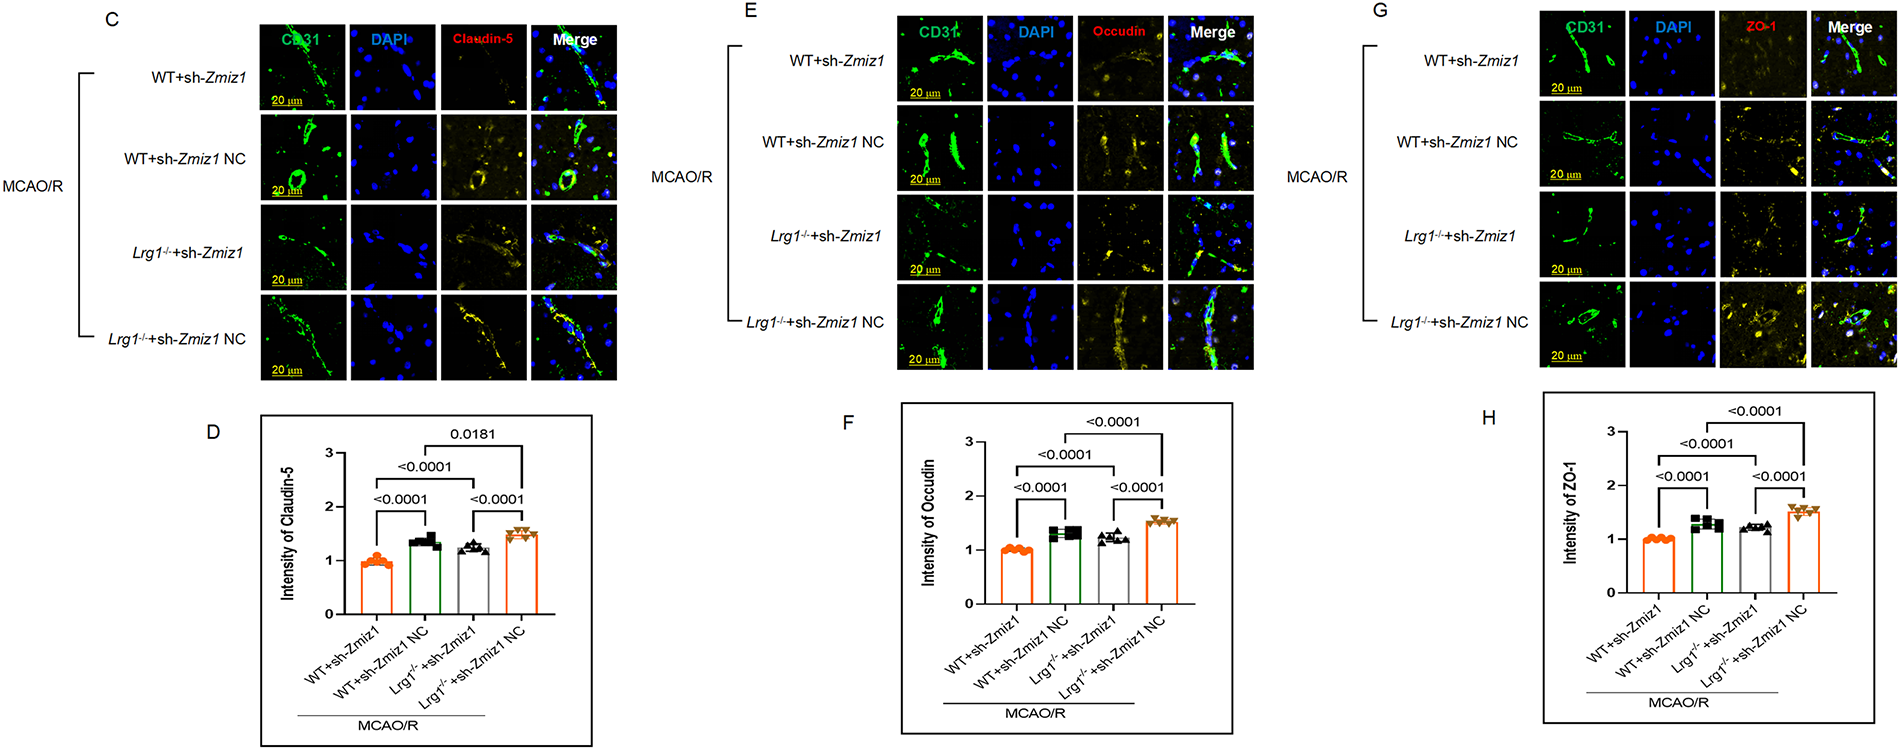
Figure 8: The knockdown of Zmiz1 further destroys the tight junction (TJ) in the ischemic brain after cerebral ischemia-reperfusion. (A) CellChat calculation based on receptor-ligand pairs. (B) Fzd3 signaling pathway receptor-ligand pairs contribution involved in the MCAO/R+Lrg1−/− group. (C) Representative images displaying Claudin-5 protein expression (red) of brain tissues (endothelial cells: green) after intraventricular injection of sh-Zmiz1. Scale bar = 20 μm. (D) Error bar graph depicting Claudin-5 quantification. Data are presented as mean ± SD, n = 6. (E) Representative images displaying Occludin protein expression (red) of brain tissues (endothelial cells: green) after intraventricular injection of sh-Zmiz1. Scale bar = 20 μm. (F) Error bar graph depicting Occludin quantification. Data are presented as mean ± SD, n = 6. (G) Representative images displaying ZO-1 protein expression (red) of brain tissues (endothelial cells: green) after intraventricular injection of sh-Zmiz1. Scale bar = 20 μm. (H) Error bar graph depicting ZO-1 quantification. Data are presented as mean ± SD, n = 6
Endothelial cells are a highly dynamic monolayer of cells arranged on the vascular network, which is positioned at the pivotal interface where circulating blood interacts with semi-solid tissues. Endothelial cells are fundamental to brain tissue integrity, and it’s essential to the way of physiological function and maintaining homeostasis. The homeostasis imbalance of vascular endothelial cells is a key mechanism for the progression of panvascular disease. The core approaches to improving microenvironment disturbance were to maintain endothelial cell function. Endothelial cells are always the research hot spot and the difficulty. So, while our previous paper has indicated Lrg1 knockout could cause turbulence to endothelial cells [14], this is the first time we’ve presented experimental evidence. After Lrg1 knockout, the results reveal “cell heterogeneity” among a cell population, that discrepancy among morphology, physiological state, gene expression, and so on. Researchers drew a specific map of endothelial cells from glioblastoma patients; 5 endothelial subclusters in the samples were analyzed [22]. In the research on ischemia stroke, it is interesting to find 6 distinct endothelial cell subclusters in the brain tissue after ischemia stroke [6]. In our data, we also saw that 10 endothelial subclusters were differentiate induced by Lrg1 knockout after cerebral ischemia-reperfusion. Different numbers for differentiated endothelial subclusters might deepen on the conditioned stimulus, like Lrg1 knockout or reperfusion period. The differentiated endothelial subclusters broke up the traditional definition of endothelial cells. Here, the study adds to the evidence that ischemia stroke-reperfusion has important effects on endothelial cell differentiation. GSEA provides different scores of assessments for endothelial subclusters, such as hypoxia, oxidative phosphorylation, adhesion, and chemotaxis, exhibiting that each endothelial subcluster performed a different function.
The heterogeneity of endothelial cells has emerged as a crucial research focus in recent years, emphasizing their study as a functional organ. Single-cell sequencing of 11 healthy placental villus samples (6–16 weeks gestation) from selective terminations identified three endothelial cellular subtypes: endothelial cell-2 as potential placental vascular progenitors/immature cells capable of self-renewal or differentiating into endothelial cell-1 (proliferating vasculogenic cells in early pregnancy) and endothelial cell-3 (predominant, differentiated mid-gestation type with angiogenic phenotype), with pseudotime and RNA velocity analyses reinforcing endothelial cell-2’s progenitor role; SCENIC (single cell regulatory network inference and clustering) analysis revealed upregulated regulators in endothelial cell-1 facilitating early endothelial cellular differentiation and vascular maturation, while endothelial cell-3 was enriched with regulators activating vascular transcription factors [23]. A systems view proposes vascular endothelial cells as a systemically distributed organ with endothelium types shaping organ phenotypes/functions, where Ets factors Erg and Fli1 maintain quiescence [2], and hematopoietic stem/progenitor cells emerge from endothelial cells via endothelial-to-hematopoietic transition, with Jund and Hoxa9a suppressing endothelial traits to promote hematopoietic fate [24]. scRNA-seq of tumor endothelial cells in human/mouse non-small cell lung cancer showed distinct phenotypes, functional differences, and cross-species conservation, with the most conserved endothelial cellular subtype correlating with anti-angiogenic therapy prognosis/response [25].
The traditional experimental analysis methods of a single target have limitations in describing dynamic unit variation. Researchers Zemin Zhang and Xianwen Ren have innovatively reconstructed the spatial relationships between cells, leveraging ligand-receptor mediated cell-cell interactions derived from scRNA-seq data, transforming these insights into a cell spatial organization model [26]. Two professors first realized the in silico perturbation on CSOmap to examine the effect of specific genes or cell populations on cell spatial relationships [26]. These interference experiments could be as high expression and knockdown of specific genes, or the targeted removal or addition of certain cell groups. Up to now, there is little literature on the neurovascular unit based on CSOmap. Moreover, the CSOmap model was also applied to analyze the project-specific roles of fibroblasts, endothelial cells, and osteosarcoma cells within the tumor microenvironment, revealing that these cells could promote the formation of a pre-metastatic niche through mechanisms such as angiogenesis and extracellular matrix remodeling [27]. Meanwhile, CSOmap analysis suggested that, compared with normal tertiary lymphoid structures in gastric adenocarcinoma, mature tertiary lymphoid structure tissues exhibited enrichment of a greater variety of immune cell types and higher immune cell density [28]. We first picked 6 representative cells to build the neurovascular unit. By quantifying the distance between cells, we could distinguish the intercellular interaction change of WT mice from that of Lrg1−/− mice. The majority of cells within the Lrg1−/− mice were positioned farther away from the pseudo-center of the neurovascular unit, in contrast to their counterparts in WT mice. Furthermore, subsequent to cerebral ischemia-reperfusion, the distance separating cells within the neurovascular unit was observed to be greater in Lrg1−/− mice compared to WT mice. The result indicated that the interaction between cell-cell might be weakened due to the increased spatial distance, but the pharmacological mechanism and efficacy still need to be further clarified.
Transcription factors can regulate the differentiation process in a specific manner and thereby serve as major regulators of biological processes. The RSS score showed a strong expression of Zmiz1 in the Lrg1−/− group. Immunofluorescence staining and western blot analysis reconfirmed that the expression level of Zmiz1 was upregulated in the Lrg1−/− group compared to the WT mice group following cerebral ischemia-reperfusion. The current paper summarizes the transcription factors regulating endothelial cell heterogeneity, including: transcription factors Ets1, Mlf3, Znf281, Znf672 [23], Ppar-γ, Tcf4, Sox4, Smad1 [29], etc., among which Znf281 and Znf672 are zinc finger proteins. The zinc finger protein transcription factors constitute the most extensive family of transcription factors within the eukaryotic genome, encompassing proteins that bind Zn2+ ions and possess the ability to autonomously fold into a distinctive “finger” structure, hence their nomenclature as “zinc finger proteins.” Zinc finger protein has been reported as a protective factor for cerebral ischemia, like zinc finger protein Zfp580 could interfere with the expression of insulin-like receptors in cerebral microvascular endothelial cells to reduce the volume of cerebral infarction [30]. The RNA-seq data further indicated that immune response, cytokine-mediated signaling pathway, and positive regulation of defense response contribute significantly to the processes associated with cerebral ischemia-reperfusion. Upregulating zinc finger protein chemotactic protein in monocytes could protect against neuronal death induced by oxygen and glucose deprivation [31]. Currently, the influence of Zmiz1 has been documented primarily in neurological disorders, including primary dysmenorrhea [32] and multiple sclerosis [33], and its mechanism in cerebral ischemic diseases has not been reported. After transfection of retroviral vector encoding for transcription factor Zmiz1 of endothelial cells, the intervention of Zmiz1 further destroys the tight junction (TJ) in the ischemic brain after cerebral ischemia-reperfusion via western blot and immunofluorescent staining. Experimental verification based on the cell-cell interaction indicated that the important role of Zmiz1 seems to be the modulation of the Fzd3 signaling pathway.
Fzd3, a component of the Wnt signaling pathway. Wnt proteins are secreted glycoproteins with β-folding, regulating cell proliferation, differentiation, and polarity. Wnt7 exerts effects primarily by binding Fzd/Lrp5/6 receptors, inhibiting Gsk3β to stabilize β-catenin. The Wnt receptor Frizzled3 (Fzd3) plays a regulatory role in the Wnt signaling pathway, thereby contributing to brain axonal development and cancer progression [34]. A gradient of Fzd3 expression in inner ear afferents orchestrates precise dorsoventral columnar projections within the hindbrain [35]. The association of Fzd3 and related factors with dementia is corroborated by independent functional studies conducted in human subjects and model systems, as well as by their links to shared risk factors for stroke and dementia [36]. However, little literature presented the mechanism of Lrg1 associated with Wnt, but the conclusion is not unified. Lrg1 promoted angiogenesis and diabetic wound healing by activating the Wnt/beta-catenin pathway [37].
This research still has certain limitations. While we have conducted a preliminary exploration of the binding interaction between Zmiz1 and Fzd3, our comprehension of their reciprocal regulatory mechanism is still relatively rudimentary. Furthermore, the regulatory role of Zmiz1 warrants in-depth investigation via loss-of-function and gain-of-function assays. Our data revealed that Lrg1 knockout activated the ligand-receptor interaction of Fzd3 via regulating of Zmiz1. Zmiz1 seemed to regain the tight junction damage in ischemia stroke via the modulation of Fzd3 signaling pathway.
Preliminary analysis reveals endothelial cell heterogeneity in differentiation and function, yet lacks proof of critical subcluster functions, necessitating more data to link specific subsets to mechanisms and phenotypes. Considering the vital role of endothelial cell-neurovascular unit interaction in blood-brain barrier integrity, we employed single-cell RNA-seq, bulk RNA-seq, CSOmap, and experimental techniques. This led to a deeper understanding of how novel transcription factors regulate endothelial heterogeneity post cerebral ischemia-reperfusion. Current evidence shows Lrg1 knockout induces endothelial differentiation via key transcription factor Zmiz1 activation, which is crucial for blood-brain barrier function, likely through Fzd3 pathway modulation, as confirmed by integrative RNA-seq analyses.
Acknowledgement: We are very grateful to Dr. Xiaowei Xiong from the second affiliated hospital, Jiangxi Medical College, Nanchang University, for his assistance in the modifying language of this article. Moreover, special thanks go to Professor Qian Yisong and the Transformational Medicine Institute of Nanchang University for their assistance in providing transgenic animals. Graph abstract figure was created using BioRender, and a license EL28JQJ019 has been obtained.
Funding Statement: This work was supported by the Foundation Project: National Natural Science. Foundation of China (Nos.: 82460249, 82100417, 81760094); The Foundation of Jiangxi Provincial Department of Science and Technology Outstanding Youth Fund Project (20212BAB206022, 20242BAB23080).
Author Contributions: Conception and design: Shaofeng Xiong, Guosheng Cao, Yanni Lv; Animal experiments: Shaofeng Xiong, Guosheng Cao, Longsheng Fu, Mengfan Lei, Yanni Lv; Data collection: Shaofeng Xiong, Wenkai Lv, Wen Liu, Yanni Lv, and LSF; Draft manuscript preparation: Shaofeng Xiong, Wenkai Lv, Guosheng Cao, Longsheng Fu, Wen Liu, Mengfan Lei, Yanni Lv. All authors reviewed the results and approved the final version of the manuscript.
Availability of Data and Materials: The datasets generated during and analyzed during the current study are available in the repository: The data reported in this study are available at NCBI GEO (https://www.ncbi.nlm.nih.gov/geo/query/acc.cgi?acc=GSE245386, accessed on 26 November 2025) and (https://www.ncbi.nlm.nih.gov/geo/query/acc.cgi?acc=GSE279462, accessed on 26 November 2025). The resulting RNA-seq data, a testament to the rigor of the process, has been publicly accessible in NCBI’s Sequence Read Archive (assigned the unique accession number PRJNA1147915).
Ethics Approval: Ethics approval and consent to participate This study was approved by the ethics committee of the first affiliated hospital, Jiangxi Medical College, Nanchang University (Nanchang, China) (IACUC Issue No: CDYFY-IACUC-202306QR028).
Conflicts of Interest: The authors declare no conflicts of interest to report regarding the present study.
Supplementary Materials: The supplementary material is available online at https://www.techscience.com/doi/10.32604/journal.2025.073401/s1.
References
1. Bloom SI, Islam MT, Lesniewski LA, Donato AJ. Mechanisms and consequences of endothelial cell senescence. Nat Rev Cardiol. 2023;20(1):38–51. doi:10.1038/s41569-022-00739-0. [Google Scholar] [PubMed] [CrossRef]
2. Augustin HG, Koh GY. A systems view of the vascular endothelium in health and disease. Cell. 2024;187(18):4833–58. doi:10.1016/j.cell.2024.07.012. [Google Scholar] [PubMed] [CrossRef]
3. Wazny VK, Mahadevan A, Nguyen N, Wee H, Vipin A, Lam T, et al. Chronic cerebral hypoperfusion induces venous dysfunction via EPAS1 regulation in mice. Nat Commun. 2025;16(1):6302. doi:10.1038/s41467-025-61614-3. [Google Scholar] [PubMed] [CrossRef]
4. Zhong J, Gao RR, Zhang X, Yang JX, Liu Y, Ma J, et al. Dissecting endothelial cell heterogeneity with new tools. Cell Regen. 2025;14(1):10. doi:10.1186/s13619-025-00223-3. [Google Scholar] [PubMed] [CrossRef]
5. Crouch EE, Bhaduri A, Andrews MG, Cebrian-Silla A, Diafos LN, Birrueta JO, et al. Ensembles of endothelial and mural cells promote angiogenesis in prenatal human brain. Cell. 2022;185(20):3753–69.e18. doi:10.1016/j.cell.2022.09.004. [Google Scholar] [PubMed] [CrossRef]
6. Zheng K, Lin L, Jiang W, Chen L, Zhang X, Zhang Q, et al. Single-cell RNA-seq reveals the transcriptional landscape in ischemic stroke. J Cereb Blood Flow Metab. 2022;42(1):56–73. doi:10.1177/0271678X211026770. [Google Scholar] [PubMed] [CrossRef]
7. Blanchette M, Bajc K, Gastfriend BD, Profaci CP, Ruderisch N, Dorrier CE, et al. Regional heterogeneity of the blood-brain barrier. Nat Commun. 2025;16(1):7332. doi:10.1038/s41467-025-61841-8. [Google Scholar] [PubMed] [CrossRef]
8. Jin J, Sun H, Liu D, Wang H, Liu Q, Chen H, et al. LRG1 promotes apoptosis and autophagy through the TGFβ-smad1/5 signaling pathway to exacerbate ischemia/reperfusion injury. Neuroscience. 2019;413:123–34. doi:10.1016/j.neuroscience.2019.06.008. [Google Scholar] [PubMed] [CrossRef]
9. Meng H, Song Y, Zhu J, Liu Q, Lu P, Ye N, et al. LRG1 promotes angiogenesis through upregulating the TGF-β1 pathway in ischemic rat brain. Mol Med Rep. 2016;14(6):5535–43. doi:10.3892/mmr.2016.5925. [Google Scholar] [PubMed] [CrossRef]
10. Gu J, Liu C, Yao Y. Prognostic potency of plasma LRG1 measurement at multiple time points in acute ischemic stroke patients. Biomark Med. 2024;18(5):181–90. doi:10.2217/bmm-2023-0545. [Google Scholar] [PubMed] [CrossRef]
11. Cheng X, Wei H, Liu Y, Sun Y, Ye J, Lu P, et al. Relation between LRG1 and CD4+ T cells, cognitive impairment and neurological function in patients with acute ischemic stroke. Biomark Med. 2024;18(1):5–14. doi:10.2217/bmm-2023-0674. [Google Scholar] [PubMed] [CrossRef]
12. Savarraj JPJ, McBride DW, Park E, Hinds S, Paz A, Gusdon A, et al. Leucine-Rich Alpha-2-Glycoprotein 1 is a systemic biomarker of early brain injury and delayed cerebral ischemia After subarachnoid hemorrhage. Neurocrit Care. 2023;38(3):771–80. doi:10.1007/s12028-022-01652-7. [Google Scholar] [PubMed] [CrossRef]
13. Zou Y, Xu Y, Chen X, Wu Y, Fu L, Lv Y. Research progress on Leucine-Rich Alpha-2 Glycoprotein 1: a review. Front Pharmacol. 2021;12:809225. doi:10.3389/fphar.2021.809225. [Google Scholar] [PubMed] [CrossRef]
14. Ruan Z, Cao G, Qian Y, Fu L, Hu J, Xu T, et al. Single-cell RNA sequencing unveils Lrg1’s role in cerebral ischemia–reperfusion injury by modulating various cells. J Neuroinflamm. 2023;20(1):285. doi:10.1186/s12974-023-02941-4. [Google Scholar] [PubMed] [CrossRef]
15. Wang H, Hong LJ, Huang JY, Jiang Q, Tao RR, Tan C, et al. P2RX7 sensitizes Mac-1/ICAM-1-dependent leukocyte-endothelial adhesion and promotes neurovascular injury during septic encephalopathy. Cell Res. 2015;25(6):674–90. doi:10.1038/cr.2015.61. [Google Scholar] [PubMed] [CrossRef]
16. Hao Y, Hao S, Andersen-Nissen E, Mauck WM, Zheng S, Butler A, et al. Integrated analysis of multimodal single-cell data. Cell. 2021;184(13):3573–87.e29. doi:10.1016/j.cell.2021.04.048. [Google Scholar] [PubMed] [CrossRef]
17. Polański K, Young MD, Miao Z, Meyer KB, Teichmann SA, Park JE. BBKNN: fast batch alignment of single cell transcriptomes. Bioinformatics. 2020;36(3):964–5. doi:10.1093/bioinformatics/btz625. [Google Scholar] [PubMed] [CrossRef]
18. Liu B, Li C, Li Z, Wang D, Ren X, Zhang Z. An entropy-based metric for assessing the purity of single cell populations. Nat Commun. 2020;11(1):3155. doi:10.1038/s41467-020-16904-3. [Google Scholar] [PubMed] [CrossRef]
19. Sorin M, Rezanejad M, Karimi E, Fiset B, Desharnais L, Perus LJM, et al. Single-cell spatial landscapes of the lung tumour immune microenvironment. Nature. 2023;614(7948):548–54. doi:10.1038/s41586-022-05672-3. [Google Scholar] [PubMed] [CrossRef]
20. Cheng S, Li Z, Gao R, Xing B, Gao Y, Yang Y, et al. A pan-cancer single-cell transcriptional atlas of tumor infiltrating myeloid cells. Cell. 2021;184(3):792–809.e23. doi:10.1016/j.cell.2021.01.010. [Google Scholar] [PubMed] [CrossRef]
21. Gulati GS, Sikandar SS, Wesche DJ, Manjunath A, Bharadwaj A, Berger MJ, et al. Single-cell transcriptional diversity is a hallmark of developmental potential. Science. 2020;367(6476):405–11. doi:10.1126/science.aax0249. [Google Scholar] [PubMed] [CrossRef]
22. Zeng Q, Mousa M, Nadukkandy AS, Franssens L, Alnaqbi H, Alshamsi FY, et al. Understanding tumour endothelial cell heterogeneity and function from single-cell omics. Nat Rev Cancer. 2023;23(8):544–64. doi:10.1038/s41568-023-00591-5. [Google Scholar] [PubMed] [CrossRef]
23. Li H, Peng H, Hong W, Wei Y, Tian H, Huang X, et al. Human placental endothelial cell and trophoblast heterogeneity and differentiation revealed by single-cell RNA sequencing. Cells. 2022;12(1):87. doi:10.3390/cells12010087. [Google Scholar] [PubMed] [CrossRef]
24. Guo J, Liu M, Liu F, Wang L. Jund orchestrates cis-regulatory element dynamics to facilitate endothelial-to-hematopoietic transition. Proc Natl Acad Sci USA. 2025;122(23):e2426714122. doi:10.1073/pnas.2426714122. [Google Scholar] [PubMed] [CrossRef]
25. Goveia J, Rohlenova K, Taverna F, Treps L, Conradi LC, Pircher A, et al. An integrated gene expression landscape profiling approach to identify lung tumor endothelial cell heterogeneity and angiogenic candidates. Cancer Cell. 2020;37(3):421. doi:10.1016/j.ccell.2020.03.002. [Google Scholar] [PubMed] [CrossRef]
26. Ren X, Zhong G, Zhang Q, Zhang L, Sun Y, Zhang Z. Reconstruction of cell spatial organization from single-cell RNA sequencing data based on ligand-receptor mediated self-assembly. Cell Res. 2020;30(9):763–78. doi:10.1038/s41422-020-0353-2. [Google Scholar] [PubMed] [CrossRef]
27. Liu S, Tang H, Li S, Guan J, Cai Y, Li H, et al. Single-cell RNA sequencing reveals the critical role of SEC16B in lung metastasis of osteosarcoma. FASEB Bioadv. 2025;7(8):e70025. doi:10.1096/fba.2024-00161. [Google Scholar] [PubMed] [CrossRef]
28. Jia L, Wang T, Zhao Y, Zhang S, Ba T, Kuai X, et al. Single-cell profiling of infiltrating B cells and tertiary lymphoid structures in the TME of gastric adenocarcinomas. Oncoimmunology. 2021;10(1):1969767. doi:10.1080/2162402X.2021.1969767. [Google Scholar] [PubMed] [CrossRef]
29. Geldhof V, de Rooij LPMH, Sokol L, Amersfoort J, De Schepper M, Rohlenova K, et al. Single cell atlas identifies lipid-processing and immunomodulatory endothelial cells in healthy and malignant breast. Nat Commun. 2022;13(1):5511. doi:10.1038/s41467-022-33052-y. [Google Scholar] [PubMed] [CrossRef]
30. Hoffmann CJ, Kuffner MTC, Lips J, Lorenz S, Endres M, Harms C. Zfp580 regulates paracrine and endocrine Igf1 and Igfbp3 differently in the brain and blood after a murine stroke. Front Physiol. 2022;13:887180. doi:10.3389/fphys.2022.887180. [Google Scholar] [PubMed] [CrossRef]
31. Jin Z, Liang J, Kolattukudy PE. Tetramethylpyrazine preserves the integrity of blood-brain barrier associated with upregulation of MCPIP1 in a murine model of focal ischemic stroke. Front Pharmacol. 2021;12:710358. doi:10.3389/fphar.2021.710358. [Google Scholar] [PubMed] [CrossRef]
32. Li Z, Chen J, Zhao Y, Wang Y, Xu J, Ji J, et al. Common variants in ZMIZ1 and near NGF confer risk for primary dysmenorrhoea. Nat Commun. 2017;8(1):14900. doi:10.1038/ncomms14900. [Google Scholar] [PubMed] [CrossRef]
33. Fewings NL, Gatt PN, McKay FC, Parnell GP, Schibeci SD, Edwards J, et al. The autoimmune risk gene ZMIZ1 is a vitamin D responsive marker of a molecular phenotype of multiple sclerosis. J Autoimmun. 2017;78:57–69. doi:10.1016/j.jaut.2016.12.006. [Google Scholar] [PubMed] [CrossRef]
34. Hillier J, Zhao Y, Carrique L, Malinauskas T, Ruza RR, Chang TH, et al. Structural insights into Frizzled3 through nanobody modulators. Nat Commun. 2024;15(1):7228. doi:10.1038/s41467-024-51451-1. [Google Scholar] [PubMed] [CrossRef]
35. Duncan JS, Fritzsch B, Houston DW, Ketchum EM, Kersigo J, Deans MR, et al. Topologically correct central projections of tetrapod inner ear afferents require Fzd3. Sci Rep. 2019;9(1):10298. doi:10.1038/s41598-019-46553-6. [Google Scholar] [PubMed] [CrossRef]
36. Blue EE, Thornton TA, Kooperberg C, Liu S, Wactawski-Wende J, Manson J, et al. Non-coding variants in MYH11, FZD3, and SORCS3 are associated with dementia in women. Alzheimers Dement. 2021;17(2):215–25. doi:10.1002/alz.12181. [Google Scholar] [PubMed] [CrossRef]
37. Yang P, Li S, Zhang H, Ding X, Tan Q. LRG1 accelerates wound healing in diabetic rats by promoting angiogenesis via the Wnt/β-Catenin signaling pathway. Int J Low Extrem Wounds. 2024;23(4):568–76. doi:10.1177/15347346221081610. [Google Scholar] [PubMed] [CrossRef]
Cite This Article
 Copyright © 2026 The Author(s). Published by Tech Science Press.
This work is licensed under a Creative Commons Attribution 4.0 International License , which permits unrestricted use, distribution, and reproduction in any medium, provided the original work is properly cited.
 Downloads
 Citation Tools