
 Submit a Paper
 Propose a Special lssue
 Open Access
ARTICLE
Immunoregulatory Subpopulations of iNKT Cells and Myeloid-Derived Suppressor Cells in Chronic Lymphocytic Leukemia: Implications for Disease Progression and Immune Evasion
1 Department of Clinical Immunology, Medical University of Lublin, Chodzki 4a, Lublin, 20-093, Poland
2 Department of Haematooncology and Bone Marrow Transplantation, Medical University of Lublin, Staszica 16, Lublin, 20-080, Poland
* Corresponding Author: Agnieszka Bojarska-Junak. Email:
(This article belongs to the Special Issue: The Role of γδ T Cells and iNKT Cells in Cancer: Unraveling Molecular Mechanisms and Therapeutic Potential)
BIOCELL 2026, 50(2), 12 https://doi.org/10.32604/biocell.2025.074128
Received 03 October 2025; Accepted 17 December 2025; Issue published 14 February 2026
 View Full Text
 Download PDF
Abstract
Objectives: Chronic lymphocytic leukemia (CLL) is characterized by progressive immune dysregulation. Invariant natural killer T (iNKT) cells support immune surveillance, but the clinical relevance of their regulatory subsets remains unclear. FoxP3+ regulatory iNKT cells (iNKTreg) and E4BP4+IL-10+ (iNKT10) cells may reflect immunoregulatory changes associated with disease progression. The study aimed to quantify circulating iNKTreg and iNKT10 subsets and monocytic myeloid-derived suppressor cells (M-MDSCs) in treatment-naïve CLL patients and evaluate their associations with disease characteristics and time to first treatment (TTFT). Methods: Peripheral blood samples from 60 untreated CLL patients and 20 healthy donors were analyzed by flow cytometry to determine iNKTreg and iNKT10 percentages, as well as indoleamine 2,3-dioxygenase (IDO)-expressing M-MDSCs. Receiver operating characteristic (ROC) curves and Cox proportional hazards models were used to assess prognostic significance. Results: iNKTreg and iNKT10 percentages were significantly increased in CLL compared with healthy donors (p = 0.002). Elevated iNKTreg frequencies were associated with zeta-chain-associated protein of 70 kD (ZAP-70) positivity (p = 0.017), CD38 positivity (p = 0.048), and treatment requirement during follow-up (p = 0.016). Based on an ROC-derived cut-off of 9.6% (AUC = 0.753), patients with iNKTreg ≥ 9.6% had shorter TTFT (hazard ratio [HR] = 2.71; 95% confidence interval [CI], 1.13–6.49; p = 0.025), although the association was not retained in multivariate analysis (HR = 1.27; 95% CI, 0.44–3.64; p = 0.626). iNKTreg and iNKT10 percentages correlated positively with IDO+ M-MDSCs (p = 0.035 and p = 0.044), but not with arginase-1 (ARG1) or inducible nitric oxide synthase (NOS2). Conclusion: Elevated iNKTreg levels reflect a more aggressive disease phenotype and associate with shorter TTFT in univariate analysis, supporting their exploration as complementary immunological biomarkers in CLL. Functional studies and validation in larger cohorts are needed to determine their prognostic and biological significance.Keywords
Chronic lymphocytic leukemia (CLL) is the most common adult leukemia, characterized by the gradual accumulation of malignant B lymphocytes evading immune surveillance and inducing progressive immunosuppression [1–3]. Understanding the complex interactions between leukemic cells and the immune system is therefore critical for elucidating mechanisms of disease development and progression.
Invariant natural killer T (iNKT) cells represent a unique subset of T lymphocytes that recognize lipid antigens presented by CD1d molecules, playing vital roles in immune regulation and tumor surveillance. Their ability to rapidly produce cytokines such as IFN-γ and IL-4 enables them to bridge innate and adaptive immunity, modulating immune responses in cancer and other pathological conditions [4–6]. In CLL, the role of iNKT cells is not fully defined, but existing data suggest their involvement in immune surveillance. Although they possess potent anti-tumor functions, their numerical and functional impairments in CLL correlate with disease progression and immune evasion. Early-stage or less aggressive CLL patients tend to have relatively intact iNKT populations [7], whereas advanced disease is associated with a decline in iNKT cell frequency and effector capacity [1,2], coinciding with reduced expression of CD1d on leukemic B cells [7–9].
The functional heterogeneity of iNKT cells has led to the identification of regulatory subpopulations such as FoxP3+ iNKT cells (iNKTreg) and IL-10-producing iNKT10 cells [10–12]. These subsets have been shown to exert immunosuppressive activity and contribute to immune tolerance in several tumor settings [4,13]. However, their presence, distribution, and potential clinical significance in CLL remain insufficiently defined. In particular, it is unclear whether regulatory iNKT expansion parallels disease progression or correlates with established prognostic markers. Investigating these subsets may provide insights into their role as complementary immunological biomarkers.
iNKT cells interact closely with other suppressor cell populations in the tumor microenvironment, including regulatory T cells (Tregs), tumor-associated macrophages (TAMs), and myeloid-derived suppressor cells (MDSCs) [14]. In CLL, the crosstalk between immunoregulatory iNKT cells and MDSCs may further contribute to immune escape [1]. MDSCs are a heterogeneous group of immature myeloid cells with potent immunosuppressive properties. Expansion of monocytic CD14+HLA-DRlow/− MDSCs (M-MDSCs) in the peripheral blood (PB) of CLL patients correlates with tumor progression and poor prognosis [15–17]. CLL cells can induce upregulation of indoleamine 2,3-dioxygenase (IDO) in MDSCs, which suppresses T cell activation and promotes the development of regulatory T cells [1].
While several studies have demonstrated a numerical decline and functional impairment of total iNKT cells in CLL [1,2,7,9], the heterogeneity and clinical significance of their regulatory subpopulations remain largely unexplored. In particular, little is known about the prevalence of FoxP3+ iNKTreg and IL-10-producing iNKT10 cells in CLL and whether their distribution correlates with disease aggressiveness. Therefore, in this study, we quantified circulating iNKTreg and iNKT10 subsets, along with M-MDSCs, in treatment-naïve CLL patients and evaluated their associations with established prognostic factors and time to first treatment (TTFT), to determine their potential value as complementary biomarkers.
A total of 60 patients diagnosed with chronic lymphocytic leukemia (CLL) were enrolled in the study. The diagnosis was established according to the International Workshop on Chronic Lymphocytic Leukemia (IWCLL) criteria [18]. Inclusion criteria: confirmed CLL diagnosis, age ≥ 18 years, treatment-naïve at the time of sampling, and written informed consent. Exclusion criteria: history of other malignancies, bone marrow disorders, autoimmune diseases, active infections, severe cardiovascular or pulmonary disease, or insufficient sample quality for flow cytometry analysis. Peripheral blood (PB) samples were collected from treatment-naïve patients at the Department of Hematooncology and Bone Marrow Transplantation, Medical University of Lublin, Poland.
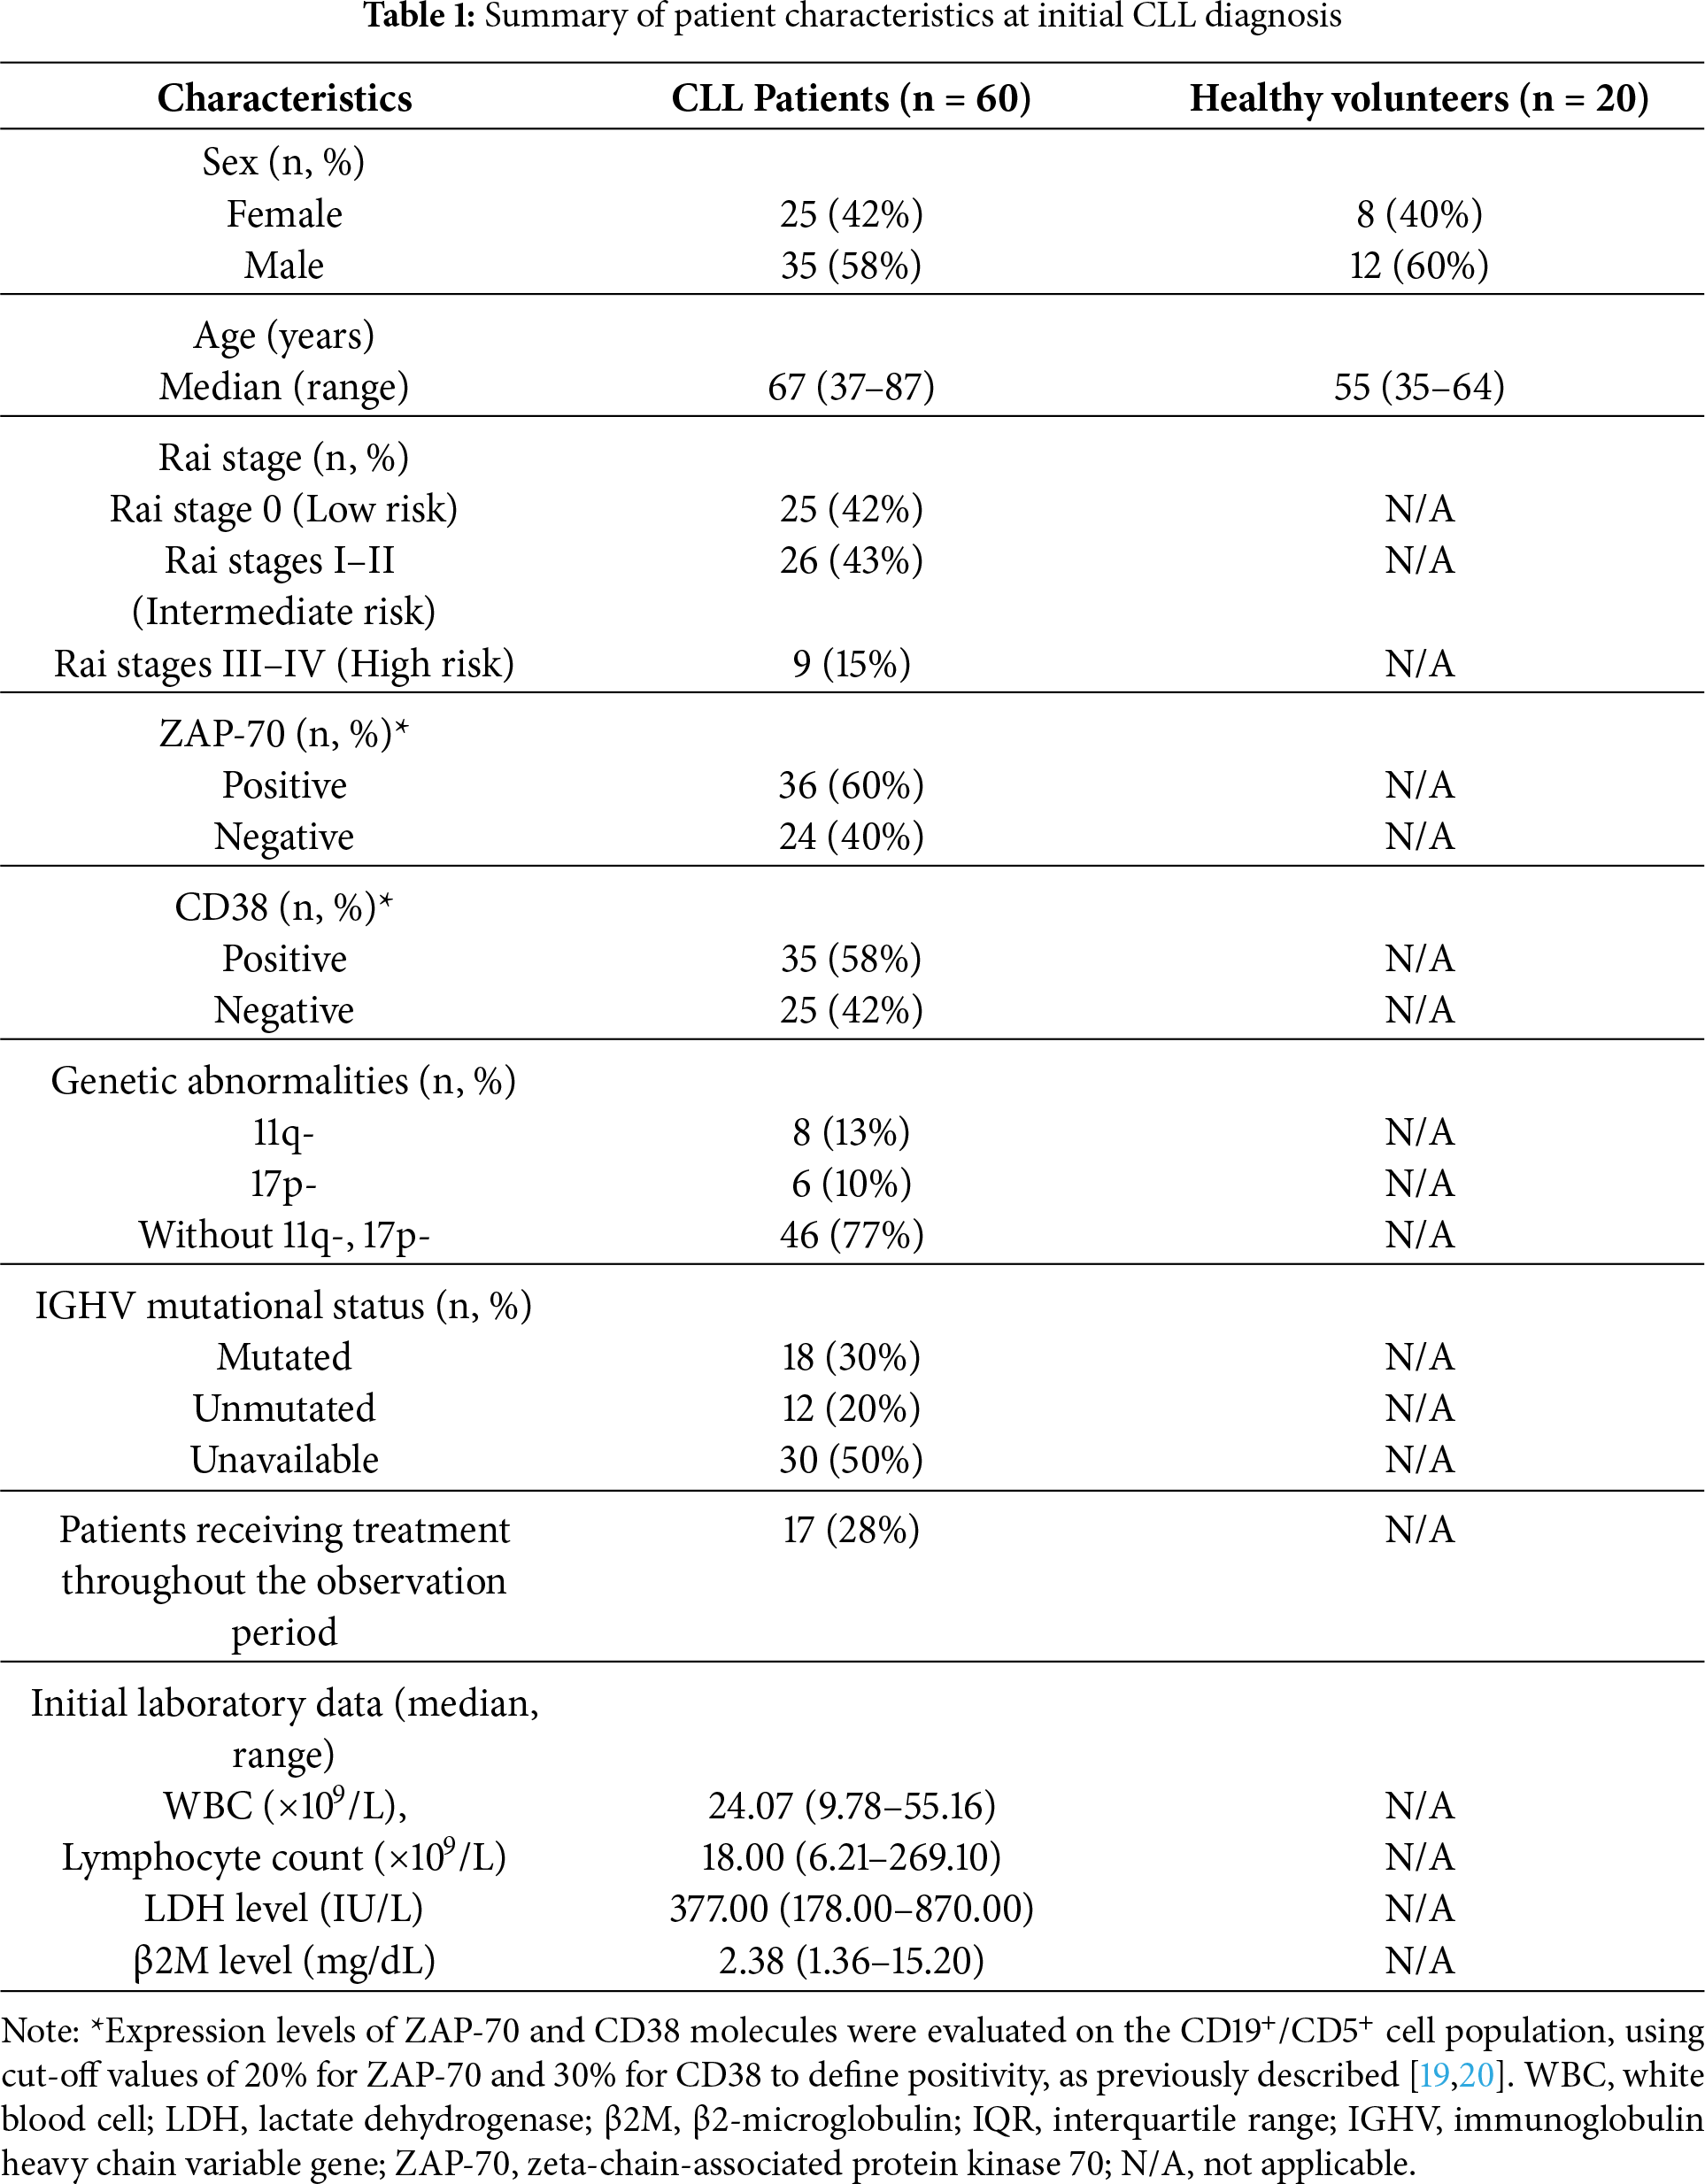
The median follow-up period was 48 months (range: 1–72 months). As blood samples and immunophenotyping were performed at baseline only, variation in follow-up duration did not influence the analyzed immune parameters, and no patient included in the flow cytometry dataset was lost to follow-up at the time of sampling. Clinical staging was performed using the Rai classification system. Clinical and biological parameters analyzed included white blood cell (WBC) count, lymphocyte count, lactate dehydrogenase (LDH), β2-microglobulin (β2M) levels, CD38 and ZAP-70 expression, and cytogenetic abnormalities (details in Table 1). Baseline patient characteristics are summarized in Table 1. Control PB samples were obtained from 20 healthy volunteers (HVs) aged 35–64 years (median 55 years), including 8 females and 12 males. HVs had no history of cancer, autoimmune, pulmonary, or cardiovascular diseases. The study was conducted in accordance with The Code of Ethics of the World Medical Association (Declaration of Helsinki). The study protocol was approved by the Ethics Committee of the Medical University of Lublin No. KE-0254/49/2016 (date of approval: 24 March 2016) and KE-0254/186/10/2022 (date of approval: 6 October 2022), and written informed consent was obtained from all participants. Patient recruitment occurred from January 2017 to January 2025.
2.2 The Identification of iNKT10 and iNKT FoxP3+ Cells in Whole Blood by Flow Cytometry
In the present study, the analysis of iNKTreg and iNKT10 cells was performed directly on PB samples without culture or in vitro stimulation, thereby closely reflecting the real in vivo conditions. Whole blood (100 μL) was allotted into polystyrene tubes and stained with 5 µL of V450 anti-CD3 (Clone UCHT1; Cat. No. 560365; BD Biosciences, Franklin Lakes, NJ, USA) and 5 µL of FITC anti-TCR Vα24-Jα18 (iNKT cell) (Clone 6B11; Cat. No. 558371; BD Biosciences), together with 1 µL of viability dye (LIVE/DEAD Fixable Aqua Dead Cell Stain Kit, Cat. No. L34957; Thermo Fisher Scientific, Waltham, MA, USA) to exclude dead cells from the analysis. Samples were incubated for 30 min at room temperature in the dark during surface staining. Afterward, red blood cells (RBC) were lysed and leukocytes fixed using 2 mL of Lyse/Fix buffer (Cat. No. 558049; BD Biosciences) at 37°C for 10 min. Following RBC lysis and fixation, samples were centrifuged at 250× g for 10 min at 20°C–22°C.
Cells were washed with Stain Buffer (Cat. No. 55465; BD Biosciences), followed by permeabilization with 1 mL of Perm Buffer III (Cat. No. 558050; BD Biosciences) for 30 min on ice to enable intracellular staining. Following two washes with Stain Buffer (250× g for 10 min at 20°C–22°C), cells were stained intracellularly with 5 µL of PE anti-FoxP3 (Clone 236A; Cat. No. 560852; BD Biosciences) for regulatory iNKT cells (iNKTreg), or 5 µL of PE anti-E4BP4 (NFIL3) (Clone MABA223; Cat. No. 12-9812-42; eBioscience) and 5 µL of PerCP/Cyanine5.5 anti-IL-10 (Clone JES3-9D7; Cat. No. 501418; BioLegend, San Diego, CA, USA) for iNKT10 detection.
Flow cytometry data were acquired using a BD FACSCanto II cytometer with FACSDiva 8.0.1 software (BD Biosciences, Franklin Lakes, NJ, USA). On average, 411,282 ± 234,436 total lymphocyte events (mean ± SD; median 325,182; IQR 210,109–632,564) were acquired per sample within the FSC/SSC gate, with a minimum threshold of 200,000 events applied to ensure reliable rare-cell subset analysis. Data analysis was performed using Kaluza software version 2.1.1 (Beckman Coulter, Brea, CA, USA).
Importantly, this methodological approach was intentionally designed to capture the physiological regulatory state of circulating iNKT cells rather than an artificially induced response. Immediately after staining and before any manipulation that could alter cytokine secretion, cells were fixed to preserve intracellular IL-10 synthesized in vivo at the moment of blood collection. Although no external stimulation was performed, this strategy is consistent with current evidence showing that IL-10—producing iNKT cells (iNKT10) naturally occur in humans and mice and can be reliably detected ex vivo without antigenic or polyclonal activation. Such IL-10+ iNKT subsets have been documented in human peripheral blood and intestinal lamina propria, as well as in murine adipose tissue under steady-state or inflammatory conditions, where they contribute to immune regulation [21–24]. Therefore, detection of IL-10 directly in whole blood provides the most biologically relevant representation of iNKT10 cell prevalence in vivo.
Absolute counts of iNKT, iNKT10, and iNKTreg cells were expressed as the number of cells per microliter of PB (cells/μL) and were calculated from their relative frequencies within the lymphocyte gate in the flow cytometric analysis and the absolute lymphocyte count (×109/L) obtained from the complete blood count performed on the same day. On average, the absolute lymphocyte count was 31.82 ± 39.63 × 10⁹/L (median 18.00 × 10⁹/L, IQR 11.00–29.48 × 10⁹/L). iNKT cells constituted 0.06 ± 0.07% of lymphocytes (median 0.03%, IQR 0.02–0.07) and 0.32 ± 0.27% of CD3+ T lymphocytes. The absolute iNKT cell count was 16.05 ± 38.58 cells/µL (median 5.63 cells/µL, IQR 2.11–12.85). Absolute iNKT10 and iNKTreg numbers were then derived by multiplying the absolute iNKT count by the percentage of IL-10+ or FoxP3+ iNKT cells, respectively.
The gating strategy to identify iNKT10 and iNKT FoxP3+ cells is illustrated in Fig. 1.
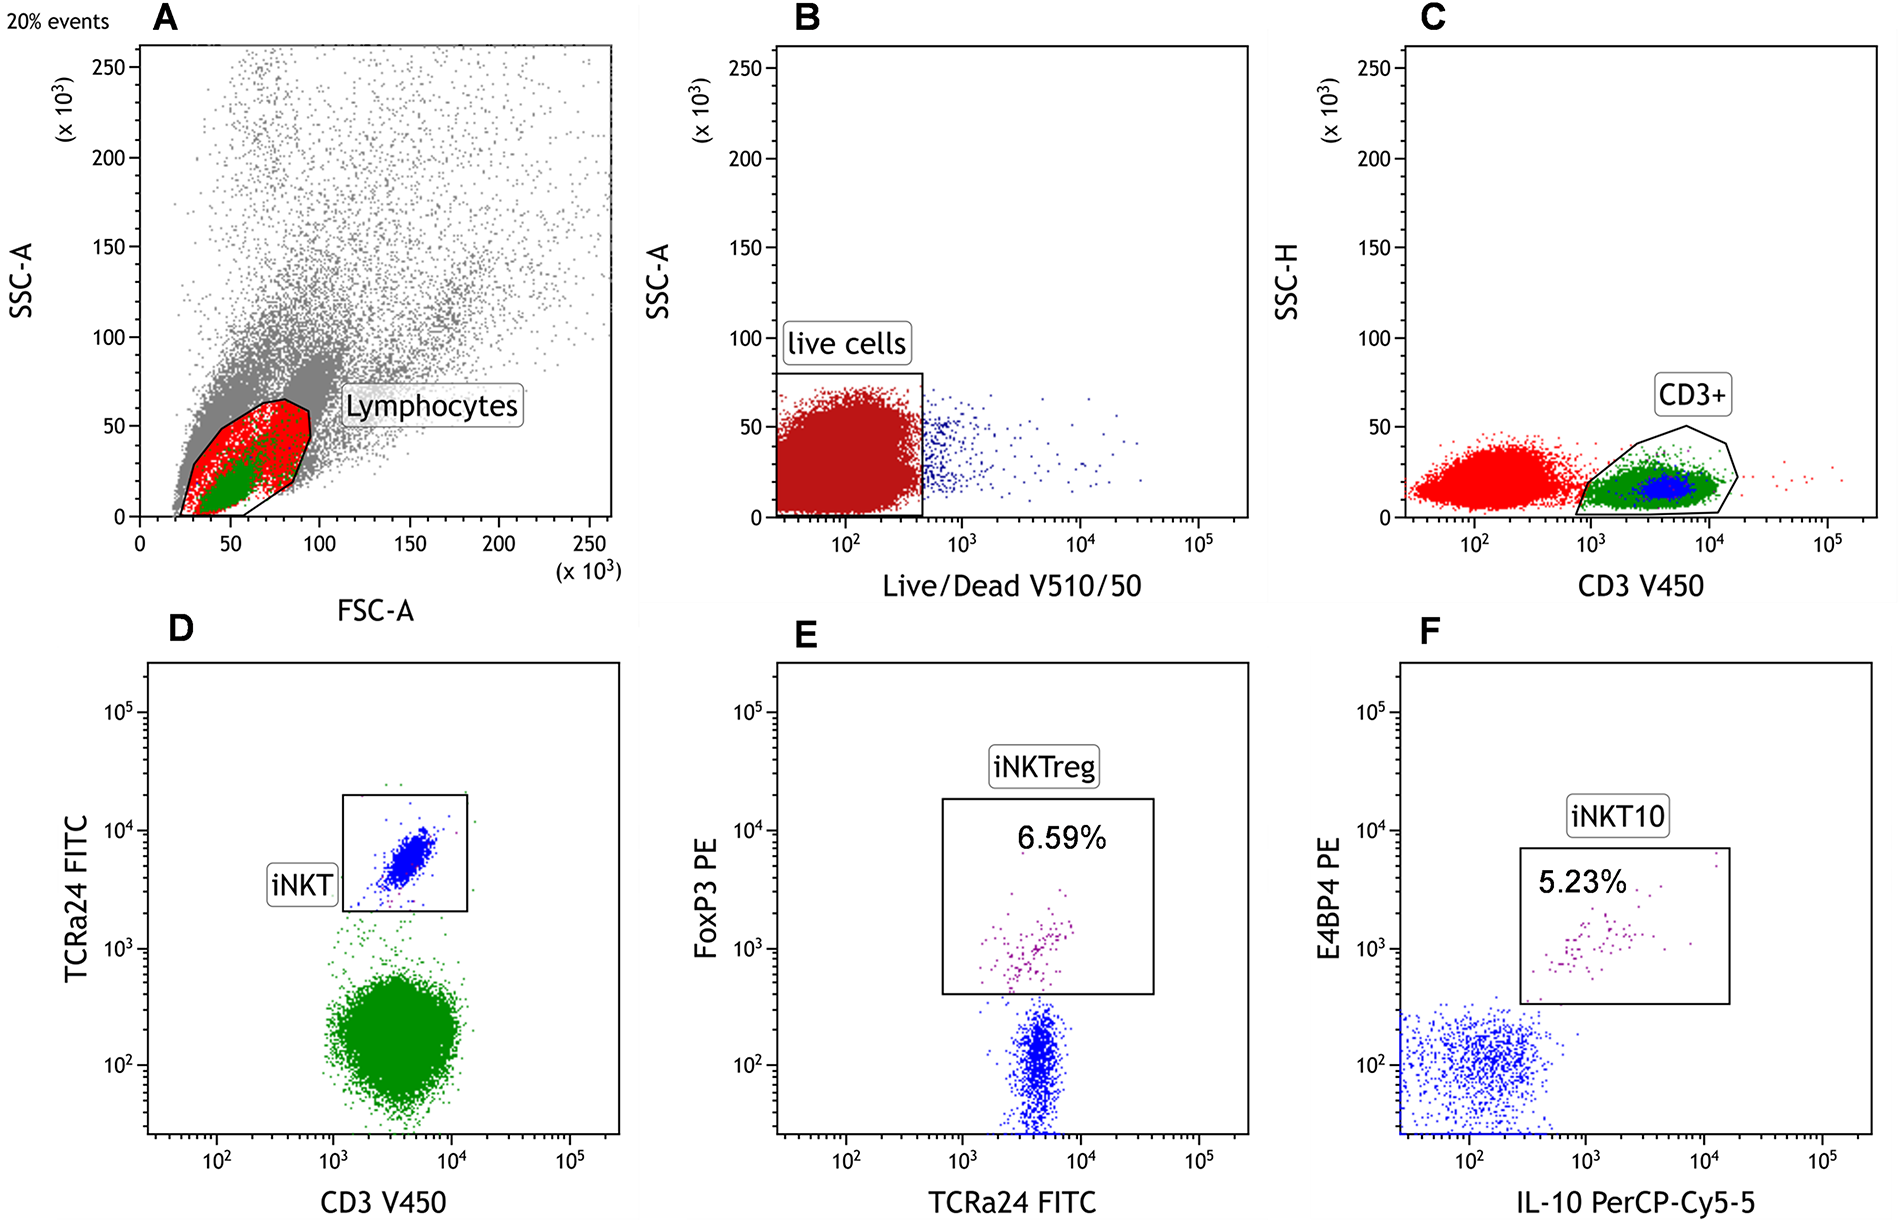
Figure 1: Representative gating strategy for the identification of invariant natural killer T (iNKT)10 and iNKT FoxP3+ (iNKTreg) cells by flow cytometry. (A) The cytometric analysis began with the establishment of a gate for lymphocytes on the linear FSC/SSC. A minimum of 2 × 10⁵ cells within the lymphocytes gate were collected. The FSC (Forward Scatter) and SSC (Side Scatter) parameters allowed the determination of basic morphological properties of the cells, namely their size and granularity. Erythrocytes, granulocytes, dead cells, and their fragments were excluded from the analysis. (B) Only viable cells (dot plot: Live/Dead V510 vs. SSC) were used for the identification of iNKT cells. (C) Within the viable lymphocyte gate, CD3+ T cells were selected. (D) The iNKT cell population was defined as CD3+TCR Vα24-Jα18+ within the CD3+ lymphocytes. (E) Subsequent intracellular staining identified iNKT FoxP3+ regulatory cells by FoxP3 expression, and (F) iNKT10 cells by co-expression of E4BP4 and IL-10. Whenever percentages of iNKTreg or iNKT10 are mentioned, they refer to the proportion within peripheral blood (PB) iNKT cells (CD3+TCR Vα24-Jα18+)
2.3 Flow Cytometric Detection of Monocytic Myeloid-Derived Suppressor Cells (M-MDSCs) and Intracellular Analysis of IDO, ARG1, IL-10, and NOS2 Expression
Identification of M-MDSCs by flow cytometry was performed based on established criteria described previously [17,25], defining this subset as CD14+CD15−HLA-DRlow/− cells. Peripheral blood mononuclear cells (PBMCs) were isolated by density gradient centrifugation using Lymphocyte Separation Medium 1077 (Cat. No. C-44010; PromoCell, Heidelberg, Germany) at 700× g for 20 min at room temperature. PBMCs were then stained for surface phenotype identification. Cells were incubated for 20 min at room temperature in the dark with 20 µL of FITC anti-CD14 (Clone M5E2; Cat. No. 555397; BD Biosciences, Franklin Lakes, NJ, USA), 5 µL of PE-Cy7 anti-HLA-DR (Clone L243; Cat. No. 335795; BD Biosciences), and 5 µL of APC anti-CD15 (Clone HI98; Cat. No. 551376; BD Biosciences).
For intracellular detection of suppressive molecules (IDO; Indoleamine 2,3-dioxygenase (IDO), ARG1; Arginase 1, and NOS2; inducible nitric oxide synthase), the same PBMC suspension underwent fixation and permeabilization using Cytofix/Cytoperm and Perm/Wash buffer (Cat. No. 554714; BD Biosciences) according to the manufacturer’s protocol. Cells were then stained for 20 min at room temperature (in the dark) with 10 µL of PE anti-IDO (Clone 700838; Cat. No. IC6030P; R&D Systems, Minneapolis, MN, USA), 10 µL of PE anti-ARG1 (Clone 658922; Cat. No. IC8026P; R&D Systems), 1 µL PE-conjugated anti-NOS2 (Clone C-11; Cat. No. sc-7271 PE; Santa Cruz Biotechnology, Dallas, TX, USA), and 5 µL PE anti-IL-10 (Clone JES3-19F1, Cat. No. 506804; BioLegend).
For each sample, at least 100,000 events were acquired on a BD FACSCanto II instrument using FACSDiva software (BD Biosciences, Franklin Lakes, NJ, USA). Data analysis was performed with Kaluza software version 2.1.1 (Beckman Coulter, Brea, CA, USA). The percentage of M-MDSCs was determined. Moreover, the percentage of M-MDSCs expressing IDO, ARG1, and NOS2 was evaluated. Additionally, immune regulatory molecules within the M-MDSC population were quantified based on their median fluorescence intensity (MFI). The data were normalized to fluorescence minus one (FMO) controls. This protocol has been previously published and validated as referenced [17].
Collected data were analyzed using Statistica 13.3 software (TIBCO Software Inc., Palo Alto, CA, USA) and GraphPad Prism 9 (GraphPad Software, San Diego, CA, USA). Data distribution was evaluated using the Shapiro-Wilk test. Due to non-normal distribution, comparisons between two independent groups were performed using the Mann-Whitney U test, while comparisons among multiple groups were assessed using the Kruskal-Wallis test followed by Dunn’s post hoc test. Results are presented as medians and interquartile ranges (IQR). Associations between variables were examined using Spearman’s rank correlation coefficient. Time to first treatment (TTFT) was defined as the time from diagnosis to initiation of first therapy or death/last follow-up without treatment. Survival analyses were performed using the Kaplan–Meier method with the log-rank test. Prognostic significance of variables was initially evaluated by univariate Cox proportional hazards regression. Optimal cut-off values were determined using receiver operating characteristic (ROC) curve analysis with the Youden Index, providing sensitivity, specificity, and area under the curve (AUC) metrics. Statistical significance was defined as p < 0.05 for all tests.
3.1 Association of iNKTreg and iNKT10 Cell Percentages with Disease Stage and Prognostic Markers in CLL
Initially, we analyzed the percentage of regulatory iNKT cells (iNKTreg), defined as iNKT cells expressing the transcription factor FoxP3, and iNKT10 cells, characterized by the expression of E4BP4 (NFIL3) and IL-10, in the PB of CLL patients and healthy volunteers. A significantly higher percentage of both iNKTreg and iNKT10 cells was observed in patients with CLL compared to healthy controls (p = 0.002) (Fig. 2A,B).
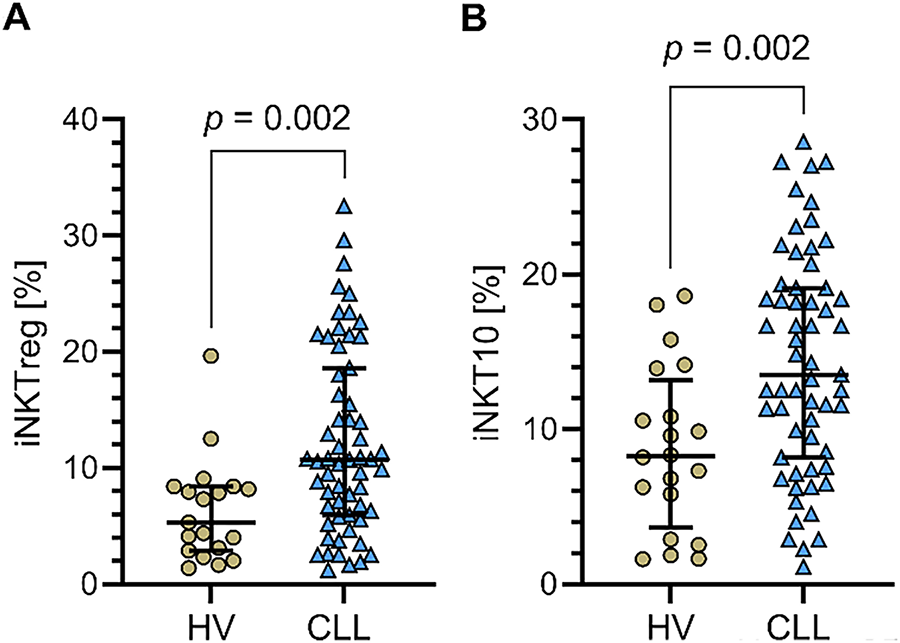
Figure 2: Percentages of regulatory iNKT (iNKTreg) and iNKT10 cell subpopulations in PB of CLL patients and healthy volunteers (HVs). (A) Percentage of iNKTreg cells (FoxP3-expressing) in CLL patients vs. healthy controls. (B) Percentage of iNKT10 cells (E4BP4+IL-10+) in the same groups. Both subpopulations were significantly higher in CLL patients compared to HVs. Data are presented as scatter plots with median and interquartile range. Statistical significance was assessed using the Mann-Whitney U test. CLL patients: n = 60; HVs: n = 20
Additionally, the percentages of both iNKTreg and iNKT10 subpopulations were significantly higher (p = 0.017 and p = 0.016) in patients with advanced CLL (clinical stages III–IV) compared to those with stage 0 (Fig. 3A,B).
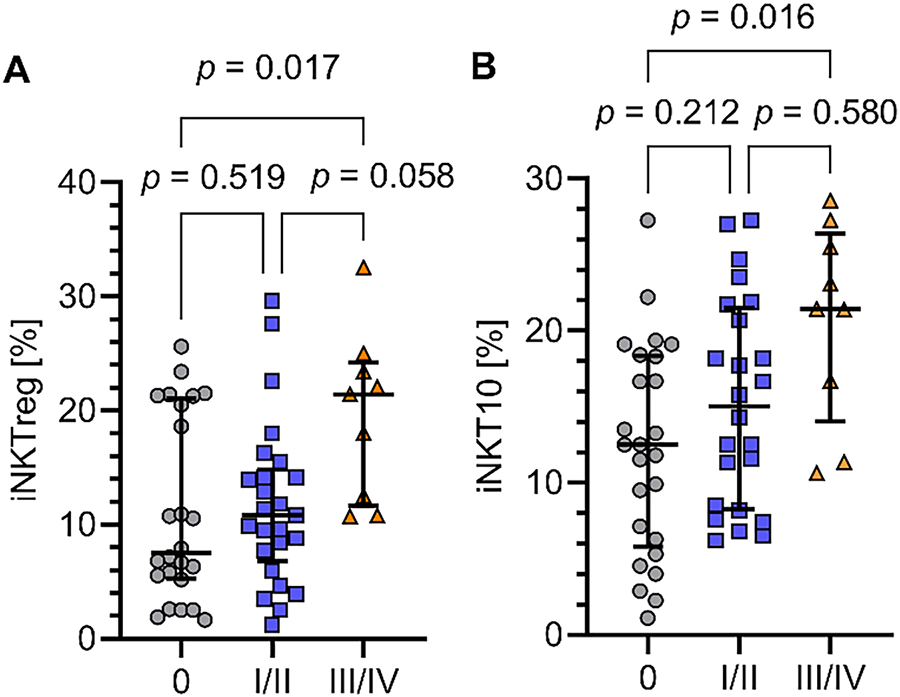
Figure 3: Percentages of iNKTreg and iNKT10 cells in CLL patients at different clinical stages. (A) Percentage of regulatory iNKT cells (iNKTreg; FoxP3-expressing) in patients with CLL at advanced clinical stages (III–IV) compared to early-stage disease (stage 0). (B) Percentage of iNKT10 cells (E4BP4+IL-10+) in the same patient groups. Both iNKTreg and iNKT10 cells were significantly higher in advanced-stage CLL patients. Clinical stages were defined according to the Rai staging system. Data are presented as scatter plots with median and interquartile range. Statistical significance was assessed by the Kruskal-Wallis test with Dunn’s post hoc correction. Rai clinical staging: stage 0 (n = 25), stages I–II (n = 26), stages III–IV (n = 9)
Moreover, the percentages of iNKTreg cells were significantly elevated in patients positive for the prognostic markers ZAP-70 and CD38 compared to patients negative for these markers (Fig. 4A,B; p = 0.017 and p = 0.048, respectively). In contrast, the percentage of iNKT10 cells was also significantly higher in ZAP-70-positive patients (Fig. 4C), whereas for CD38 positivity, iNKT10 cells showed a non-significant trend towards an increase (Fig. 4D). Furthermore, the percentage of iNKT10 cells was significantly higher in patients harboring cytogenetic aberrations 11q- or 17p- compared to those without these abnormalities (p = 0.034; Fig. 4E). Although the median percentage of iNKTreg cells was also elevated in patients with 11q- or 17p- deletions, this increase did not reach statistical significance, indicating a trend rather than a definitive association (Fig. 4F). Finally, when assessing the percentages of both iNKTreg and iNKT10 subpopulations in relation to immunoglobulin heavy chain variable (IGHV) mutation status, similar tendencies were observed. Specifically, the median percentages of iNKTreg and iNKT10 cells were higher in patients with unmutated IGHV compared to those with mutated IGHV. Although these differences did not reach statistical significance (Fig. 4G,H).
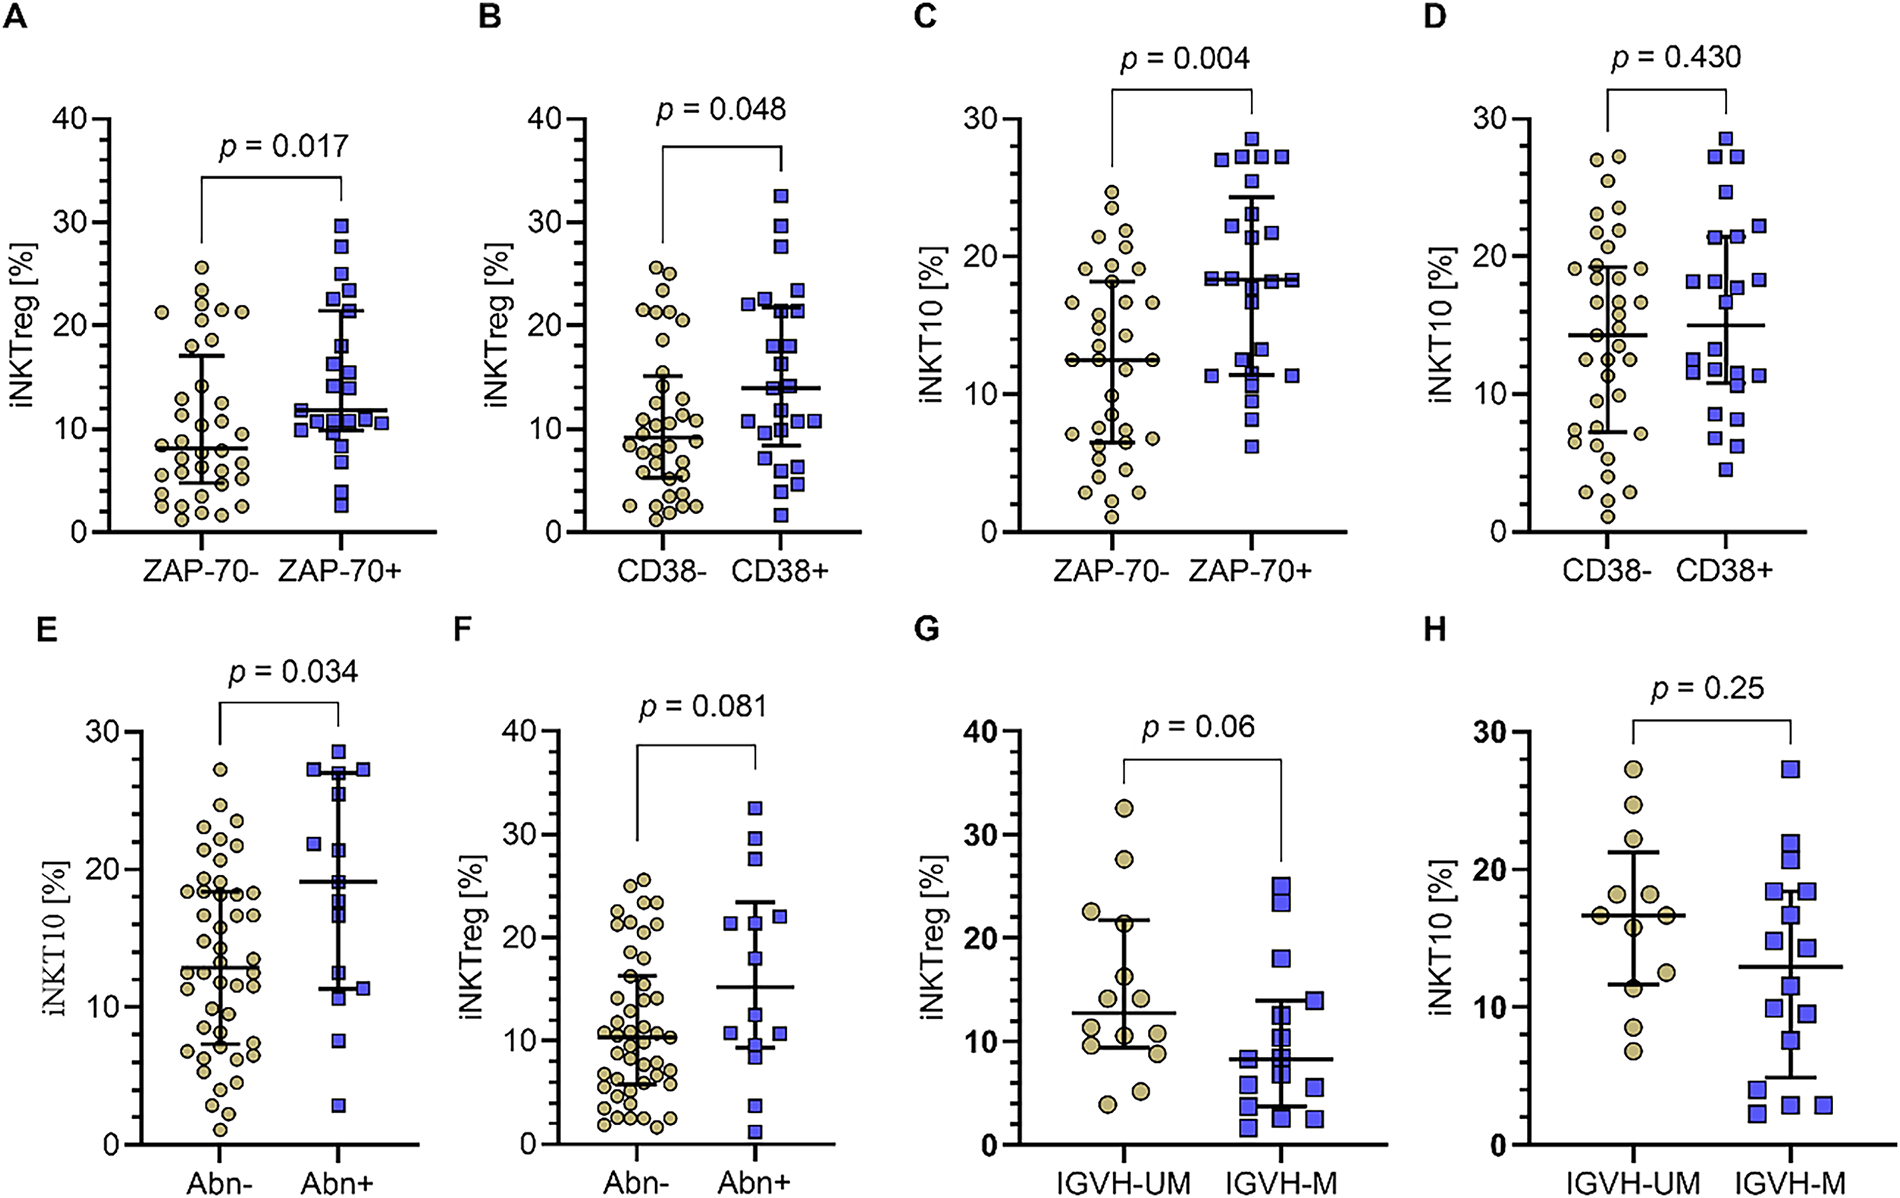
Figure 4: Percentages of iNKTreg and iNKT10 cell subpopulations in relation to prognostic markers and cytogenetic abnormalities in CLL patients. (A) The percentage of iNKTreg (FoxP3-expressing) was significantly increased in patients positive for the prognostic markers ZAP-70 and (B) CD38 compared to negative patients. (C) iNKT10 cells (E4BP4+IL-10+) percentage was also significantly higher in ZAP-70-positive patients. (D) In contrast, for CD38 positivity, iNKT10 cells showed a non-significant trend towards an increase. (E) The percentage of iNKT10 cells was significantly higher in patients with cytogenetic aberrations del(11q) or del(17p) compared to those without these abnormalities. (F) While median iNKTreg cell percentages were elevated in patients with 11q- or 17p- deletions, that increase did not achieve statistical significance, indicating a trend rather than a definitive association. (G) Both iNKTreg and (H) iNKT10 cell percentages tended to be higher in patients with unmutated immunoglobulin heavy chain variable (IGHV) compared to mutated IGHV, although these differences were not statistically significant. Data are presented as scatter plots with median and interquartile range. Statistical significance was assessed using the Mann-Whitney U test. IGHV-UM, IGHV unmutated; IGHV-M, IGHV mutated; Abn+, presence of deletion in one or both tested loci del(17p) and/or del(11q); Abn-, no deletions detected in tested loci. ZAP-70+: n = 36; ZAP-70−: n = 24; CD38+: n = 35; CD38−: n = 25; Abn+: n = 14; Abn−: n = 46; IGHV-UM: n = 12; IGHV-M: n = 18
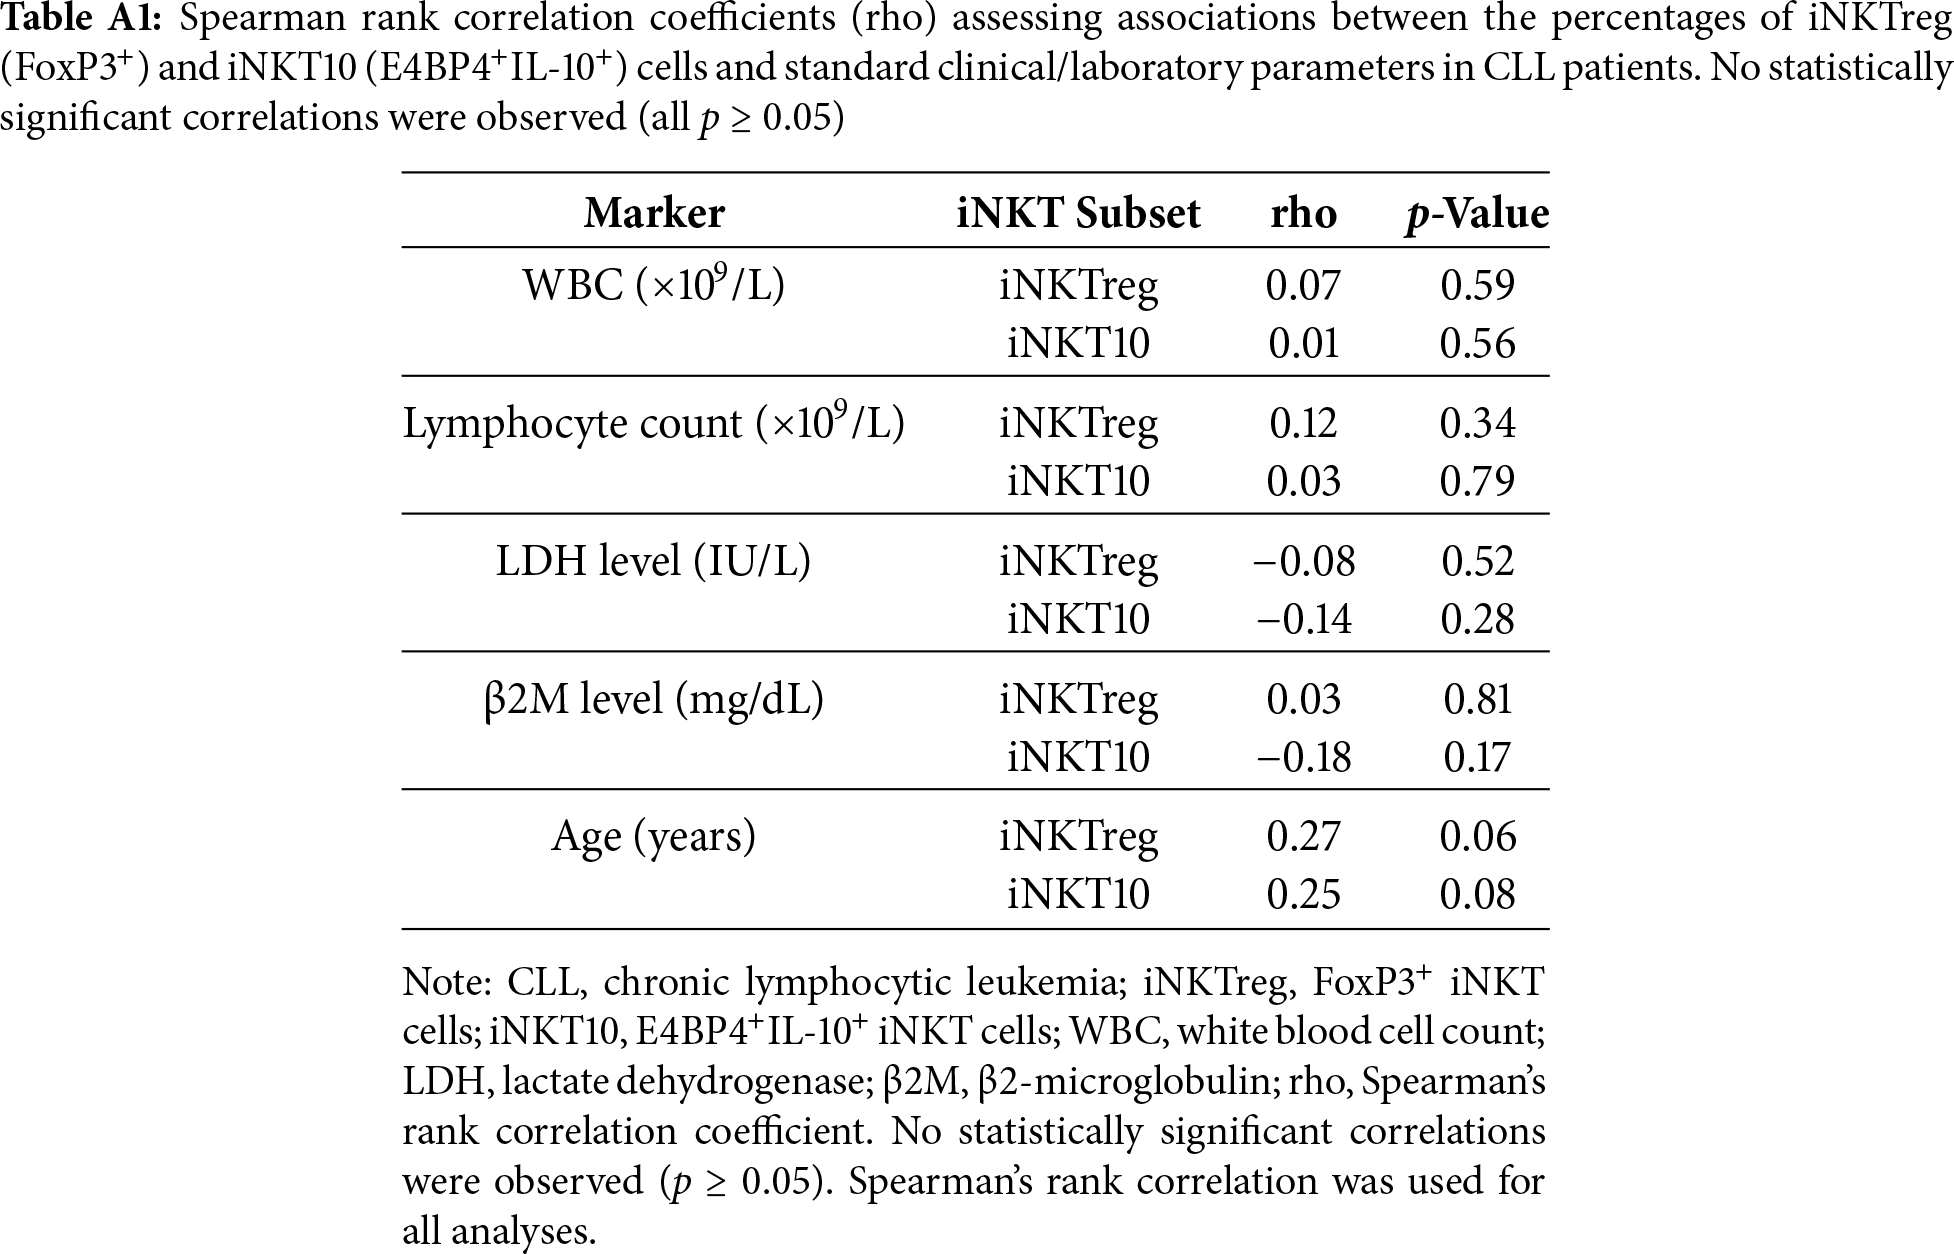
No statistically significant correlations were observed between the percentages of iNKTreg or iNKT10 cells and standard laboratory or clinical parameters, including white blood cell (WBC) count, absolute lymphocyte count, β2-microglobulin levels, and lactate dehydrogenase (LDH) activity. Detailed statistical results for these analyses are provided in Table A1 (Appendix A).
3.2 Prognostic Significance of iNKTreg and iNKT10 Cell Percentages in Relation to Treatment Requirement and Time to First Therapy in CLL Patients
To assess the prognostic value of iNKTreg and iNKT10 cells, CLL patients were followed for a median of 48 months. During the follow-up period, 28% of patients (n = 17) required treatment initiation. Patients who required therapy exhibited significantly higher percentages of iNKTreg cells compared to those who did not (median [IQR]: 15.88% [9.31–21.64] vs. 9.87% [5.18–14.16]; p = 0.016; Fig. 5A), corresponding to a Hodges-Lehmann median difference of 5.24 percentage points (95% CI, 1.12–9.36). A similar pattern was observed for iNKT10 cells, with higher median percentages in treated patients (19.12% [11.36–27.14] vs. 13.39% [7.21–18.39]; p = 0.027; Fig. 5B), with a Hodges–Lehmann median difference of 5.44 percentage points (95% CI, 0.61–9.67). These effect sizes suggest that elevated baseline levels of regulatory iNKT subsets may be clinically relevant indicators of earlier treatment requirement in CLL.
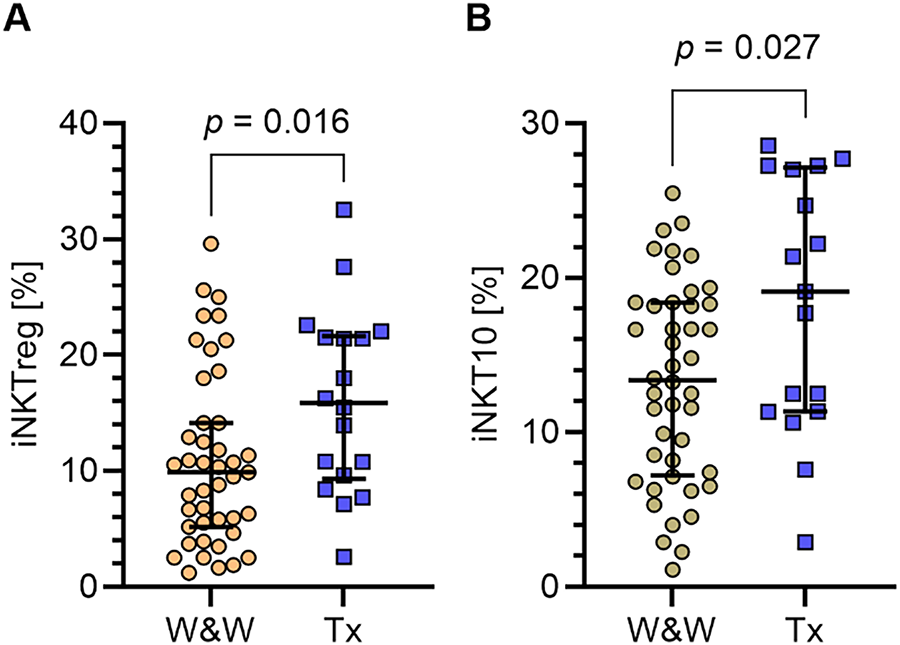
Figure 5: Percentages of iNKTreg and iNKT10 cell subpopulations in CLL patients according to treatment requirement. (A) Comparison of the percentages of regulatory iNKT cells (iNKTreg; FoxP3-expressing) in PB samples collected at diagnosis between patients who required therapy during follow-up and those who did not require treatment. (B) Comparison of iNKT10 cells (E4BP4+IL-10+) percentages in the same groups. Both iNKTreg and iNKT10 percentages were significantly higher in patients requiring treatment. Data are presented as scatter plots with median and interquartile range (IQR). Statistical significance was assessed using the Mann-Whitney U test. W&W, watch and wait (patients under observation without current treatment); Tx, patients receiving treatment. W&W: n= 43; Tx = 17
Receiver operating characteristic (ROC) analysis was used to determine the optimal cut-off values for the percentages of iNKTreg (Fig. 6A) and iNKT10 (Fig. 6B) cells that best distinguish ZAP-70-positive CLL cases. As this study was based on a single cohort without a separate validation set, these cut-offs should be considered exploratory. The areas under the curve (AUC) were 0.753 for iNKTreg and 0.756 for iNKT10, and the Youden index identified the most informative thresholds: ≥9.6% for iNKTreg (87% sensitivity, 61% specificity) and ≥11.36% for iNKT10 (92% sensitivity, 54% specificity).
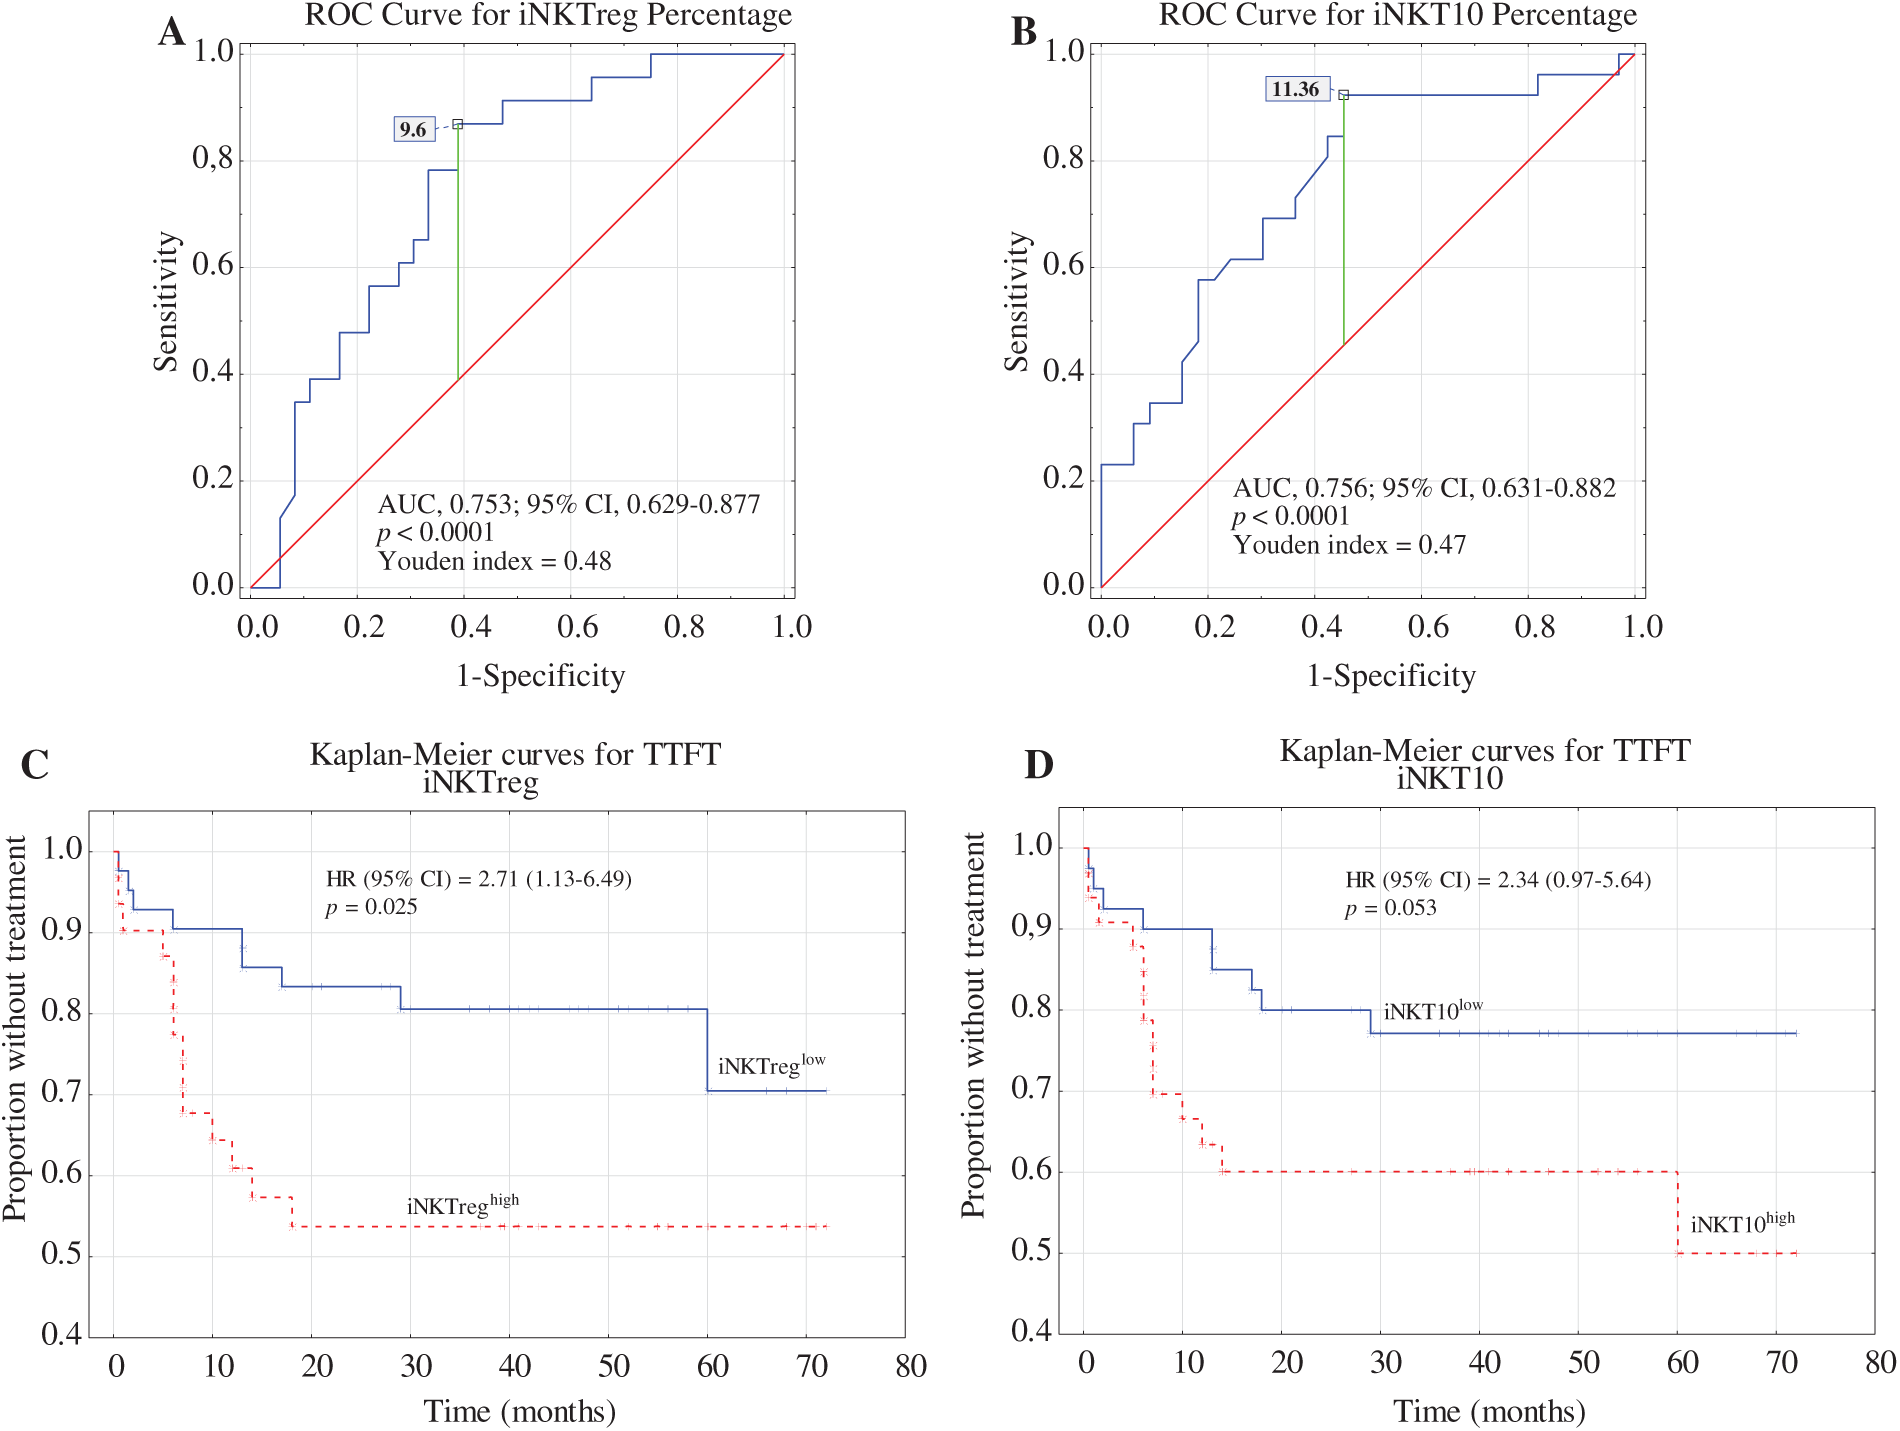
Figure 6: Receiver operating characteristic (ROC) analysis, area under the curve (AUC), and the Youden index method were used to calculate the most significant cut-off values for (A) the percentage of iNKTreg cells and (B) the percentage of iNKT10 cells that best distinguished ZAP-70-positive cases. Kaplan–Meier curves for time to first treatment (TTFT) were generated based on the optimal cut-offs for iNKTreg (C) and iNKT10 percentages (D). TTFT was defined as the time from the date of diagnosis to the initiation of the first treatment.
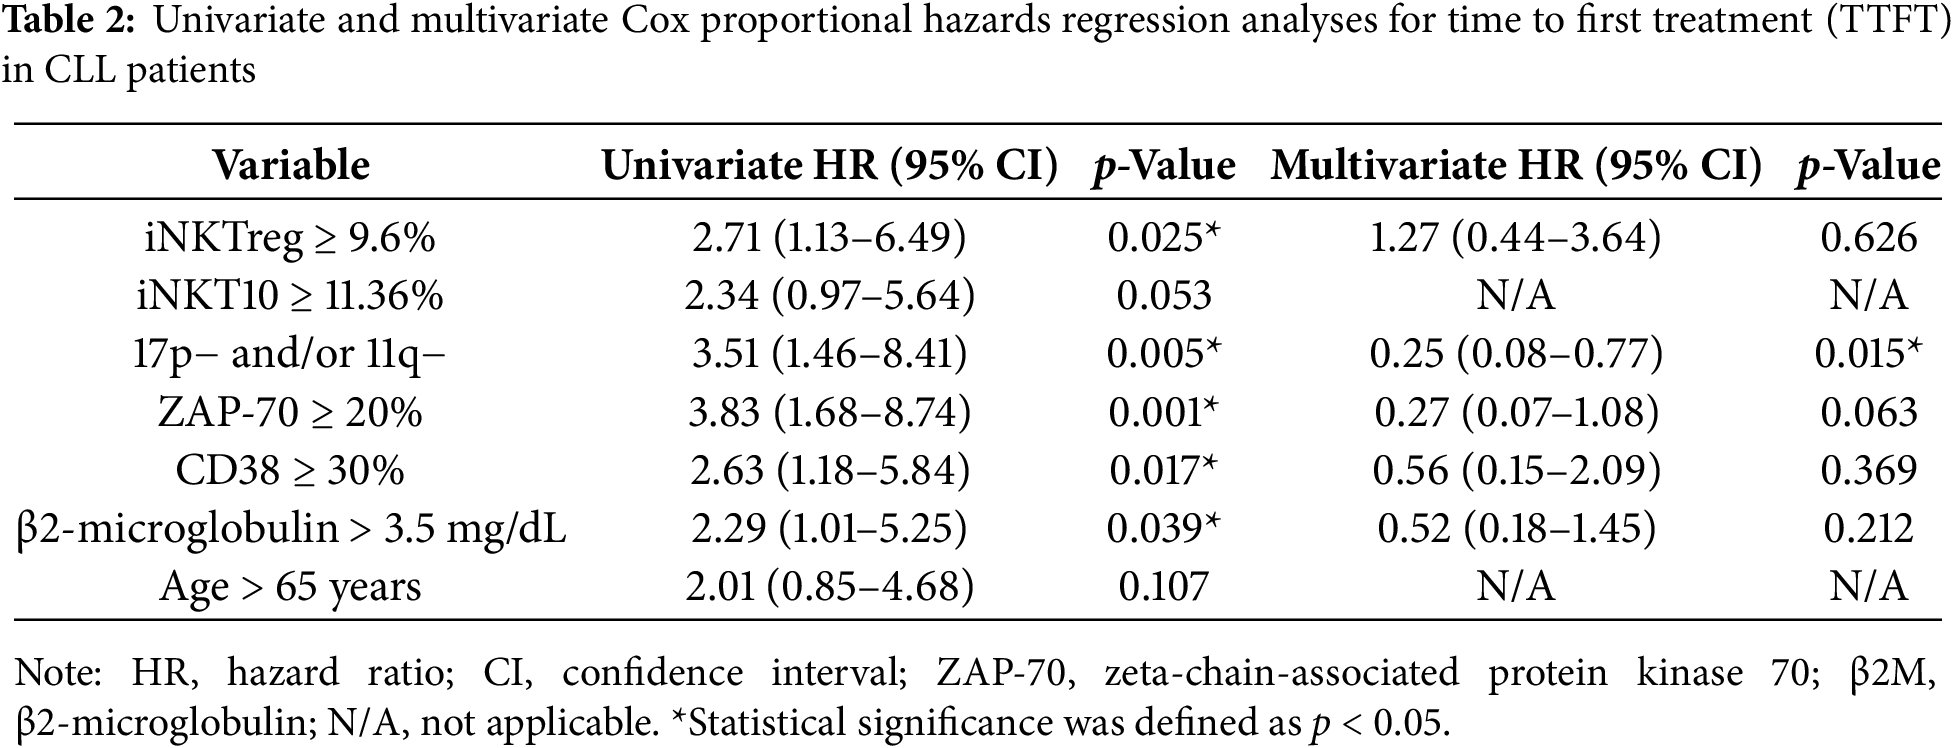
Kaplan–Meier analysis showed that patients with iNKTreg percentages ≥ 9.6% had significantly shorter TTFT (time to first treatment) compared to those below the cut-off (p = 0.025; Fig. 6C). In contrast, TTFT differences stratified by iNKT10 percentages did not reach statistical significance (p = 0.053; Fig. 6D). However, the prognostic impact of iNKTreg ≥ 9.6% did not remain significant in multivariate analysis after adjustment for established risk factors including ZAP-70, CD38, β2-microglobulin, age, and cytogenetics (HR = 1.27; 95% CI: 0.44–3.64; p = 0.626). In contrast, del(17p) and/or del(11q) positivity remained independently associated with shorter TTFT (HR = 0.25; 95% CI: 0.08–0.77; p = 0.015) (Table 2). These findings suggest that elevated iNKTreg percentages reflect more aggressive disease biology and correlate with high-risk features in CLL, but do not independently predict TTFT when key prognostic markers are taken into account.
3.3 Positive Correlation between IDO-Expressing M-MDSCs and Regulatory iNKT Subsets in CLL
IDO expression and other immune regulatory molecules related to MDSC functions (ARG1, NOS2, TGF-β1, and IL-10) were extensively analyzed in CLL-derived monocytic MDSCs (M-MDSC) in our earlier study [17]. The study demonstrated significant overexpression of IDO, IL-10, and TGF-β1 at both protein and mRNA levels in CLL patients compared to healthy donors, while ARG1 and NOS2 were present but did not differ significantly between CLL M-MDSC and monocytes, as detailed in the tables and figures of the cited publication. These findings serve as a foundation for the current analysis focusing on iNKT10 and iNKTreg subpopulations.
In the present study, quantitative analyses were performed to assess correlations between the percentages of immunoregulatory iNKT subsets, namely iNKTreg and iNKT10, and the proportion of circulating M-MDSCs in PB. Both iNKTreg and iNKT10 percentages showed statistically significant positive correlations with the percentage of circulating monocytic MDSCs (Fig. 7A,B; rho = 0.45, p = 0.0004 and rho = 0.26, p = 0.028, respectively). Moreover, positive correlations were identified between the proportions of iNKTreg and iNKT10 subsets and the fraction of M-MDSCs expressing indoleamine 2,3-dioxygenase (IDO) (Fig. 8A,B; rho = 0.23, p = 0.035 and rho = 0.26, p = 0.044, respectively). Additionally, IDO expression levels within M-MDSCs, quantified by MFI, exhibited a positive association with the abundance of these iNKT subpopulations (Fig. 8C,D; rho = 0.35, p = 0.007 and rho = 0.32, p = 0.015, respectively).
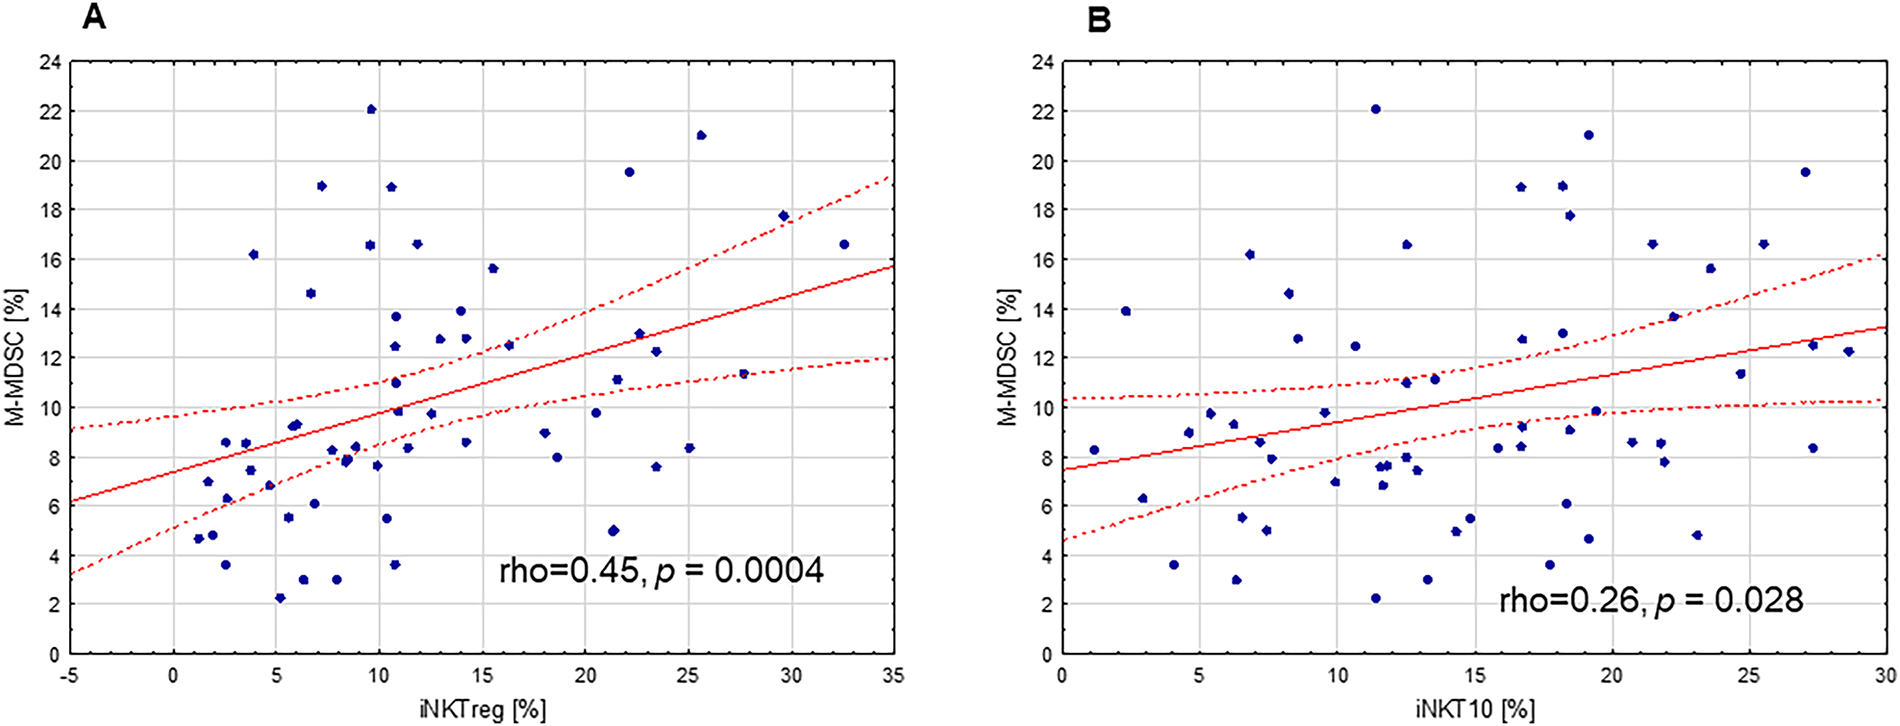
Figure 7: Correlation between immunoregulatory iNKT cell subpopulations and monocytic myeloid-derived suppressor cells (M-MDSCs) in PB of CLL patients. (A) The positive correlation between the percentage of regulatory iNKT cells (iNKTreg) and the proportion of circulating M-MDSCs. (B) The positive correlation between the percentage of iNKT10 cells and the proportion of circulating M-MDSCs. Statistical analysis was performed using Spearman’s rank correlation. The correlation coefficients (rho) and significance levels (p-values) are indicated in the figure
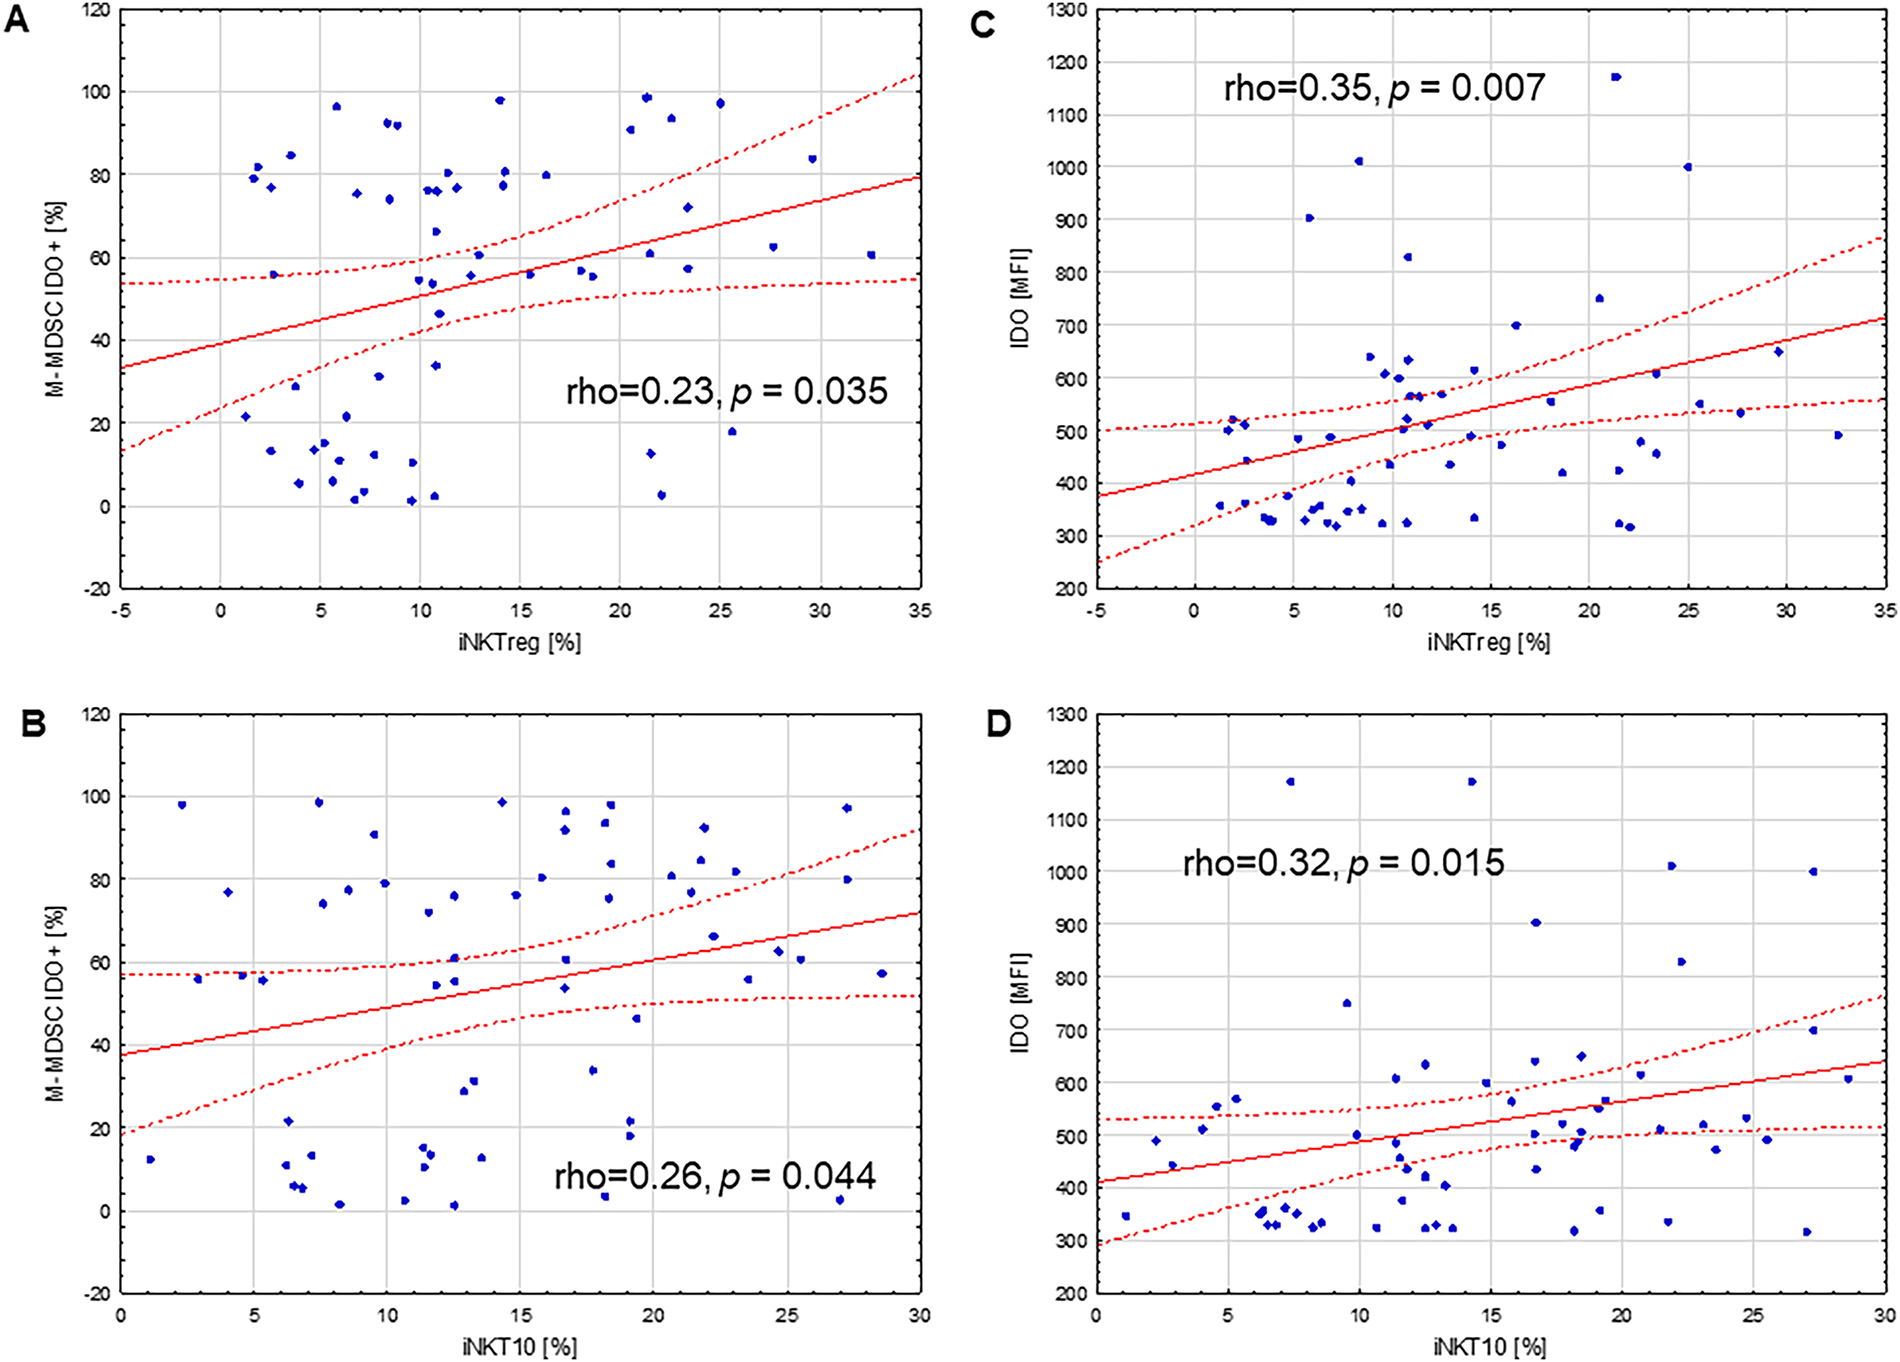
Figure 8: Correlations between immunoregulatory iNKT cell subpopulations and IDO expression in monocytic myeloid-derived suppressor cells (M-MDSCs) in PB of CLL patients. (A) Positive correlation between the percentage of regulatory iNKT cells (iNKTreg) and the percentage of M-MDSCs expressing indoleamine 2,3-dioxygenase (IDO). (B) Positive correlation between the percentage of iNKT10 cells and the percentage of IDO-expressing M-MDSCs. (C) Positive association between IDO expression, determined by mean fluorescence intensity (MFI) in M-MDSCs, and the percentage of iNKTreg cells. (D) Positive association between IDO MFI in M-MDSCs and the percentage of iNKT10 cells. Statistical analysis was performed using Spearman’s rank correlation. The correlation coefficients (rho) and significance levels (p-values) are indicated in the figure
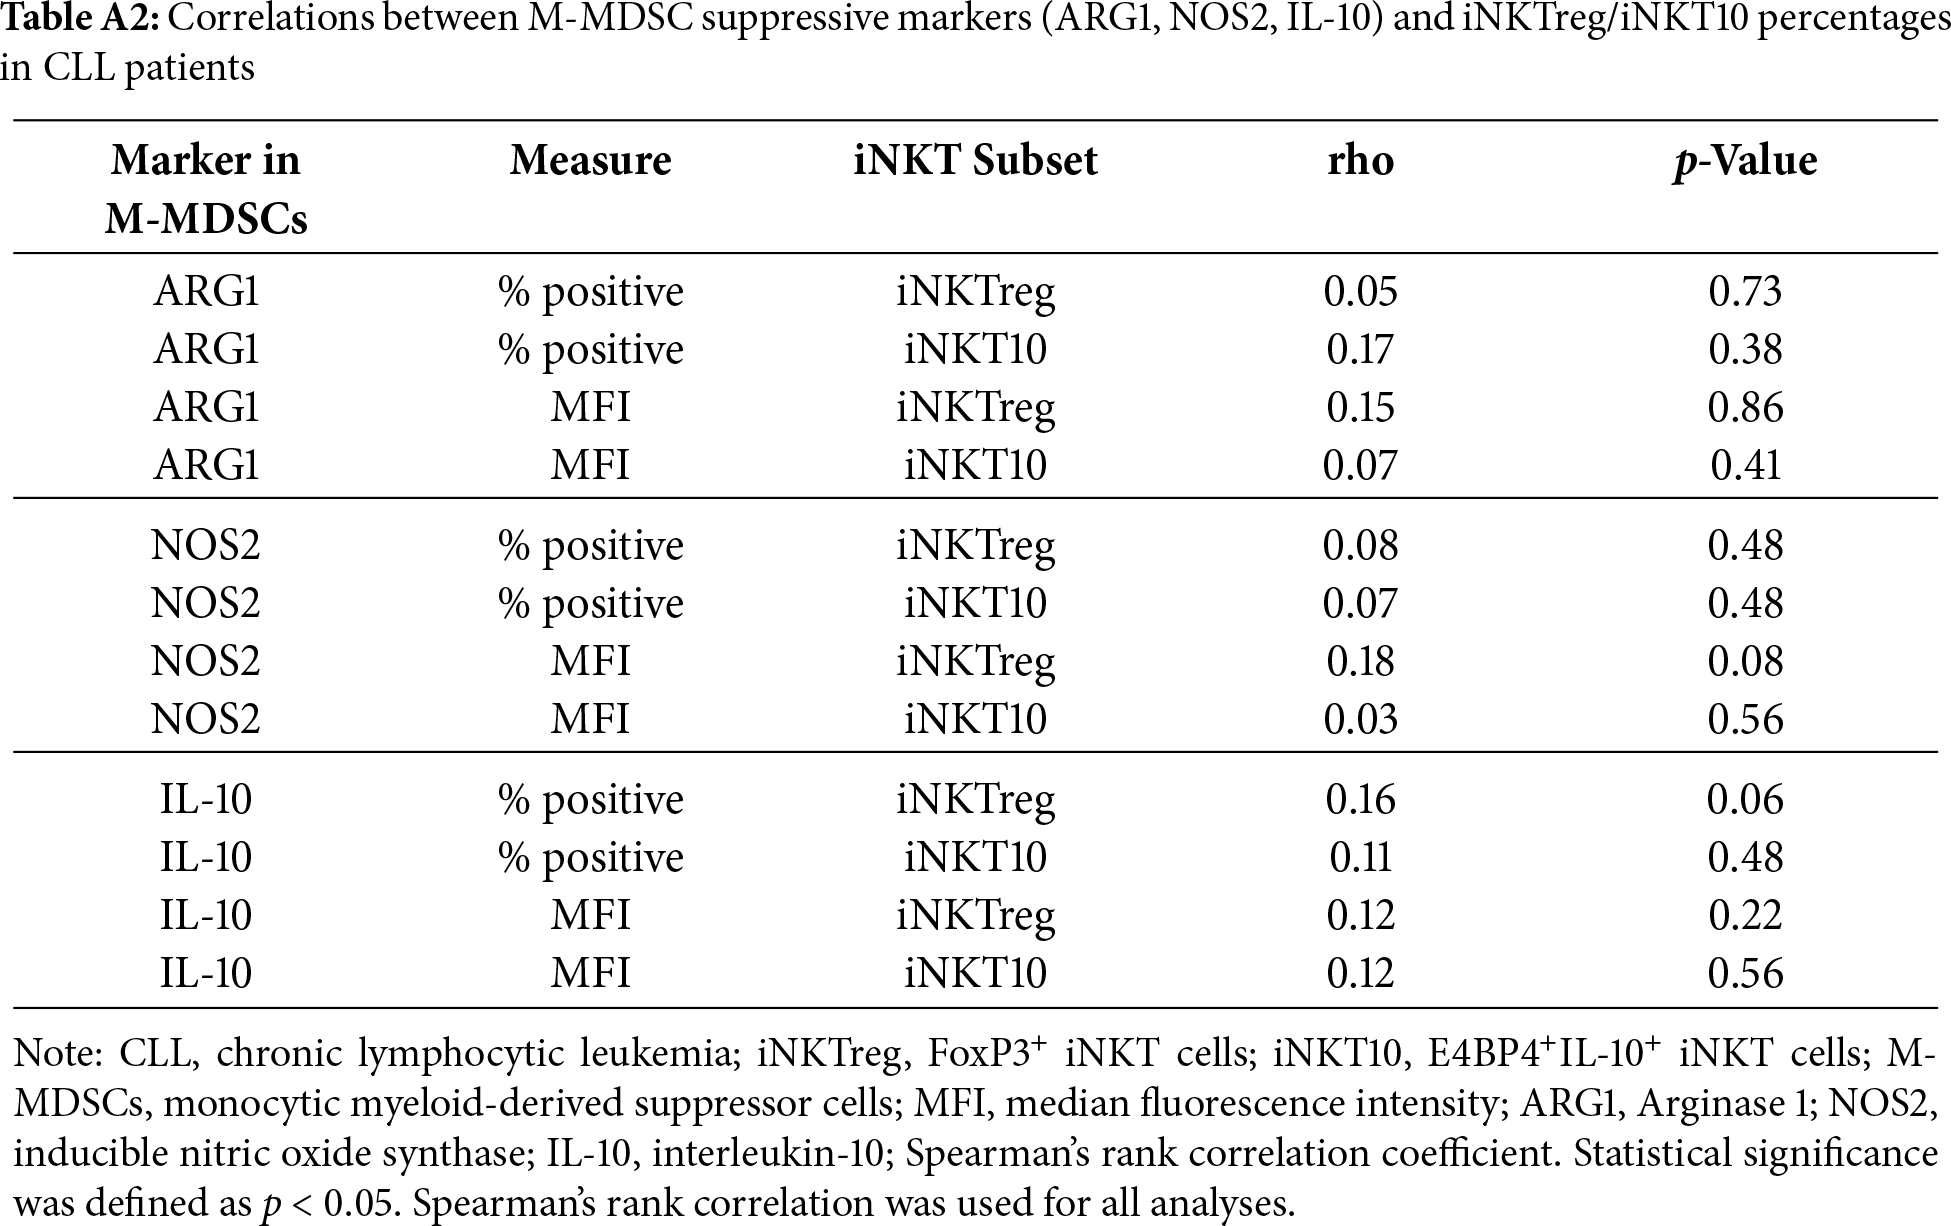
No significant associations were observed between the expression of suppressive molecules in monocytic MDSCs (M-MDSCs) and the percentages of regulatory iNKT subsets. The percentage of Arginase-1 (ARG1)-positive M-MDSCs showed no significant correlations with iNKTreg or iNKT10 percentages (rho = 0.05, p = 0.73 and rho = 0.17, p = 0.38, respectively), and similar findings were obtained for ARG1 median fluorescence intensity (MFI) (rho = 0.15, p = 0.86 and rho = 0.07, p = 0.41). Likewise, inducible nitric oxide synthase (NOS2) expression, assessed as both percentage of positive cells and MFI, was not significantly correlated with iNKTreg (rho = 0.08, p = 0.48; rho = 0.18, p = 0.08) or iNKT10 percentages (rho = 0.07, p = 0.48; rho = 0.03, p = 0.56). Similarly, IL-10 expression in M-MDSCs evaluated by the percentage of IL-10-positive cells (rho = 0.16, p = 0.06; rho = 0.11, p = 0.48) or MFI (rho = 0.12, p = 0.22; rho = 0.12, p = 0.56) demonstrated no statistically significant associations with either regulatory iNKT subset. Full correlation statistics are provided in Table A2.
Interactions between leukemic cells and various components of the tumor microenvironment significantly influence the development of CLL. Disruption of immune regulatory mechanisms promotes clonal proliferation, migration, and potential resistance to therapy [26]. Invariant natural killer T (iNKT) cells may significantly influence CLL pathogenesis by modulating immune responses and contributing to tumor immune escape [1,2,7,27,28]. Although the functional mechanisms remain to be fully elucidated, dysregulation of specific iNKT subsets has been suggested to reflect the immunoregulatory milieu associated with CLL progression [11,12].
Analysis of the iNKT10 and iNKTreg subpopulations in patients with CLL can provide crucial insights into the potential mechanisms of tumor immune evasion. In our study, we demonstrated that iNKTreg, defined by the expression of the transcription factor FoxP3, and iNKT10 cells, characterized by the expression of E4BP4 (NFIL3) and IL-10, were significantly more abundant in the PB of CLL patients compared to healthy controls. It is worth noting that the distinction in transcription factor expression underscores the unique regulatory profile of iNKT10 cells, which differ from iNKTreg cells in lacking FoxP3 expression. Instead, they exert their immunosuppressive effects predominantly through IL-10 production. iNKT10 cells, although resembling regulatory T cells (Tregs), do not express FoxP3 but mediate immune suppression through IL-10 secretion, highlighting a distinct regulatory pathway in immune regulation [21]. It has also been established that, unlike other iNKT cells, they do not express PLZF but exhibit high expression of the transcription factor E4BP4 (NFIL3), which regulates IL-10 production [22,29]. Therefore, in our study, the identification of iNKT10 cells was based on intracellular staining for E4BP4 and IL-10. Currently, data specifically addressing the role of iNKT10 cells in CLL remains limited. However, it is important to note that IL-10 plays a pivotal role as an immunosuppressive cytokine that promotes leukemia cell survival and immune evasion within the leukemia microenvironment [30].
The findings of Engelman et al. [31] demonstrated that human iNKT cells, including CD4+, double-negative, and CD8+ subsets, express FoxP3 mRNA and protein even in the absence of stimulation, and that FoxP3 expression dynamically changes upon activation, particularly after anti-CD3 stimulation. The authors indicated that FoxP3 functions as a key transcriptional regulator of iNKT cell regulatory capacity [31]. Importantly, accumulating evidence challenges the notion that FoxP3 is exclusively a marker of natural or induced regulatory T cells (nTreg/iTreg), at least in humans [31–33]. The focus of most research has been on conventional regulatory T cells (Tregs, CD4+, FoxP3+). However, data specifically on FoxP3+ iNKT cells in CLL are limited.
While most research has focused on conventional regulatory T cells (Tregs), it is important to consider the distinct behavior and alterations of iNKT cells in CLL. This is supported by studies showing that iNKT cells are generally reduced in percentages in the PB of CLL patients compared to healthy controls [1,2,7,27,34]. This reduction in iNKT cell percentages in CLL is further compounded by functional impairments, as these cells exhibit a Th2 bias characterized by increased IL-4 and decreased IFN-γ production, potentially promoting leukemic B cell survival and immune evasion [27]. Additionally, this shift is linked to decreased CD1d expression on CLL B cells, limiting their capacity to present glycolipid antigens and activate iNKT cells [9,27].
Previous studies have consistently demonstrated numerical reduction and functional impairment of total iNKT cells in CLL, which are considered hallmarks of disrupted antitumor surveillance [1,2,7,27,34]. Regarding iNKT cells in CLL, higher proportions of these cells correlate with better clinical outcomes, including achievement and maintenance of complete remission and a stable disease course [34]. However, these earlier findings largely focused on overall iNKT frequency without distinguishing between specific transcriptionally and functionally defined regulatory subsets. The present work adds to existing knowledge by characterizing two underexplored iNKT populations in CLL: FoxP3+ iNKTreg and IL-10-producing iNKT10 cells. Their selective expansion in patients with adverse prognostic features suggests that regulatory skewing of the iNKT compartment, not merely its numerical decline, may reflect important immunological changes associated with disease aggressiveness.
The results of several studies indicate an increased proportion of total Treg cells in CLL patients compared to healthy controls, with this elevation being associated with disease course [35–38]. The expansion of conventional CD4+FoxP3+ regulatory T cells (Tregs) is well established in CLL and has been linked to adverse clinical features [1,35,39–41]. Several studies have shown that total Treg numbers are increased in the peripheral blood of CLL patients compared to healthy controls and correlate with progressive disease, higher tumor burden, and unfavorable prognostic markers [37,38,42,43]. Moreover, higher Treg frequencies have been reported to predict a shorter time to first treatment and to retain independent prognostic value in multivariate models that include established risk factors such as Rai stage, cytogenetic abnormalities, and CD38 expression [37,38]. In contrast, the role of FoxP3+ iNKTreg cells in CLL has been far less explored. Although iNKTreg share FoxP3 expression and immunosuppressive potential with conventional Tregs [44–47], they differ in TCR specificity, CD1d-restricted lipid antigen recognition, and their rapid, innate-like cytokine secretion profile [48,49]. In our cohort, higher iNKTreg percentages were associated with more advanced clinical stage, high-risk biological markers, and shorter TTFT in univariate analysis, mirroring the pattern described for conventional Tregs. However, unlike classical Tregs, iNKTreg did not retain independent prognostic significance after adjustment for established risk factors, suggesting that their expansion reflects underlying aggressive disease biology rather than constituting an autonomous prognostic determinant. These findings support the concept that multiple regulatory lymphocyte compartments, including both conventional Tregs and iNKTreg, may be simultaneously amplified during CLL progression, but their relative contribution to immune dysregulation remains to be clarified.
Notably, both iNKTreg and iNKT10 subpopulations were significantly elevated in patients with advanced disease stages (III–IV) compared to those at stage 0. The percentage of iNKTreg cells was also significantly higher in patients positive for the prognostic markers ZAP-70 and CD38, whereas a similar but statistically nonsignificant trend was observed for iNKT10 cells. Moreover, iNKT10 cells were significantly more abundant in patients harboring the cytogenetic aberrations 11q- or 17p-. While the median proportion of iNKTreg cells was elevated in these patients, the increase did not reach statistical significance. Finally, both iNKTreg and iNKT10 populations tended to be higher in patients with unmutated IGHV compared to those with mutated IGHV, although these differences were not statistically significant.
In our cohort, higher baseline percentages of iNKTreg and iNKT10 cells were observed in patients with CLL who required therapy during follow-up, whereas only iNKTreg was associated with shorter TTFT in univariate models. Using ROC-derived threshold analyses against ZAP-70 positivity, patients with iNKTreg ≥ 9.6% exhibited significantly shorter TTFT, while the iNKT10 cut-off did not independently predict outcomes. These findings align with the recognized plasticity of iNKT cells, which can adopt either effector or immunoregulatory phenotypes depending on the context [50]. Furthermore, these studies suggest that iNKTreg may serve as a biomarker for more aggressive clinical outcomes in CLL. Significantly, Kaplan–Meier analyses reveal that higher percentages of iNKTreg cells associate with shorter TTFT, strengthening their potential influence on disease progression. Although iNKT10 percentages exhibited a similar trend, their association with TTFT did not reach statistical significance. These findings suggest that an elevated iNKTreg population may contribute to more aggressive disease biology and could serve as a valuable biomarker for early treatment stratification. At the cellular level, mTOR inhibition induces FoxP3 nuclear localization in iNKT cells, promoting a suppressive phenotype characterized by reduced IFN-γ production, consistent with microenvironmental tolerance that may facilitate leukemic B-cell survival [51]. Moreover, Th2/IL-4 skewing and progressive iNKT dysfunction in CLL suggest that expansion of regulatory iNKT populations may contribute to immunosuppression, linking iNKT-mediated regulation and ZAP-70 signaling to more aggressive clinical outcomes [2,27]. Collectively, these observations position iNKTreg as a potential biomarker of disease aggressiveness. Although higher iNKTreg percentages were associated with shorter TTFT in univariate analysis, this relationship did not remain statistically significant when established prognostic markers were incorporated into the multivariate model. This suggests that iNKTreg expansion reflects underlying aggressive disease biology rather than providing independent prognostic value. Thus, iNKTreg may serve as a complementary immunological indicator of disease aggressiveness but should not be considered a standalone prognostic biomarker at this stage.
Our previous work demonstrated that M-MDSCs in CLL exhibit significant overexpression of key immunoregulatory molecules, including IDO, IL-10, and TGF-β1, at both the protein and mRNA levels, distinguishing them from monocytes of healthy donors [17]. Building upon these findings, the current study identifies significant positive correlations between immunoregulatory iNKT subpopulations, namely iNKTreg, iNKT10, and M-MDSCs, with the strongest associations observed for the subset expressing IDO, as reflected by both percentages and IDO expression intensity (MFI). Notably, no significant correlations were found between these iNKT subsets and other immunosuppressive mediators, including ARG1, NOS2, or IL-10, suggesting that the regulatory interactions relevant to iNKT cells are compartmentalized and centered on IDO-mediated pathways. These observations resonate with previous reports implicating IDO in suppression of iNKT cell proliferation and function in solid tumors, including melanoma [52]. In addition, consistent with the findings of Taniguchi et al., iNKT cells can produce IL-10 and imprint IL-10 high regulatory dendritic cells, thereby propagating tolerogenic circuits beyond the iNKT compartment [53]. However, in our CLL cohort, M-MDSC-derived IL-10, measured both as percentage and MFI, did not correlate with iNKTreg or iNKT10 percentages, reinforcing the concept of a compartmentalized IL-10 axis. Taken together, these findings support the notion that the leukemic microenvironment promotes a regulatory shift within the iNKT compartment, underscoring the prominent role of IDO-dependent tryptophan catabolism in shaping immune tolerance and facilitating immune evasion in CLL. The observed associations highlight an intricate crosstalk between regulatory iNKT subpopulations and M-MDSCs driven by IDO-mediated pathways. Nevertheless, our study did not directly address the functional activity of these regulatory iNKT subsets, and therefore, causality in their contribution to immune suppression or disease progression cannot be inferred. Despite these novel insights, several limitations should be acknowledged.
This study has limitations. First, it was conducted at a single center with a relatively limited sample size, which may affect the generalizability of the findings and statistical power, particularly in subgroup analyses. All participants were recruited from a single institution and geographic region, and therefore, population-specific or center-related effects cannot be ruled out. Second, although the prognostic cut-off values for iNKTreg and iNKT10 percentages showed clinical relevance, they were derived and applied within the same cohort; thus, they should be considered exploratory and require validation in independent, multicenter cohorts. Third, only peripheral blood samples were analyzed, without longitudinal immune monitoring or assessment of tissue-resident iNKT subsets, which might provide additional insights into their role within the tumor microenvironment. Future multicenter studies integrating functional assays and extended follow-up are needed to confirm these observations.
Our study demonstrates that regulatory invariant natural killer T cell subsets, particularly iNKTreg cells, are elevated in patients with CLL and are associated with established markers of adverse prognosis and shorter TTFT. These findings suggest that iNKTreg percentages may reflect more aggressive disease biology and warrant further investigation as complementary biomarkers in clinical risk stratification. The observed correlation between iNKTreg expansion and an IDO-enriched myeloid environment indicates a potential contribution of tryptophan catabolism-driven immunoregulation in CLL. However, our study does not provide functional evidence for their direct role in immune suppression or disease progression, and causality cannot be inferred. Functional analyses will be required to clarify the immunoregulatory role of iNKT subsets and their crosstalk with M-MDSCs. While iNKT cell-based therapies are under development in other malignancies, translation to CLL will depend on better defining the biological relevance of iNKTreg and iNKT10 cells and validating our findings in larger, multicenter cohorts. Overall, our work highlights regulatory iNKT cells as a promising area for further biomarker research in CLL.
Acknowledgement: The authors sincerely thank Katarzyna Jastrzębska-Pawłowska for invaluable technical support during the execution of the experiments.
Funding Statement: The study was funded by the Medical University of Lublin, Poland, grant number DS 458.
Author Contributions: The authors confirm contribution to the paper as follows: study conception and design: Przemysław Piwowarczyk, Agnieszka Bojarska-Junak; data collection: Przemysław Piwowarczyk, Justyna Woś, Sylwia Chocholska, Waldemar Tomczak; methodology: Przemysław Piwowarczyk, Agata Szymańska; analysis and interpretation of results: Przemysław Piwowarczyk, Agnieszka Bojarska-Junak; draft manuscript preparation: Przemysław Piwowarczyk; supervision: Agnieszka Bojarska-Junak, Jacek Roliński; writing—review & editing: Przemysław Piwowarczyk, Justyna Woś, Agata Szymańska, Sylwia Chocholska, Waldemar Tomczak, Jacek Roliński, Agnieszka Bojarska-Junak. All authors reviewed the results and approved the final version of the manuscript.
Availability of Data and Materials: The data that support the findings of this study are available from the Corresponding Author, [Agnieszka Bojarska-Junak], upon reasonable request.
Ethics Approval: The study was conducted according to the guidelines of the Declaration of Helsinki and approved by the Ethics Committee of the Medical University of Lublin No. KE-0254/49/2016 (date of approval: 24 March 2016) and KE-0254/186/10/2022 (date of approval: 6 October 2022). Written informed consent was obtained from all patients.
Conflicts of Interest: The authors declare no conflicts of interest to report regarding the present study.
References
1. Griggio V, Perutelli F, Salvetti C, Boccellato E, Boccadoro M, Vitale C, et al. Immune dysfunctions and immune-based therapeutic interventions in chronic lymphocytic leukemia. Front Immunol. 2020;11:594556. doi:10.3389/fimmu.2020.594556. [Google Scholar] [PubMed] [CrossRef]
2. Gorini F, Azzimonti L, Delfanti G, Scarfò L, Scielzo C, Bertilaccio MT, et al. Invariant NKT cells contribute to chronic lymphocytic leukemia surveillance and prognosis. Blood. 2017;129(26):3440–51. doi:10.1182/blood-2016-11-751065. [Google Scholar] [PubMed] [CrossRef]
3. Hanna BS, Öztürk S, Seiffert M. Beyond bystanders: myeloid cells in chronic lymphocytic leukemia. Mol Immunol. 2019;110:77–87. doi:10.1016/j.molimm.2017.11.014. [Google Scholar] [PubMed] [CrossRef]
4. McEwen-Smith RM, Salio M, Cerundolo V. The regulatory role of invariant NKT cells in tumor immunity. Cancer Immunol Res. 2015;3(5):425–35. doi:10.1158/2326-6066.cir-15-0062. [Google Scholar] [PubMed] [CrossRef]
5. Bharadwaj NS, Gumperz JE. Harnessing invariant natural killer T cells to control pathological inflammation. Front Immunol. 2022;13:998378. doi:10.3389/fimmu.2022.998378. [Google Scholar] [PubMed] [CrossRef]
6. Shyanti RK, Haque M, Singh R, Mishra M. Optimizing iNKT-driven immune responses against cancer by modulating CD1d in tumor and antigen presenting cells. Clin Immunol. 2024;269:110402. doi:10.1016/j.clim.2024.110402. [Google Scholar] [PubMed] [CrossRef]
7. Weinkove R, Brooks CR, Carter JM, Hermans IF, Ronchese F. Functional invariant natural killer T-cell and CD1d axis in chronic lymphocytic leukemia: implications for immunotherapy. Haematologica. 2013;98(3):376–84. doi:10.3324/haematol.2012.072835. [Google Scholar] [PubMed] [CrossRef]
8. Bojarska-Junak A, Hus I, Chocholska S, Tomczak W, Woś J, Czubak P, et al. CD1d expression is higher in chronic lymphocytic leukemia patients with unfavorable prognosis. Leuk Res. 2014;38(4):435–42. doi:10.1016/j.leukres.2013.12.015. [Google Scholar] [PubMed] [CrossRef]
9. Ghnewa YG, O’Reilly VP, Vandenberghe E, Browne PV, McElligott AM, Doherty DG. Retinoic acid induction of CD1d expression primes chronic lymphocytic leukemia B cells for killing by CD8+ invariant natural killer T cells. Clin Immunol. 2017;183:91–8. doi:10.1016/j.clim.2017.08.002. [Google Scholar] [PubMed] [CrossRef]
10. Look A, Burns D, Tews I, Roghanian A, Mansour S. Towards a better understanding of human iNKT cell subpopulations for improved clinical outcomes. Front Immunol. 2023;14:1176724. doi:10.3389/fimmu.2023.1176724. [Google Scholar] [PubMed] [CrossRef]
11. Monteiro M, Almeida CF, Caridade M, Ribot JC, Duarte J, Agua-Doce A, et al. Identification of regulatory Foxp3+ invariant NKT cells induced by TGF-β. J Immunol. 2010;185(4):2157–63. doi:10.4049/jimmunol.1000359. [Google Scholar] [PubMed] [CrossRef]
12. Buechel HM, Stradner MH, D’Cruz LM. Stages versus subsets: invariant natural killer T cell lineage differentiation. Cytokine. 2015;72(2):204–9. doi:10.1016/j.cyto.2014.12.005. [Google Scholar] [PubMed] [CrossRef]
13. Tognarelli EI, Gutiérrez-Vera C, Palacios PA, Pasten-Ferrada IA, Aguirre-Muñoz F, Cornejo DA, et al. Natural killer T cell diversity and immunotherapy. Cancers. 2023;15(24):5737. doi:10.3390/cancers15245737. [Google Scholar] [PubMed] [CrossRef]
14. Nelson A, Lukacs JD, Johnston B. The current landscape of NKT cell immunotherapy and the hills ahead. Cancers. 2021;13(20):5174. doi:10.3390/cancers13205174. [Google Scholar] [PubMed] [CrossRef]
15. Jitschin R, Braun M, Büttner M, Dettmer-Wilde K, Bricks J, Berger J, et al. CLL-cells induce IDOhi CD14+HLA-DRlo myeloid-derived suppressor cells that inhibit T-cell responses and promote TRegs. Blood. 2014;124(5):750–60. doi:10.1182/blood-2013-12-546416. [Google Scholar] [PubMed] [CrossRef]
16. Gustafson MP, Abraham RS, Lin Y, Wu W, Gastineau DA, Zent CS, et al. Association of an increased frequency of CD14+HLA-DRlo/neg monocytes with decreased time to progression in chronic lymphocytic leukaemia (CLL). Br J Haematol. 2012;156(5):674–6. doi:10.1111/j.1365-2141.2011.08902.x. [Google Scholar] [PubMed] [CrossRef]
17. Zarobkiewicz M, Kowalska W, Chocholska S, Tomczak W, Szymańska A, Morawska I, et al. High M-MDSC percentage as a negative prognostic factor in chronic lymphocytic leukaemia. Cancers. 2020;12(9):2614. doi:10.3390/cancers12092614. [Google Scholar] [PubMed] [CrossRef]
18. Hallek M, Cheson BD, Catovsky D, Caligaris-Cappio F, Dighiero G, Döhner H, et al. iwCLL guidelines for diagnosis, indications for treatment, response assessment, and supportive management of CLL. Blood. 2018;131(25):2745–60. doi:10.1182/blood-2017-09-806398. [Google Scholar] [PubMed] [CrossRef]
19. Schroers R, Griesinger F, Trümper L, Haase D, Kulle B, Klein-Hitpass L, et al. Combined analysis of ZAP-70 and CD38 expression as a predictor of disease progression in B-cell chronic lymphocytic leukemia. Leukemia. 2005;19(5):750–8. doi:10.1038/sj.leu.2403707. [Google Scholar] [PubMed] [CrossRef]
20. Hus I, Podhorecka M, Bojarska-Junak A, Roliński J, Schmitt M, Sieklucka M, et al. The clinical significance of ZAP-70 and CD38 expression in B-cell chronic lymphocytic leukaemia. Ann Oncol. 2006;17(4):683–90. doi:10.1093/annonc/mdj120. [Google Scholar] [PubMed] [CrossRef]
21. Sag D, Krause P, Hedrick CC, Kronenberg M, Wingender G. IL-10-producing NKT10 cells are a distinct regulatory invariant NKT cell subset. J Clin Investig. 2014;124(9):3725–40. doi:10.1172/jci72308. [Google Scholar] [PubMed] [CrossRef]
22. Lynch L, Michelet X, Zhang S, Brennan PJ, Moseman A, Lester C, et al. Regulatory iNKT cells lack expression of the transcription factor PLZF and control the homeostasis of Treg cells and macrophages in adipose tissue. Nat Immunol. 2015;16(1):85–95. doi:10.1038/ni.3047. [Google Scholar] [PubMed] [CrossRef]
23. Wang Y, Sedimbi S, Löfbom L, Singh AK, Porcelli SA, Cardell SL. Unique invariant natural killer T cells promote intestinal polyps by suppressing TH1 immunity and promoting regulatory T cells. Mucosal Immunol. 2018;11(1):131–43. doi:10.1038/mi.2017.34. [Google Scholar] [PubMed] [CrossRef]
24. Burrello C, Strati F, Lattanzi G, Diaz-Basabe A, Mileti E, Giuffrè MR, et al. IL10 secretion endows intestinal human iNKT cells with regulatory functions towards pathogenic T lymphocytes. J Crohn’s Colitis. 2022;16(9):1461–74. doi:10.1093/ecco-jcc/jjac049. [Google Scholar] [PubMed] [CrossRef]
25. Piwowarczyk P, Szymańska A, Chocholska S, Zarobkiewicz M, Woś J, Tomczak W, et al. Recognizing the role of galectin-9 in chronic lymphocytic leukemia: insights into its combination with other disease parameters to jointly determine chronic lymphocytic leukemia activity. Discov Med. 2025;37(198):1243. doi:10.24976/discov.med.202537198.110. [Google Scholar] [CrossRef]
26. Burger JA, Gribben JG. The microenvironment in chronic lymphocytic leukemia (CLL) and other B cell malignancies: insight into disease biology and new targeted therapies. Semin Cancer Biol. 2014;24:71–81. doi:10.1016/j.semcancer.2013.08.011. [Google Scholar] [PubMed] [CrossRef]
27. Bojarska-Junak A, Waldowska M, Woś J, Chocholska S, Hus I, Tomczak W, et al. Intracellular IL-4 and IFN-γ expression in iNKT cells from patients with chronic lymphocytic leukemia. Oncol Lett. 2017;15(2):1580–90. doi:10.3892/ol.2017.7484. [Google Scholar] [PubMed] [CrossRef]
28. Cui G, Abe S, Kato R, Ikuta K. Insights into the heterogeneity of iNKT cells: tissue-resident and circulating subsets shaped by local microenvironmental cues. Front Immunol. 2024;15:1349184. doi:10.3389/fimmu.2024.1349184. [Google Scholar] [PubMed] [CrossRef]
29. Motomura Y, Kitamura H, Hijikata A, Matsunaga Y, Matsumoto K, Inoue H, et al. The transcription factor E4BP4 regulates the production of IL-10 and IL-13 in CD4+ T cells. Nat Immunol. 2011;12(5):450–9. doi:10.1038/ni.2020. [Google Scholar] [PubMed] [CrossRef]
30. Silva FS, Barros-Lima A, Souza-Barros M, Crespo-Neto JA, Santos VGR, Pereira DS, et al. A dual-role for IL-10: from leukemogenesis to the tumor progression in acute lymphoblastic leukemia. Cytokine. 2023;171:156371. doi:10.1016/j.cyto.2023.156371. [Google Scholar] [PubMed] [CrossRef]
31. Engelmann P, Farkas K, Kis J, Richman G, Zhang Z, Liew CW, et al. Characterization of human invariant natural killer T cells expressing FoxP3. Int Immunol. 2011;23(8):473–84. doi:10.1093/intimm/dxr040. [Google Scholar] [PubMed] [CrossRef]
32. Noh J, Choi WS, Noh G, Lee JH. Presence of Foxp3-expressing CD19+CD5+ B cells in human peripheral blood mononuclear cells: human CD19+CD5+Foxp3+ regulatory B cell (breg). Immune Netw. 2010;10(6):247. doi:10.4110/in.2010.10.6.247. [Google Scholar] [PubMed] [CrossRef]
33. Morgan ME, van Bilsen JHM, Bakker AM, Heemskerk B, Schilham MW, Hartgers FC, et al. Expression of FOXP3 mRNA is not confined to CD4+CD25+ T regulatory cells in humans. Hum Immunol. 2005;66(1):13–20. doi:10.1016/j.humimm.2004.05.016. [Google Scholar] [PubMed] [CrossRef]
34. Boeck CL, Amberger DC, Doraneh-Gard F, Sutanto W, Guenther T, Schmohl J, et al. Significance of frequencies, compositions, and/or antileukemic activity of (DC-stimulated) invariant NKT, NK and CIK cells on the outcome of patients with AML, ALL and CLL. J Immunother. 2017;40(6):224–48. doi:10.1097/cji.0000000000000171. [Google Scholar] [PubMed] [CrossRef]
35. Roškar Z, Dreisinger M, Homšak E, Avčin T, Bevc S, Goropevšek A. Increased frequency of circulating activated FOXP3+ regulatory T cell subset in patients with chronic lymphocytic leukemia is associated with the estimate of the size of the tumor mass, STAT5 signaling and disease course during follow-up of patients on therapy. Cancers. 2024;16(18):3228. doi:10.3390/cancers16183228. [Google Scholar] [PubMed] [CrossRef]
36. Mpakou VE, Ioannidou HD, Konsta E, Vikentiou M, Spathis A, Kontsioti F, et al. Quantitative and qualitative analysis of regulatory T cells in B cell chronic lymphocytic leukemia. Leuk Res. 2017;60:74–81. doi:10.1016/j.leukres.2017.07.004. [Google Scholar] [PubMed] [CrossRef]
37. D’Arena G, D’Auria F, Simeon V, Laurenti L, Deaglio S, Mansueto G, et al. A shorter time to the first treatment may be predicted by the absolute number of regulatory T-cells in patients with Rai stage 0 chronic lymphocytic leukemia. Am J Hematol. 2012;87(6):628–31. doi:10.1002/ajh.23170. [Google Scholar] [PubMed] [CrossRef]
38. Weiss L, Melchardt T, Egle A, Grabmer C, Greil R, Tinhofer I. Regulatory T cells predict the time to initial treatment in early stage chronic lymphocytic leukemia. Cancer. 2011;117(10):2163–9. doi:10.1002/cncr.25752. [Google Scholar] [PubMed] [CrossRef]
39. Roessner PM, Seiffert M. T-cells in chronic lymphocytic leukemia: guardians or drivers of disease? Leukemia. 2020;34(8):2012–24. doi:10.1038/s41375-020-0873-2. [Google Scholar] [PubMed] [CrossRef]
40. Dreisinger M, Roškar Z, Goropevšek A, Zakelšek A, Čurič S, Živko N, et al. Increased STAT3 phosphorylation in CD4+ T-cells of treated patients with chronic lymphocytic leukemia and changes in circulating regulatory T-cell subsets relative to tumor mass distribution value and disease duration. Biomedicines. 2025;13(5):1204. doi:10.3390/biomedicines13051204. [Google Scholar] [PubMed] [CrossRef]
41. Maharaj K, Uriepero A, Sahakian E, Pinilla-Ibarz J. Regulatory T cells (Tregs) in lymphoid malignancies and the impact of novel therapies. Front Immunol. 2022;13:943354. doi:10.3389/fimmu.2022.943354. [Google Scholar] [PubMed] [CrossRef]
42. D’Arena G, Laurenti L, Minervini MM, Deaglio S, Bonello L, de Martino L, et al. Regulatory T-cell number is increased in chronic lymphocytic leukemia patients and correlates with progressive disease. Leuk Res. 2011;35(3):363–8. doi:10.1016/j.leukres.2010.08.010. [Google Scholar] [PubMed] [CrossRef]
43. Jadidi-Niaragh F, Ghalamfarsa G, Yousefi M, Tabrizi MH, Shokri F. Regulatory T cells in chronic lymphocytic leukemia: implication for immunotherapeutic interventions. Tumor Biol. 2013;34(4):2031–9. doi:10.1007/s13277-013-0832-x. [Google Scholar] [PubMed] [CrossRef]
44. Singer M, Elsayed AM, Husseiny MI. Regulatory T-cells: the face-off of the immune balance. Front Biosci. 2024;29(11):377. doi:10.31083/j.fbl2911377. [Google Scholar] [PubMed] [CrossRef]
45. Gootjes C, Zwaginga JJ, Roep BO, Nikolic T. Defining human regulatory T cells beyond FOXP3: the need to combine phenotype with function. Cells. 2024;13(11):941. doi:10.3390/cells13110941. [Google Scholar] [PubMed] [CrossRef]
46. Leadbetter EA, Karlsson MCI. Reading the room: iNKT cells influence B cell responses. Mol Immunol. 2021;130:49–54. doi:10.1016/j.molimm.2020.12.005. [Google Scholar] [PubMed] [CrossRef]
47. Park HJ, Lee SW, Park YH, Kim TC, van Kaer L, Hong S. CD1d-independent NK1.1+ Treg cells are IL2-inducible Foxp3+ T cells co-expressing immunosuppressive and cytotoxic molecules. Front Immunol. 2022;13:951592. doi:10.3389/fimmu.2022.951592. [Google Scholar] [PubMed] [CrossRef]
48. Rotolo A, Mason NJ, Exley MA. Innate iNKT cells: from biological insight to clinical impact. Front Immunol. 2025;16:1653183. doi:10.3389/fimmu.2025.1653183. [Google Scholar] [PubMed] [CrossRef]
49. Niedzielska M, Chalmers A, Popis MC, Altman-Sharoni E, Addis S, Beulen R, et al. CAR-iNKT cells: redefining the frontiers of cellular immunotherapy. Front Immunol. 2025;16:1625426. doi:10.3389/fimmu.2025.1625426. [Google Scholar] [PubMed] [CrossRef]
50. Choi J, Rudak PT, Lesage S, Mansour Haeryfar SM. Glycolipid stimulation of invariant NKT cells expands a unique tissue-resident population of precursors to mature NK cells endowed with oncolytic and antimetastatic properties. J Immunol. 2019;203(7):1808–19. doi:10.4049/jimmunol.1900487. [Google Scholar] [PubMed] [CrossRef]
51. Huijts CM, Schneiders FL, Garcia-Vallejo JJ, Verheul HM, de Gruijl TD, van der Vliet HJ. MTOR inhibition per se induces nuclear localization of foxp3 and conversion of invariant NKT (iNKT) cells into immunosuppressive regulatory iNKT cells. J Immunol. 2015;195(5):2038–45. doi:10.4049/jimmunol.1402710. [Google Scholar] [PubMed] [CrossRef]
52. Torre E, Pinton G, Lombardi G, Fallarini S. Melanoma cells inhibit iNKT cell functions via PGE2 and IDO1. Cancers. 2023;15(13):3498. doi:10.3390/cancers15133498. [Google Scholar] [PubMed] [CrossRef]
53. Taniguchi M, Tashiro T, Dashtsoodol N, Hongo N, Watarai H. The specialized iNKT cell system recognizes glycolipid antigens and bridges the innate and acquired immune systems with potential applications for cancer therapy. Int Immunol. 2010;22(1):1–6. doi:10.1093/intimm/dxp104. [Google Scholar] [PubMed] [CrossRef]
Cite This Article
 Copyright © 2026 The Author(s). Published by Tech Science Press.
This work is licensed under a Creative Commons Attribution 4.0 International License , which permits unrestricted use, distribution, and reproduction in any medium, provided the original work is properly cited.
 Downloads
 Citation Tools