
 Submit a Paper
 Propose a Special lssue
 Open Access
ARTICLE
Minor Pressure Differences within the Fontan-Anastomosis in Patients with Total Cavopulmonary Connection by 4D-Flow Magnetic Resonance Imaging
1 Department of Congenital Heart Disease and Pediatric Cardiology, German Heart Center Munich, Technical University of Munich, Munich, Germany
2 Fraunhofer Institute for Digital Medicine—MEVIS, Berlin, Germany
3 Institute for Cardiovascular Computer-Assisted Medicine, Charité Universitätsmedizin, Berlin, Germany
4 Department of Radiology, German Heart Center Munich, Technical University of Munich, Munich, Germany
* Corresponding Author: Nerejda Shehu. Email:
Congenital Heart Disease 2023, 18(4), 461-474. https://doi.org/10.32604/chd.2023.031075
Received 26 May 2023; Accepted 13 July 2023; Issue published 15 September 2023
 View Full Text
 Download PDF
Abstract
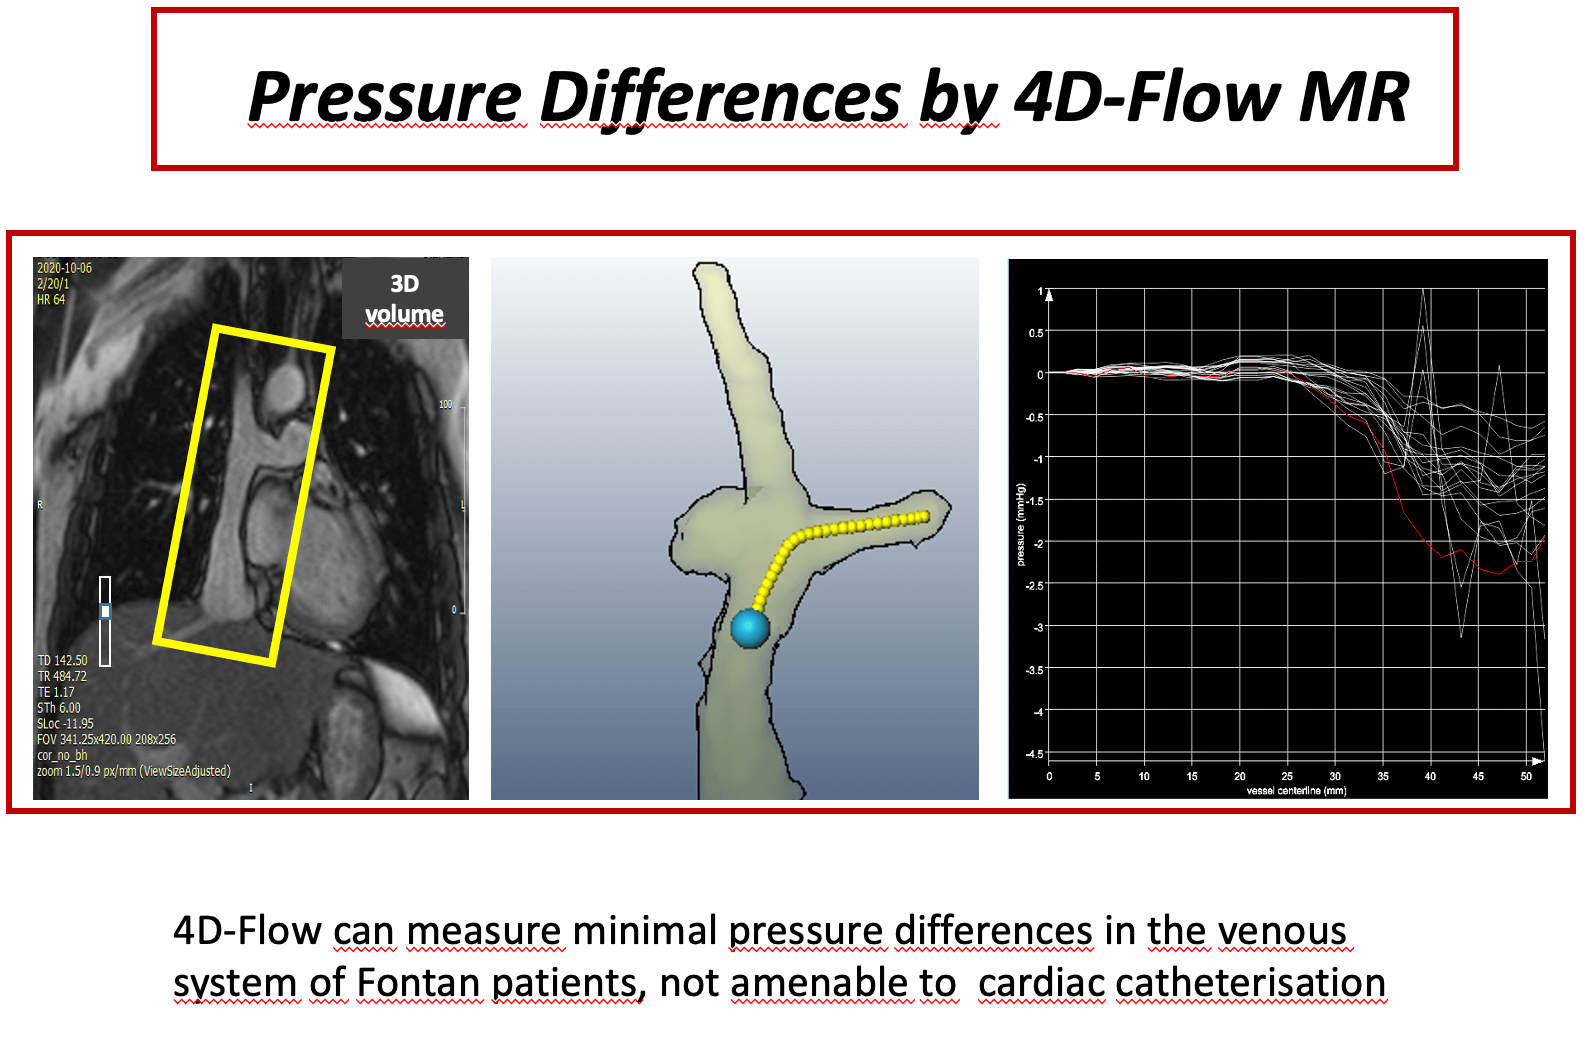
Background: Pressure measurement in total cavopulmonary connection (TCPC) patients is a domain of cardiac catheterization. 4D velocity encoded cardiovascular magnetic resonance (4D–flow MRI) offers an alternative for assessment of even minor pressure differences. The scope of this study was to measure even minor pressure differences in the anastomosis of TCPC patients, who are clinically uncompromised. Methods: Twenty-four patients (median 15 years [8;34]) with TCPC were studied prospectively by 4D-flow MRI. Pressure differences between superior vena cava (SVC) and extracardiac conduit (C) to both right pulmonary artery (RPA) and left pulmonary artery (LPA) were assessed. Small fluid obstructions as vortices within the anastxomosis were detected by flow pathlines from 4D-flow MRI. In two patients pressure differences were calculated also by computational flow dynamics (CFD) as a plausibility check for the order of magnitude. Results: Median values of pressure differences in the anastomosis between SVC and RPA were 0.63 (0.21–2.1) mmHg, between C and RPA 0.67 (0.3–2.2) mmHg, between SVC and LPA 0.8 (0.3–2.4) mmHg and between C and LPA 0.7 (0.2–1.9) mmHg. Patients with potential flow obstruction (stents, occluder, vortices) had significantly higher gradients at the anastomosis (p < 0.05) than patients without potential obstructions, although the absolute values were small. CFD- and measurement-based pressure difference showed good agreement. Conclusion: 4D-flow MRI is able to detect minor pressure differences within the Fontan circuit even in patients with apparently satisfactory TCPC. Slightly higher pressure differences are due to the presence of small flow obstruction.Graphic Abstract
Keywords
Total cavopulmonary connection (TCPC) with an extracardiac tunnel, a modification of the original Fontan technique, has become the technique of choice for the palliation of univentricular heart during the last two decades due to reduced pro-arrhythmic sequelae, decreased central venous pressure [1] and higher baffle energetic efficiency [2].
In patients with optimal cavopulmonary anastomosis, gradients at the anastomotic site are expected to be very low or virtually absent [3–5]. In a such circuit, relying exclusively on passive flow, even pressure gradients of >1 mm Hg can cause significant hemodynamic obstruction, leading eventually to failure of the Fontan circulation [6–8]. Currently, cardiac catheterisation is the only method that allows a direct measurement of the pressure gradients. However, low pressure gradients in the venous system cannot be reliably measured by conventional fluid filled catheters, and Doppler echocardiography is mostly unable to access the cavopulmonary anastomosis. Fluid inertia, motion artifacts due to cardiac movement, respiratory oscillation and averaging of pressure values in a 3-dimensional vector field prevent exact measurements. The standard deviation of pressure recordings by a regular fluid-filled pigtail catheter is up to 8 mmHg [9]. Measurement of pressure differences by 4D velocity encoded cardiovascular magnetic resonance (4D-flow MRI) offers a new, non-invasive and promising tool for calculating pressure differences in different vascular sections [9–11], including the low flow venous system.
We hypothesized that, in patients with TCPC, low gradients in the low flow venous system across the Fontan anastomosis might be missed by conventional diagnostics, but accurately captured by 4D-MRI pressure mapping. This might be more relevant in patients with a failing Fontan system, where often no gradient can be detected by cardiac catheterization.
This study aimed to calculate pressure differences at the cavopulmonary anastomosis, using 4D-flow MRI in TCPC patients, who are clinically uncompromised. We focused on areas, where small fluid obstructions as vortices, stents and occluders were present. In these cases, conventional catheter measurements fail to reveal small pressure differences.
Twenty-four patients with TCPC, using an extracardiac 18–20 mm Goretex® conduit from inferior vena cava (IVC) to the right pulmonary artery (RPA), underwent prospective cardiac MRI between September 2018 and October 2020.
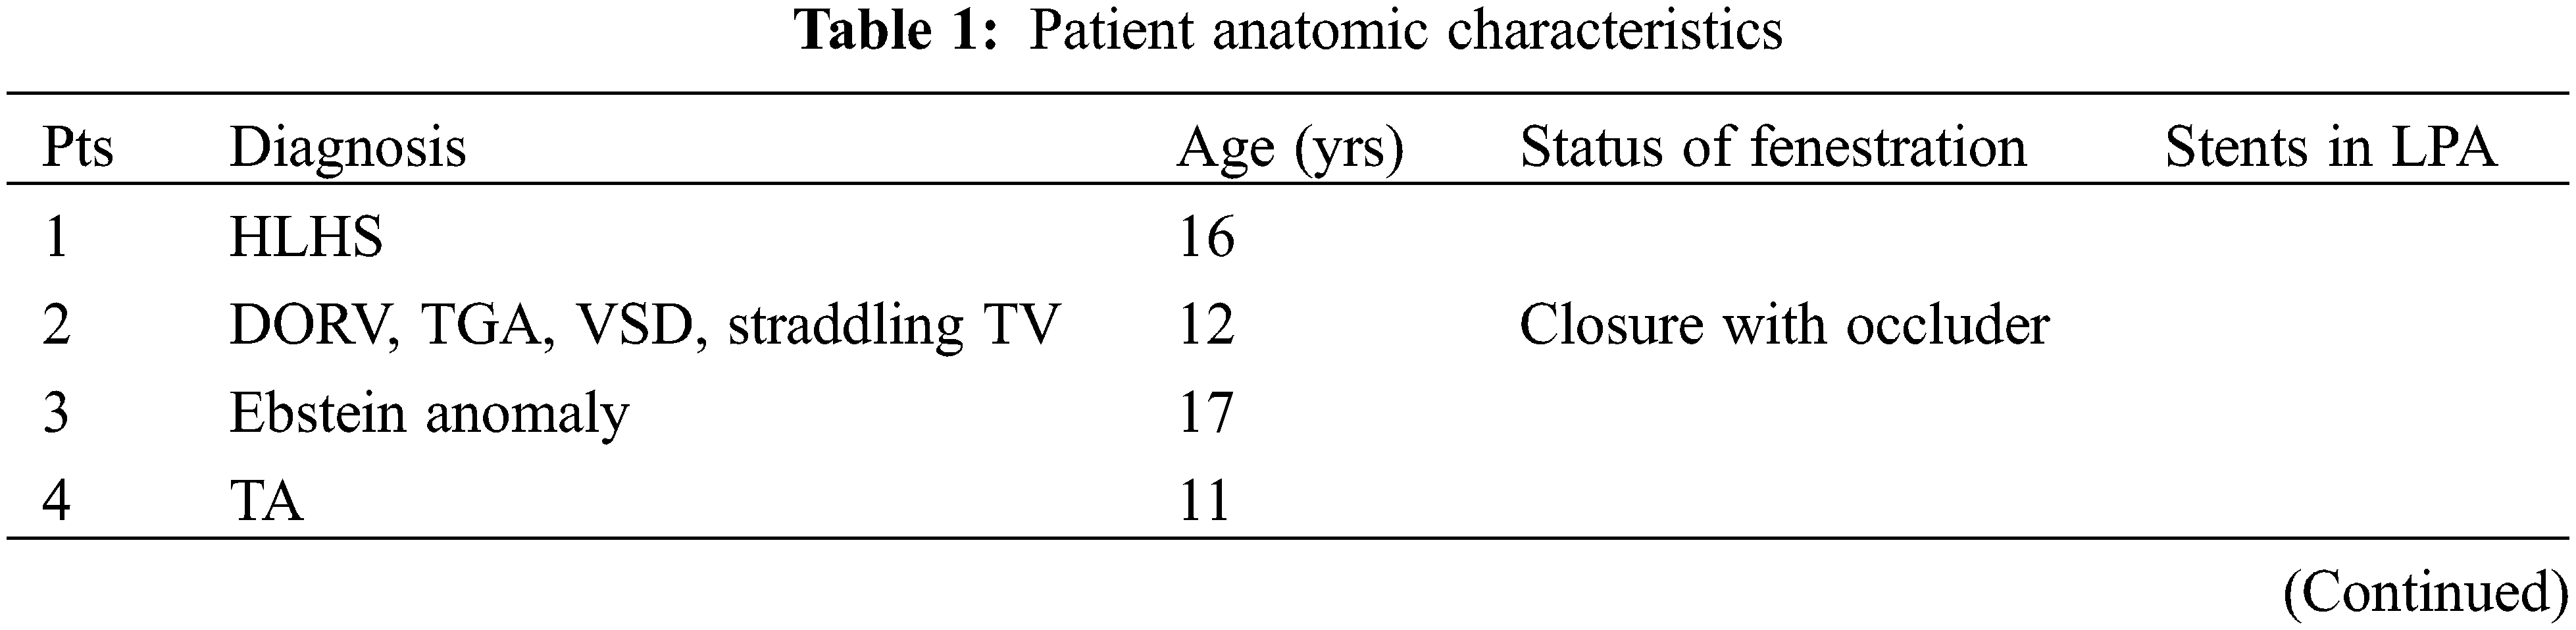
Inclusion criteria were age over 7 years, good clinical status, represented by a New York Heart Association (NYHA) class I or II and no indication for further surgery or catheter-based intervention at the time of MRI examination. Good clinical status relied mainly on maximum oxygen uptake (VO2max) during cardiopulmonary exercise tests. We excluded patients with cardiac pacemaker, implanted devices such as stents and coils leading to dephasing in major parts of caval veins, Fontan tunnel or central pulmonary arteries. However, two patients with stents in the left pulmonary artery (LPA) and two patients with an Amplatzer occluder in the tunnel fenestration, that still allow reliable flow measurements in the LPA or in the caval veins, were included. Patient characteristics are shown in Table 1.
2.2 Cardiovascular Magnetic Resonance (CMR)
We used a standard cardiac 1.5 Tesla MR-scanner and a standard cardiac 12-channel coil for all patients (Avanto, Siemens, Germany). Multiphase trueFISP cine sequences were used for quantification of ventricular volumes and systolic function. Calculations were performed by CVI42, version 5.1 (Circle cardiovascular imaging, Calgary).
2.3 4-Dimensional Flow Sequence (4D-Flow)
An anisotropic 4D segmented k-space phase contrast gradient echo sequence [12] was used in sagittal view, covering the superior vena cava, the extracardiac tunnel including the proximal part of the inferior caval vein and the proximal portions of the main pulmonary arteries. Data acquisition was gated in expiration by a navigator positioned on the right diaphragm without influencing flow measurements. We accepted data if the current breathing position was situated in end-expiration within a window of 4 mm. 4D-flow sequence was prospectively electrocardiogram (ECG) triggered. No contrast agent was used. Sequence parameters were: spatial resolution 1.8 mm3 × 1.8 mm3 × 2.0 mm3, matrix 160 × 120, FOV 280 mm × 210 mm, 32 slices acquired, TR 43.0 ms, TE 2.9 ms, flip angle 7°, temporal resolution 43 ms (15–17 frames), velocity encoding 0.8 m/s, as expected peak velocities in large vessels of the venous system are 50–80 cm/s [13]. PEAK-GRAPPA with an acceleration factor 5.0 and 20 reference lines was applied. Scan time varied between 7 and 12 min depending on heart rate and measured 4D flow stack.
4D-flow MRI DICOM datasets were processed using MEVISFlow© software (Fraunhofer MEVIS, Bremen, Germany) [14].
Preprocessing steps included: 1) image-based phase offset correction by manually selecting a phase deviation threshold to determine static tissue regions followed by fitting a polynomial to subtract the phase offset; 2) noise masking to exclude phase noise in image background regions; and 3) if necessary, fully automated phase unwrapping, as described previously [15]. We segmented the SVC, proximal RPA and LPA and the extracardiac tunnel by a semi-automatical workflow (Fig. 1). Furthermore, a finite-element-based solution for the Pressure-Poisson equation was applied to the segmented vessel areas for computing 4D intravascular blood pressure differences at the locations of the cavopulmonary connection after applying a divergence filter [16]. Its principal feasibility has been validated using flow phantoms [17] and animal studies [18], and the method showed consistent results also for human volunteers and patients [10,19]. The viscosity was set to 0.0042 Pa*s, the density was 1060 kg/m3.
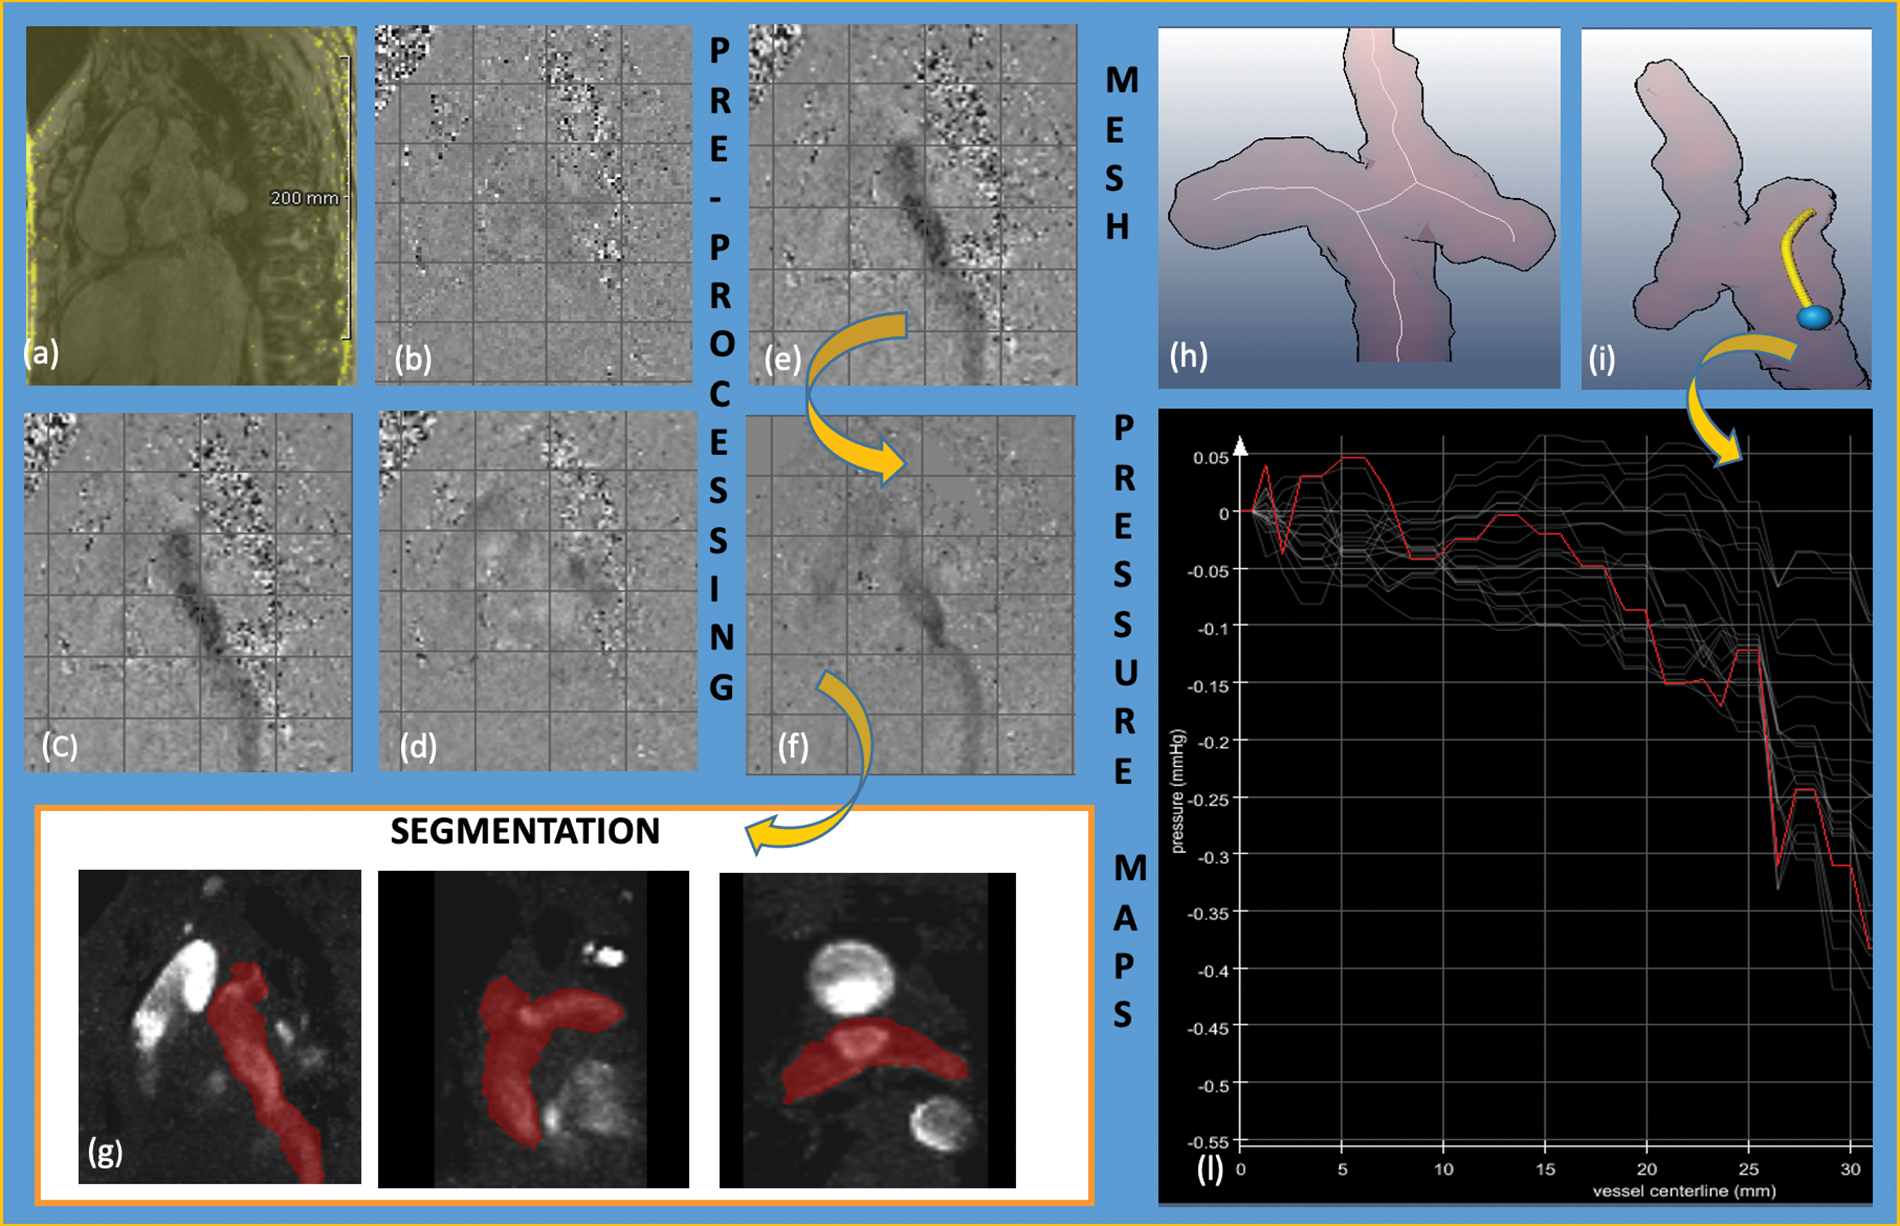
Figure 1: Analysis workflow figure of 4D-flow MRI data acquisition, pre-processing and pressure differences quantification. CMR data acquisition: (a) magnitude image; (b) phase-contrast image x-axis; (c) phase-contrast image y-axis; (d) phase-contrast image z-axis; pre-processing before (e) and after (f) static tissue deletion, noise filtering, eddy-current correction and anti-aliasing; (g) semiautomatically segmentation of the region of interest; flow analysis: (h) centerline; (i) centerline tunnel—LPA (the blue point is the starting point and the yellow line the region of interest of the anastomosis); (l) pressure gradients along centerline in 15–17 different time points of the cardiac circle. The red line shows the line with maximal gradient
Postprocessing analyses of all patients were conducted and confirmed contemporary by two CMR experts (N.S. and H.S.) and accepted only when both agreed. A centerline was semiautomatically computed from SVC and extracardiac tunnel to RPA and LPA, respectively (Fig. 2). As only relative pressure differences could be calculated, the reference point with 0-offset was set in the SVC or extracardiac tunnel.
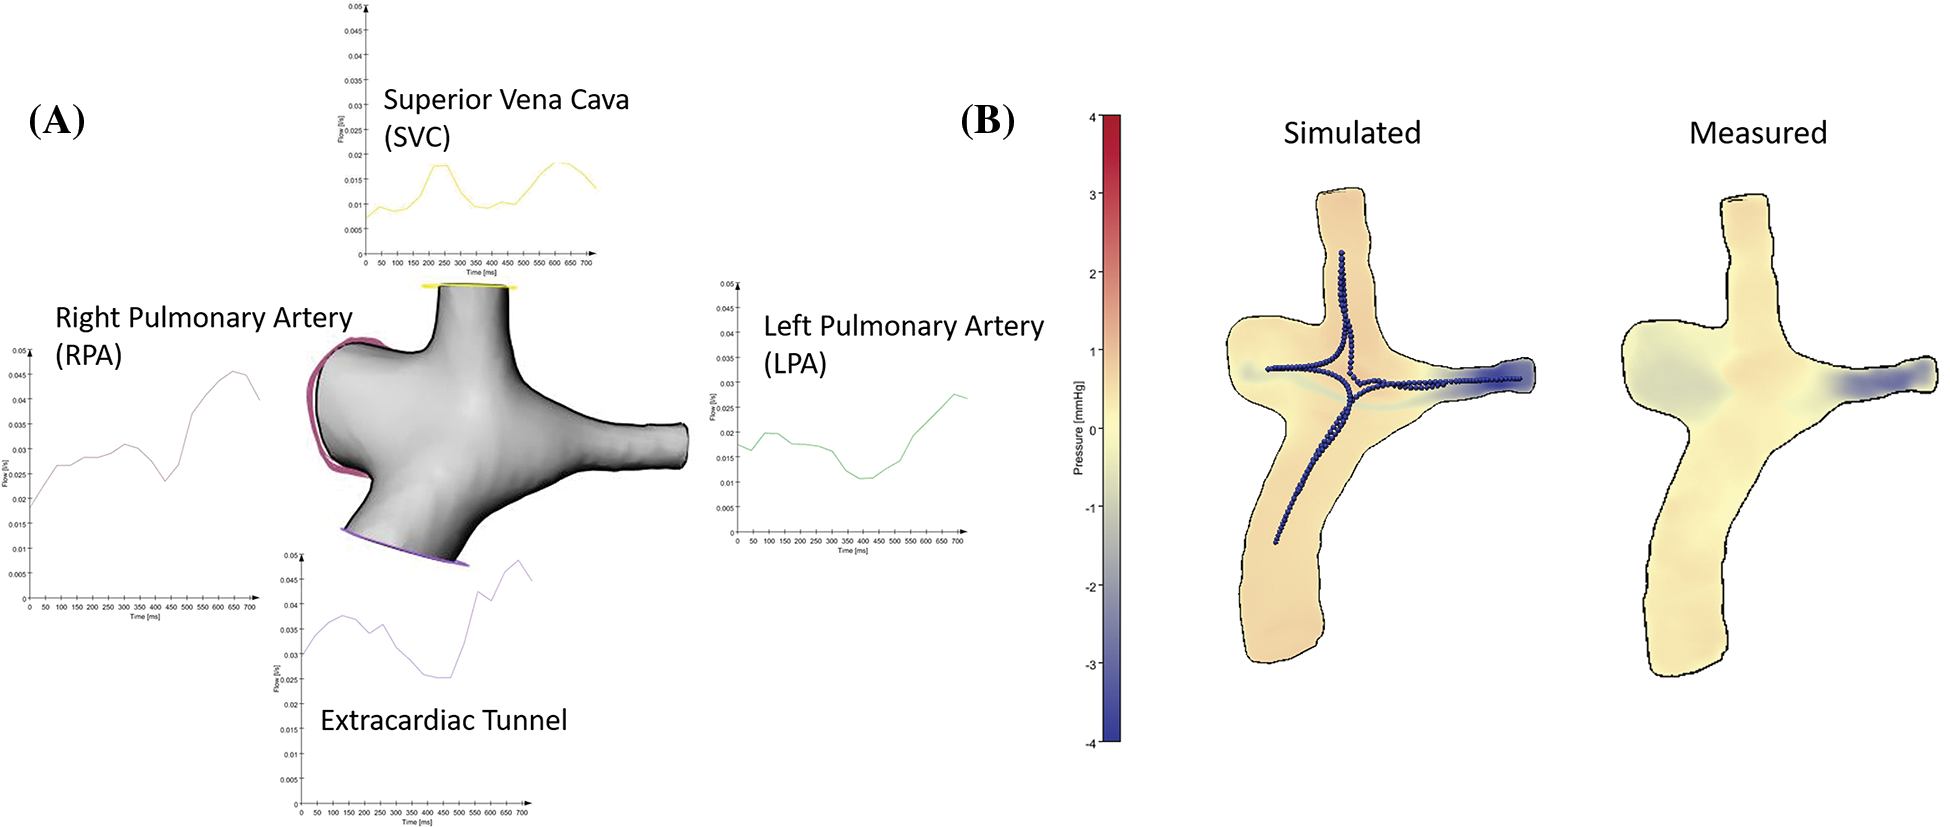
Figure 2: To calculate CFD-based pressure maps, we measured input flow information at the four in-and outflow branches. We put centerlines for calculation of pressure drops between extracardiac tunnel and RPA, extracardiac tunnel and LPA, SVC and RPA, SVC and LPA. The visualization of the CFD-based pressure differences and the measured pressure map shows comparable pressure distributions between the branches with a higher resolution in the simulated data
Time resolved pressure differences were recorded and the maximum relative pressure difference along the centerline at a given time point was extracted. The maximal pressure difference along the cardiac cycle (along all the 15–17 time points) was used for the statistical analysis. Flow visualisation was performed by tracking pathlines from predefined areas in the extracardiac tunnel and SVC to regions in the RPA and LPA, respectively. Pathlines were visually examined for the presence of vortices in the cavopulmonary anastomosis (Video).
2.5 Computational Fluid Dynamics
As a plausibility check of the order of magnitude of the measurements based on the noisy 4D-MR dataset, we also calculated pressure differences with computational fluid dynamics in different locations of the cavopulmonary anastomosis in two representative patients, one without vortex/stent/occluder and one with a stent in the LPA (Fig. 2). For this purpose, we exported the segmented anatomies of cases #6 and #18 as surface models. Flow curves were exported for the extracardiac tunnel, SVC, RPA and LPA. Flow boundary conditions were obtained for the respective inlet/outlet by calculating the mean flow rate from these flow curves.
Numerical simulations and mesh generation were performed using Siemens Star-CCM+ version 13.02 (Siemens PLM Software, Plano, TX, USA).
Computational meshes were created based on a surface model of the Fontan geometry using Star-CCM’s polyhedral meshing algorithm. Based on previous experience with similar computations, a cell base size of 0.5 mm was selected, resulting in approximately 600000 cells with 2.6 million vertices. Furthermore, a prismatic boundary layer with 5 layers was created at the vessel wall to accurately resolve boundary layer flow. Fig. 3 shows a cross section of the computational mesh along the Fontan conduit.
Figure 3: Cross section plane along the Fontan conduit showing the polyhedral computational mesh used for the numerical flow simulation
Steady volumetric flow rates based on 4D-flow MRI measurements were imposed on the in-and outflow boundaries, whereas a no-slip condition was used at the vessel wall. Plug velocity profiles were used at the inlets. The outlet velocity profiles were not prescribed and resulted from the flow domain’s numerical solution.
Given the low Reynolds numbers expected in the flow domain, a turbulence model was not used and the flow was thus considered laminar.
A transient SIMPLE algorithm with a time step size of 1 ms was used to solve the incompressible Navier Stokes governing equations. Despite the steady boundary conditions, the transient term was necessary to account for possible local unsteady flow structures.
Previous publications have suggested that neglecting the non-Newtonian effects on the Fontan hemodynamics impacts wall shear stress measurements [20,21]. The calculation of pressure differences using the Pressure-Poisson equation with a fixed viscosity value was therefore compared to a CFD simulation that assumes a non-Newtonian fluid in one case.
Maximal pressure differences along four different vessel centerlines were recorded: tunnel-RPA; tunnel-LPA, SVC-RPA and SVC-LPA. Median values as well as the minimum and maximum values were calculated.
Patients were divided in two groups, according to the presence or absence of potential flow obstruction within the cavopulmonary anastomosis, and maximum pressure differences along the four centerlines of the anastomosis during the cardiac circle were calculated. Potential flow obstructions were defined as the presence of vortices at the cavopulmonary anastomosis, the presence of a stent in the left pulmonary artery or the presence of an occluder in the tunnel at the site of a former fenestration to the left atrium.
Continuous variables are reported as mean ± standard deviation (SD) or median with maximum and minimum values, depending on the distribution pattern of the variable. Pressure differences measured along each of the four centerlines of the Fontan anastomosis were compared using the Wilcoxon test for paired variables. Maximum pressure differences along the anastomosis between patients with and without potential flow obstructions were compared by means of the Mann Whitney test. Differences with a type 1 error probability of less than 5% were considered as statistically significant. Data analysis was performed using the software program GraphPad Prism® (GraphPad Inc., La Jolla, CA, version 9.1.0).
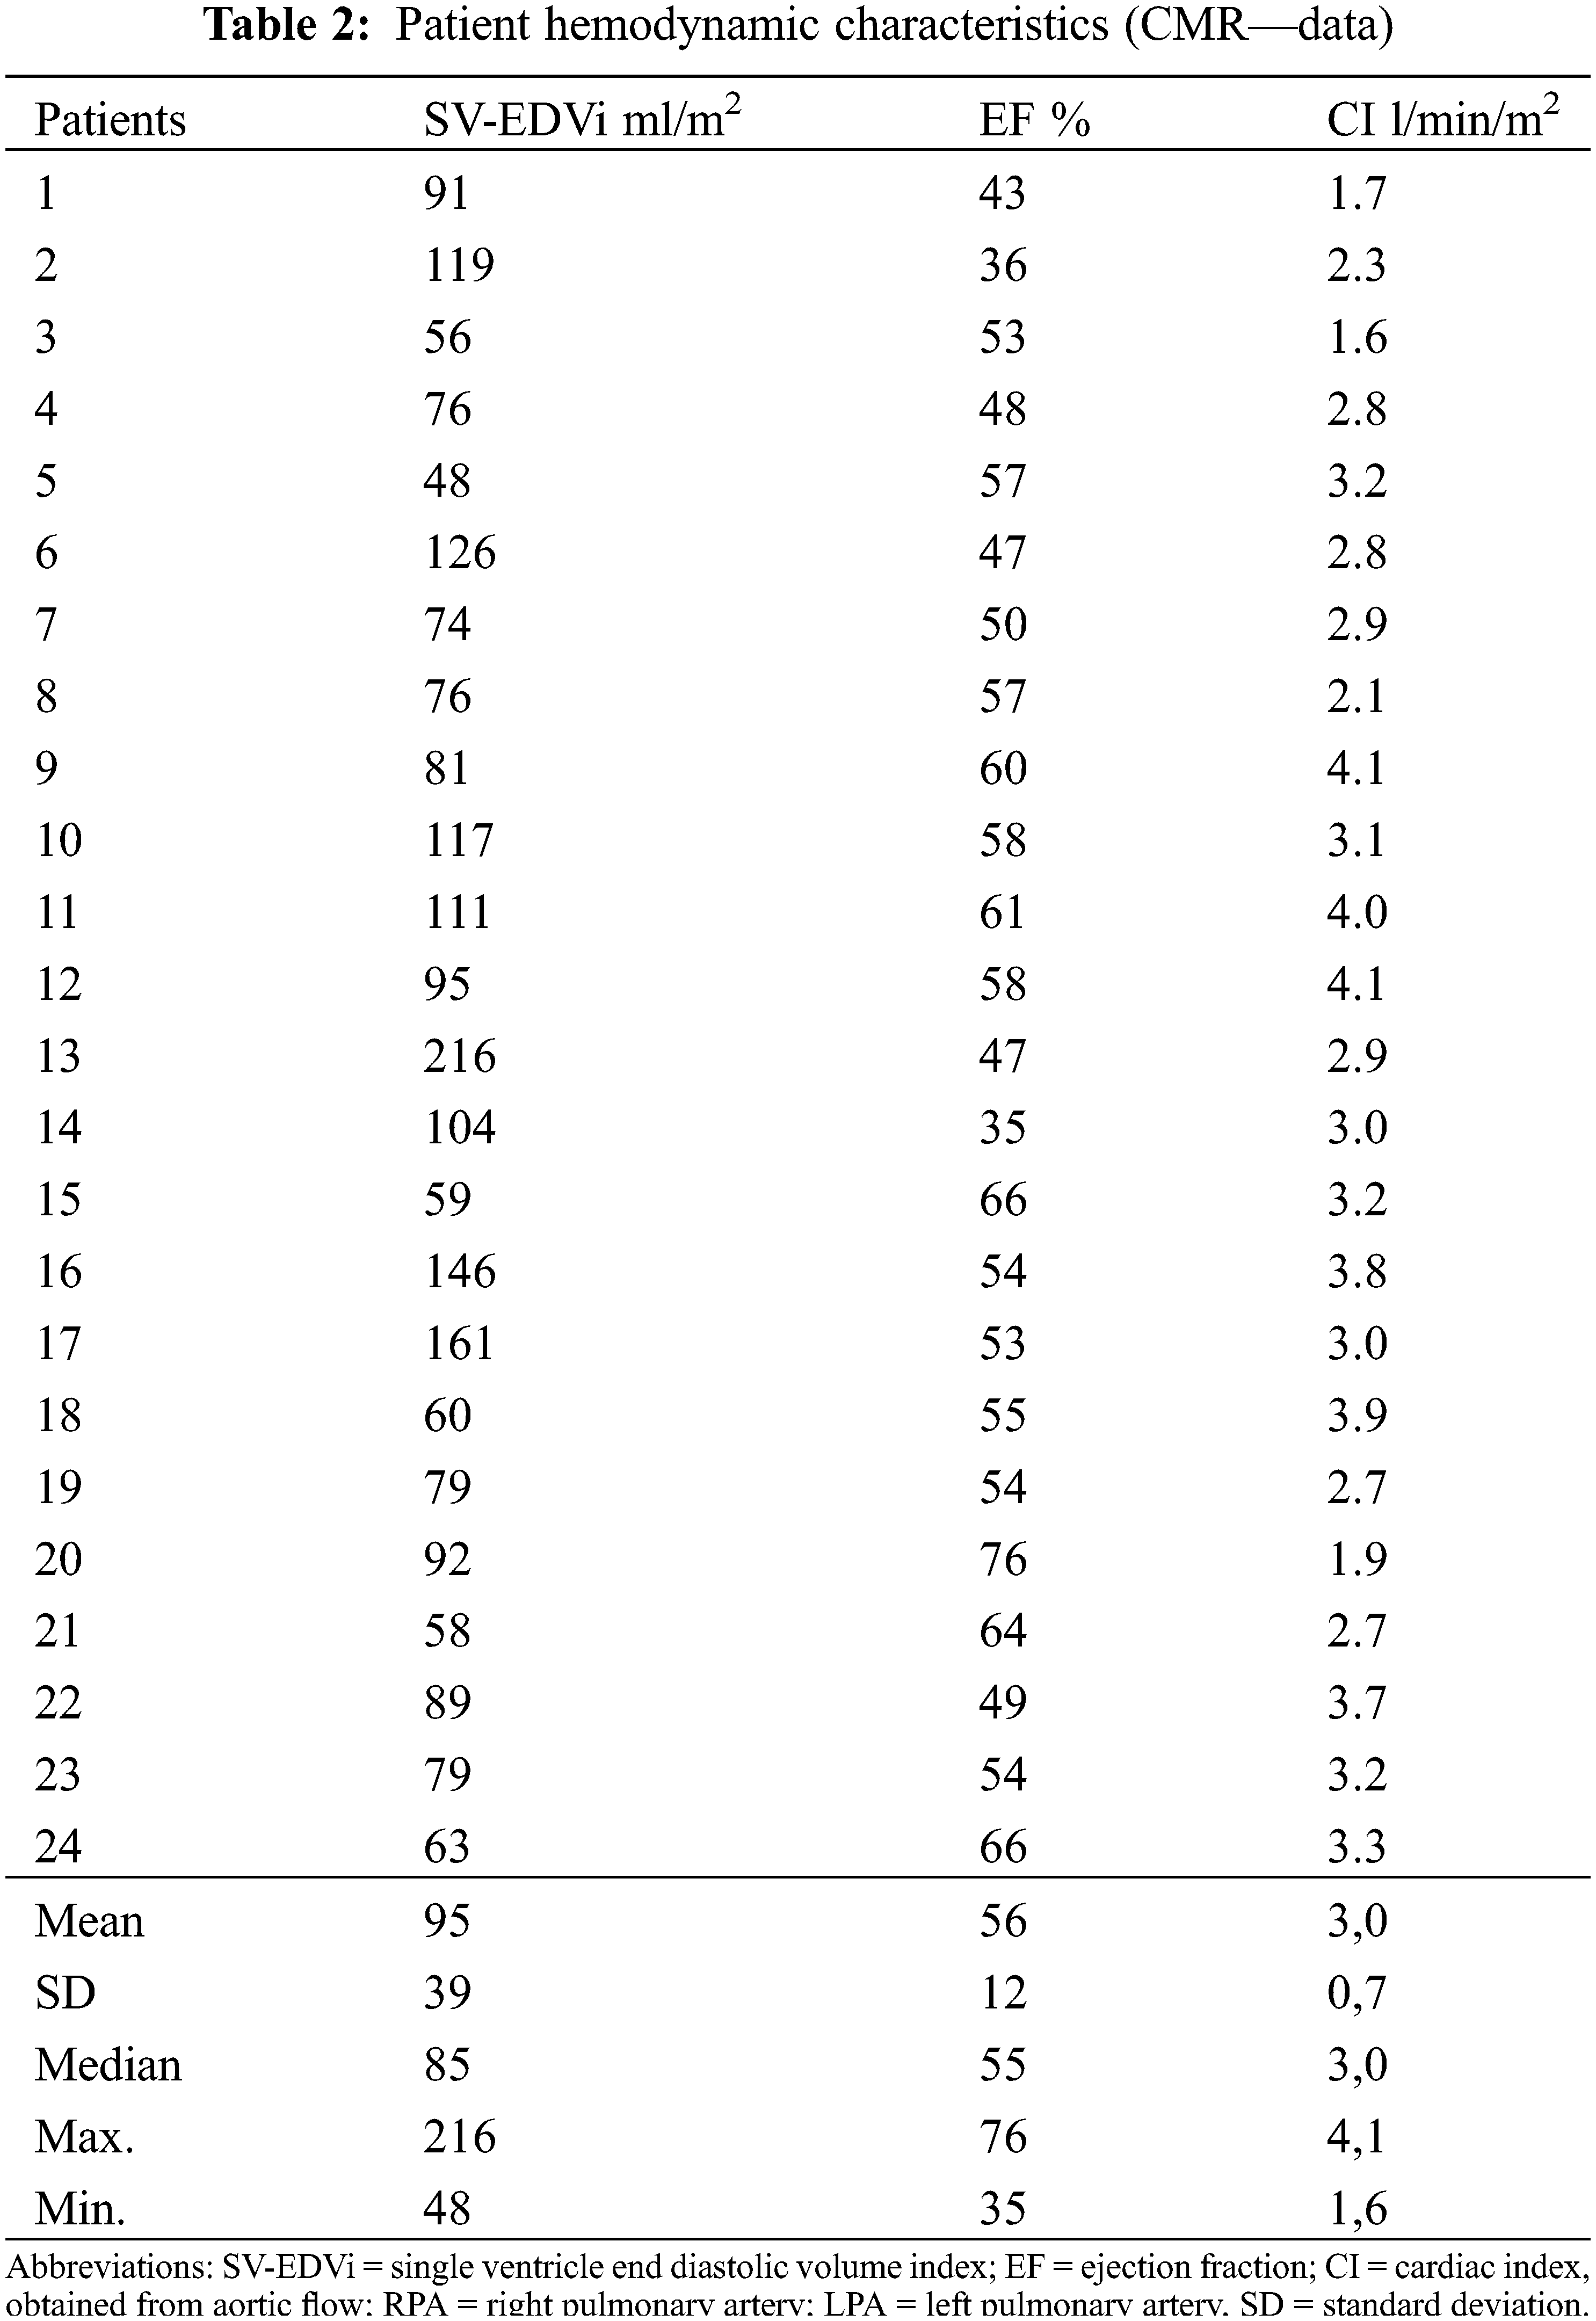
Ventricular dimension and function measured in cardiac magnetic resonance (CMR) are summarized in Table 2.
During cardiopulmonary exercise test maximum oxygen uptake (VO2max) was 65 ± 18% predicted normal in the adult patient group. In 5 patients under 18 years mean VO2max was 30.2 ± 8.2 ml/kg/min.
Maximum pressure differences between extracardiac tunnel and RPA/LPA and SVC and RPA/LPA are listed in Table 3.
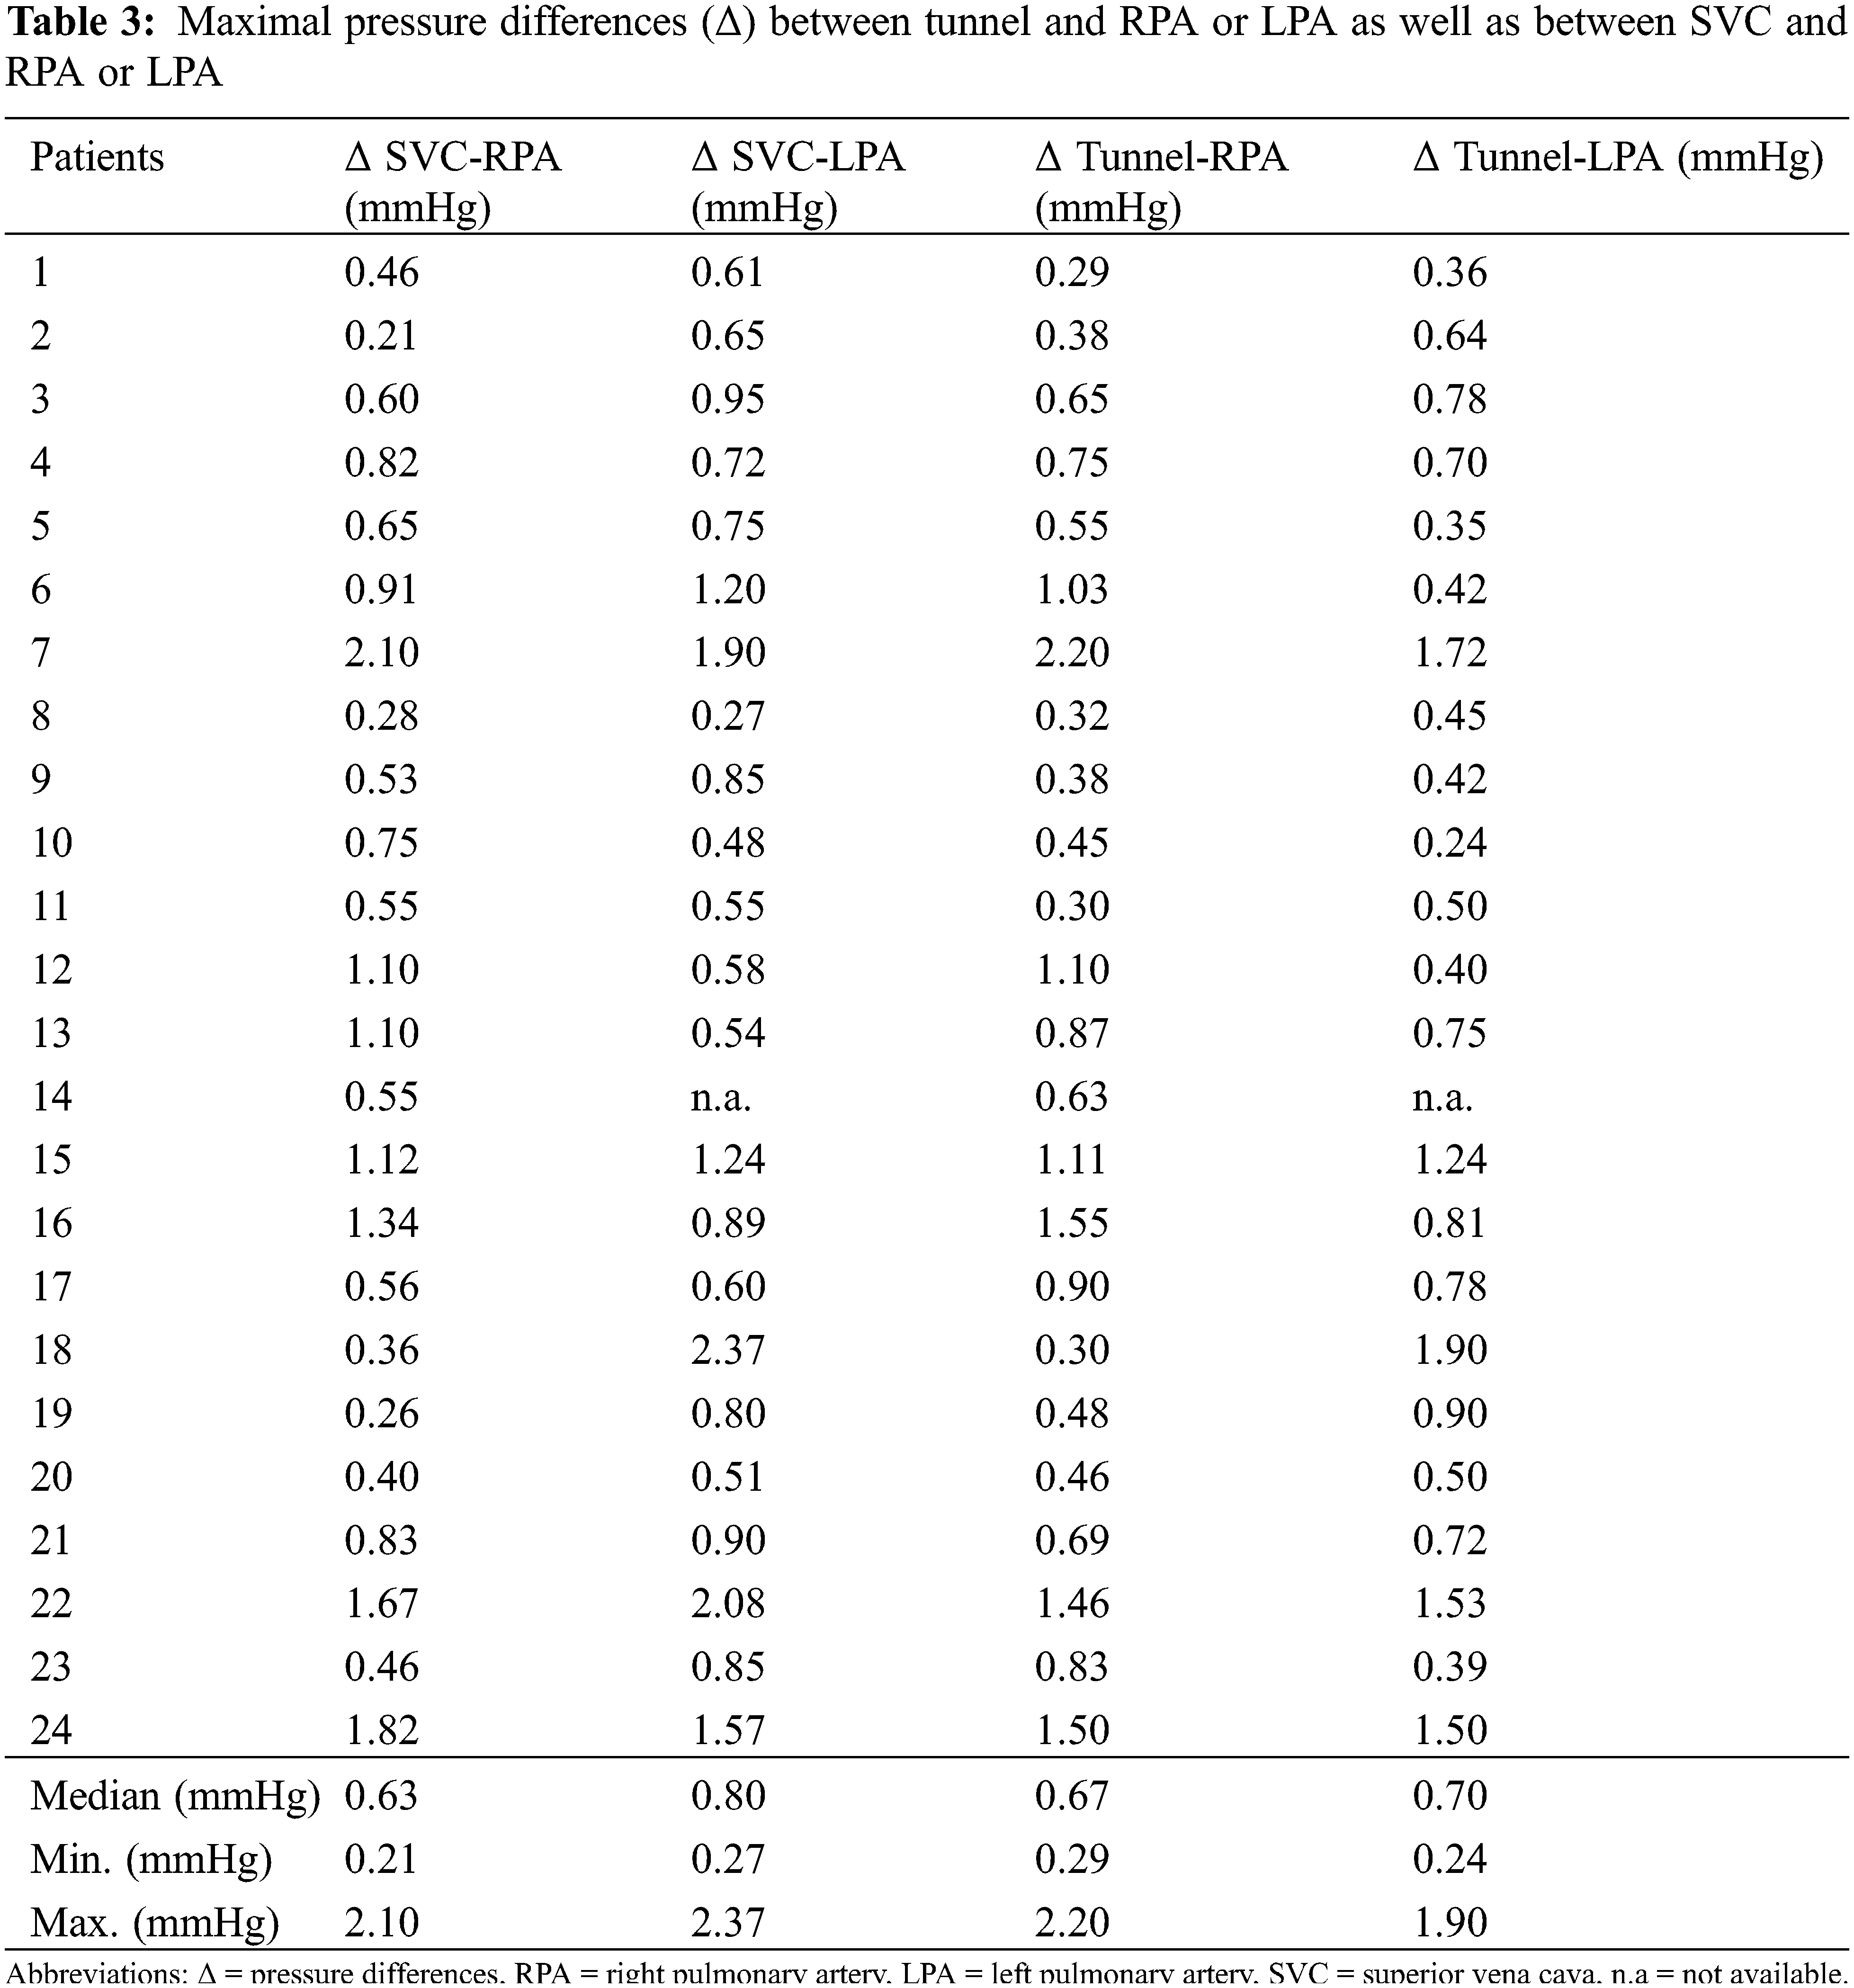
There was a small, but statistically significant pressure difference between the gradients along centerline tunnel-LPA and the centerline SVC-LPA (0.70 vs. 0.80 mm Hg, p = 0.0051). The remaining comparisons between gradients along the defined centerlines tunnel-RPA, tunnel-LPA, SVC-RPA, SVC-LPA did not prove to be statistically different (see Fig. 4).
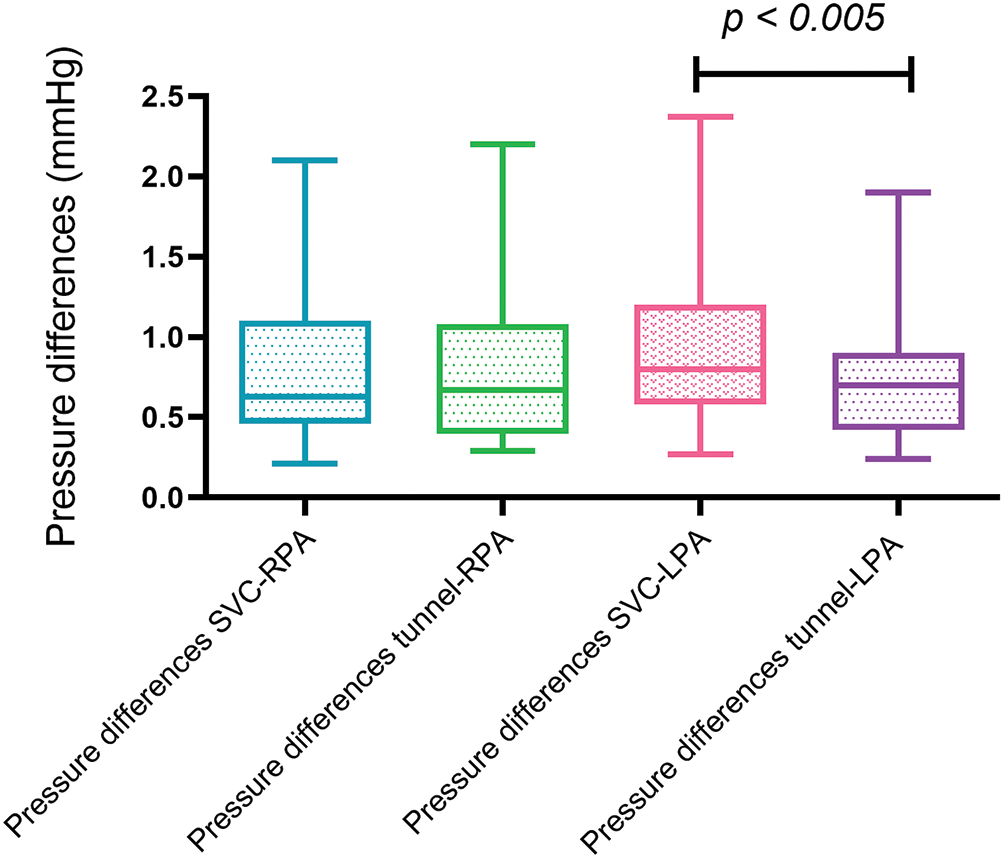
Figure 4: Box and whisker blots (Tukey) of maximal pressure differences along the predefined centerlines. (RPA = right pulmonary artery, LPA = left pulmonary artery, SVC = superior vena cava)
Maximal pressure differences of patients with and without potential flow obstruction along the centerline tunnel-LPA and SVC-LPA are shown in Fig. 5. Patients with potential flow obstruction had significantly higher pressure differences along tunnel-LPA (1.37 vs. 0.50 mmHg, p = 0.04) and along SVC-LPA (1.24 vs. 0.74 mmHg, p = 0.048) than patients without potential obstructions.
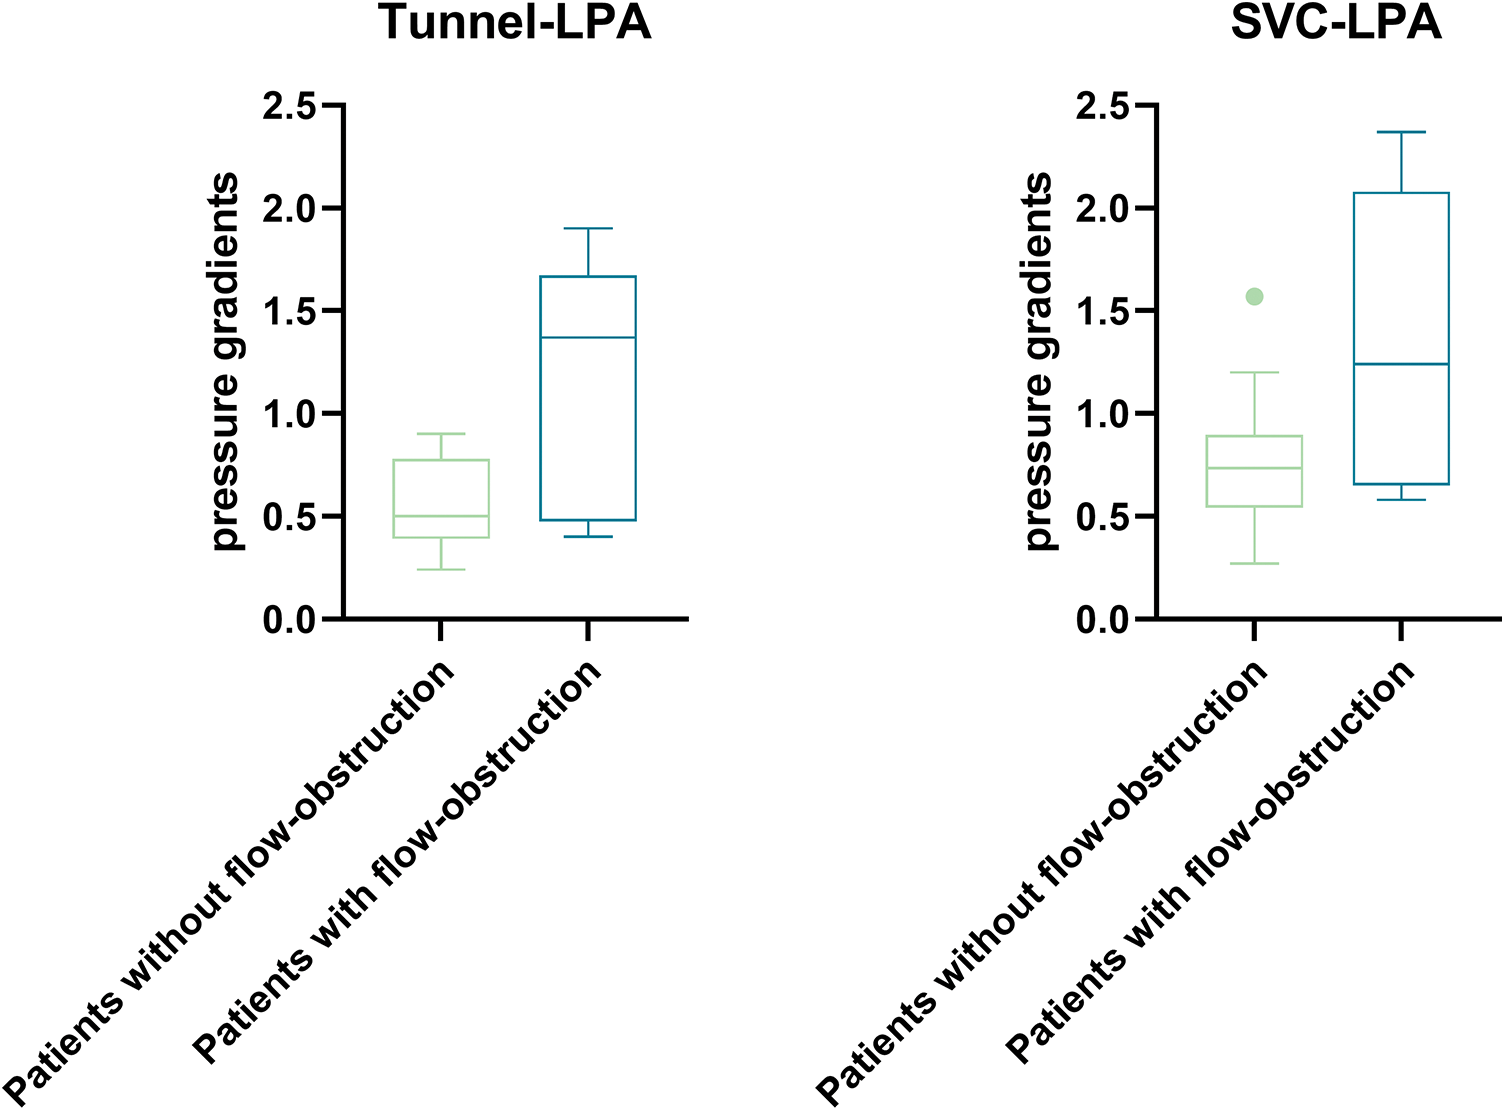
Figure 5: Box and whisker blot (Tukey) of maximal differences along the centerline tunnel—LPA (p = 0.04) between patients with (n = 8) and without (n = 15) potential flow obstruction and along the centerline SVC—LPA (p = 0.048) between patients with (n = 7) and without (n = 16) potential flow obstruction
In patient #14, LPA was lost due to thrombosis, consequently no pressure difference to LPA could be determined. In this patient we measured the pressure difference between the tunnel and the atrium through the fenestration (4 mmHg), which was in agreement with the pressure estimated in echocardiography (4–5 mmHg).
Comparison of CFD-based flow calculations in two representative patients with their measurement-based pressure differences showed good agreement regarding the pressure distribution patterns. The average difference between the 4D flow-based pressure differences values and CFD-based pressure differences was −0.1 mmHg (range −1.19 to 0.34 mmHg; number of measurements 12).
The pressure differences calculated with the Pressure-Poisson equation were on average 0.07 mmHg lower than those calculated assuming a non-Newtonian fluid. The difference was most pronounced in the tunnel—LPA anastomosis of case #18, where the difference amounted to 0.18 mmHg.
This study describes minor pressure differences, measured by 4D-flow MRI using Navier-Stokes and Pressure Poisson equations, along total cavopulmonary anastomoses in patients with modified Fontan operation. Cardiac MRI is nowadays widely accepted as the gold standard for anatomic and functional assessment of complex Fontan physiology and advanced 4D flow imaging allows assessment of advanced hemodynamic markers [22], such as pressure gradients. Our patients had fully satisfactory hemodynamic clinical status, therefore pressure differences over the anastomoses, measured by 4D-flow MRI were very small in the range of 0.2–2.37 mm Hg (median 0.72 mmHg). Registration of such low differences is well beyond the potential of pressure measurements in conventional cardiac catheterization. Fluid-filled catheters are subject to motion artifacts, biased by fluid inertia and typically measure pressure values, averaged over a sectional 3-dimensional vector field [9]. A pigtail catheter, used for routine cardiac catheterization, has typically a series of end catheter holes over approximately 2 cm. This type of catheter measures volume-averaged pressure signals, creating an uncertainty margin of 8.5 ± 5.7 mmHg [9]. Such pressure differences are far too high for the detection of small pressure differences at the anastomotic site in Fontan circulation, which can be responsible for a failing Fontan circulation (6–8).
Relative pressure differences were measured by 4D-flow MRI relating to values along a single centerline positioned at a well-defined distance from the vessel wall. This precaution reduces the variability of measurements secondary to non-laminar flow at the vessel borders. With this method, we were able to identify a small, but statistically significant difference in pressure gradients between SVC/LPA and tunnel/LPA. This option allows refined differentiation of favourable vs. unfavourable flow kinetics at the cavopulmonary anastomosis.
Our data show that the presence of minor obstructions, such as the presence of vortices, stents or occluders in the vessel wall, can induce small pressure differences in the Fontan circuit, which on the other hand can be detected by 4D-flow MRI. These minor pressure differences might cause relevant energy loss that invasive catheter-based measurements can not reliably capture. Indeed, Rijnberg et al. studied 26 patients with extracardiac Fontan with 4D-flow MRI and observed that vortical flow is associated with a viscous energy loss rate [23]. Its clinical relevance, however, remains to be determined.
4D-flow sequence prolongs the acquisition time of MRI examinations of patients with TCPC. Our protocol prolonged examination time by 7–12 min, depending on heart rate, which all patients well tolerated. The absence of dual VENC sequences for arterial and venous compartments limits the use of 4D-flow protocols to vessels with either venous or arterial velocities. Moreover, 4D-flow requires dedicated postprocessing software, which is not always available on MR consoles. Depending on the type of postprocessing software program and the number of measured sites, analysis needs another 10–20 min for the evaluation of flow and pressure differences. Therefore, implementation of 4D-flow in clinical routine requires extra time and purchase of additional software.
Computational flow dynamics both in flow phantoms [24–26] and patients [27] have demonstrated that the shape of the cavopulmonary anastomosis accounts for kinetic energy loss at the cavopulmonary anastomosis. Energy loss increases when pressure differences or stenoses are recorded at the cavopulmonary anastomosis [4]. The amount of energy loss correlates well with reduced exercise tolerance of patients with TCPC [28] and liver fibrosis/congestion [29]. Energy loss and resistance at the TCPC anastomosis gain even more importance during exercise, as the resistance increases exponentially under stress, when cardiac output increases [30]. Therefore, small gradients under resting conditions, as measured in our study by 4D-MRI, might gain clinical importance.
Pressure differences significantly impact in Fontan circulation, as no pumping chamber exists, such as the right ventricle. The flow through the circuit is determined by the overall resistance from the caval vein to the pulmonary veins [7]. Respiration affects the flow in Fontan circulation by increasing flow during inspiration and decreasing during expiration. This respiratory effect has been shown in various reports using MR flow measurements and Doppler echocardiography [31,32]. Although the amount of flow varies due to respiration, breathing affects pulsatility but not the net flow over time in the Fontan circulation [32]. This fact means that fixed stenoses can well be studied by flow measurements that disregard the respiratory influence. This strategy is also used during cardiac catheterization, where pressures are registered at end-expiration. Due to the aforementioned reasons, excluding respiratory influence does not affect detecting harmful flow patterns in the Fontan circulation.
To check the plausibility of the order of magnitude of our small 4D-MRI pressure difference values, we calculated CFD over the cavopulmonary anastomosis in two patients, showing an acceptable mean difference between the 4D flow-based and CFD-based pressure differences values of −0.1 mmHg. The error induced by using the Pressure-Poisson equation with a fix viscosity value was low.
Previous clinical studies have shown a good agreement between characterization of aortic pressure differences by means of 4D-MRI flow and invasive measurements in patients with aortic isthmus stenosis [33], but, to the best of our knowledge, there are no studies validating venous pressure differences by 4D-MRI flow in patients with TCPC. Studies, using computational fluid dynamics, however, strongly indicate reliable recordings of venous pressure differences in TCPC by 4D-flow MRI [4,5].
One limitation of this study is that no “golden standard” for measuring minor differences was available for comparison. Additionally, only pressure differences are given and not absolute pressure values, which are important in TCPC patients. However, indices exist that the low differences, registered by 4D-flow MRI, are reliable. The presence of vortices, detected by 4D-flow MRI particle tracking at the anastomosis, significantly increased pressure differences, measured by 4D-flow MRI. The same was true for a stent in the LPA or a wall adherent occluder in the extracardiac tunnel, both not showing any invasive pressure difference during the implantation procedure. These low differences fit well in understanding minor flow disturbances caused by these “obstacles”. At least in one patient (#14) with fenestrated tunnel 4D-flow MRI flow measured a pressure difference between the left atrium and tunnel at the shunt level, that was identical to what was estimated in echocardiography (4–5 mmHg).
The presence of metal artifacts represents another limitation due to stents, coils and devices in patients with Fontan circulation, which might result in poor imaging quality or even affect accuracy of pressure measurements. Measurements should be done away from metal. We performed 4D-flow MRI only in patients with short stents or occluders, providing space to measure in regions without artefacts.
4D-flow MRI can detect minor pressure differences within the Fontan circuit that are generally missed by routine invasive measurements during cardiac catheterization. Therefore, 4D-flow MRI may offer a more sensitive tool for detecting sources of energy loss within the Fontan circulation, even in patients with apparently satisfactory TCPC anatomy. The clinical relevance of this finding has to be determined. Future studies should focus on the clinical relevance of these minor pressure differences and in patients with failing Fontan circuits, in whom no apparent reason for failure can be found.
Acknowledgement: Not applicable.
Funding Statement: This work was supported by Deutsche Herzstiftung e.V.
Author Contributions: H.S., N.S. and C.M. were involved in study conception and design. H.S. and N.S. performed and post-processed CMR examinations. C.M. and N.S. performed statistical analysis. A.H., M.H., P.Y. performed CFD. H.S. and N.S. wrote the first draft of the manuscript. All authors reviewed the results and approved the final version of the manuscript.
Availability of Data and Materials: The datasets generated during and/or analysed during the current study are available from the corresponding author on reasonable request.
Ethics Approval: Approval was granted by the Ethics Committee of Technical University of Munich. The committee’s reference number is 102/17S. Informed consent was obtained from all the patients.
Conflicts of Interest: The authors declare that they have no conflicts of interest to report regarding the present study.
References
1. de Leval, M. R., Kilner, P., Gewillig, M., Bull, C. (1988). Total cavopulmonary connection: A logical alternative to atriopulmonary connection for complex Fontan operations. Experimental studies and early clinical experience. The Journal of Thoracic and Cardiovascular Surgery, 96(5), 682–695. https://www.ncbi.nlm.nih.gov/pubmed/3184963 [Google Scholar] [PubMed]
2. Van Haesdonck, J. M., Mertens, L., Sizaire, R., Montas, G., Purnode, B. et al. (1995). Comparison by computerized numeric modeling of energy losses in different Fontan connections. Circulation, 92(9 Suppl), 322–326. https://doi.org/10.1161/01.CIR.92.9.322 [Google Scholar] [PubMed] [CrossRef]
3. Honda, T., Itatani, K., Takanashi, M., Mineo, E., Kitagawa, A. et al. (2014). Quantitative evaluation of hemodynamics in the Fontan circulation: A cross-sectional study measuring energy loss in vivo. Pediatric Cardiology, 35(2), 361–367. https://doi.org/10.1007/s00246-013-0783-4 [Google Scholar] [PubMed] [CrossRef]
4. Pekkan, K., Kitajima, H. D., de Zelicourt, D., Forbess, J. M., Parks, W. J. et al. (2005). Total cavopulmonary connection flow with functional left pulmonary artery stenosis: Angioplasty and fenestration in vitro. Circulation, 112(21), 3264–3271. https://doi.org/10.1161/CIRCULATIONAHA.104.530931 [Google Scholar] [PubMed] [CrossRef]
5. Zhu, F., Shi, G., Wen, C., Zhang, Q., Fu, Q. et al. (2020). Hemodynamic effects of a simplified venturi conduit for Fontan circulation: A pilot, in silico analysis. Scientific Reports, 10(1), 817. https://doi.org/10.1038/s41598-020-57634-2 [Google Scholar] [PubMed] [CrossRef]
6. Deal, B. J., Jacobs, M. L. (2012). Management of the failing Fontan circulation. Heart, 98(14), 1098–1104. https://doi.org/10.1136/heartjnl-2011-301133 [Google Scholar] [PubMed] [CrossRef]
7. Gewillig, M., Brown, S. C., van de Bruaene, A., Rychik, J. (2020). Providing a framework of principles for conceptualising the Fontan circulation. Acta Paediatrica, 109(4), 651–658. https://doi.org/10.1111/apa.15098 [Google Scholar] [PubMed] [CrossRef]
8. Lee, N., Taylor, M. D., Hor, K. N., Banerjee, R. K. (2013). Non-invasive evaluation of energy loss in the pulmonary arteries using 4D phase contrast MR measurement: A proof of concept. BioMedical Engineering OnLine, 12(1), 93. https://doi.org/10.1186/1475-925X-12-93 [Google Scholar] [PubMed] [CrossRef]
9. Goubergrits, L., Hellmeier, F., Neumann, D., Mihalef, V., Gulsun, M. A. et al. (2019). Patient-specific requirements and clinical validation of MRI-based pressure mapping: A two-center study in patients with aortic coarctation. Journal of Magnetic Resonance Imaging, 49(1), 81–89. https://doi.org/10.1002/jmri.26230 [Google Scholar] [PubMed] [CrossRef]
10. Bock, J., Frydrychowicz, A., Lorenz, R., Hirtler, D., Barker, A. J. et al. (2011). In vivo noninvasive 4D pressure difference mapping in the human aorta: Phantom comparison and application in healthy volunteers and patients. Journal of Magnetic Resonance Imaging, 66(4), 1079–1088. https://doi.org/10.1002/mrm.22907 [Google Scholar] [PubMed] [CrossRef]
11. Meier, S., Hennemuth, A., Friman, O., Markl, M., Preusser, T. (2010). Noninvasive 4D blood flow and pressure quantification in central blood vessels via PCMRI. OnLine Archives of Computing in Cardiology, 37, 903–906. [Google Scholar]
12. Markl, M., Harloff, A., Bley, T. A., Zaitsev, M., Jung, B. et al. (2007). Time-resolved 3D MR velocity mapping at 3T: Improved navigator-gated assessment of vascular anatomy and blood flow. Journal of Magnetic Resonance Imaging, 25(4), 824–831. https://doi.org/10.1002/jmri.20871 [Google Scholar] [PubMed] [CrossRef]
13. Stankovic, Z., Allen, B. D., Garcia, J., Jarvis, K. B., Markl, M. (2014). 4D flow imaging with MRI. Cardiovascular Diagnosis and Therapy, 4(2), 173–192. https://doi.org/10.3978/j.issn.2223-3652.2014.01.02 [Google Scholar] [PubMed] [CrossRef]
14. Riesenkampff, E., Fernandes, J. F., Meier, S., Goubergrits, L., Kropf, S. et al. (2014). Pressure fields by flow-sensitive, 4D, velocity-encoded CMR in patients with aortic coarctation. JACC: Cardiovascular Imaging, 7(9), 920–926. https://doi.org/10.1016/j.jcmg.2014.03.017 [Google Scholar] [PubMed] [CrossRef]
15. Zimmermann, J., Demedts, D., Mirzaee, H., Ewert, P., Stern, H. et al. (2018). Wall shear stress estimation in the aorta: Impact of wall motion, spatiotemporal resolution, and phase noise. Journal of Magnetic Resonance Imaging, 48(3), 718–728. https://doi.org/10.1002/jmri.26007 [Google Scholar] [PubMed] [CrossRef]
16. Krittian, S. B., Lamata, P., Michler, C., Nordsletten, D. A., Bock, J. et al. (2012). A finite-element approach to the direct computation of relative cardiovascular pressure from time-resolved MR velocity data. Medical Image Analysis, 16(5), 1029–1037. https://doi.org/10.1016/j.media.2012.04.003 [Google Scholar] [PubMed] [CrossRef]
17. Tyszka, J. M., Laidlaw, D. H., Asa, J. W., Silverman, J. M. (2000). Three-dimensional, time-resolved (4D) relative pressure mapping using magnetic resonance imaging. Journal of Magnetic Resonance Imaging, 12(2), 321–329. https://doi.org/10.1002/1522-2586(200008)12:2<321::aid-jmri15>3.0.co;2-2 [Google Scholar] [PubMed] [CrossRef]
18. Lum, D. P., Johnson, K. M., Paul, R. K., Turk, A. S., Consigny, D. W. et al. (2007). Transstenotic pressure gradients: Measurement in swine—Retrospectively ECG-gated 3D phase-contrast MR angiography versus endovascular pressure-sensing guidewires. Radiology, 245(3), 751–760. https://doi.org/10.1148/radiol.2453061946 [Google Scholar] [PubMed] [CrossRef]
19. Meier, S., Hennemuth, A., Drexl, J., Bock, J., Jung, B. et al. (2013). A fast and noise-robust method for computation of intravascular pressure difference maps from 4D PC-MRI data. In: Camara, O., Mansi, T., Pop, M., Rhode, K., Sermesant, M. et al. (Eds.Statistical atlases and computational models of the heart. imaging and modelling challenges, pp. 215–224. Berlin, Heidelberg: Springer. https://doi.org/10.1007/978-3-642-36961-2_25 [Google Scholar] [CrossRef]
20. Cheng, A. L., Wee, C. P., Pahlevan, N. M., Wood, J. C. (2019). A 4D flow MRI evaluation of the impact of shear-dependent fluid viscosity on in vitro Fontan circulation flow. American Journal of Physiology-Heart and Circulatory, 317(6), H1243–H1253. https://doi.org/10.1152/ajpheart.00296.2019 [Google Scholar] [PubMed] [CrossRef]
21. Wei, Z., Singh-Gryzbon, S., Trusty, P. M., Huddleston, C., Zhang, Y. et al. (2020). Non-newtonian effects on patient-specific modeling of Fontan hemodynamics. Annals of Biomedical Engineering, 48(8), 2204–2217. https://doi.org/10.1007/s10439-020-02527-8 [Google Scholar] [PubMed] [CrossRef]
22. Puricelli, F., Voges, I., Gatehouse, P., Rigby, M., Izgi, C. et al. (2022). Performance of cardiac MRI in pediatric and adult patients with Fontan circulation. Radiology: Cardiothoracic Imaging, 4(3), e210235. https://doi.org/10.1148/ryct.210235 [Google Scholar] [PubMed] [CrossRef]
23. Rijnberg, F. M., Juffermans, J. F., Hazekamp, M. G., Helbing, W. A., Lamb, H. J. et al. (2021). Segmental assessment of blood flow efficiency in the total cavopulmonary connection using four-dimensional flow magnetic resonance imaging: Vortical flow is associated with increased viscous energy loss rate. European Heart Journal Open, 1(2), oeab018. https://doi.org/10.1093/ehjopen/oeab018 [Google Scholar] [PubMed] [CrossRef]
24. de Zelicourt, D. A., Pekkan, K., Wills, L., Kanter, K., Forbess, J. et al. (2005). In vitro flow analysis of a patient-specific intraatrial total cavopulmonary connection. The Annals of Thoracic Surgery, 79(6), 2094–2102. https://doi.org/10.1016/j.athoracsur.2004.12.052 [Google Scholar] [PubMed] [CrossRef]
25. Pekkan, K., de Zelicourt, D., Ge, L., Sotiropoulos, F., Frakes, D. et al. (2005). Physics-driven CFD modeling of complex anatomical cardiovascular flows-a TCPC case study. Annals of Biomedical Engineering, 33(3), 284–300. https://doi.org/10.1007/s10439-005-1731-0 [Google Scholar] [PubMed] [CrossRef]
26. Sharma, S., Goudy, S., Walker, P., Panchal, S., Ensley, A. et al. (1996). In vitro flow experiments for determination of optimal geometry of total cavopulmonary connection for surgical repair of children with functional single ventricle. Journal of the American College of Cardiology, 27(5), 1264–1269. https://doi.org/10.1016/0735-1097(95)00598-6 [Google Scholar] [PubMed] [CrossRef]
27. Rijnberg, F. M., Hazekamp, M. G., Wentzel, J. J., de Koning, P. J. H., Westenberg, J. J. M. et al. (2018). Energetics of blood flow in cardiovascular disease: Concept and clinical implications of adverse energetics in patients with a Fontan circulation. Circulation, 137(22), 2393–2407. https://doi.org/10.1161/CIRCULATIONAHA.117.033359 [Google Scholar] [PubMed] [CrossRef]
28. Khiabani, R. H., Whitehead, K. K., Han, D., Restrepo, M., Tang, E. et al. (2015). Exercise capacity in single-ventricle patients after Fontan correlates with haemodynamic energy loss in TCPC. Heart, 101(2), 139–143. https://doi.org/10.1136/heartjnl-2014-306337 [Google Scholar] [PubMed] [CrossRef]
29. Rijnberg, F. M., Westenberg, J. J. M., van Assen, H. C., Juffermans, J. F., Kroft, L. J. M. et al. (2022). 4D flow cardiovascular magnetic resonance derived energetics in the Fontan circulation correlate with exercise capacity and CMR-derived liver fibrosis/congestion. Journal of Cardiovascular Magnetic Resonance, 24(1), 21. https://doi.org/10.1186/s12968-022-00854-4 [Google Scholar] [PubMed] [CrossRef]
30. Whitehead, K. K., Pekkan, K., Kitajima, H. D., Paridon, S. M., Yoganathan, A. P. et al. (2007). Nonlinear power loss during exercise in single-ventricle patients after the Fontan: Insights from computational fluid dynamics. Circulation, 116(11 Suppl), 165–171. https://doi.org/10.1161/CIRCULATIONAHA.106.680827 [Google Scholar] [PubMed] [CrossRef]
31. Penny, D. J., Redington, A. N. (1991). Doppler echocardiographic evaluation of pulmonary blood flow after the Fontan operation: The role of the lungs. British Heart Journal, 66(5), 372–374. https://doi.org/10.1136/hrt.66.5.372 [Google Scholar] [PubMed] [CrossRef]
32. van der Woude, S. F. S.,Rijnberg, F. M., Hazekamp, M. G., Jongbloed, M. R. M., Kenjeres, S. et al. (2021). The influence of respiration on blood flow in the Fontan circulation: Insights for imaging-based clinical evaluation of the total cavopulmonary connection. Frontiers in Cardiovascular Medicine, 8, 683849. https://doi.org/10.3389/fcvm.2021.683849 [Google Scholar] [PubMed] [CrossRef]
33. Rengier, F., Delles, M., Eichhorn, J., Azad, Y. J., von Tengg-Kobligk, H. et al. (2015). Noninvasive 4D pressure difference mapping derived from 4D flow MRI in patients with repaired aortic coarctation: Comparison with young healthy volunteers. The International Journal of Cardiovascular Imaging, 31(4), 823–830. https://doi.org/10.1007/s10554-015-0604-3 [Google Scholar] [PubMed] [CrossRef]
Cite This Article
 Copyright © 2023 The Author(s). Published by Tech Science Press.
This work is licensed under a Creative Commons Attribution 4.0 International License , which permits unrestricted use, distribution, and reproduction in any medium, provided the original work is properly cited.
 Downloads
 Citation Tools