
 Submit a Paper
 Propose a Special lssue
 Open Access
ARTICLE

Comparison of QT Correction Methods in the Pediatric Population of a Community Hospital: A Retrospective Study
1 Department of Pediatrics, New York Presbyterian Brooklyn Methodist Hospital, Brooklyn, 11215, USA
2 Department of Population Health Sciences, Division of Biostatistics, Weill Cornell Medicine, New York, 10065, USA
* Corresponding Author: Koren Hyogene Kwag. Email:
Congenital Heart Disease 2024, 19(1), 107-121. https://doi.org/10.32604/chd.2024.045953
Received 12 September 2023; Accepted 01 February 2024; Issue published 20 March 2024
 View Full Text
 Download PDF
Abstract
Objective: Accurate measurement of QT interval, the ventricular action potential from depolarization to repolarization, is important for the early detection of Long QT syndrome. The most effective QT correction (QTc) formula has yet to be determined in the pediatric population, although it has intrinsically greater extremes in heart rate (HR) and is more susceptible to errors in measurement. The authors of this study compare six different QTc methods (Bazett, Fridericia, Framingham, Hodges, Rautaharju, and a computer algorithm utilizing the Bazett formula) for consistency against variations in HR and RR interval. Methods: Descriptive Retrospective Study. We included participants from a pediatric cardiology practice of a community hospital who had an ECG performed in 2017. All participants were healthy patients with no past medical history and no regular medications. Results: ECGs from 95 participants from one month to 21 years of age (mean 9.7 years) were included with a mean HR of 91 beats per minute (bpm). The two-sample paired t-test or Wilcoxon signed-rank test assessed for any difference between QTc methods. A statistically significant difference was observed between every combination of two QTc formulae. The Spearman’s rank correlation analysis explored the QTc/HR and QTc/RR relationships for each formula. Fridericia method was most independent of HR and RR with the lowest absolute value of correlation coefficients. Bazett and Computer had moderate correlations, while Framingham and Rautaharju exhibited strong correlations. Correlations were positive for Bazett and Computer, reflecting results from prior studies demonstrating an over-correction of Bazett at higher HRs. In the linear QTc/HR regression analysis, Bazett had the slope closest to zero, although Computer, Hodges, and Fridericia had comparable values. Alternatively, Fridericia had the linear QTc/RR regression coefficient closest to zero. The Bland-Altman method assessed for bias and the limits of agreement between correction formulae. Bazett and Computer exhibited good agreement with minimal bias along with Framingham and Rautaharju. To account for a possible skewed distribution of QT, all the above analyses were also performed excluding the top and bottom 2% of data as sorted by heart rate ranges (N = 90). Results from this data set were consistent with those derived from all participants (N = 95). Conclusions: Overall, the Fridericia correction method provided the best rate correction in our pediatric study cohort.Keywords
The QT interval represents the ventricular action potential from depolarization to repolarization [1]. Long QT Syndrome (LQTS) is both an acquired and inherited arrhythmia disorder characterized by a prolonged QT interval. The disorder can clinically manifest with syncope, palpitations, and in severe cases sudden cardiac arrest due to Torsade de Pointes [2]. Over 17 genes contributing to ion-channel function have been implicated in congenital LQTS [2–4]. Accuracy of QT measurement, therefore, is imperative for the early detection of LQTS and initiation of appropriate therapy to prevent morbidity and mortality. As QT interval is strongly affected by heart rate (HR), several formulae have been proposed to correct for this relationship. The ideal formula would eliminate any relationship between HR (or RR interval on ECG) and the corrected QT interval (QTc).
Bazett and Fridericia describe an exponential relationship between QT vs. RR or HR [5,6]. Bazett developed a formula estimating the duration of systole with varying pulse rates from a study of 39 subjects, which was later adapted to relate QT prolongation to acute rheumatic carditis in children [5,7,8]. Fridericia proposed a relationship between the duration of ventricular repolarization (QT) and pulse period (RR) through a study of 50 subjects with a cutoff of 430 milliseconds (ms) as the definition of prolonged [9]. On the other hand, Framingham, Hodges, and Rautaharju suggested a linear relationship between QT vs. RR or HR [10]. The Framingham formula integrated data from 5,018 subjects with a median age of 44 years comprising the Framingham Heart Study to create a linear regression model for correcting QT according to RR cycle length [10]. In response to the discrepancies identified with the non-linear Bazett and Fridericia formulae, Hodges developed a linear QTc formula from a study of 607 subjects [11]. Rautaharju, a newer formula, derived from 57,595 patients ranging from five to 89 years of age with a cutoff of 477 ms; Rautaharju additionally introduced a sex coefficient to account for observed differences in QT duration by sex [12].
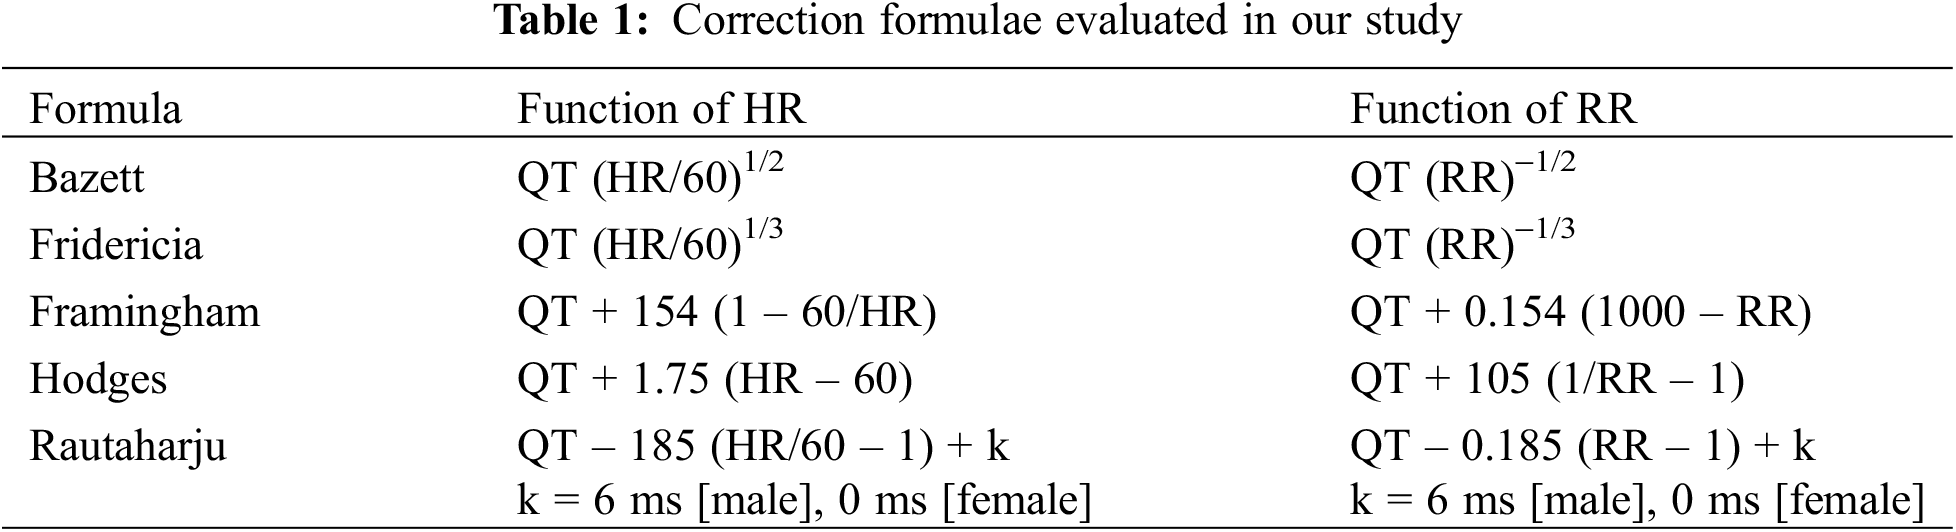
The parameters of each formula are detailed in Table 1. Across all formulae, QTc is equivalent to QT at a HR of 60 bpm (frequency of 1 Hz) [13].
Both intra-subject [14,15] and inter-subject [16,17] differences in QTc/HR patterns have been demonstrated. Although the robustness of different QTc formulae against intra-subject and inter-subject variations in HR has been well-explored in adults, it has been less examined in the pediatric population that has intrinsically greater extremes of HR and is more susceptible to errors in QT measurement. Our study aims to determine which formula provides the best rate correction within the pediatric population and to assess if the computer-algorithm utilized by our ECG machine is a reliable method of QT correction compared to manual calculation.
This is a descriptive retrospective study. We included patients in the pediatric cardiology practice of a community hospital who had an ECG performed in the year 2017. We reviewed the age, sex, past medical history, and relevant medications of each participant. We excluded all participants with a past medical history (including cardiovascular disease) as well as those on regular medications. Only the first ECG was retained for each participant. The demographic and ECG parameters associated with each participant may be available upon request. We examined the ECGs for rhythm, HR, QT, RR, and QRS intervals. ECGs with missing leads or excessive noise were removed, along with those with a QRS duration above 120 ms and those not in sinus rhythm. Participant demographics were evaluated using mean and standard deviation (SD) for continuous variables, and frequency and percent for categorical variables. We calculated the QTc interval using the Bazett, Fridericia, Framingham, Hodges, and Rautaharju formulae as well as the computer algorithm. The MarquetteTM 12SLTM ECG Analysis Program was utilized for the computer calculation of QTc, which reports the Bazett-corrected measurement of QTc [18].
The overall cohort is described through descriptive statistics. Wilcoxon rank sum test compared clinical characteristics and QTc values between male and female participants. Spearman’s rank correlation tests evaluated for potential correlations between two variables. Two-sample paired t-test or Wilcoxon signed-rank test, as appropriate, assessed for potential differences between every combination of two QTc methods, with p-values adjusted according to the Benjamini-Hochberg method. Separate univariate linear regression models determined potential associations between QTc measurements and HR or RR. Bland-Altman Plots evaluated for agreement between two QTc formulae.
All analyses were also performed by excluding the top and bottom 2% of the data as sorted by HR ranges according to the method adopted by Luo et al. [19]. This group adopted the top and bottom 2% of data instead of the traditional mean ± 2 SD to demarcate the upper and lower normal limits of QTc distributions for each formula on the basis that the characteristics of QT distributions are not clear, possibly following a skewed distribution [20].
All p-values are two-sided with statistical significance evaluated at the 0.05 alpha level. All analyses were performed in R Version 4.1.2 (The R Foundation for Statistical Computing).
This study was reviewed and approved by the Institutional Review Board at the New York Presbyterian Brooklyn Methodist Hospital (IRB number 1792968).
A total of 95 participants were eligible for inclusion in our study. Descriptive statistics are presented as mean ± SD. There were no congenital heart defects among these participants. Our participant population included infants and children from ages one month to 21 years, with a mean age of 9.7 years (SD 6.4) (Table 2). Mean HR was 91 bpm (SD 29), mean RR interval was 717 ms (SD 205), and mean QT interval was 349 ms (SD 44) (Table 2).
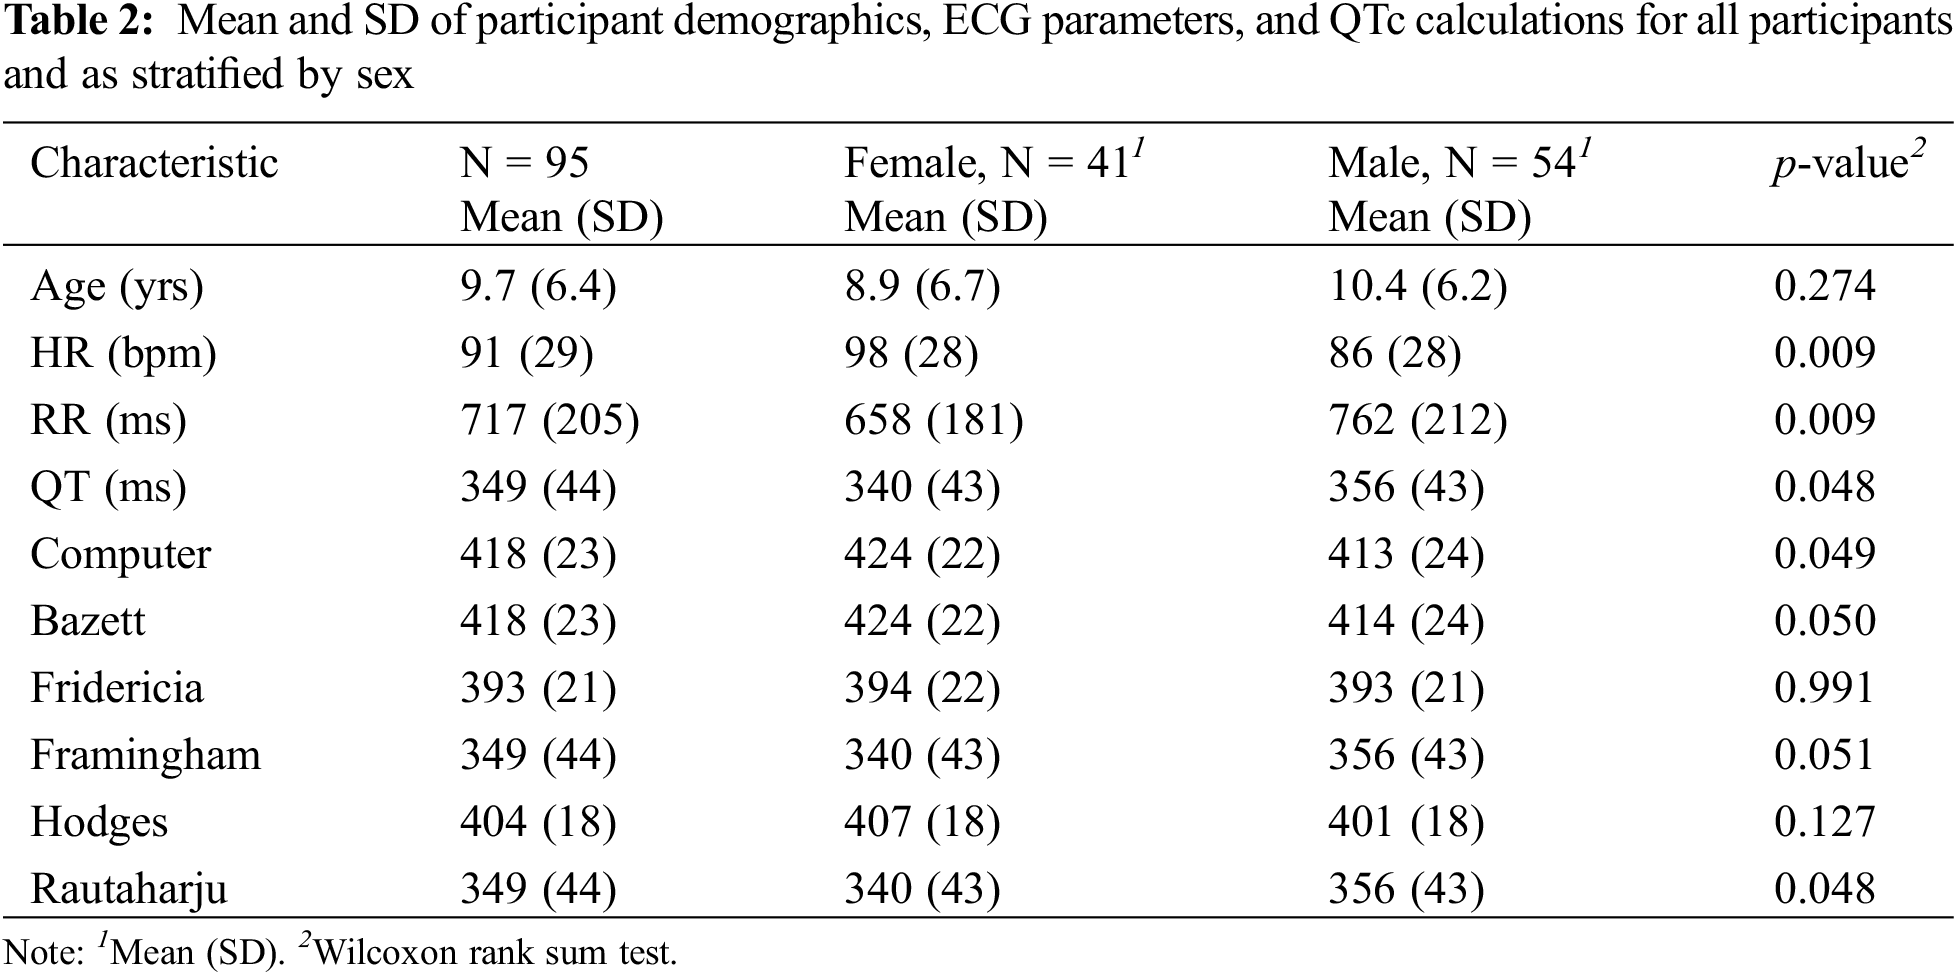
Bazett and Computer had the highest mean QTc of 418 ± 23 ms (Table 2). Framingham and Rautaharju had the lowest mean of 349 ± 44 ms, which was also equal to the uncorrected QT. Adopting the definition for prolonged QTc as >440 ms in males or >460 ms in females [21], 10 participants in our cohort would have been falsely identified as having a prolonged QTc according to Bazett, compared to nine in Computer and none in the remaining formulae. The HR of individuals identified with a prolonged QTc varied from 75 to 123 bpm. According to literature, Bazett formula is considered to be accurate for HRs between 60 to 100 bpm, with a tendency to over-correct at HRs > 100 bpm and under-correct at HRs < 60 bpm [22]. Computer (SD = 23 ms), Bazett (23 ms), Fridericia (21 ms), and Hodges (18 ms) all led to decreases in SD compared to uncorrected QT (44 ms), indicating a reduced variability in QTc. SD was unchanged for Framingham (44 ms) and Rautaharju (44 ms). If the threshold for QTc prolongation is set as 2 SD from the mean, Computer and Bazett would require a QTc value > 464 ms for the diagnosis of prolonged QT, Hodges > 440 ms, Framingham and Rautaharju > 438 ms, and Fridericia > 435 ms.
In our study cohort, 43% of participants were female, while 57% were male. Comparisons between females and males were based on a Wilcoxon rank sum test. A statistically significant difference was observed between males and females for the following parameters: HR, RR, uncorrected QT, Computer, and Rautaharju (Table 2). Discrepancies in HR, RR, and uncorrected QT may attribute to the small sample size of our study, differences in the age distribution of females vs. males, or physiological differences between the sexes.
3.2 Associations between QTc Formulae
3.2.1 Spearman’s Rank Correlation Tests
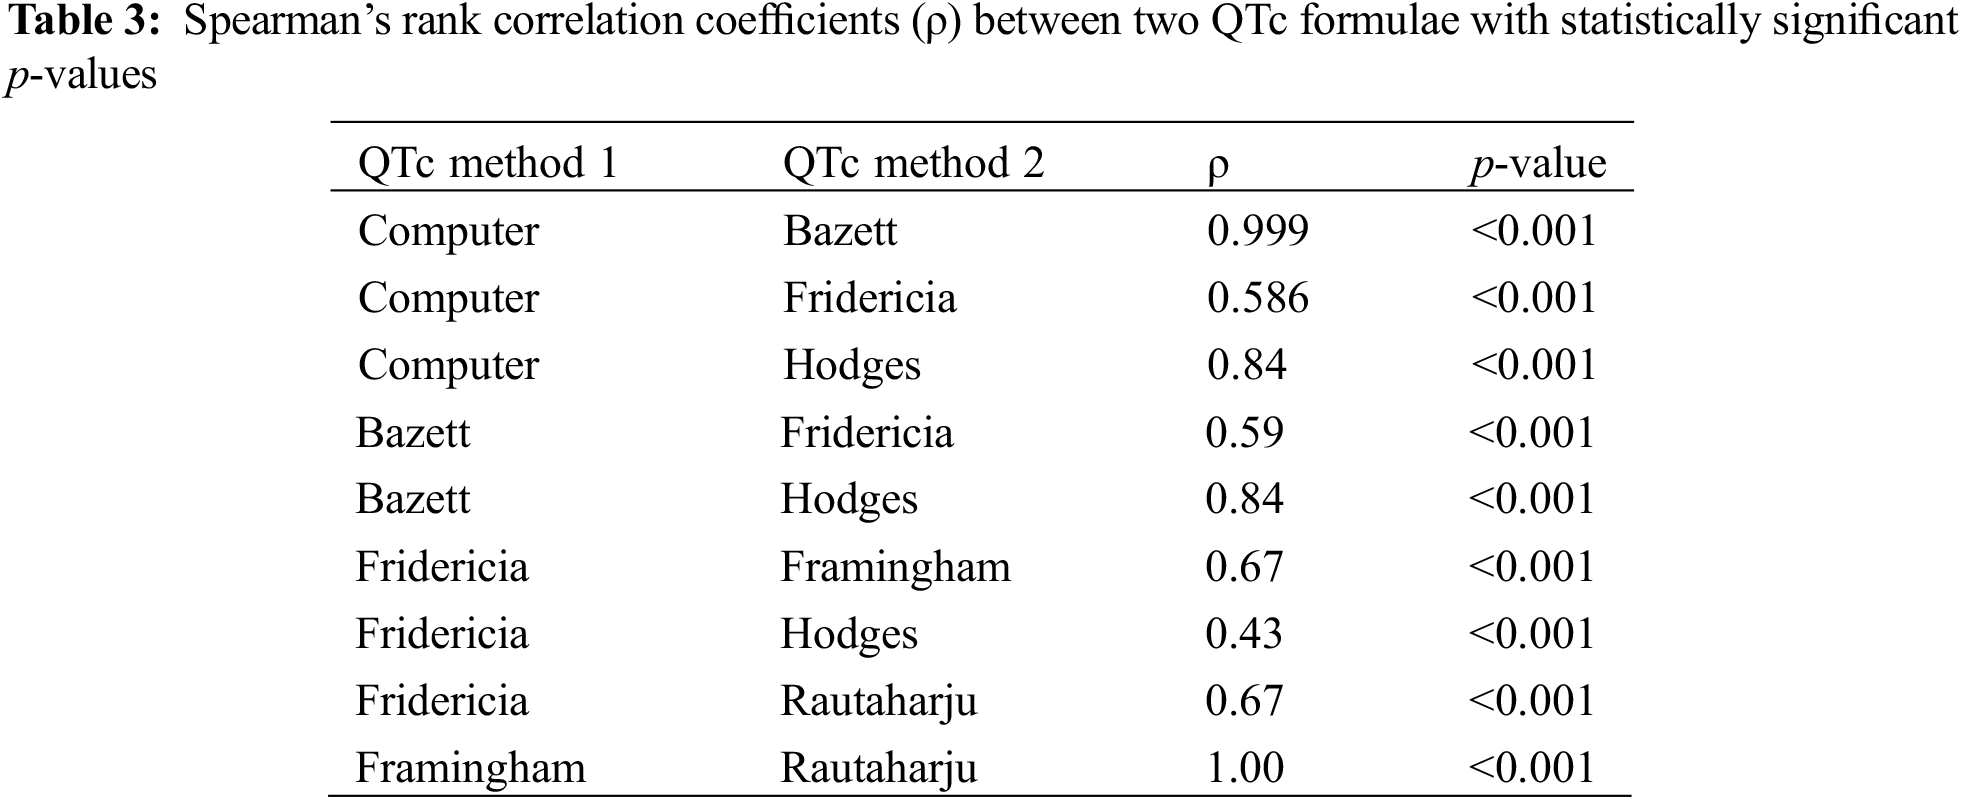
Spearman’s rank correlations between formulae were linear. Spearman’s correlation between Computer and Bazett was 0.999 (p < 0.001), signifying an extremely strong positive correlation between the formulae (Table 3). A correlation coefficient of 1 was observed between Framingham and Rautaharju (p < 0.001). Statistically significant positive correlations were also noted between Computer vs. Fridericia and Computer vs. Hodges (Table 3).
3.2.2 Two-Sample Paired t-Test or Wilcoxon Signed-Rank Test
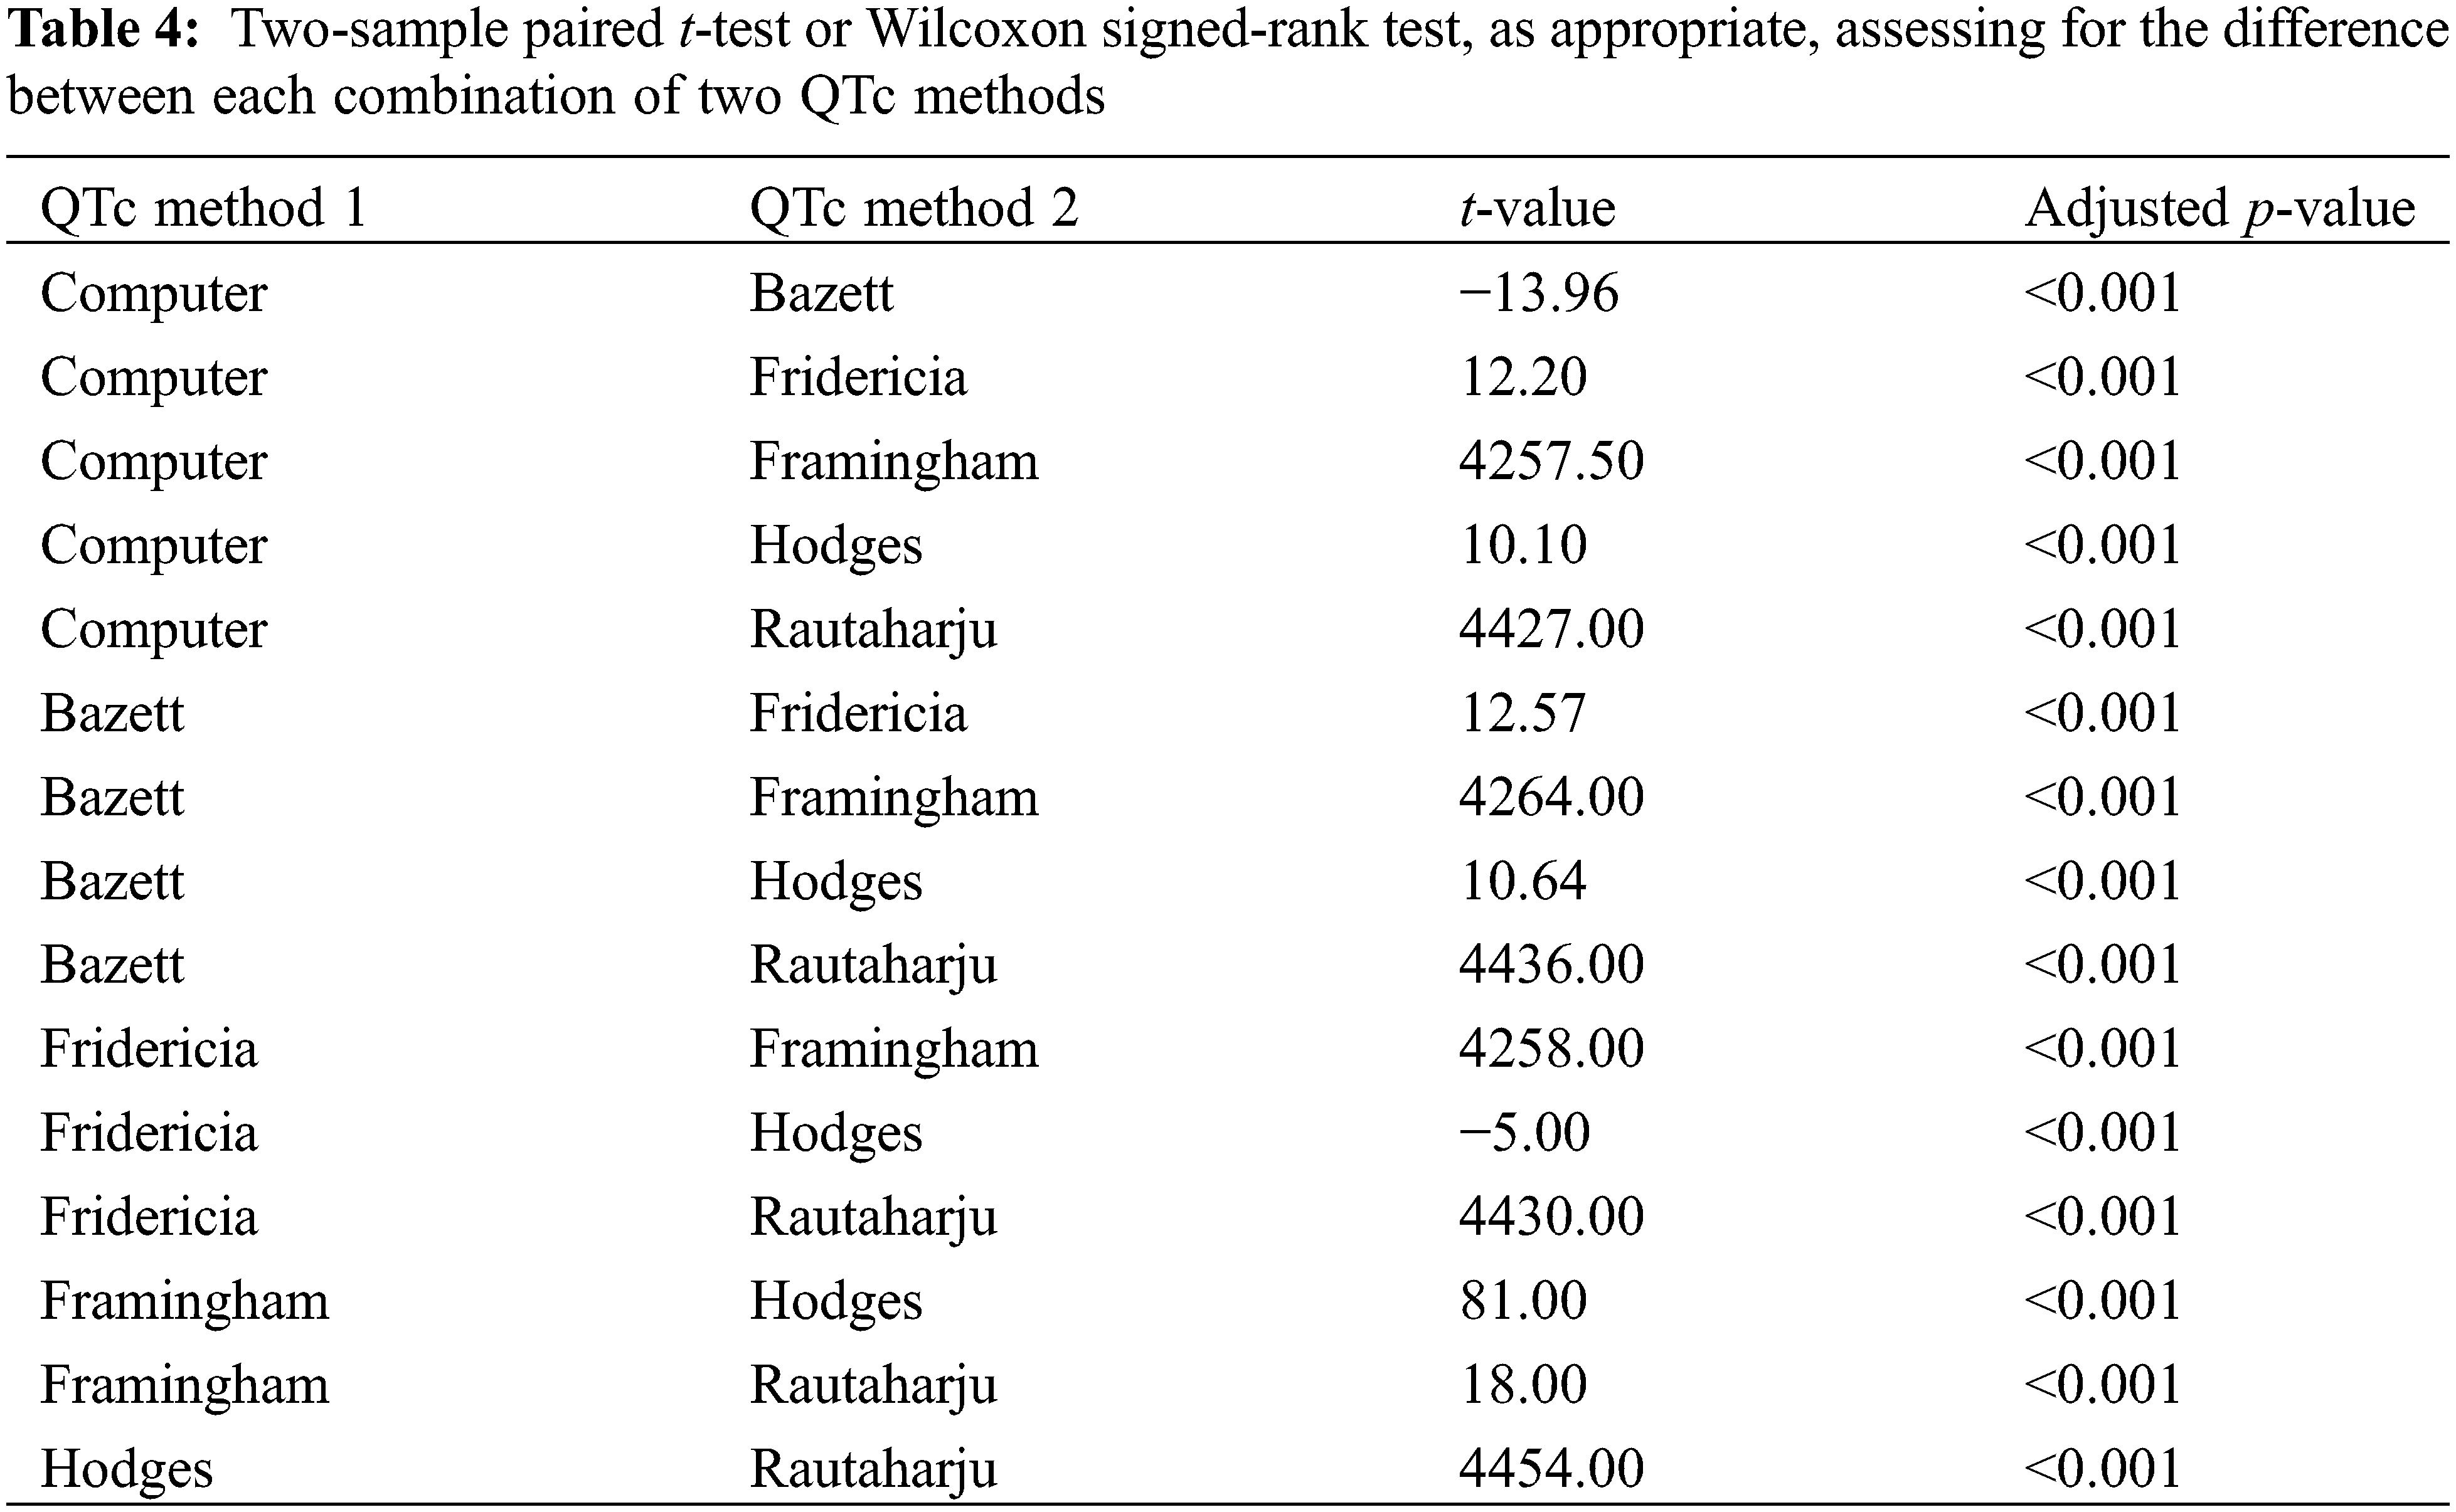
Two-sample paired t-test or Wilcoxon signed-rank test, as appropriate, examined for any difference in each combination of two QTc values (p-value adjusted with fdr method because of multiple comparisons). A statistically significant difference was observed between every combination of two QTc values (Table 4).
3.3 Relationship between QTc Formula and Heart Rate
3.3.1 Spearman’s Correlation Coefficient
Spearman’s rank correlation analysis determined the relationship between each QTc formula and HR. Our null hypothesis (H0) stated that there is no correlation between the two variables, such that the Spearman’s correlation coefficient (ρ) is equal to 0, and there is no monotonic association (inclusive of a linear relationship) between the tested variables. The alternative hypothesis (Ha) asserted the presence of a correlation between each QTc formula and HR, such that ρ is not equal to 0. A correlation coefficient approaching ±1 indicates a stronger correlation. A negative correlation coefficient indicates an inverse relationship between variables (i.e., the higher the HR, the lower the QTc), while a positive correlation coefficient signifies a direct relationship between the variables (the higher the HR, the higher the QTc). Framingham and Rautaharju demonstrated the strongest correlation with HR, both with a ρ of −0.89 (p-value < 0.001) (Fig. 1, Table 5). Fridericia had the lowest ρ of −0.34 (p-value < 0.001). Hodges (ρ = 0.45, p-value < 0.001), Bazett, and Computer had positive coefficients. Bazett and Computer had the same coefficient of 0.50 (p-value < 0.001), indicating a moderate correlation between the formulae and HR. In other words, QTc calculations by Bazett and Computer were not independent of HR.
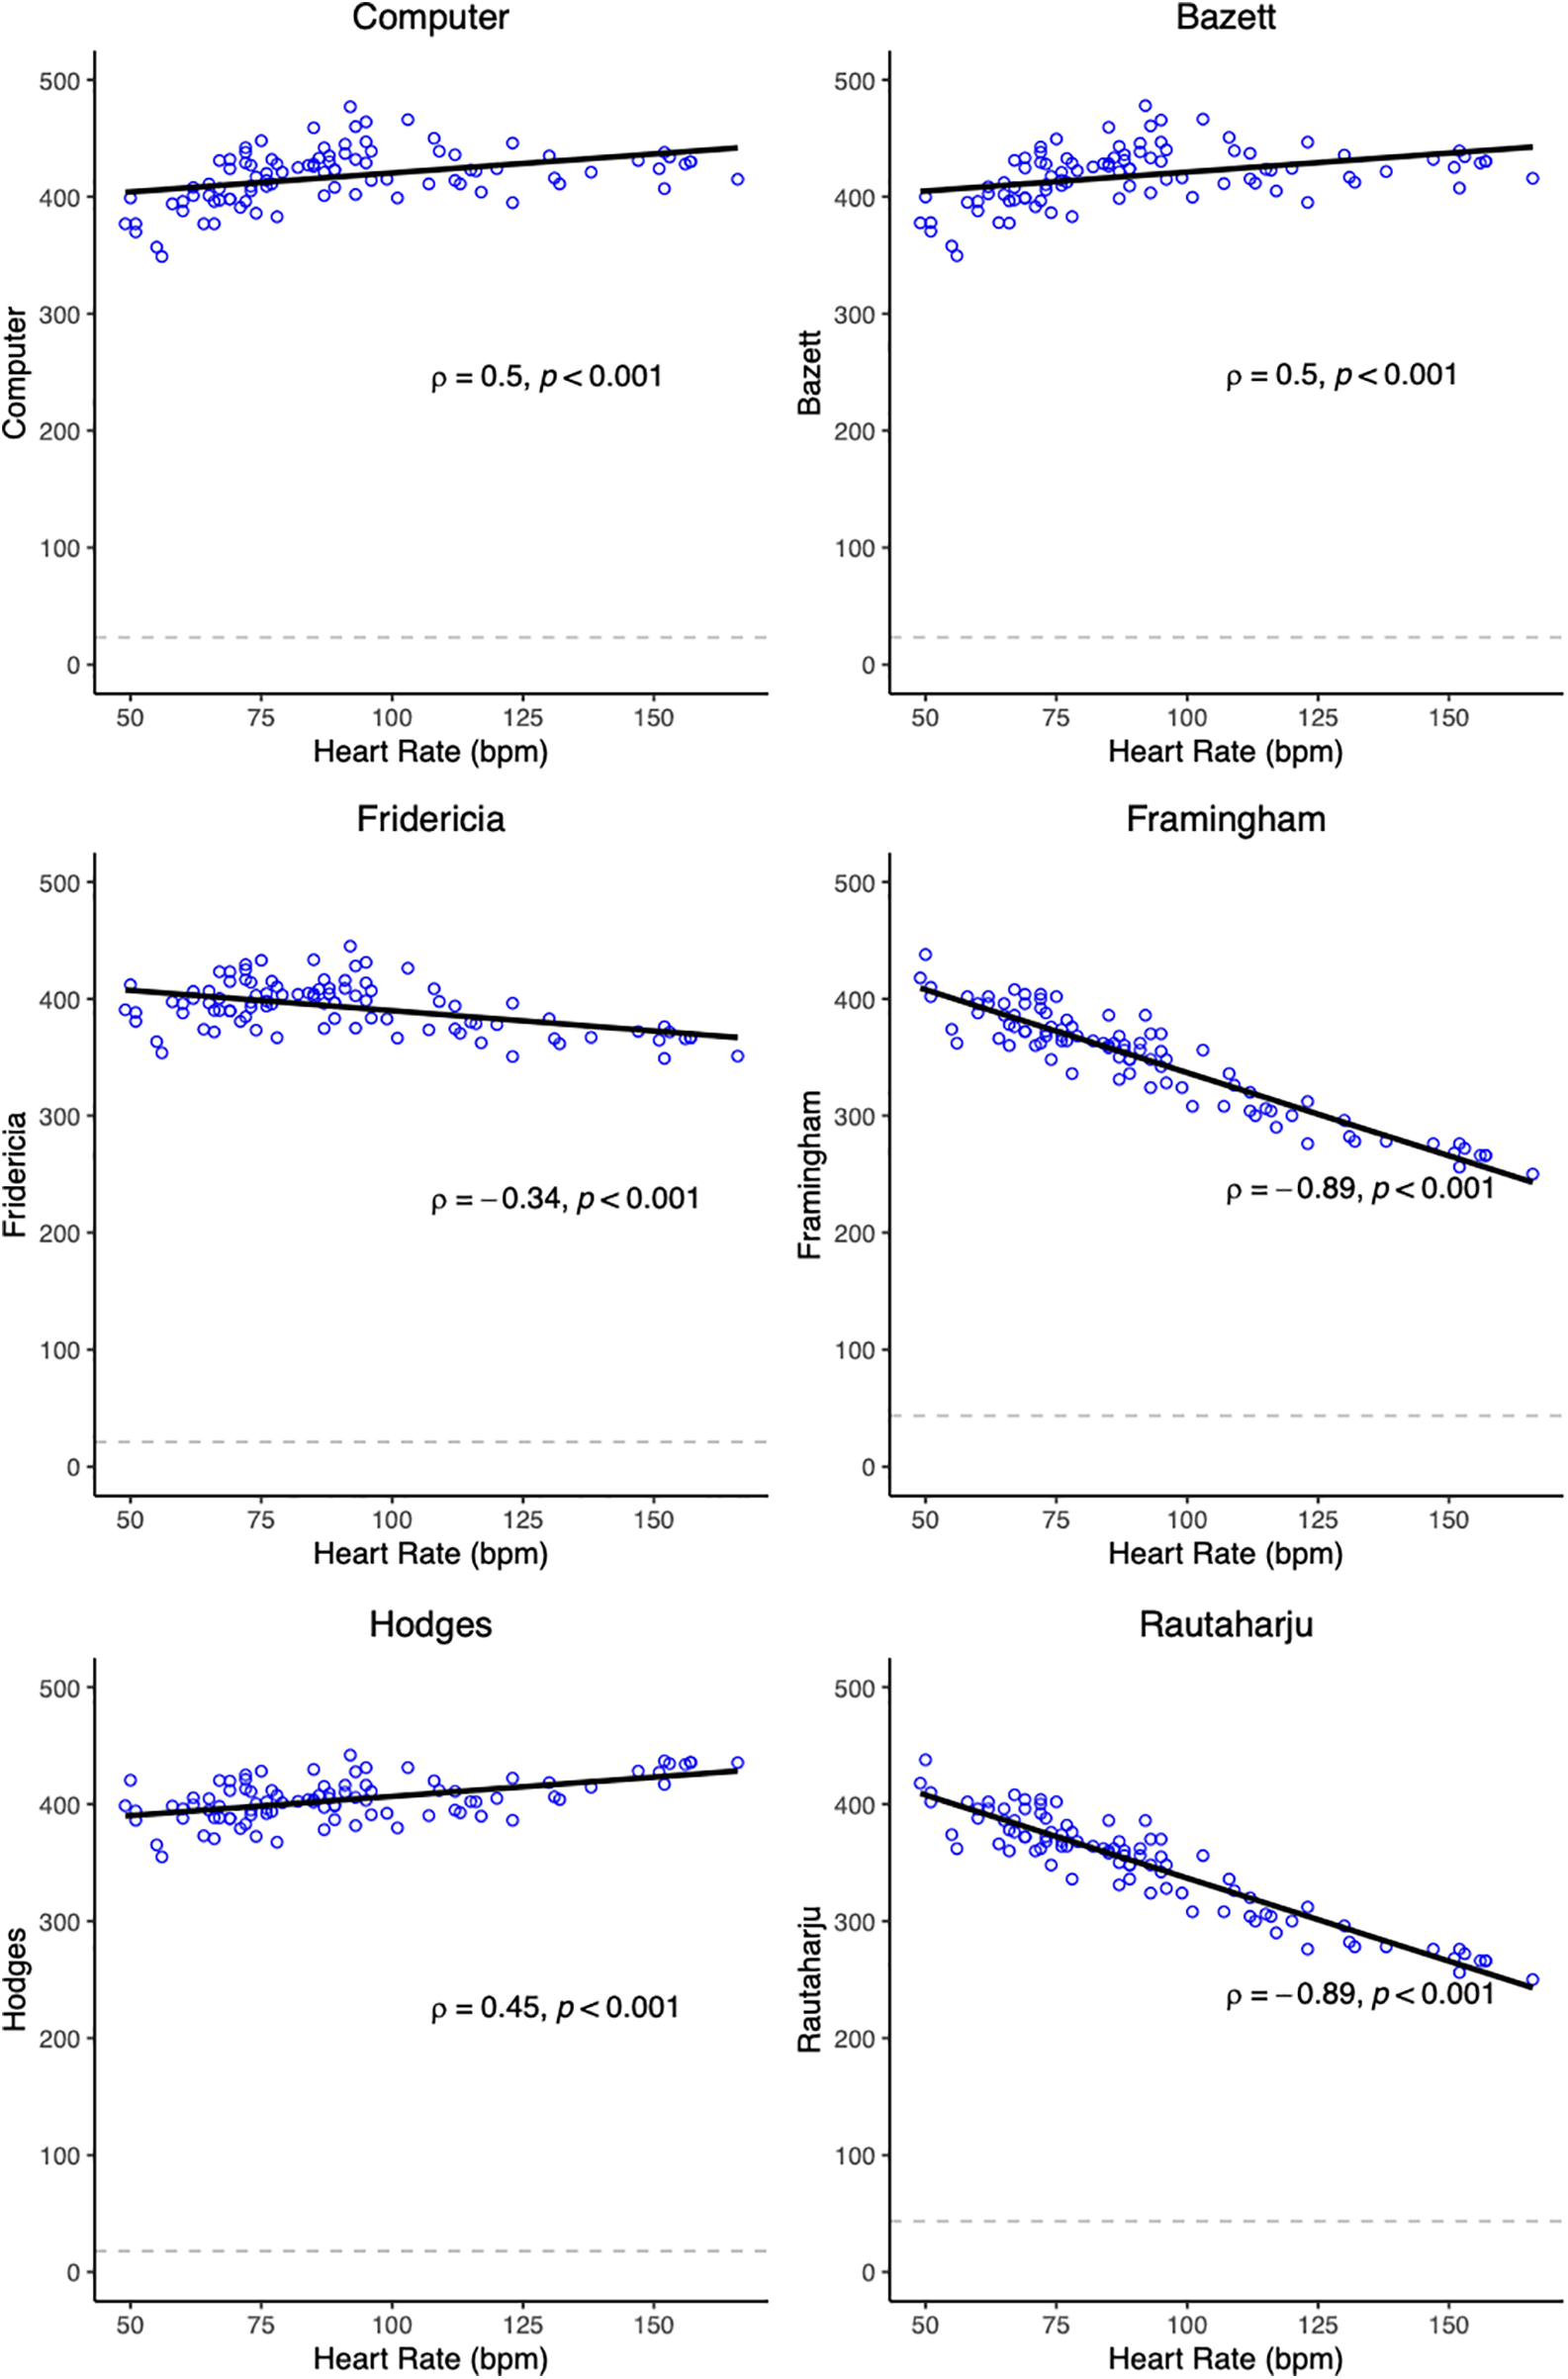
Figure 1: Scatter plots showing QTc/HR relationship with univariate linear regression lines. Spearman’s rank correlation coefficient (ρ) and the test p-value are also displayed in the plot. The dashed line represents the SD of QTc
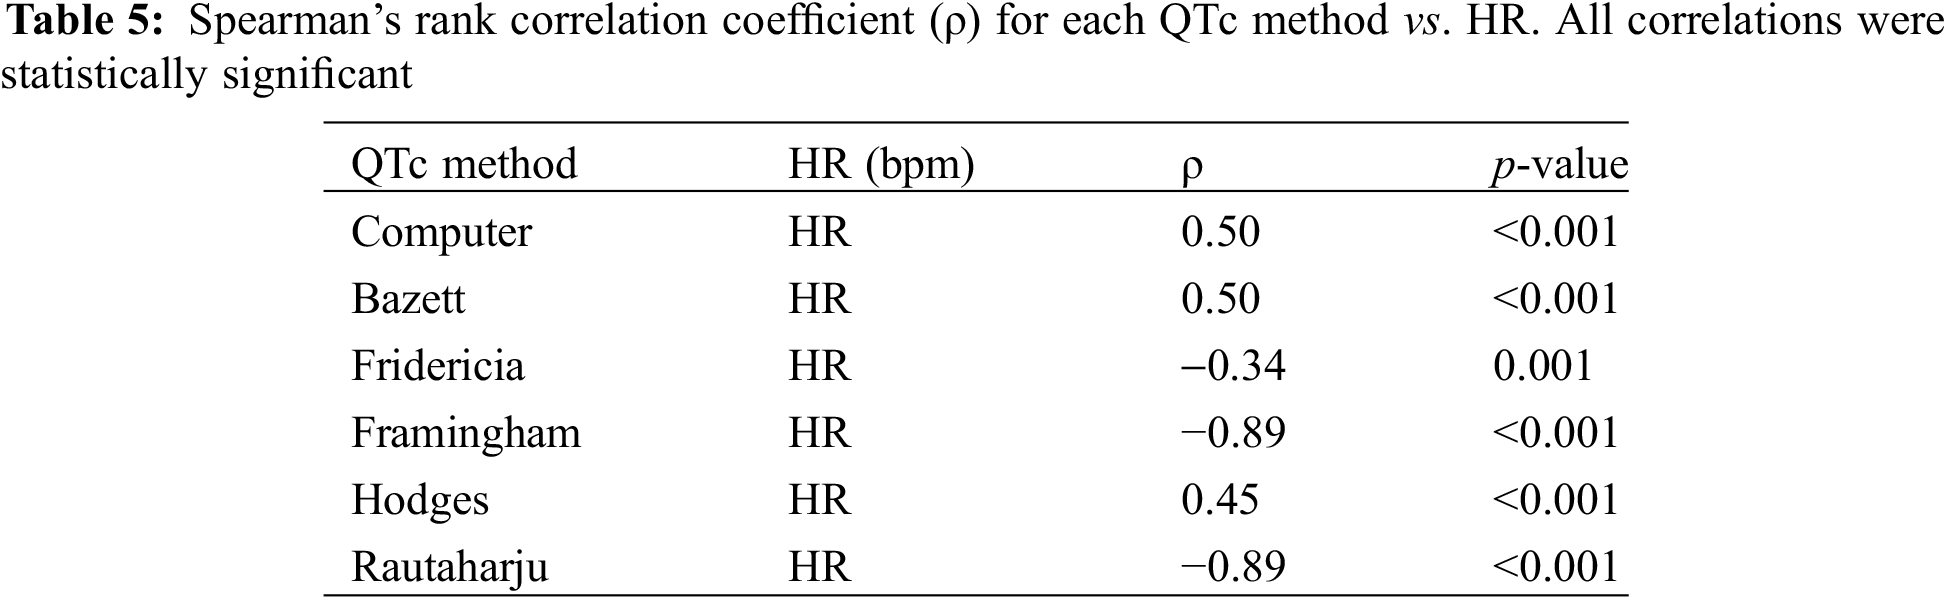
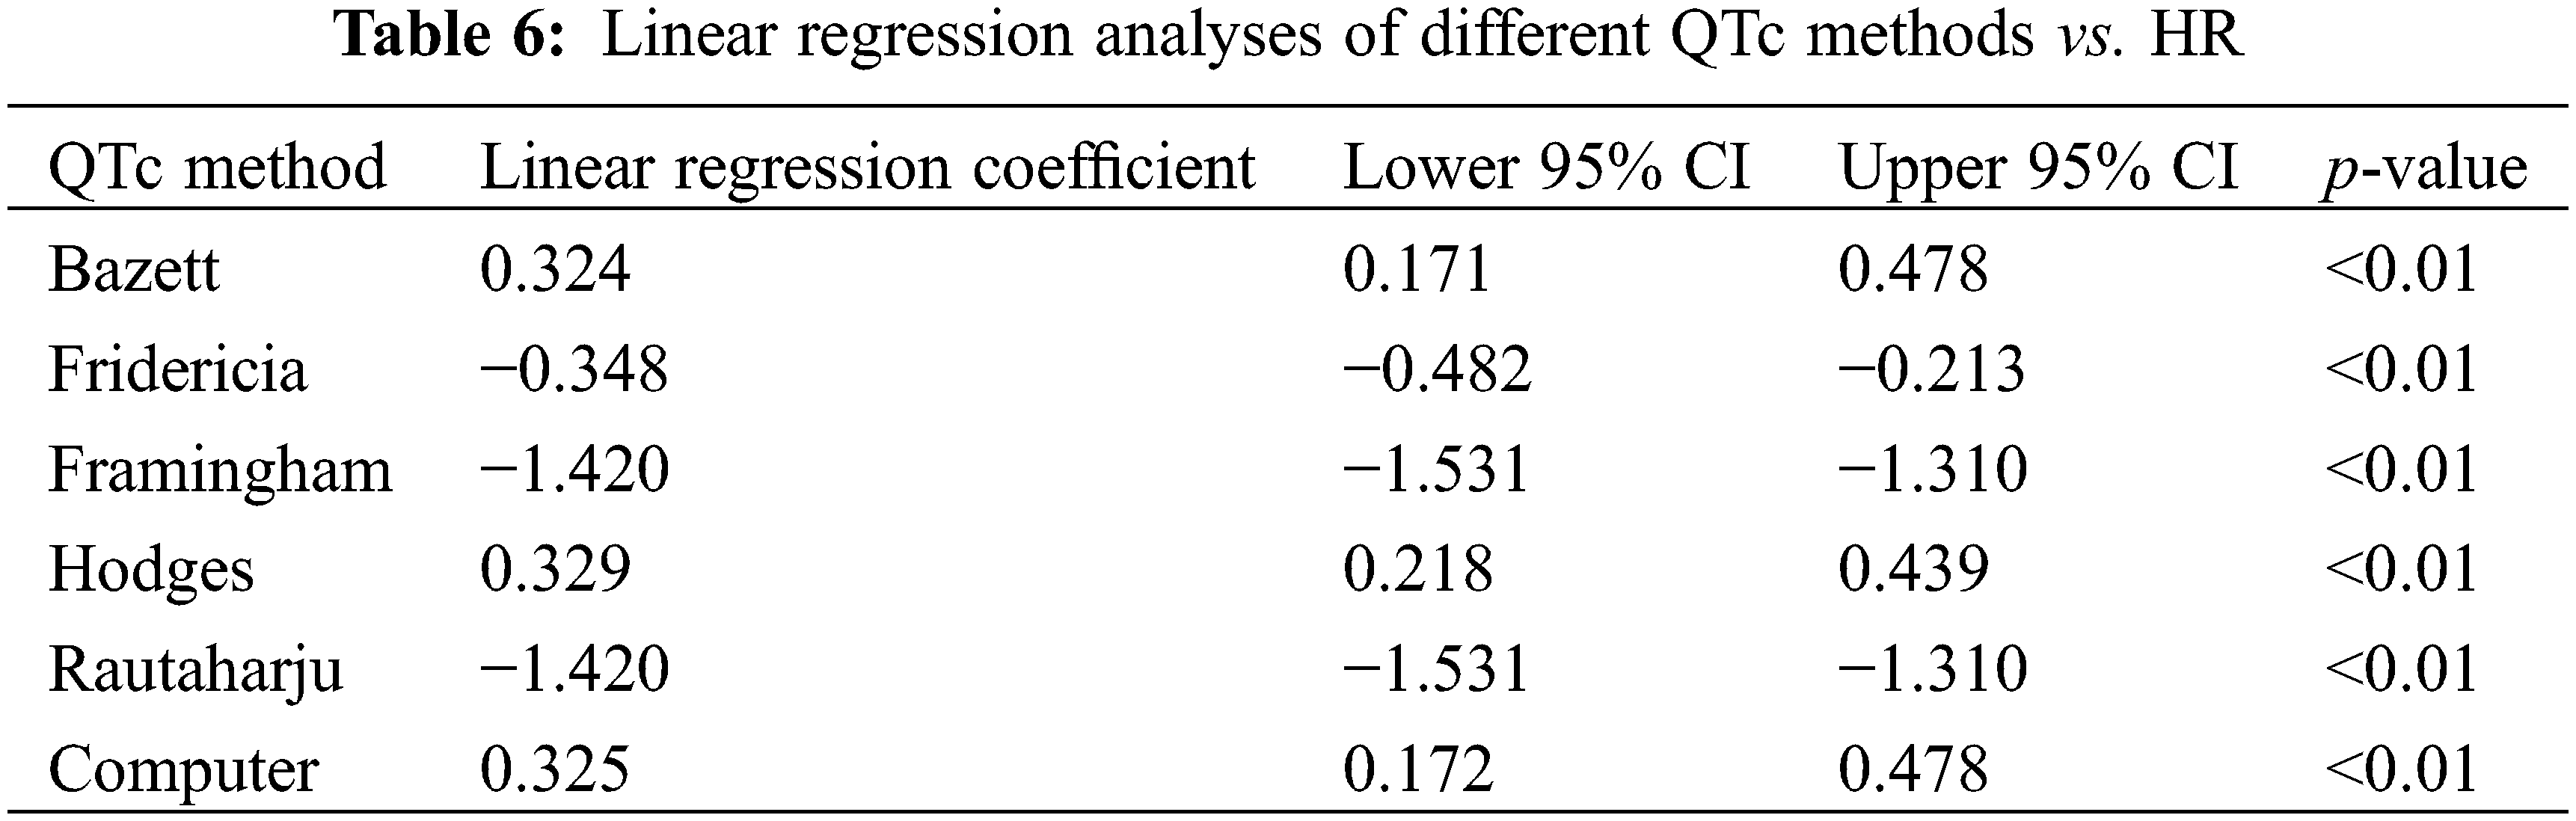
A linear regression analysis of QTc/HR was conducted to evaluate for the robustness of each formula to changes in HR (Table 6). The formula with a slope closest to zero would provide the best rate correction in our population, minimizing the influence of HR on QTc. Bazett, Computer, and Hodges had positive slopes, denoting a tendency to over-correct QTc at higher HRs and under-correct at lower HRs. Fridericia, Framingham, and Rautaharju had negative slope values, signifying a possible under-correction of QTc at higher HRs and an over-correction at lower HRs. Bazett had the lowest absolute value of slope: for every one-unit increase in HR, QTc increases by 0.324 ms (95% confidence interval (CI) 0.171, 0.478, p < 0.01). Computer (0.325, 95% CI 0.172, 0.325, p < 0.01), Hodges (0.329, 95% CI 0.218, 0.329), and Fridericia (−0.348, 95% CI −0.482, −0.213, p < 0.01), however, had comparably low absolute slope values. Framingham and Rautaharju had the highest absolute slope values; for both, QTc decreases by 1.42 ms for every 1 bpm increase in HR.
3.4 Relationship between QTc Formula and RR Interval
3.4.1 Spearman’s Correlation Coefficient
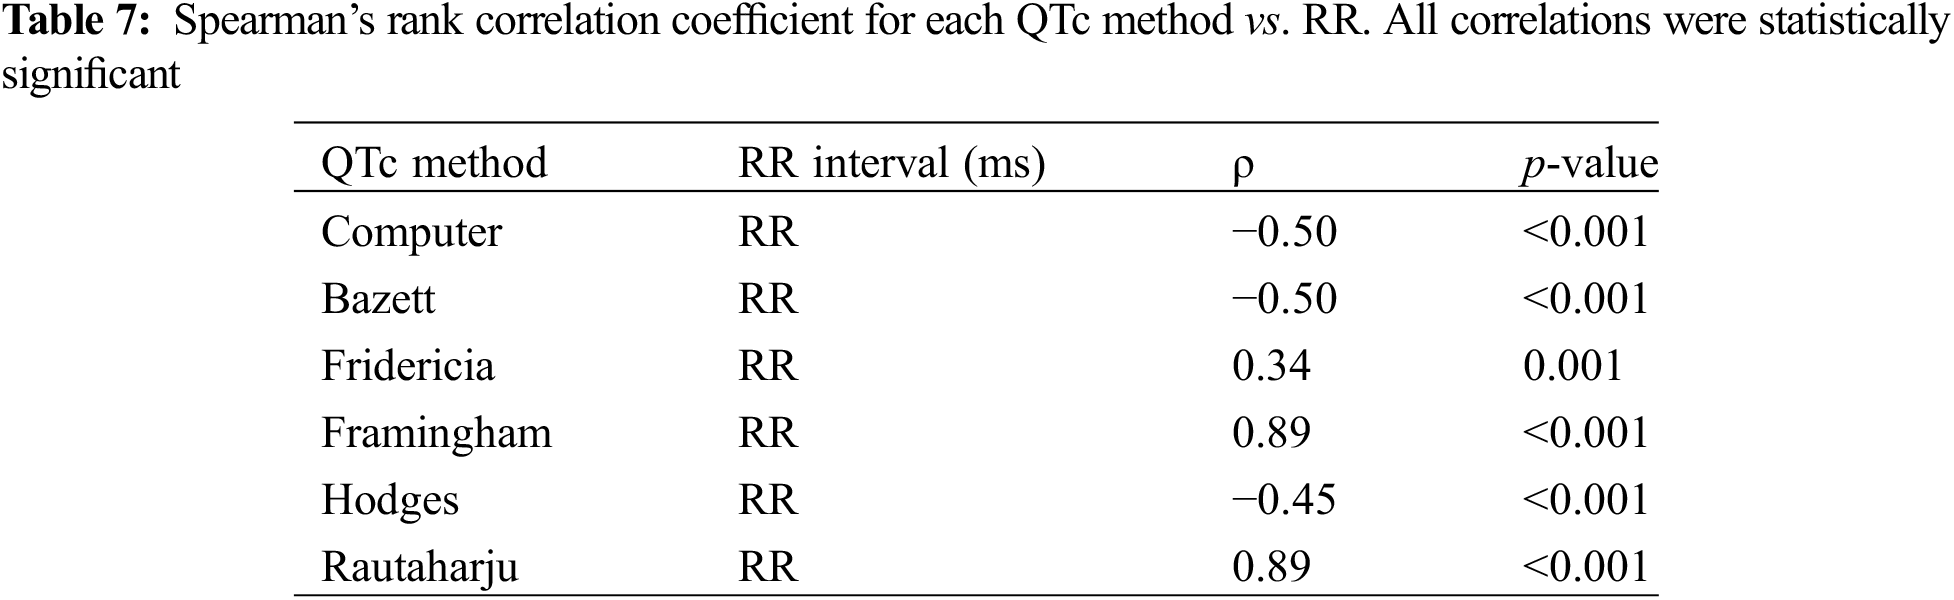
Fridericia yielded a ρ closest to 0 (ρ = 0.34, p = 0.001), followed by Hodges (ρ = −0.45, p < 0.001) (Table 7). Rautaharju had the strongest correlation to RR (both ρ = 0.89, p < 0.001). Bazett and Computer had a moderate correlation with RR (both ρ = −0.50, p < 0.001). Each QTc/RR correlation coefficient value was the additive inverse of its corresponding QTc/HR correlation coefficient (e.g., QTc Fridericia/HR ρ = −0.34, QTc Fridericia/RR ρ = +0.34), a reflection of the inverse relationship between RR and HR (as RR increases, HR decreases and vice versa).
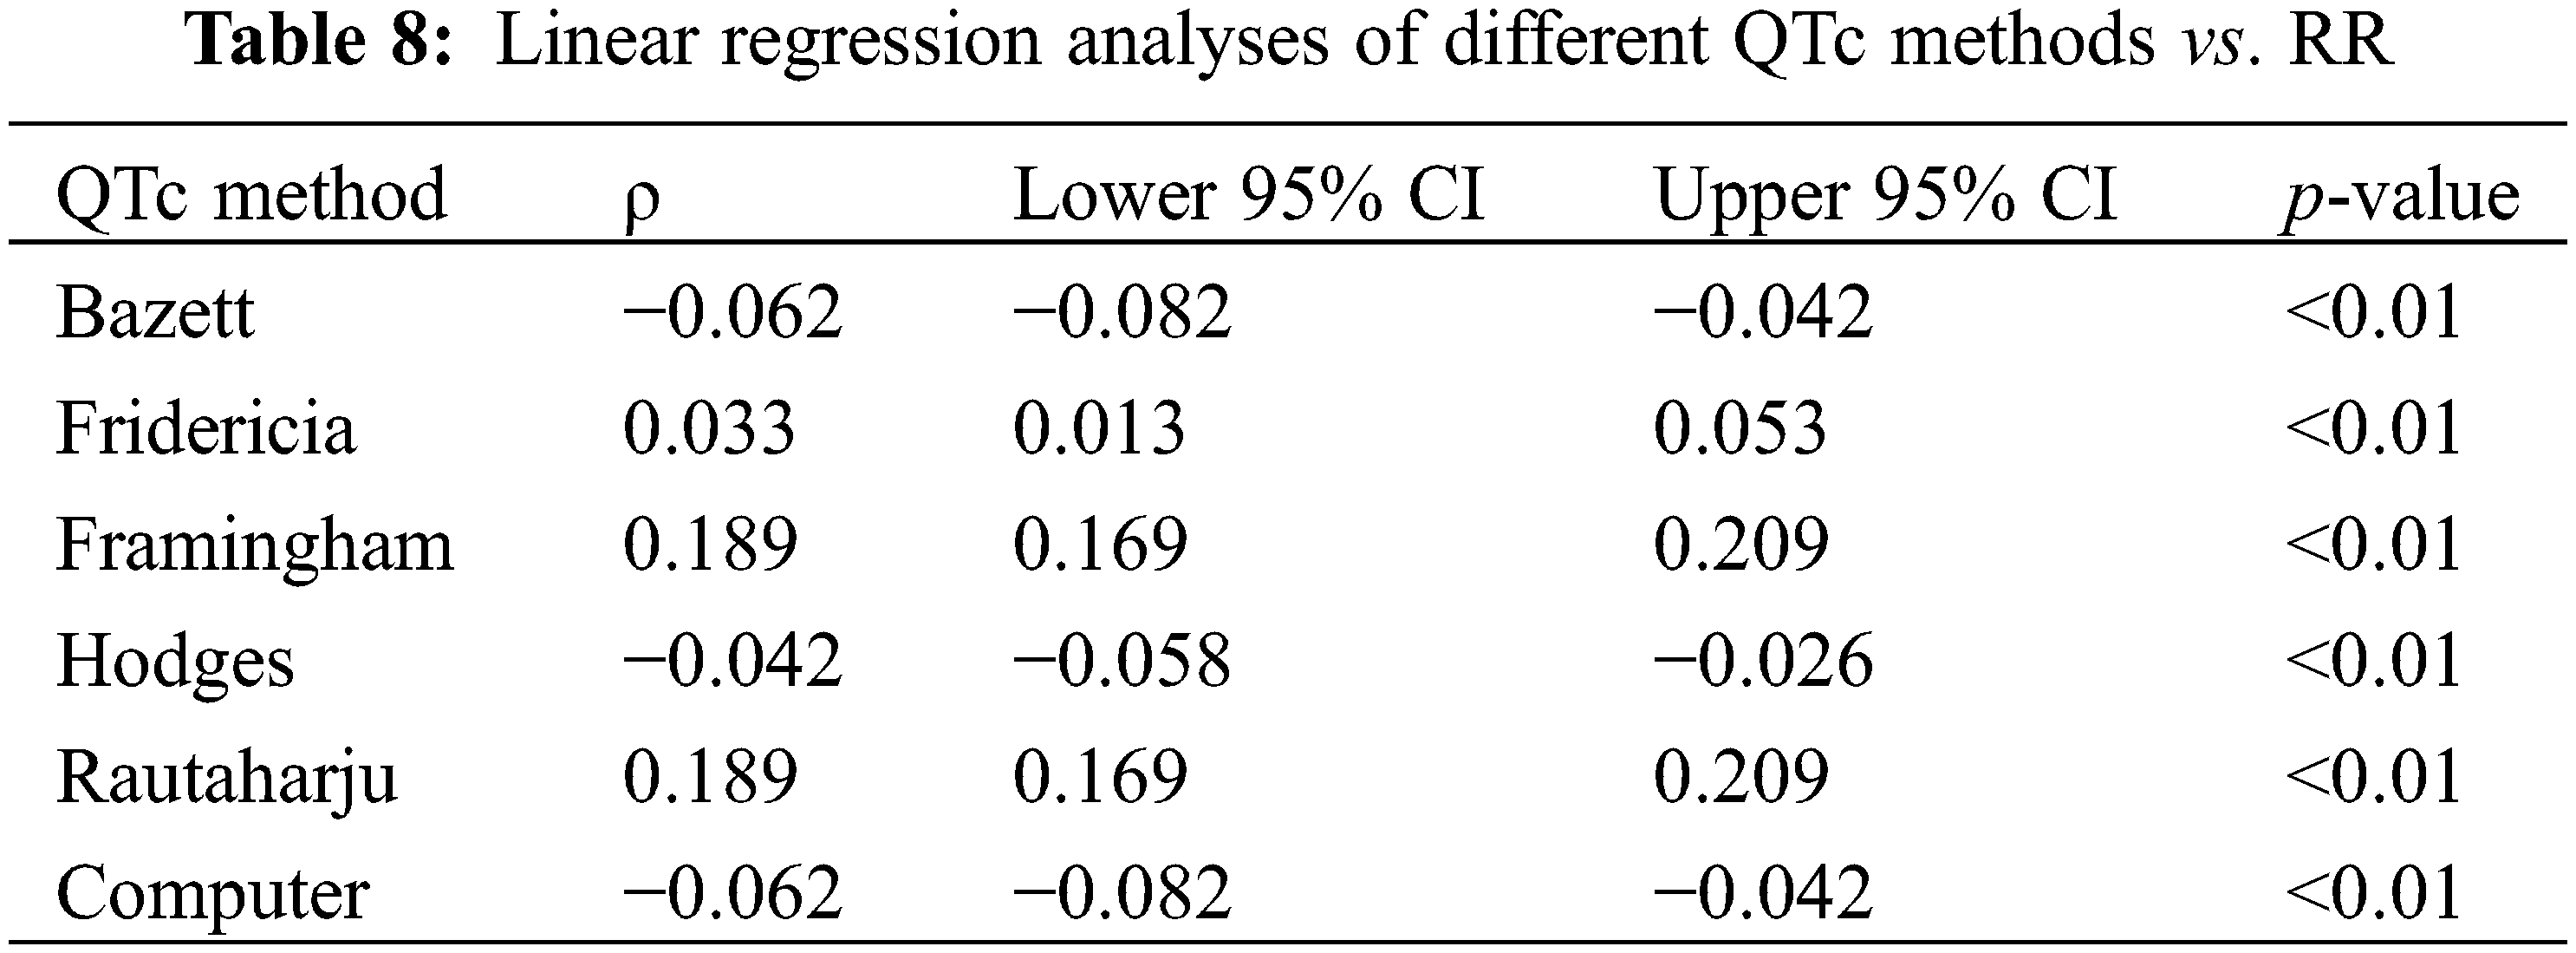
The QTc/RR linear regression analysis identified Fridericia as the best rate correction method in our study cohort. Fridericia had the lowest absolute value of slope: for every one-unit increase in RR, QTc increases by 0.033 ms (95% CI 0.013, 0.053, p < 0.01) (Table 8). Bazett, Computer, and Hodges had negative slope values. Fridericia, Framingham, and Rautaharju had positive slope values. Hodges had the next lowest absolute value of slope: for every one-unit increase in RR, the QTc decreases by 0.042 ms (95% CI −0.058, −0.026, p < 0.01). Bazett and Computer had the same coefficient of −0.062 (both 95% CI −0.082, −0.042, p < 0.01). Framingham and Rautaharju were worst performing with the greatest absolute value of slope: both 0.189 (95% CI 0.169, 0.209, p < 0.01).
The Bland-Altman method measured for bias and the limits of agreement between QTc formulae. Statistics are presented in Table 9. The plots (Fig. 2) provide a graphical display of bias (mean difference between two formulae) with 95% limits of agreement (2 SD). Y = 0 represents the line of perfect average agreement (i.e., the average of differences is zero). Framingham and Rautaharju showed a bias approaching 0 (bias = −0.012, 95% CI: −0.013, −0.011) with a narrow 95% limits of agreement (−0.025, 0.0002). Computer and Bazett also had a bias close to 0 (bias = −0.742, 95% CI: −1.26, −0.224) with good agreement (−1.7564, 0.2731). Fridericia and Hodges had a low bias (bias = −11.014, 95% CI: −32.501, 10.473), but poor agreement (−53.12819, 31.09945).
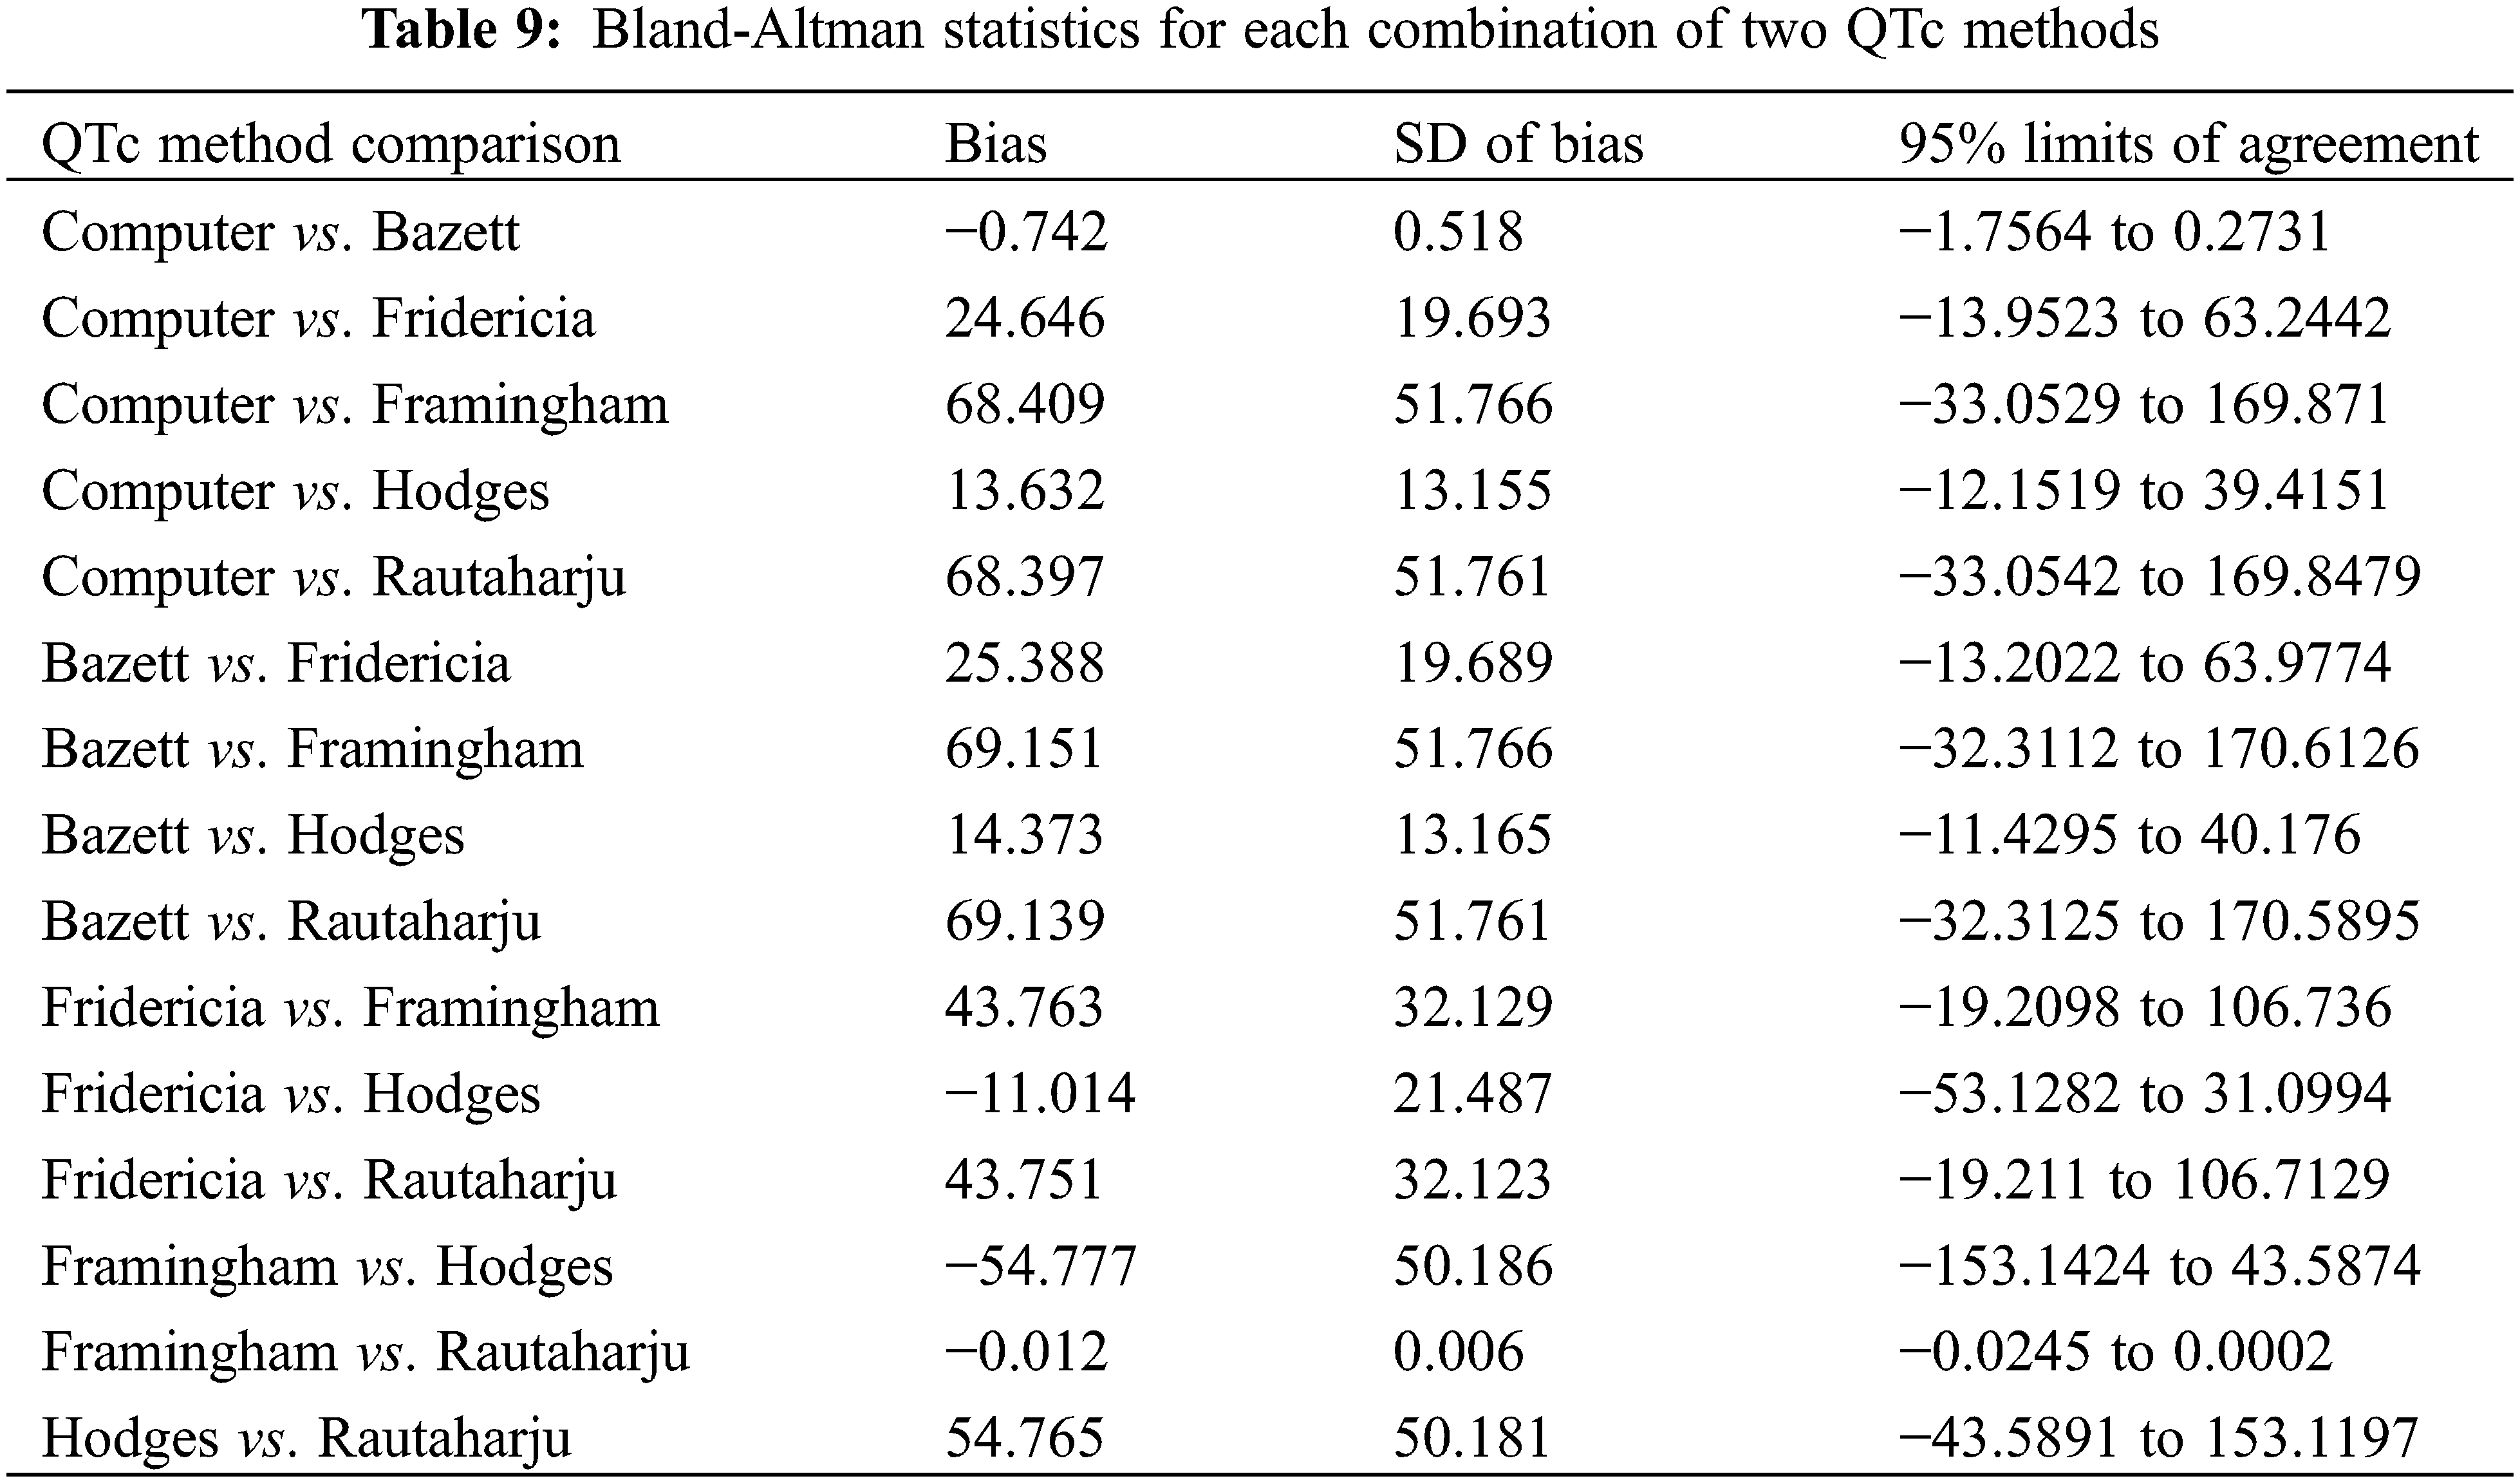
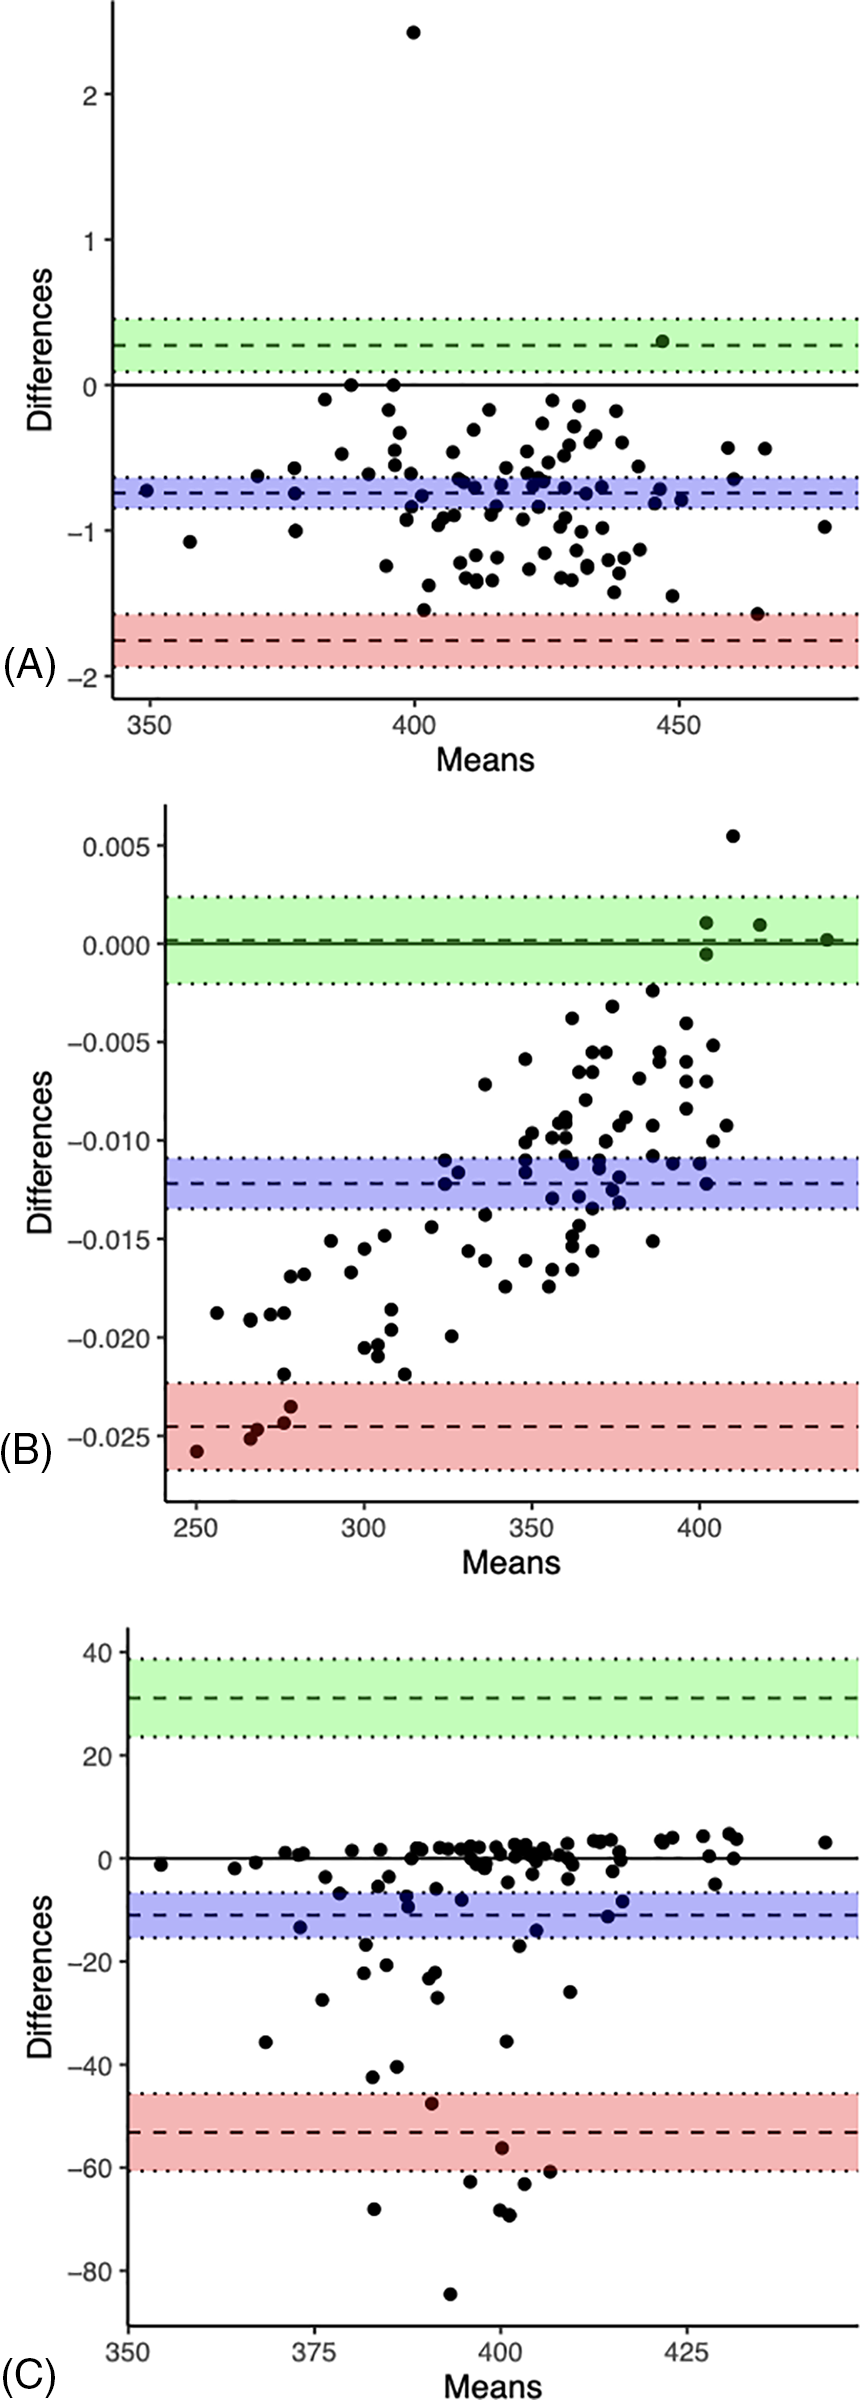
Figure 2: Bland-Altman plots of Computer vs. Bazett (A), Framingham vs. Rautaharju (B), and Fridericia vs. Hodges (C). The dashed line in the center of the green area is the upper 95% limit of agreement. The dashed line in the center of the purple area is the bias (mean difference between the two QTc). The dashed line in the center of the red area is the lower 95% limit of agreement
3.6 Analyses Excluding the Top and Bottom 2% of Data as Sorted by Heart Rate Ranges
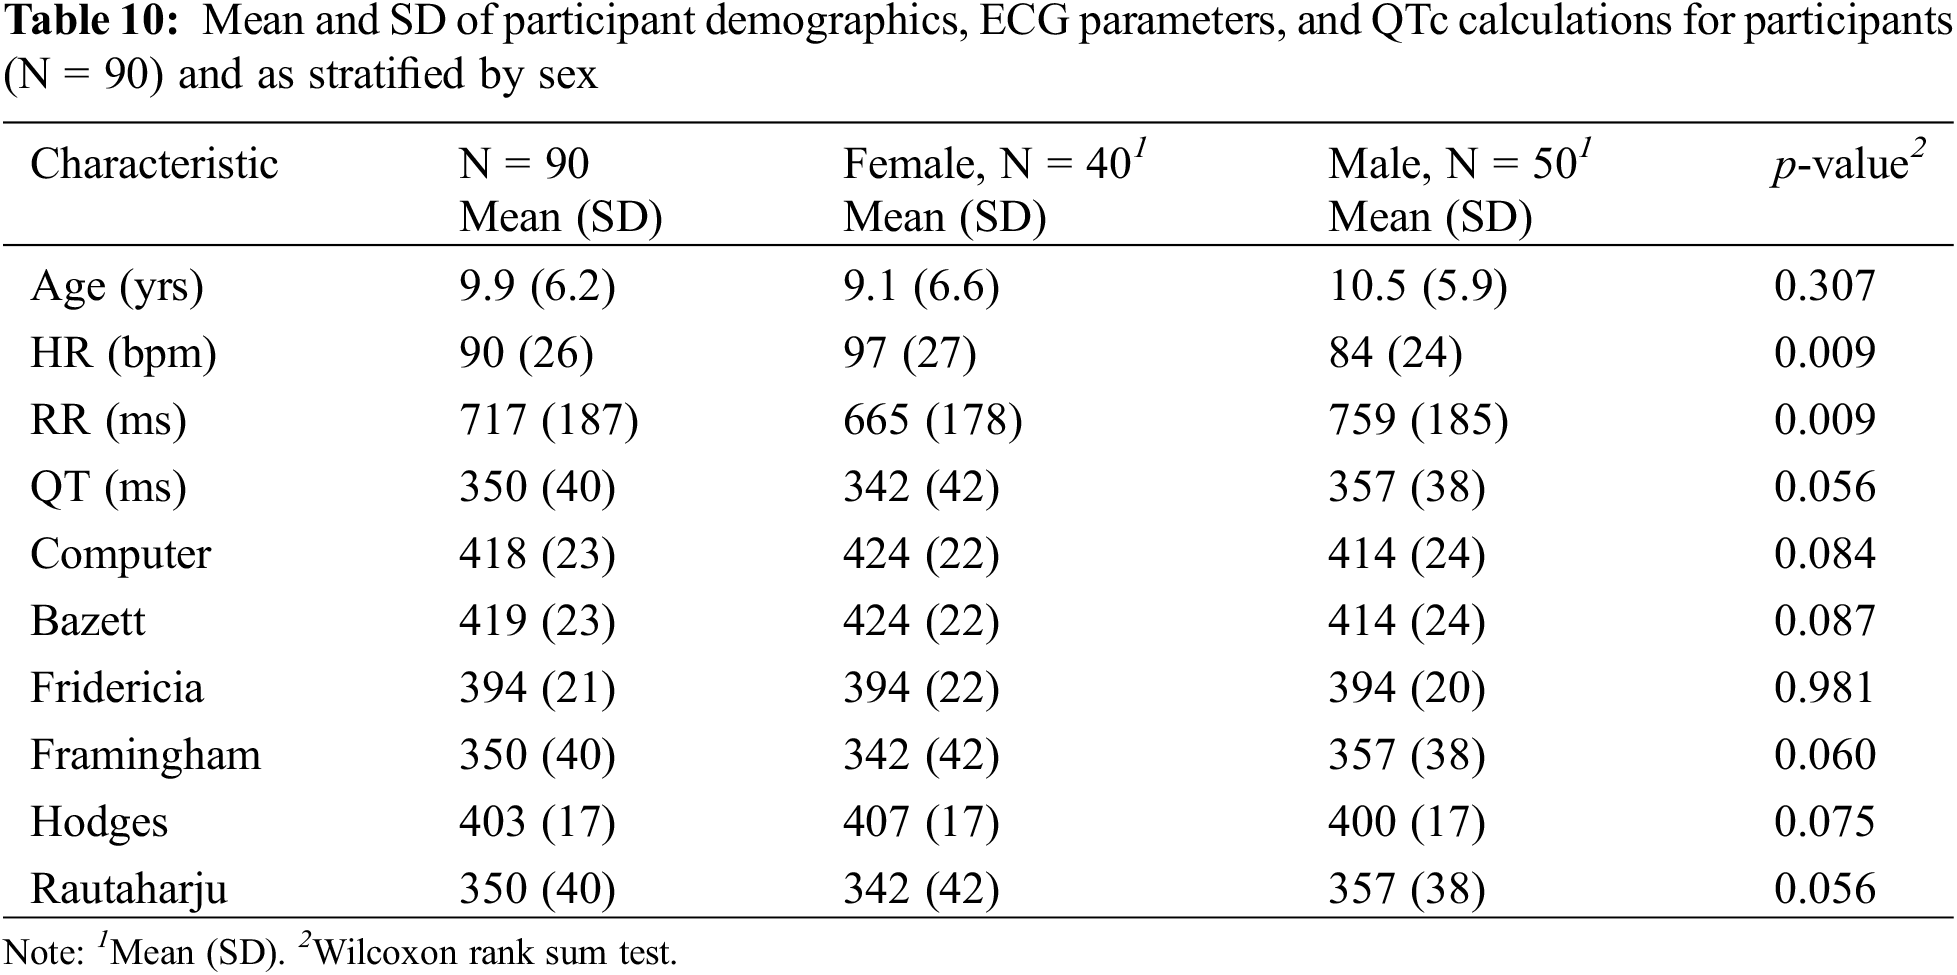
Five participants were excluded from the study such that 90 participants were included in the analyses. The new demographics, ECG parameters, and QTc calculations closely resembled the results involving all 95 participants (Table 10).
In the Spearman’s rank correlation tests between each combination of two QTc methods, Computer and Bazett as well as Framingham and Rautaharju demonstrated the strongest correlations (Table 11), both with a ρ value of 1.00 (p < 0.001).
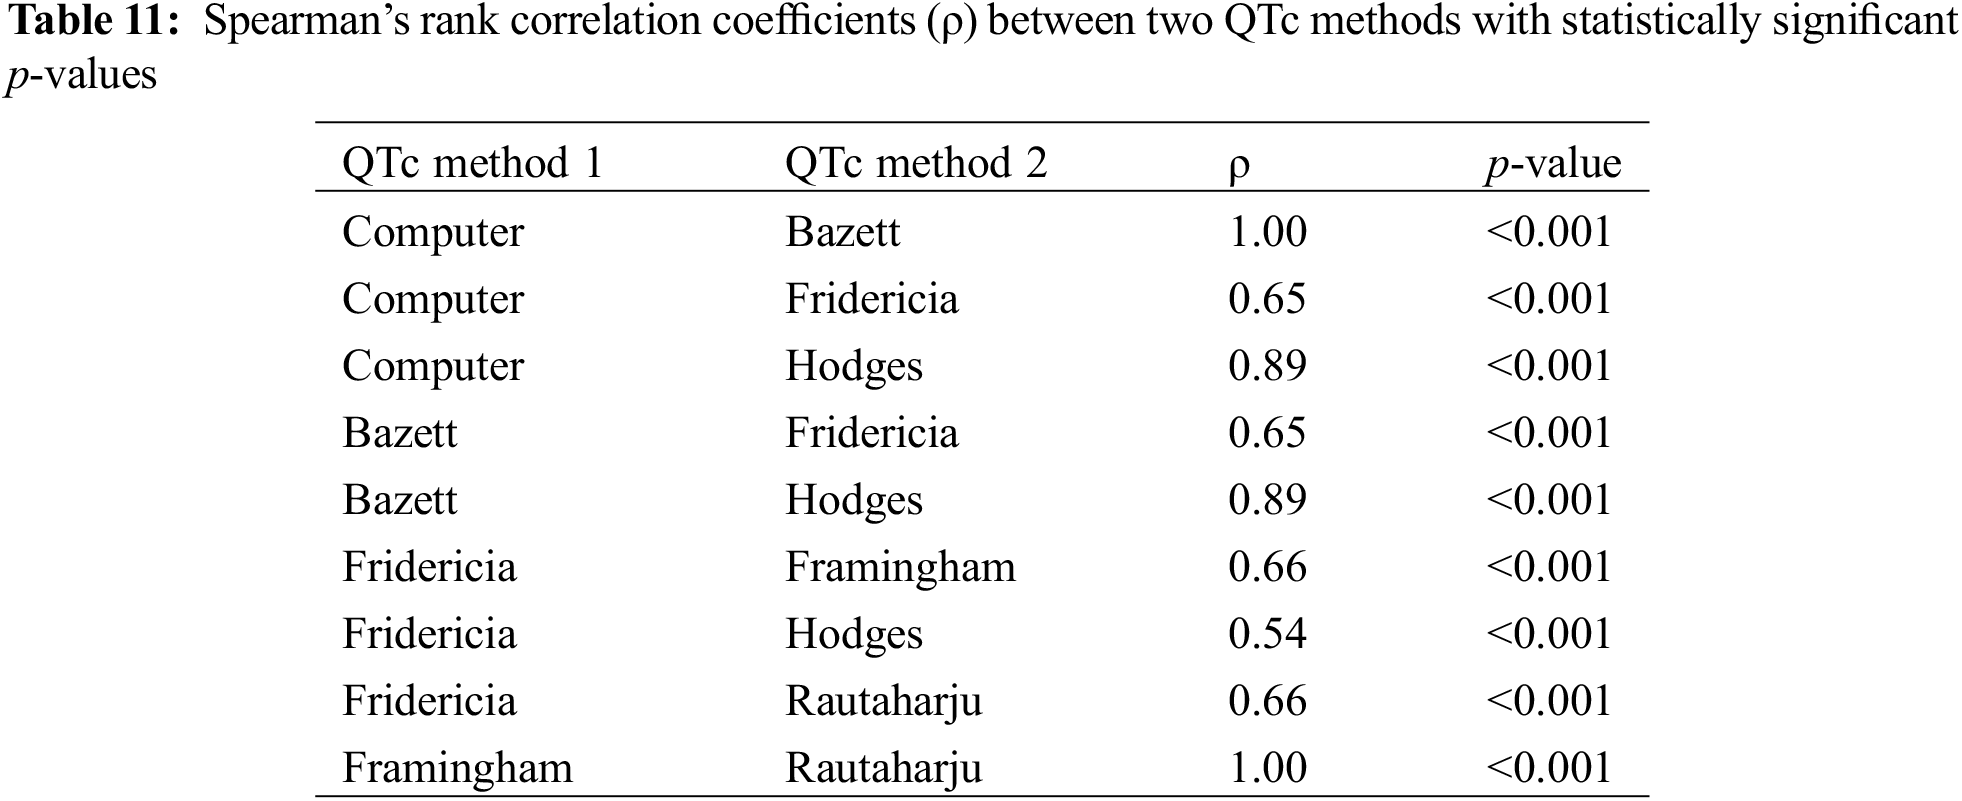
In the two-sample paired t-test or Wilcoxon signed-rank test, as appropriate, to evaluate for potential differences between QTc methods (p-value adjusted with fdr method because of multiple comparisons), there was a statistically significant difference (p < 0.001) between every two QTc formulae.
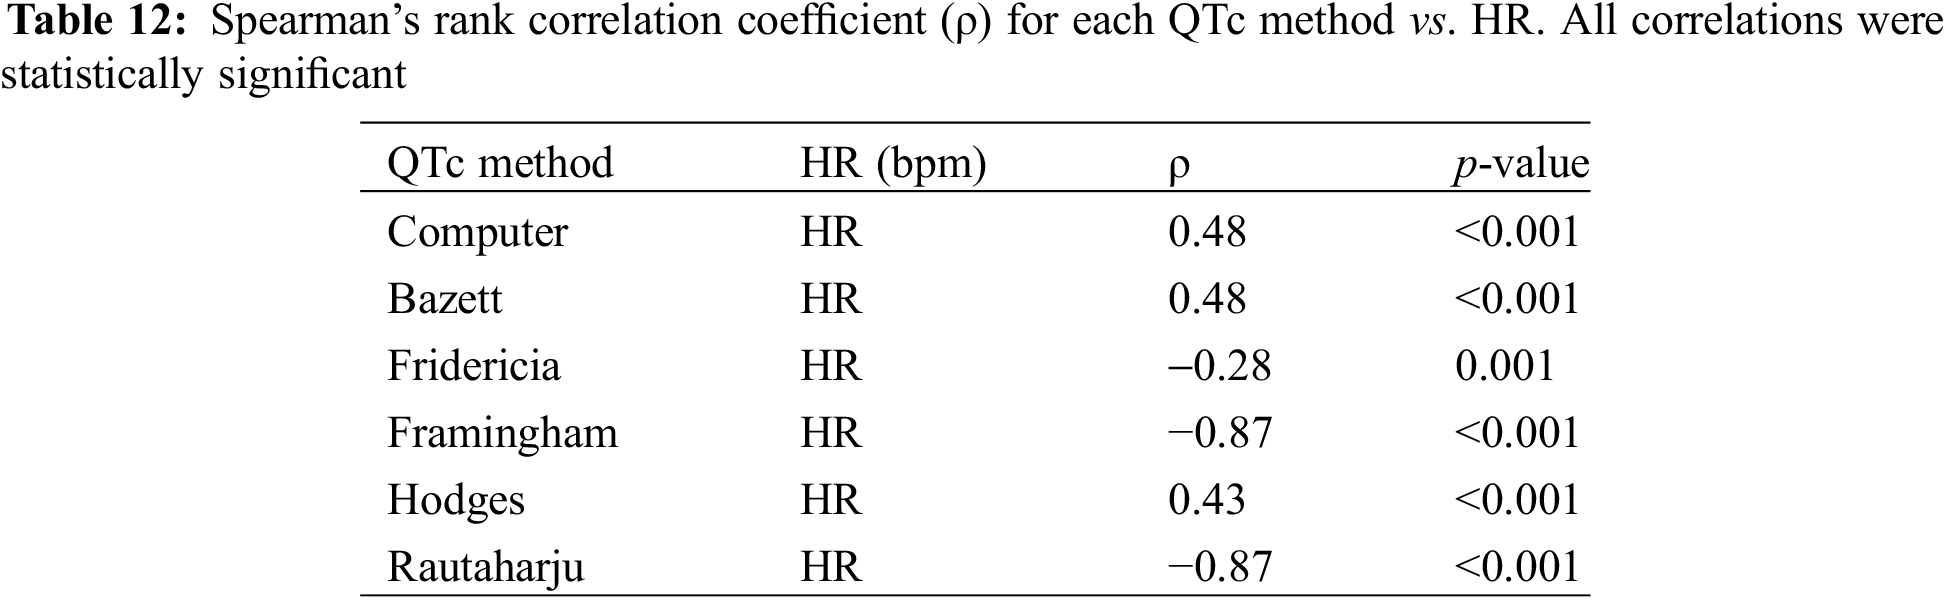
In the Spearman’s correlation coefficient test for different QT correction methods vs. HR, Rautaharju and Framingham maintained the strongest correlation with HR (both ρ = −0.87, p-value < 0.001) (Table 12). Fridericia continued to demonstrate the weakest correlation with HR (ρ = −0.28, p-value 0.007).
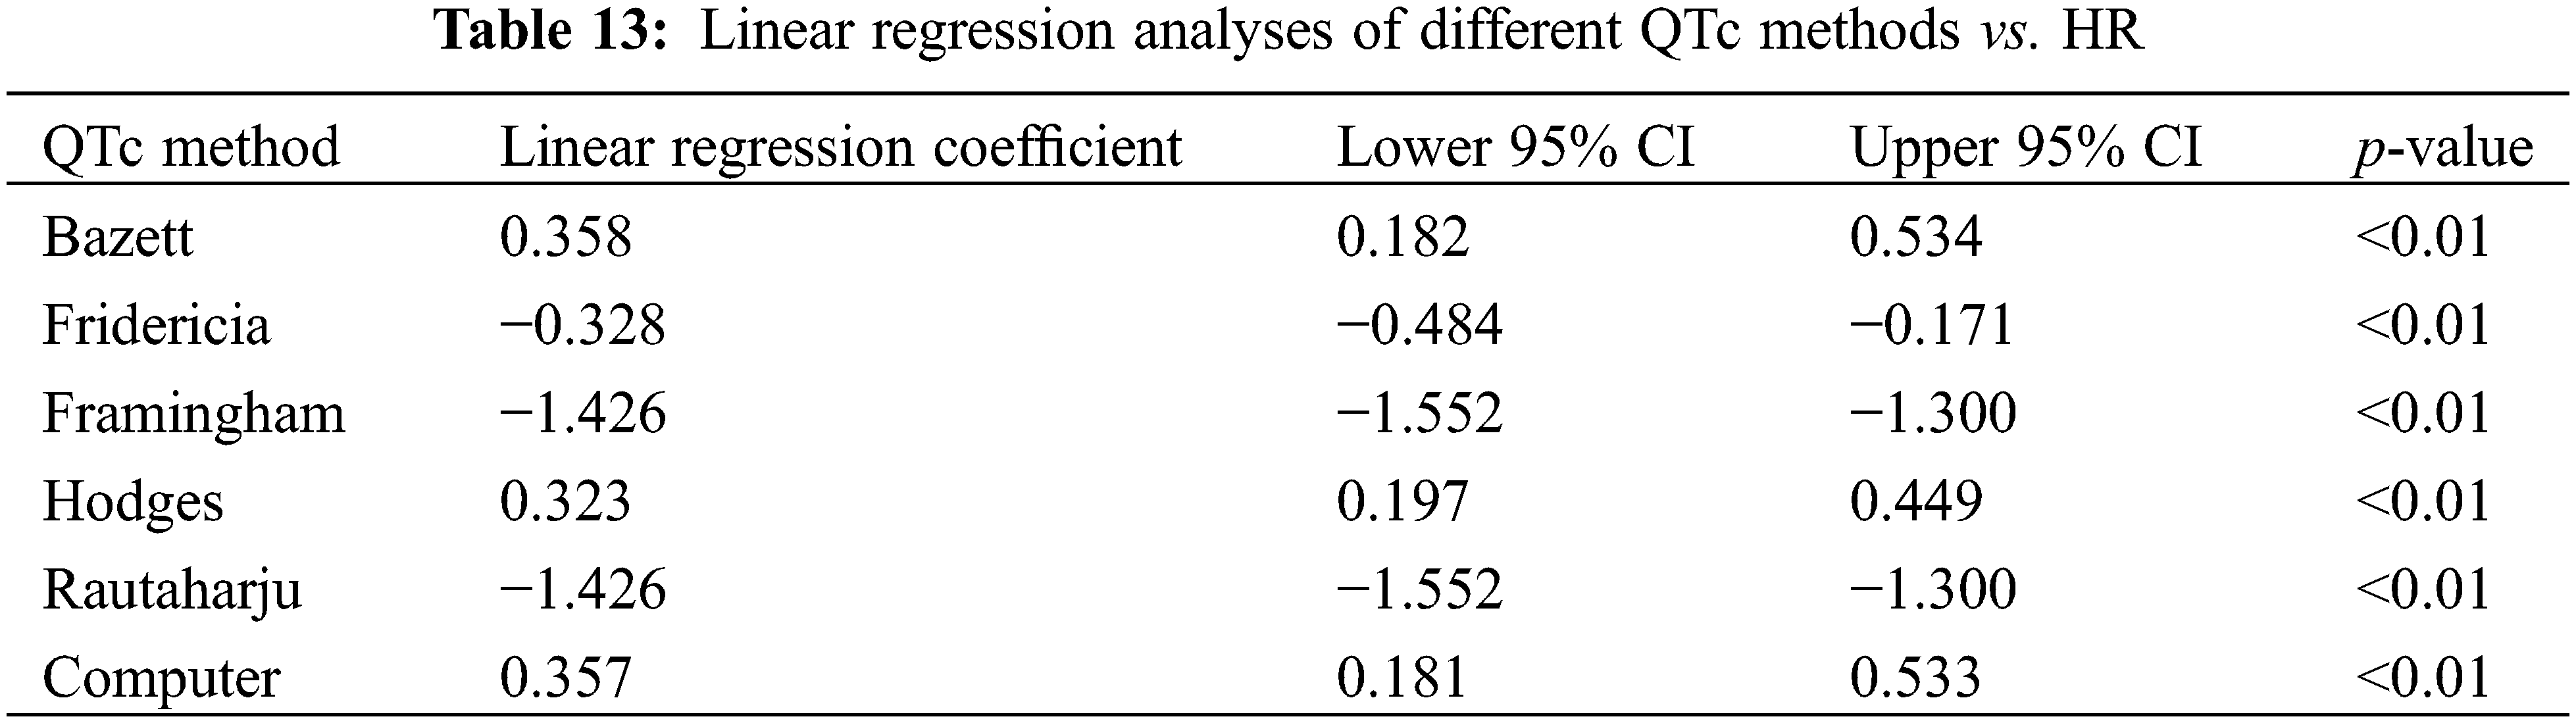
The linear regression analysis for the new cohort (N = 90) showed Hodges to have the lowest absolute value of slope (0.323, p < 0.01), closely followed by Fridericia (0.328, p < 0.01), Computer (0.357, p < 0.01), and Bazett (0.358, p < 0.01 (Table 13). These results differed slightly from those derived from all participants in which Bazett had the lowest absolute value of slope (0.324, p < 0.01), followed by Computer (0.325, p < 0.01), Hodges (0.329, p < 0.01), and Fridericia (0.348, p < 0.01).
The results of analyses comparing QTc to RR interval were the additive inverse of their corresponding QTc vs. HR calculations, reflecting the inverse relationship between RR and HR.
In the Bland-Altman analysis, Framingham and Rautaharju showed a bias approaching 0 (bias = −0.012, 95% CI: −0.018, −0.006) with a narrow 95% limits of agreement (−0.0235, 0.0007). Computer and Bazett also had a bias close to 0 (bias = −0.750, 95% CI: −1.277, −0.223) with good agreement (−1.7834, 0.284). Fridericia and Hodges had a low bias (bias = −8.967, 95% CI: −27.578, 9.644), but poor agreement (−45.4449, 27.5102). These results mirrored that of the entire data set (N = 95).
Over 25 formulae have been proposed to correct for the HR-dependence of the QT interval, testifying to the controversy surrounding the endeavor towards a universal formula [23]. Existing methods have been repeatedly criticized with numerous attempts to identify more appropriate ones. Studies noting an intra-subject variability in the QT/HR relationship have further complicated the endeavor, suggesting the need for an individual QT correction method derived from subject-specific data [24–26]. Still, other studies recommend accounting for age or sex differences in QT interval [27].
Despite the controversy, Bazett continues to be most widely implemented in clinical practice, including pediatrics. The Schwartz scoring system for the clinical diagnosis of LQTS, for example, integrates the Bazett method to calculate for risk of disease [28]. As Bazett is known to over-correct QT at higher HRs [10], the use of the formula is of especial concern in the pediatric population where the normal HR of neonates ranges from 110 to 160 bpm, and children’s HR do not decrease to below 100 bpm until adolescence. In a study of 332 children with a mean age of 10.7 years, Bazett led to a high number of false positives in LTQS screening; results were exacerbated by increases in HR due to postural maneuvering [11]. Additionally, in a study of 54 healthy children with a median age of 9.9 years, Bazett (as well as Hodges) had a positive QTc and HR relationship, resulting in a prolonged QTc at peak exercise; the study recommended the use of Fridericia or Framingham calculated at one minute after maximum exercise for superior congenital LQTS assessment [29]. Our study provides additional evidence that Bazett over-corrects at higher HRs.
Still, other studies support the continued use of Bazett in pediatric cardiology [13,30–34]. In a study of 2,500 randomly selected ECGs from neonates, Bazett provided the most HR independent QT correction and accurately identified neonates affected by LQTS [34]. In a larger scale prospective study of more than 33,000 infants, Bazett successfully identified infants with a prolonged QTc and at significant risk for sudden death [30]. In a review of ECGs from 702 children with 81% less than 2 years of age, Bazett produced the most consistent QTc values across HRs with the support of 460 ms as the best threshold for prolonged QTc [33].
In our study, Fridericia was most independent of HR and RR. This finding supports the conclusion of other studies, which report Fridericia to provide more consistent calculations at faster HRs [24,29,35]. A study on children and adolescents from six to 17 years of age found the ideal HR correction formula to be QTc = QT/(RR0.38), which most closely resembles the Fridericia formula [36]. Regulatory agencies such as the U.S. Food and Drug Administration recommend the concurrent use of Fridericia and Bazett in clinical trials on drug safety [37,38]. The robustness of Fridericia to changes in HR may attribute to the method of formula development, which studied the QT/HR relationship to identify a coefficient that would minimize the impact of RR on QTc [6,10]. The Bazett formula, alternatively, was not based on such population-based calculations [5].
Framingham and Rautaharju had strong correlations with HR and RR in our study. Our study does not recommend the use of these formulae for QT correction, although the limitations of our study, including its small sample size, must be considered. Hodges had modest performance in the Spearman’s rank correlation and linear regression analyses against HR and RR.
Computer-calculated Bazett formula performed equally with a manual calculation of Bazett in our population. Our findings suggest that if Bazett is an appropriate and validated formula for QTc calculation in the pediatric population as seen in other studies, the computer algorithm may be a comparable screening tool to detect QTc prolongation. Computer-derived algorithms and QTc calculators on smart devices may represent valuable point of care resources in settings outside of cardiology practice where health professionals may be less familiar with measuring QT intervals [39]. Moreover, given intrinsic variations in manual QT measurement across health care personnel and facilities, a standardized method of measurement through a computer device may increase both the diagnosis and monitoring of patients with prolonged QTc. Studies on the accuracy and reliability of computer-based algorithms and QTc calculators remain conflicting, however [40,41], with many displaying good precision, but low accuracy [41,42].
Limitations of our study include its retrospective design and small population size consisting of only healthy patients (N = 95). Despite a small sample size, statistically significant differences were observed between formulae. As a community hospital, our population may not be representative of other pediatric populations. Larger scale prospective studies are needed to confirm our findings. Our study assessed the performance of QTc formulae against variations in HR and RR across individuals, while variations in the parameters have also been noted within individuals.
Many formulae have been proposed to decrease the impact of HR on QT with conflicting perspectives on the ideal formula for pediatric practice. While Bazett remains most utilized, many have raised concerns regarding the formula’s tendency to over-correct at higher HRs. This finding is especially relevant to the pediatric population, which is characterized by extremes of HR, particularly within neonates. Our findings support the use of Fridericia to minimize the influence of HR on QT. Manual and computer algorithm-based calculations of Bazett exhibited moderate linear correlations with HR and RR, while Framingham and Rautaharju had strong correlations. The results of our study must be weighed against its limitations, including a small population size. If Bazett is a reliable and valid method of QT correction as seen in other pediatric study cohorts, our findings suggest that the computer algorithm may be a comparable method for use in clinical practice to standardize QT assessment.
Acknowledgement: None.
Funding Statement: No funding was obtained for this study.
Author Contributions: Study conception and design: KK, IK, YL, ON, BB, MC; data collection: IK, AM, ON, MC; analysis and interpretation of results: KK, IK, YL, WK, AM, ON, BB, MC; draft manuscript preparation: KK, IK, YL, WK, AM, ON, BB, MC. All authors reviewed the results and approved the final version of the manuscript.
Availability of Data and Materials: Statistical data and analyses are available within the text of the article.
Ethics Approval: This study was reviewed and approved by the New York-Presbyterian Brooklyn Methodist Hospital Institutional Review Committee. The study follows the guidelines outlined in the Declaration of Helsinki.
Conflicts of Interest: The authors declare that they have no conflicts of interest to report regarding the present study.
References
1. Kautzner J. QT interval measurements. Card Electrophysiol Rev. 2002;6(3):273–7. [Google Scholar] [PubMed]
2. Hiniesto-Iñigo I, Castro-Gonzalez LM, Corradi V, Skarsfeldt MA, Yazdi S, Lundholm S, et al. Endocannabinoids enhance hKV7.1/KCNE1 channel function and shorten the cardiac action potential and QT interval. EBioMed. 2023;89:104459. [Google Scholar]
3. Ingles J, Semsarian C. Time to rethink the genetic architecture of long QT syndrome. Circulation. 2020;141:440–3. [Google Scholar] [PubMed]
4. Nakano Y, Shimizu W. Genetics of long-QT syndrome. J Hum Genet. 2016;61:51–5. [Google Scholar] [PubMed]
5. Bazett HC. An analysis of the time-relations of electrocardiograms. Ann Noninvas Electro. 2006;2(2):177–94. [Google Scholar]
6. Fridericia LS. The duration of systole in an electrocardiogram in normal humans and in patients with heart disease. Ann Noninvasive Electrocardiol. 2003;8(4):343–51. [Google Scholar] [PubMed]
7. Taran LM, Szilagyi N. The duration of the electrical systole (Q-T) in acute rheumatic carditis in children. Am Heart J. 1947;33(1):14–26. [Google Scholar] [PubMed]
8. Abrahams DG. The Q-T interval in acute rheumatic carditis. Br Heart J. 1949;11(4):342–9. [Google Scholar] [PubMed]
9. Moss AJ. Introductory note to a translated classic article of L. S. Fridericia. Ann Noninvasive Electrocardiol. 2003;8(4):341–2. [Google Scholar]
10. Sagie A, Larson MG, Goldberg RJ, Bengtson JR, Levy D. An improved method for adjusting the QT interval for heart rate (the Framingham Heart Study). Am J Cardiol. 1992;70(7):797–801. [Google Scholar] [PubMed]
11. Hodges M, Salerno D, Erlien D. Bazett’s QT correction reviewed. Evidence that a linear QT correction for heart rate is better. J Am Coll Cardiol. 1983;1:694. [Google Scholar]
12. Rautaharju PM, Mason JW, Akiyama T. New age- and sex-specific criteria for QT prolongation based on rate correction formulas that minimize bias at the upper normal limits. Int J Cardiol. 2014;174(3):535–40. [Google Scholar] [PubMed]
13. Dahlberg P, Diamant UB, Gilljam T, Rydberg A, Bergfeldt L. QT correction using Bazett’s formula remains preferable in long QT syndrome type 1 and 2. Ann Noninvas Electro. 2021;26(1):e12804. [Google Scholar]
14. Aytemir K, Maarouf N, Gallagher MM, Yap YG, Waktare JEP, Malik M. Comparison of formulae for heart rate correction of QT interval in exercise electrocardiograms. Pacing Clin Electrophysiol. 1999;22(9):1397–401. [Google Scholar] [PubMed]
15. Gueta I, Klempfner R, Markovits N, Halkin H, Segev S, Rott D, et al. Clinically significant incidental QTc prolongation is subject to within-individual variability. Ann Noninvas Electro. 2020;25(2):e12699. [Google Scholar]
16. Batchvarov VN, Ghuran A, Smetana P, Hnatkova K, Harries M, Dilaveris P, et al. QT-RR relationship in healthy subjects exhibits substantial intersubject variability and high intrasubject stability. Am J Physiol Heart Circ Physiol. 2002;282(6):51–6. [Google Scholar]
17. Molnar J, Weiss J, Zhang F, Rosenthal JE. Evaluation of five QT correction formulas using a software-assisted method of continuous QT measurement from 24-hour holter recordings. Am J Cardiol. 1996;78(8):920–6. [Google Scholar] [PubMed]
18. GE Healthcare MarquetteTM 12SLTM ECG Analysis Program Physician’s Guide. Available from: http://apps.gehealthcare.com/servlet/ClientServlet?REQ=Enter+Documentation+Library (accessed on 30/11/2023). [Google Scholar]
19. Luo S, Michler K, Johnston P, MacFarlane PW. A comparison of commonly used QT correction formulae: the effect of heart rate on the QTc of normal ECGs. J Electrocardiol. 2004;37:81–90 [Google Scholar] [PubMed]
20. Simonson E. The normal variability of the electrocardiogram as a basis for differentiation between “normal” and “abnormal” in clinical electrocardiography. Am Heart J. 1958;55(1):80–103. [Google Scholar] [PubMed]
21. Al-Akchar M, Siddique MS. Long QT syndrome. Treasure Island (FLStatPearls Publishing; 2022. [Google Scholar]
22. Andric T, Winckel K, Tanzer TD, Hollingworth S, Smith L, Isoardi K, et al. Estimation of cardiac QTc intervals in people prescribed antipsychotics: a comparison of correction factors. Ther Adv Psychopharmacol. 2022;12:20451253221104947. [Google Scholar] [PubMed]
23. Rabkin SW. Nomenclature, categorization and usage of formulae to adjust QT interval for heart rate. World J Cardiol. 2015;7(6):315–25. [Google Scholar] [PubMed]
24. Andršová I, Hnatkova K, Helánová K, Šišáková M, Novotný T, Kala P, et al. Problems with Bazett QTc correction in paediatric screening of prolonged QTc interval. BMC Pediatr. 2020;20(1):558. [Google Scholar] [PubMed]
25. Malik M, Färbom P, Batchvarov V, Hnatkova K, Camm AJ. Relation between QT and RR intervals is highly individual among healthy subjects: implications for heart rate correction of the QT interval. Heart. 2002;87(3):220–8. [Google Scholar] [PubMed]
26. Ether ND, Jantre SR, Sharma DB, Leishman DJ, Bailie MB, Lauver DA. Improving corrected QT; Why individual correction is not enough. J Pharmacol Toxicol Methods. 2022;113:107126. [Google Scholar] [PubMed]
27. Vandenberk B, Vandael E, Robyns T, Vandenberghe J, Garweg C, Foulon V, et al. Which QT correction formulae to use for QT monitoring? J Am Heart Assoc. 2016;5(6):e003264. [Google Scholar] [PubMed]
28. Schwartz PJ, Crotti L. QTc behavior during exercise and genetic testing for the long-QT syndrome. Circ. 2011;124:2181–4. [Google Scholar]
29. Benatar A, Decraene T. Comparison of formulae for heart rate correction of QT interval in exercise ECGS from healthy children. Heart. 2001;86(2):199–202. [Google Scholar] [PubMed]
30. Schwartz PJ, Stramba-Badiale M, Segantini A, Austoni P, Bosi G, Giorgetti R, et al. Prolongation of the QT interval and the sudden infant death syndrome. New Engl J Med. 1998;338(24):1709–14. [Google Scholar] [PubMed]
31. Schwartz PJ, Stramba-Badiale M, Crotti L, Pedrazzini M, Besana A, Bosi G, et al. Prevalence of the congenital long-QT syndrome. Circ. 2009;120(18):1761–7. [Google Scholar]
32. Qiu H, Bird GL, Qu L, Vetter VL, White PS. Evaluation of QT interval correction methods in normal pediatric resting ECGs. Comput Cardiol. 2007:431–4. [Google Scholar]
33. Phan DQ, Silka MJ, Lan YT, Chang RKR. Comparison of formulas for calculation of the corrected QT interval in infants and young children. J Pediatr. 2015;166(4):960–4. [Google Scholar] [PubMed]
34. Stramba-Badiale M, Karnad DR, Goulene KM, Panicker GK, Dagradi F, Spazzolini C, et al. For neonatal ECG screening there is no reason to relinquish old Bazett’s correction. Eur Heart J. 2018;39(31):2888–95. [Google Scholar] [PubMed]
35. van der Wall HEC, Gal P, Kemme MJB, van Westen GJP, Burggraaf J. Number of ECG replicates and QT correction formula influences the estimated QT prolonging effect of a drug. J Cardiovasc Pharmacol. 2019;73(4):257–64. [Google Scholar] [PubMed]
36. Wernicke JF, Faries D, Breitung R, Girod D. QT correction methods in children and adolescents. J Cardiovasc Electrophysiol. 2005;16(1):76–81. [Google Scholar] [PubMed]
37. ICH Expert Working Group. The clinical evaluation of QT/QTc interval prolongation and proarrhythmic potential for non-antiarrhythmic drugs. Fed Regist. 2005;61134–5. [Google Scholar]
38. van de Water A, Verheyen J, Xhonneux R, Reneman RS. An improved method to correct the QT interval of the electrocardiogram for changes in heart rate. J Pharmacol Methods. 1989;22(3):207–17. [Google Scholar] [PubMed]
39. Rosenblum AL, Dremonas AC, Stockholm SC, Biondi NL. A retrospective analysis of hospital electrocardiogram auto-populated QT interval calculation. Cureus. 2020:e9317. [Google Scholar]
40. Giudicessi JR, Schram M, Bos JM, Galloway CD, Shreibati JB, Johnson PW, et al. Artificial intelligence-enabled assessment of the heart rate corrected QT interval using a mobile electrocardiogram device. Circ. 2021;143(13):1274–86. [Google Scholar]
41. Hunt AC. Accuracy of popular automatic QT interval algorithms assessed by a gold standard and comparison with a novel method: computer simulation study. BMC Cardiovasc Disord. 2005;5:29. [Google Scholar] [PubMed]
42. Indraratna P, Tardo D, Delves M, Szirt R, Ng B. Measurement and management of QT interval prolongation for general physicians. J Gen Intern Med. 2020;35:865–73. [Google Scholar] [PubMed]
Cite This Article
 Copyright © 2024 The Author(s). Published by Tech Science Press.
This work is licensed under a Creative Commons Attribution 4.0 International License , which permits unrestricted use, distribution, and reproduction in any medium, provided the original work is properly cited.
 Downloads
 Citation Tools