
 Submit a Paper
 Propose a Special lssue
 Open Access
ARTICLE

Integrated Bioinformatics Analysis Identifies Vascular Endothelial Cell-Related Biomarkers for Hypertrophic Cardiomyopathy
1 Department of Cardiology, Nantong Third People’s Hospital and the Third People’s Hospital Affiliated to Nantong University, Nantong, 226000, China
2 Department of Intensive Care Unit, Tumor Hospital Affiliated to Nantong University, Nantong Tumor Hospital, Nantong, 226300, China
* Corresponding Author: Yong Tao. Email:
Congenital Heart Disease 2024, 19(6), 653-669. https://doi.org/10.32604/chd.2025.060406
Received 31 October 2024; Accepted 16 January 2025; Issue published 27 January 2025
 View Full Text
 Download PDF
Abstract
Background: Previous studies combined integrated scRNA-seq with bulk RNA data to screen biomarkers for cardiomyopathy. This study extended this approach to identify biomarkers specific for hypertrophic cardiomyopathy (HCM). Methods: Datasets GSE36961, GSE130036, GSE249925 and GSE203274 were analyzed in this study. ScRNA-seq analysis was employed to identify distinct cell populations. Differentially expression analysis was conducted to screen vascular endothelial cells (VECs)-related feature genes. After calculating VECs score, WGCNA was used to correlate gene modules with the VECs score. Key HCM biomarkers were determined using random forest analysis, and LASSO regression analyses to construct a diagnostic model based on their diagnostic efficacy and differential expression. Results: Our analysis identified nine distinct cell populations, with VECs accounting for a notably higher proportion in HCM samples. Genes associated with the VECs were enriched in the pathways related to blood vessel, immunity and cardiac function. After classifying significant gene modules based on VEC-related genes, a strong correlation between the blue module and the VECs score was detected. Notably, genes in the blue module were enriched in the pathways related to metabolism and immune response. Key genes with a high expression in HCM were determined by intersecting differentially expressed genes (DEGs) in HCM with those in the blue module. Finally, random forest analysis and LASSO regression analysis identified five central hub genes for the diagnosis of HCM, including Dual Specificity Tyrosine Phosphorylation Regulated Kinase 1B (DYRK1B), Growth Arrest and DNA Damage Inducible Alpha (GADD45A), Influenza Virus NS1A Binding Protein (IVNS1ABP), Leiomodin 2 (LMOD2), and Pleckstrin Homology Like Domain Family B Member 2 (PHLDB2). Conclusion: Collectively, our study discovered novel VEC-related biomarkers for HCM and comprehensively examined the mechanisms underlying the pathogenesis of HCM.Keywords
Abbreviations
| HCM | Hypertrophic cardiomyopathy |
| TTE | Transthoracic echocardiogram |
| VEC | Vascular endothelial cell |
| VEGF | Vascular endothelial growth factor |
| CVD | Cardiovascular disease |
| scRNA-seq | Single-cell RNA sequencing |
| GEO | Gene expression omnibus |
| PCA | Principal component analysis |
| UMAP | Uniform manifold approximation and projection |
| MM | Module Membership |
| GS | Gene Significance |
| DEGs | Differentially expressed genes |
| ssGSEA | Single sample gene set enrichment analysis |
| WGCNA | Weighted co-expression network analysis |
| Mad | Median absolute deviation |
| TOM | Topological overlap matrix |
| ME | Module Eigengene |
| OOB | Out-of-bag |
| LASSO | Least absolute shrinkage and selection operator |
| DYRK1B | Dual Specificity Tyrosine Phosphorylation Regulated Kinase 1B |
| GADD45A | Growth Arrest And DNA Damage Inducible Alpha |
| IVNS1ABP | Influenza Virus NS1A Binding Protein |
| LMOD2 | Leiomodin 2 |
| ROC | Receiver operating characteristics |
| AUC | Area under the curve |
| STAT3 | Signal transducer and transcription activator 3 |
| qPCR | Quantitative polymerase chain reaction |
| NFAT | Nuclear factor of activated T cells |
As a frequently diagnosed heart disease, hypertrophic cardiomyopathy (HCM) is traditionally considered as a monogenic disorder characterized by complex phenotypic and genetic expression [1,2]. The diagnosis and management of HCM necessitate a multimodal imaging approach, with transthoracic echocardiogram (TTE) serving as the primary diagnostic imaging modality for HCM [3]. Additionally, genetic testing has emerged as a valuable tool for improving our understanding of genotype-phenotype correlations in HCM [4]. However, despite significant advancements in deciphering the genetic basis of HCM, the cellular mechanisms underlying its pathogenesis are not fully understood [5].
The endothelium is a cell layer lining blood vessels that regulates homeostasis, vascular tone, inflammation, and platelet activity [6–8]. Endothelial dysfunction is characterized by altered endothelial functions, including a range of nonadaptive modifications in functional phenotype that could lead to dysregulation in diverse processes such as hemostasis and thrombosis, vascular tone and redox balance and inflammation [9–11]. Vascular endothelial cells (VECs), which form the innermost layer of blood vessels, are crucial for the development of functional circulatory system and its maintenance and provide paracrine support for non-vascular cells [12]. For instance, VECs release signaling molecules to modulate the systolic response of cardiomyocytes [13]. Studies found that VECs influence the occurrence of HCM by releasing and responding to vascular endothelial growth factors (VEGFs), thereby affecting angiogenesis and interacting with immune cells [14,15]. Understanding the relationship between VEC-related genes and HCM could provide novel insights into the pathogenesis of HCM. However, the mechanisms by which VECs contribute to HCM still remain elusive and require further investigation.
Recent emphasis on population health has underscored the importance of utilizing big data to inform public health interventions and prevent cardiovascular diseases (CVDs) [16]. In the field of cardiology, machine learning and big-data analytics are applied to predict individual risk factors for CVD and to support clinical decision-making through genomic information [17]. Advances in scRNA-seq technology have greatly contributed to the biomedical researches, allowing not only for the profiling of single-cell transcriptomes, but also the discovery of novel or rare cell types at single-cell resolution [18,19]. For instance, integrative scRNA-seq analysis has revealed a disease-relevant vascular cell states and markers in atherosclerosis [18]. Another scRNA-seq analysis explored the cellular heterogeneity and stem cells of VECs involved in the formation and hemostasis of blood vessel [20]. A preliminary research applied scRNA-seq to HCM, highlighting the heterogeneity of cardiomyocytes and the molecular events in HCM [21]. Here, we extended the application of scRNA-seq to HCM to further investigate the specific roles of VECs in HCM and to discover VEC-relevant biomarkers, aiming to elucidate the mechanisms underlying the pathogenesis of HCM.
2.1 Data Source and Processing
The datasets GSE36961, GSE130036 and GSE249925 were collected from Gene Expression Omnibus (GEO). The chip data from these datasets were processed, and the probes were converted to symbols based on the annotation files. The dataset GSE36961 containing 39 control and 106 HCM samples was designated as the training set. For the validation datasets, 9 control and 28 HCM samples were obtained from GSE130036, and the GSE249925 dataset comprised 23 controls and 97 HCM cases.
Another dataset GSE203274 from GEO included 12 control and 2 HCM samples. These samples were subjected to the scRNA-seq analysis using 10× Genomics on both NextSeq 500 and NovaSeq 6000 systems.
The Seurat object was created using the “CreateSeuratObject” function in the Seurat package [22]. Cells were filtered to include only those with gene counts between 200 and 6000 and mitochondrial gene content less than 20%. These eligible cells were normalized with the “NormalizeData” function to adjust for sequencing depth. Subsequently, the 2000 most variable genes were identified using the “FindVariableFeatures” function for subsequent analyses. After data normalization, principal component analysis (PCA) was performed to reduce dimensionality using the “RunPCA” function. To remove the batch effect, the “RunHarmony” function in the harmony package [23] was utilized with lambda = 0.5 and max.iter.harmony = 50. Moreover, the first 50 PCs were evaluated using the “ElbowPlot”. Next, clustering analysis was conducted using the “FindNeighbors” (dims = 1:30) and “FindClusters” (resolution = 0.1) functions. Then, dimensionality reduction function “RunUMAP” was used for data visualization. Finally, based on the marker genes provided by the CellMarker2.0 database, the “FindAllMarkers” function was employed to annotate cell types.
2.3 Identification of VECs-Related Feature Genes
To investigate the heterogeneity in gene expression across cell populations, differential gene expression was analyzed using the “FindAllMarkers” function (parameters: logfc.threshold = 0.25, min.pct = 0.25 and only.pos = TRUE). The DEGs in VECs were then intersected with those from both HCM and control samples to identify the VEC-related feature genes. The feature genes were further subjected to ssGSEA to calculate the VECs score.
2.4 Identification of Differentially Expressed Genes (DEGs)
The R package “limma” was used to screen DEGs based on the mRNA expression profile data of GSE36961 under the screening threshold of p < 0.05 and log2FC > log2(1.5).
2.5 Weighted Co-Expression Network Analysis (WGCNA)
WGCNA was employed to identify gene modules related to the characteristic scores of VECs [24]. Firstly, genes with relatively low variances were removed after data preprocessing while retaining only those with significant variations. Specifically, the median absolute deviation (mad) metric was utilized to screen genes under a threshold of 0.01 to select the top 75% of genes with the highest variations. Subsequently, the appropriate soft threshold β was determined by the “pickSoftThreshold” function [25]. Next, a weighted adjacency matrix was constructed and the topological overlap matrix (TOM) was further calculated. Genes were clustered by the hierarchical clustering method, with topological dissimilarity (dissTOM) as the distance metric. To ensure a more refined module segmentation, deepSplit = 2 was set to adjust the clustering depth. The minimum number of genes in a module was 60 and mergeCutHeight = 0.3 was the cut height to merge close modules. To analyze the relationship between gene modules and VECs scores, the Module Eigengene (ME) for each module was first calculated. Then, module-trait correlation analysis was conducted by calculating Pearson correlation coefficient between each module and VECs scores, with corresponding p-value computed by the corPvalueStudent function. The relationships were visualized into a heat map to identify important modules related to the functions of VECs. To gain a deeper understanding of the characteristics of genes within these modules, Gene Module Membership (MM) and Gene Significance (GS) and the VECs score were analyzed. The relationship between MM and GS was visualized into a scatter plot.
2.6 Identification of Candidate Biomarkers
The DEGs and module genes were intersected to collect common genes for machine learning analysis. The “randomForest” function of the randomForest R package was applied to construct a random forest model [26,27]. The number of variables (mtry) in the binary tree at the specified node and the number of decision trees (ntree) in the model were determined based on the mean error rate from out-of-bag (OOB) samples and the relationship between the error of the model and the number of decision tree. A random forest model was then developed using these variables and the top 10 important genes were identified by MeandecreaseAccuracy and MeandecreaseGini, respectively.
The number of key biomarkers were further reduced by LASSO regression analysis. In LASSO analysis, lambda (λ) is a critical parameter that determines the penalty strength applied to the coefficients. Using the glmnet R package, the optimal λ value was determined by 10-fold cross-validation analysis (the parameters nfolds = 10 and family = ‘binomial’) to select key markers [28].
2.7 Construction of a Diagnostic Model
The hub genes related to HCM were identified from the intersection of the results from the random forest analysis and LASSO regression analysis, serving as the biomarkers in this study. Next, the diagnostic efficacy and differential expression of each hub gene were analyzed.
All computational analyses were performed in R software (version 3.6.0). The differences between two continuous variables were compared with Wilcoxon rank-sum test and the correlation was calculated via the Spearman method. A p-value < 0.05 signified a statistical significance.
3.1 Single-Cell Landscape in HCM
Quality analysis of scRNA-seq data presented a significant improvement after preprocessing than before (Fig. S1A,B). In addition, the elbow plot of PCA showed that the first 30 PCs accounted for most of the variances in the dataset (Fig. S1C), therefore these first 30 PCs were used for downstream analyses.
Single-cell clustering and annotation were performed on the normal and HCM samples (total number = 14). The UMAP plot displayed 9 main cell populations, namely, cardiomyocytes cells, VECs, fibroblast cells, pericyte cells, macrophage/monocyte cells, stem cells, smooth muscle cells, T cells and neutrophil cells (Fig. 1A). Comparison on the expression of marker genes demonstrated that CDH5 and CLDN5 were most prominently expressed in VECs (Fig. 1B,C). Thereafter, we analyzed the proportions of these cell populations in normal and HCM samples. Notably, cardiomyocytes and VECs constituted a significant proportion in both sample types (Fig. 1D). The percentage of VECs was relatively higher in HCM samples than in normal samples (Fig. 1E). Here, we developed the single-cell landscape in HCM and identified nine major cell populations.
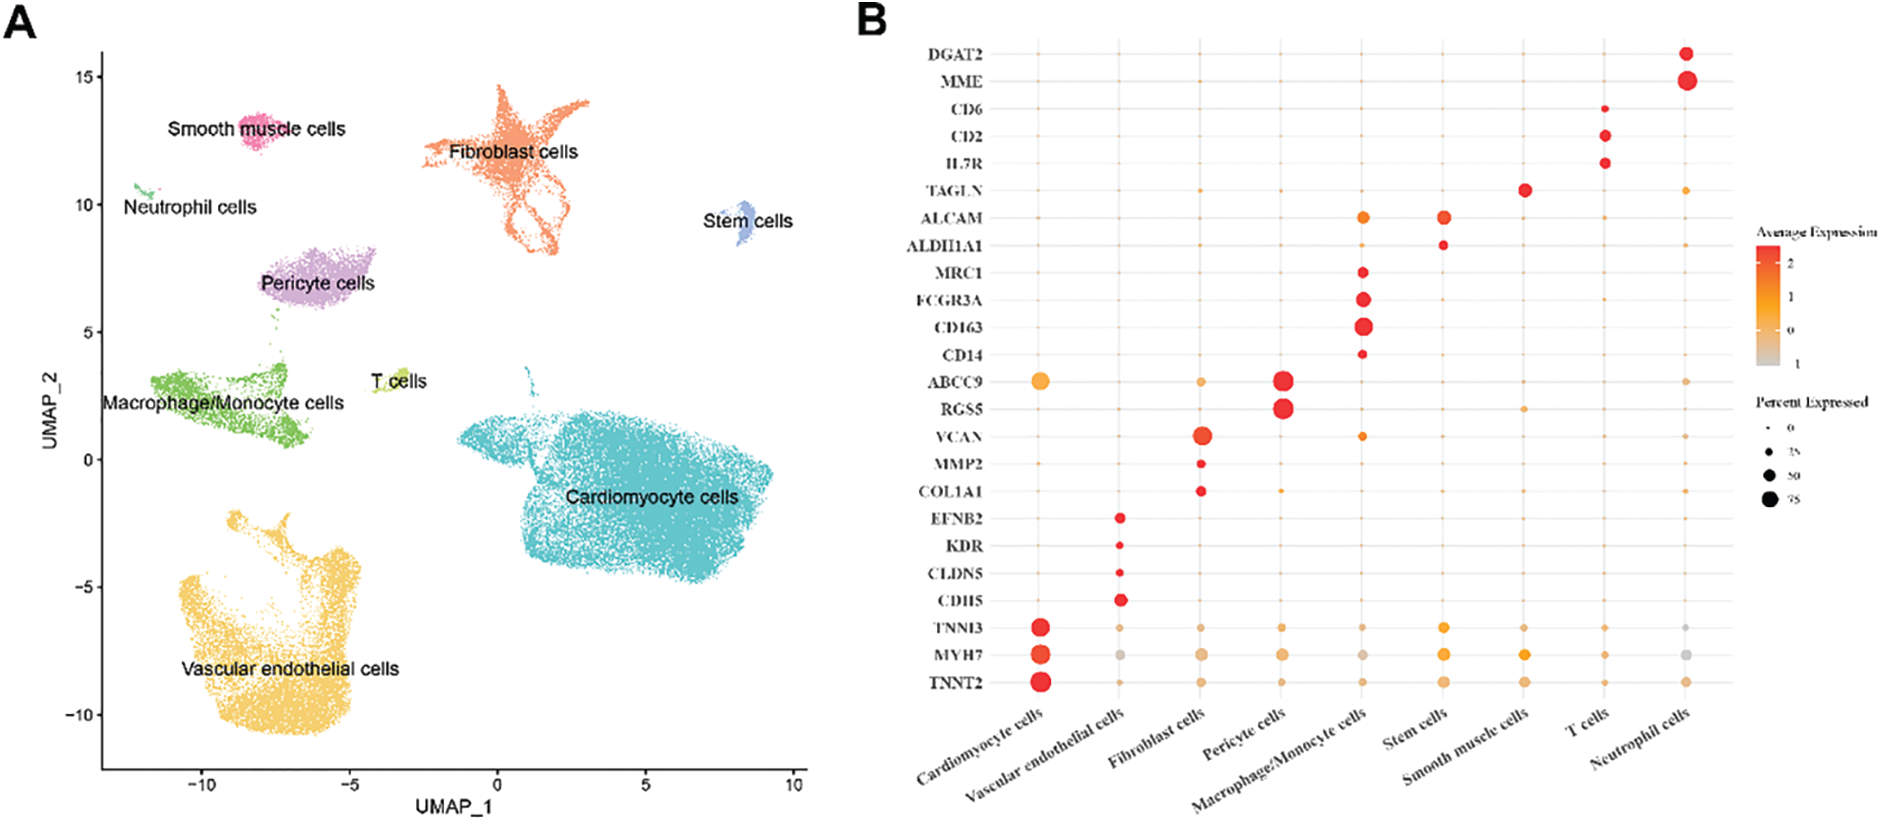
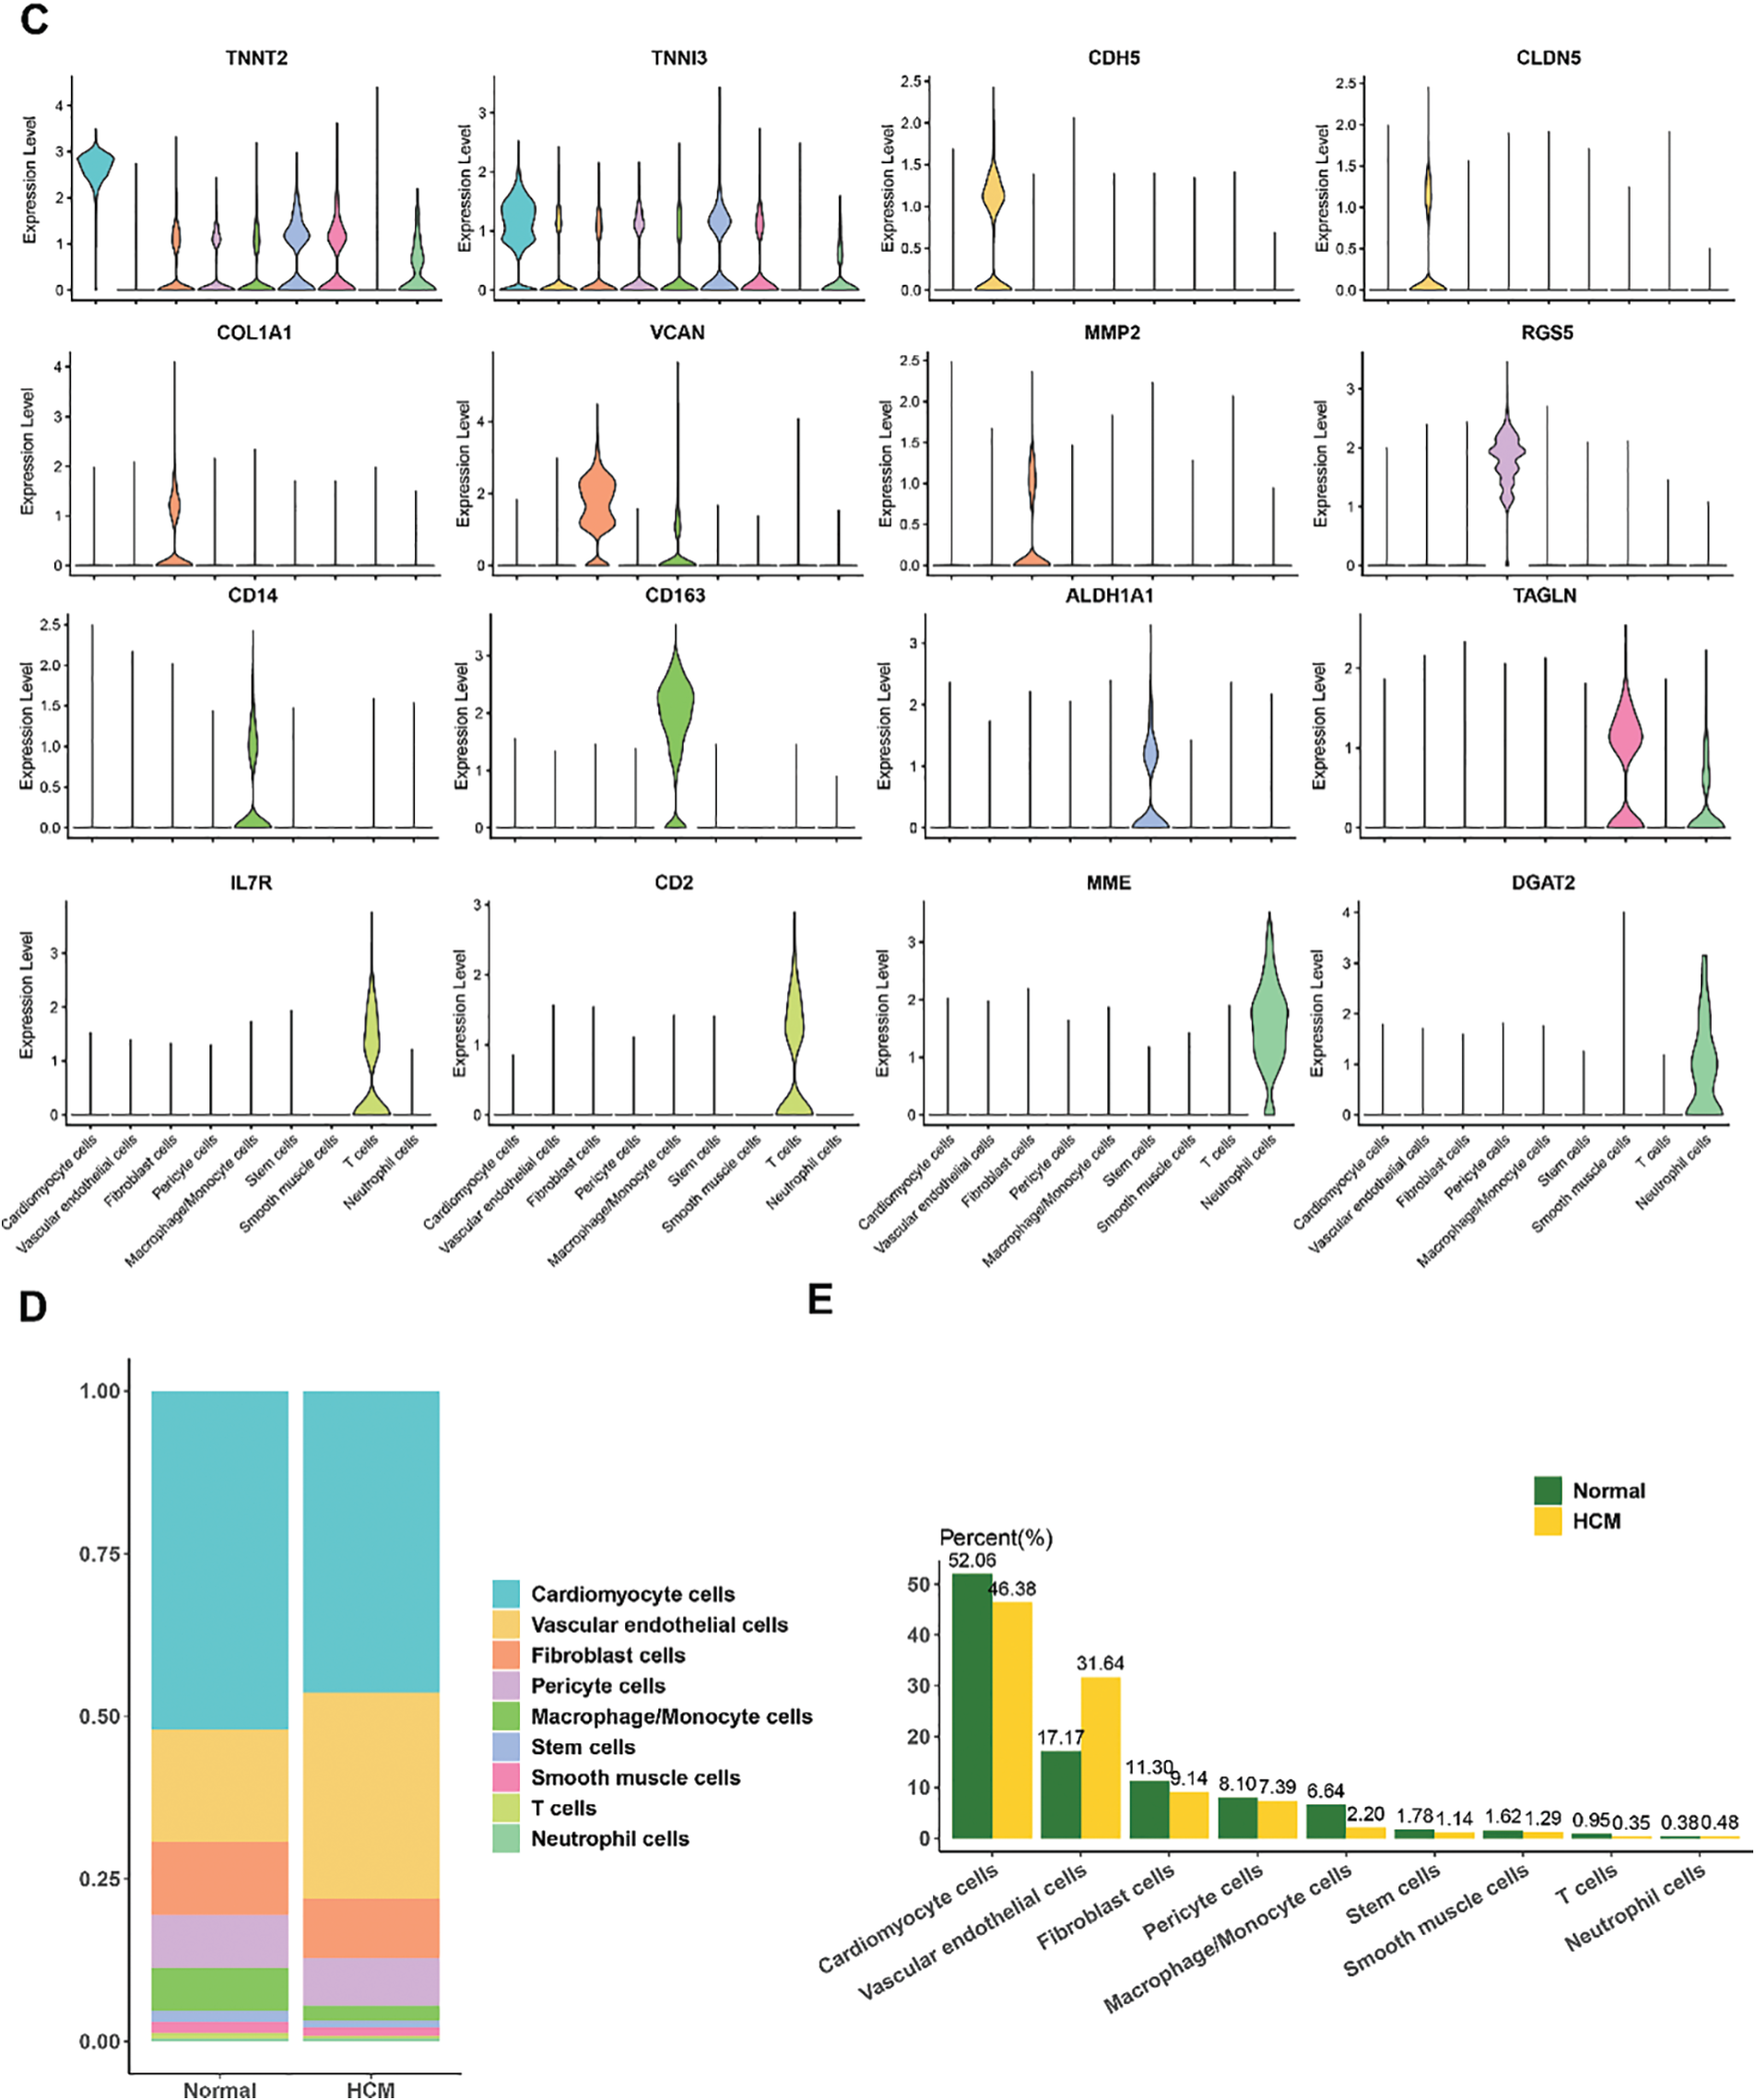
Figure 1: Single-cell landscape in HCM. (A) UMAP plot showing nine main cell populations based on the HCM and normal samples. (B) Bubble plot of the expression levels of the marker genes annotating each cell population. (C) Violin plots of the expression levels of marker genes for nine different subpopulation cell types. (D,E) Percentage of each cell population in HCM and normal samples
3.2 Functional Enrichment Analysis and Identification of VEC-Related Feature Genes
To explore the heterogeneous gene expression patterns across the cell populations, differentially upregulated genes in the cell populations were identified (Fig. 2A). As the percentage of VECs was relatively higher in HCM samples, pathway enrichment analysis was conducted on the upregulated genes in VECs. The results (Fig. 2B) showed that these genes were mainly enriched in pathways related to blood vessel (e.g., vasculogenesis, VEGF signaling pathway and positive regulation of blood vessel endothelial cell migration), immunity (e.g., T cell receptor signaling pathway and B cell receptor signaling pathway) and cardiac processes (e.g., heart morphogenesis, heart development and cardiac atrium morphogenesis).
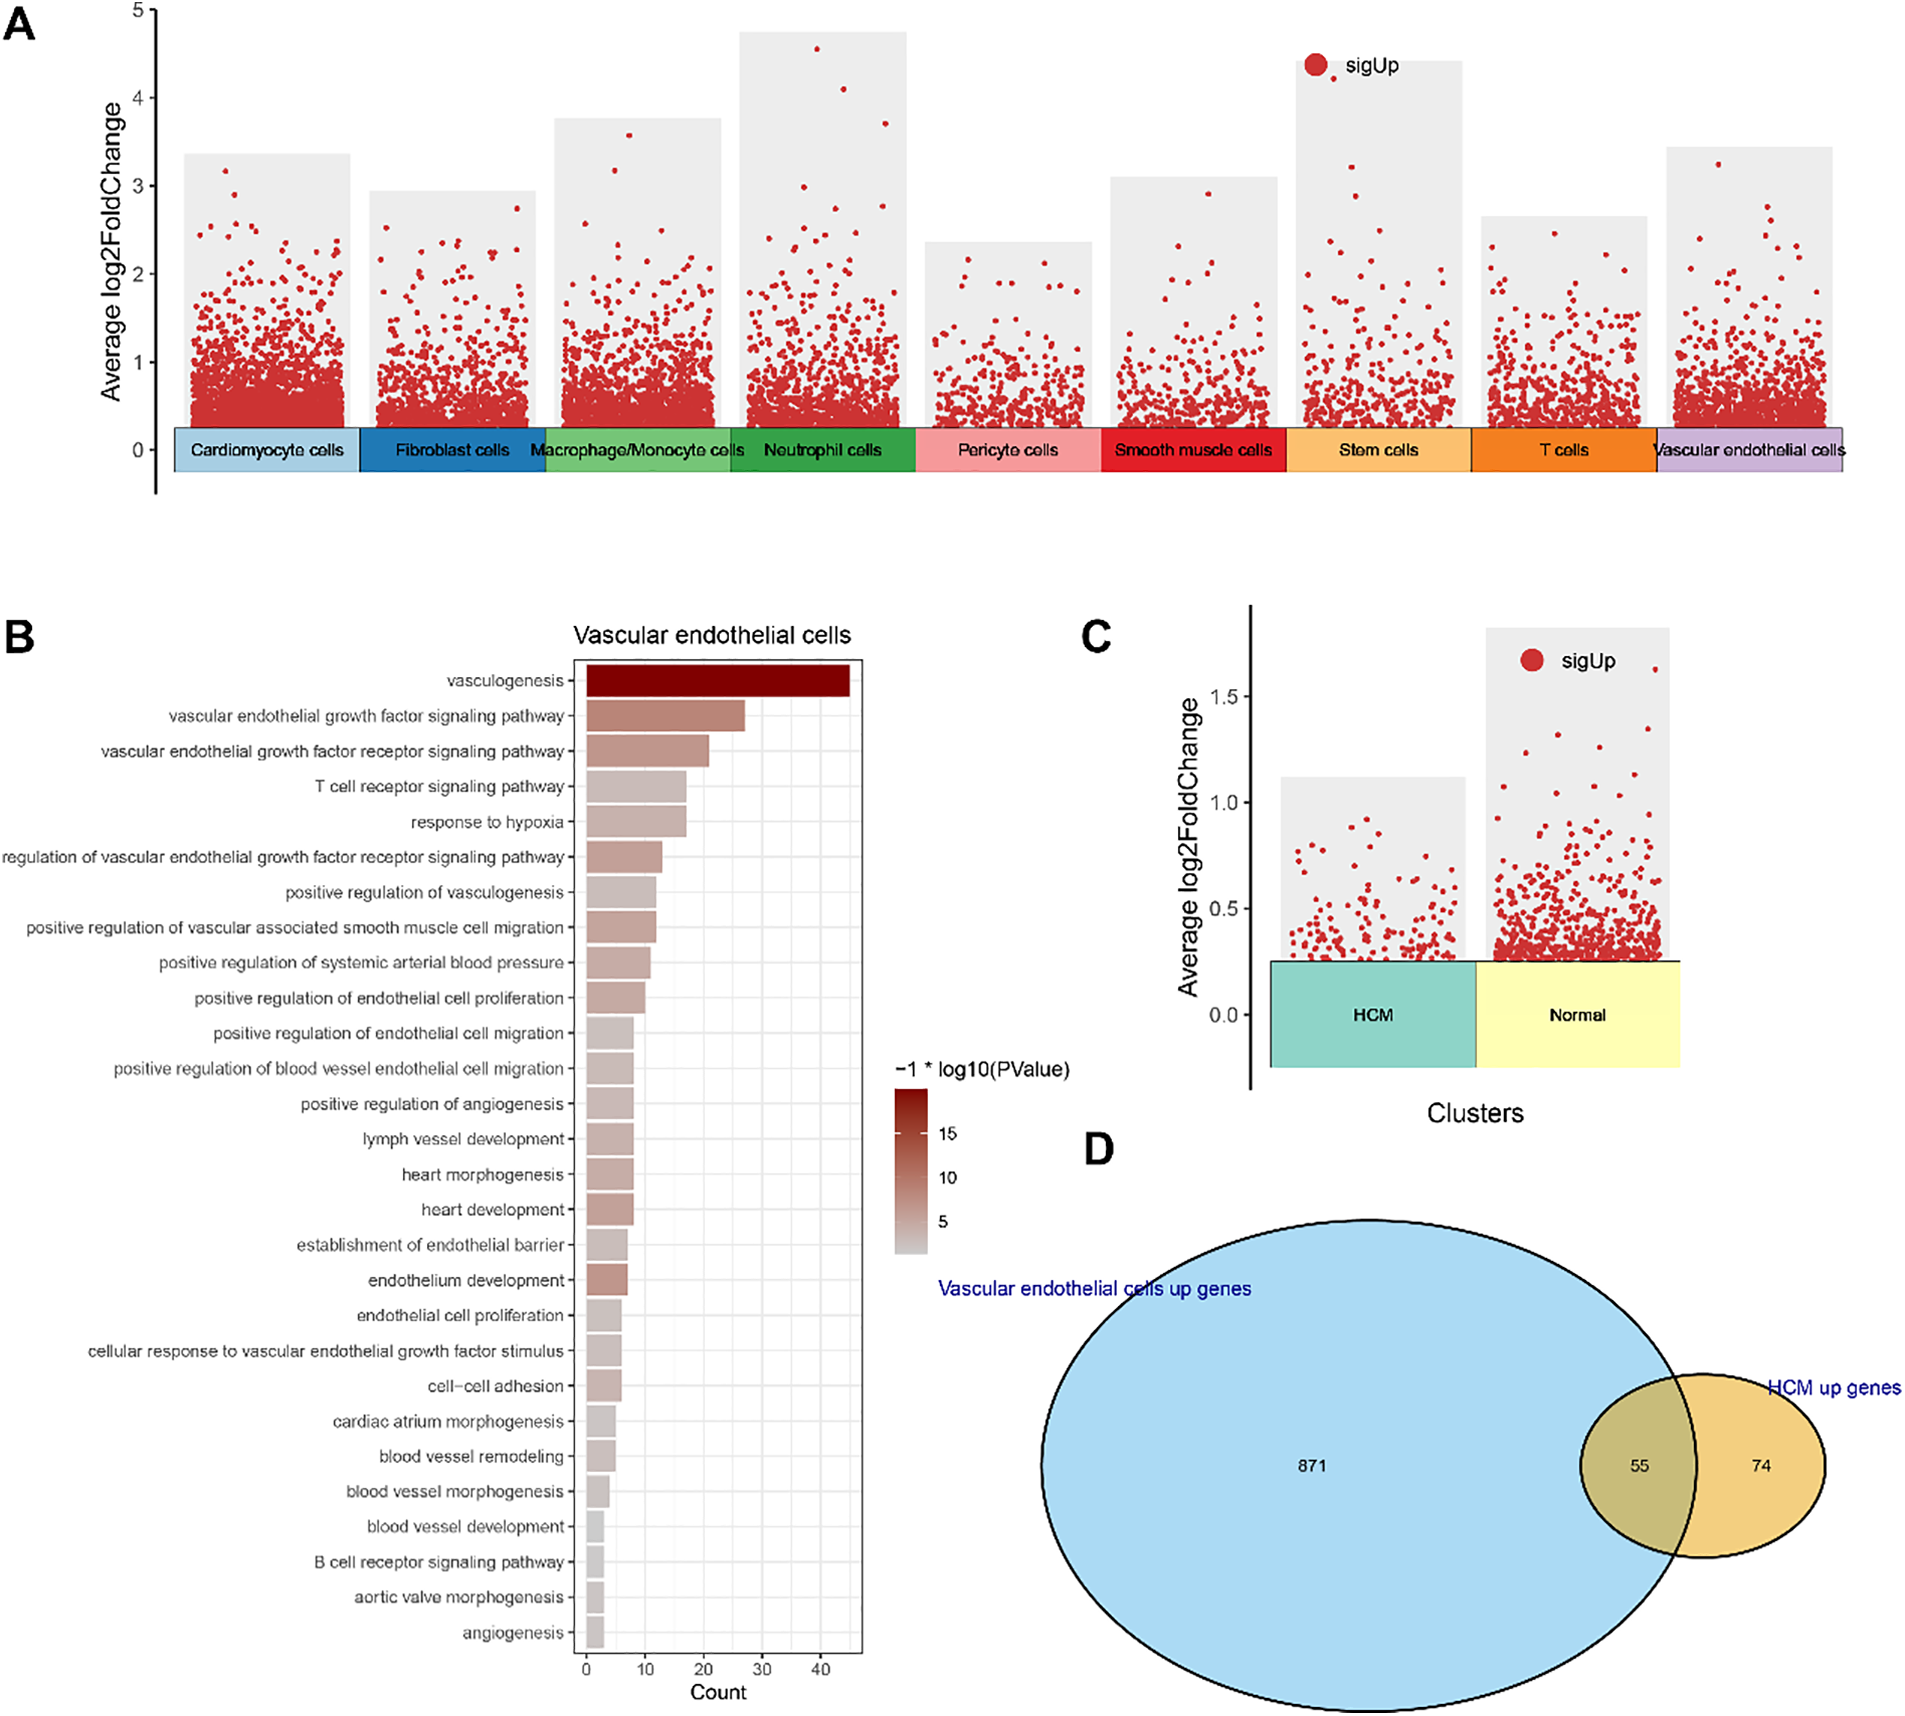
Figure 2: Functional enrichment analysis and identification of VEC-related feature genes. (A) Differentially upregulated genes in each cell populations. (B) Functional enrichment analysis on the differentially upregulated genes in VECs. (C) Differentially upregulated genes in VECs of HCM and normal samples. (D) Venn diagram showing the VEC-related feature genes
We also analyzed the differentially upregulated genes in VECs between HCM and normal samples (Fig. 2C) and intersected these genes with the differentially upregulated genes in VECs. As shown in the Venn diagram, a total of 55 VEC-related feature genes were identified (Fig. 2D). These findings collectively highlighted the potential role of VEC-related genes in HCM.
3.3 WGCNA to Identify the VECs-Relevant Gene Modules
The VEC-related gene co-expression modules were classified by WGCNA. The sort threshold (β) was set to 7 to ensure a scale-free network (Fig. 3A). Hierarchical clustering classified a total of 11 relevant gene modules after merging (Fig. 3B). Correlation analysis showed a noticeably stronger correlation between the blue module and the VECs score (Fig. 3C,E). The number of genes in each module was calculated and presented in Fig. 3D. Functional enrichment analysis on the genes in the blue module (Fig. 3F) revealed that these genes were significantly enriched in pathways related to metabolism (e.g., coenzyme metabolic process, carboxylic acid catabolic process, and sulfur compound metabolic process) and immunity (e.g., neutrophil mediated immunity, neutrophil activation and neutrophil activation involved in immune response). These findings allowed for the identification of the relevant hub DEGs for further analysis.
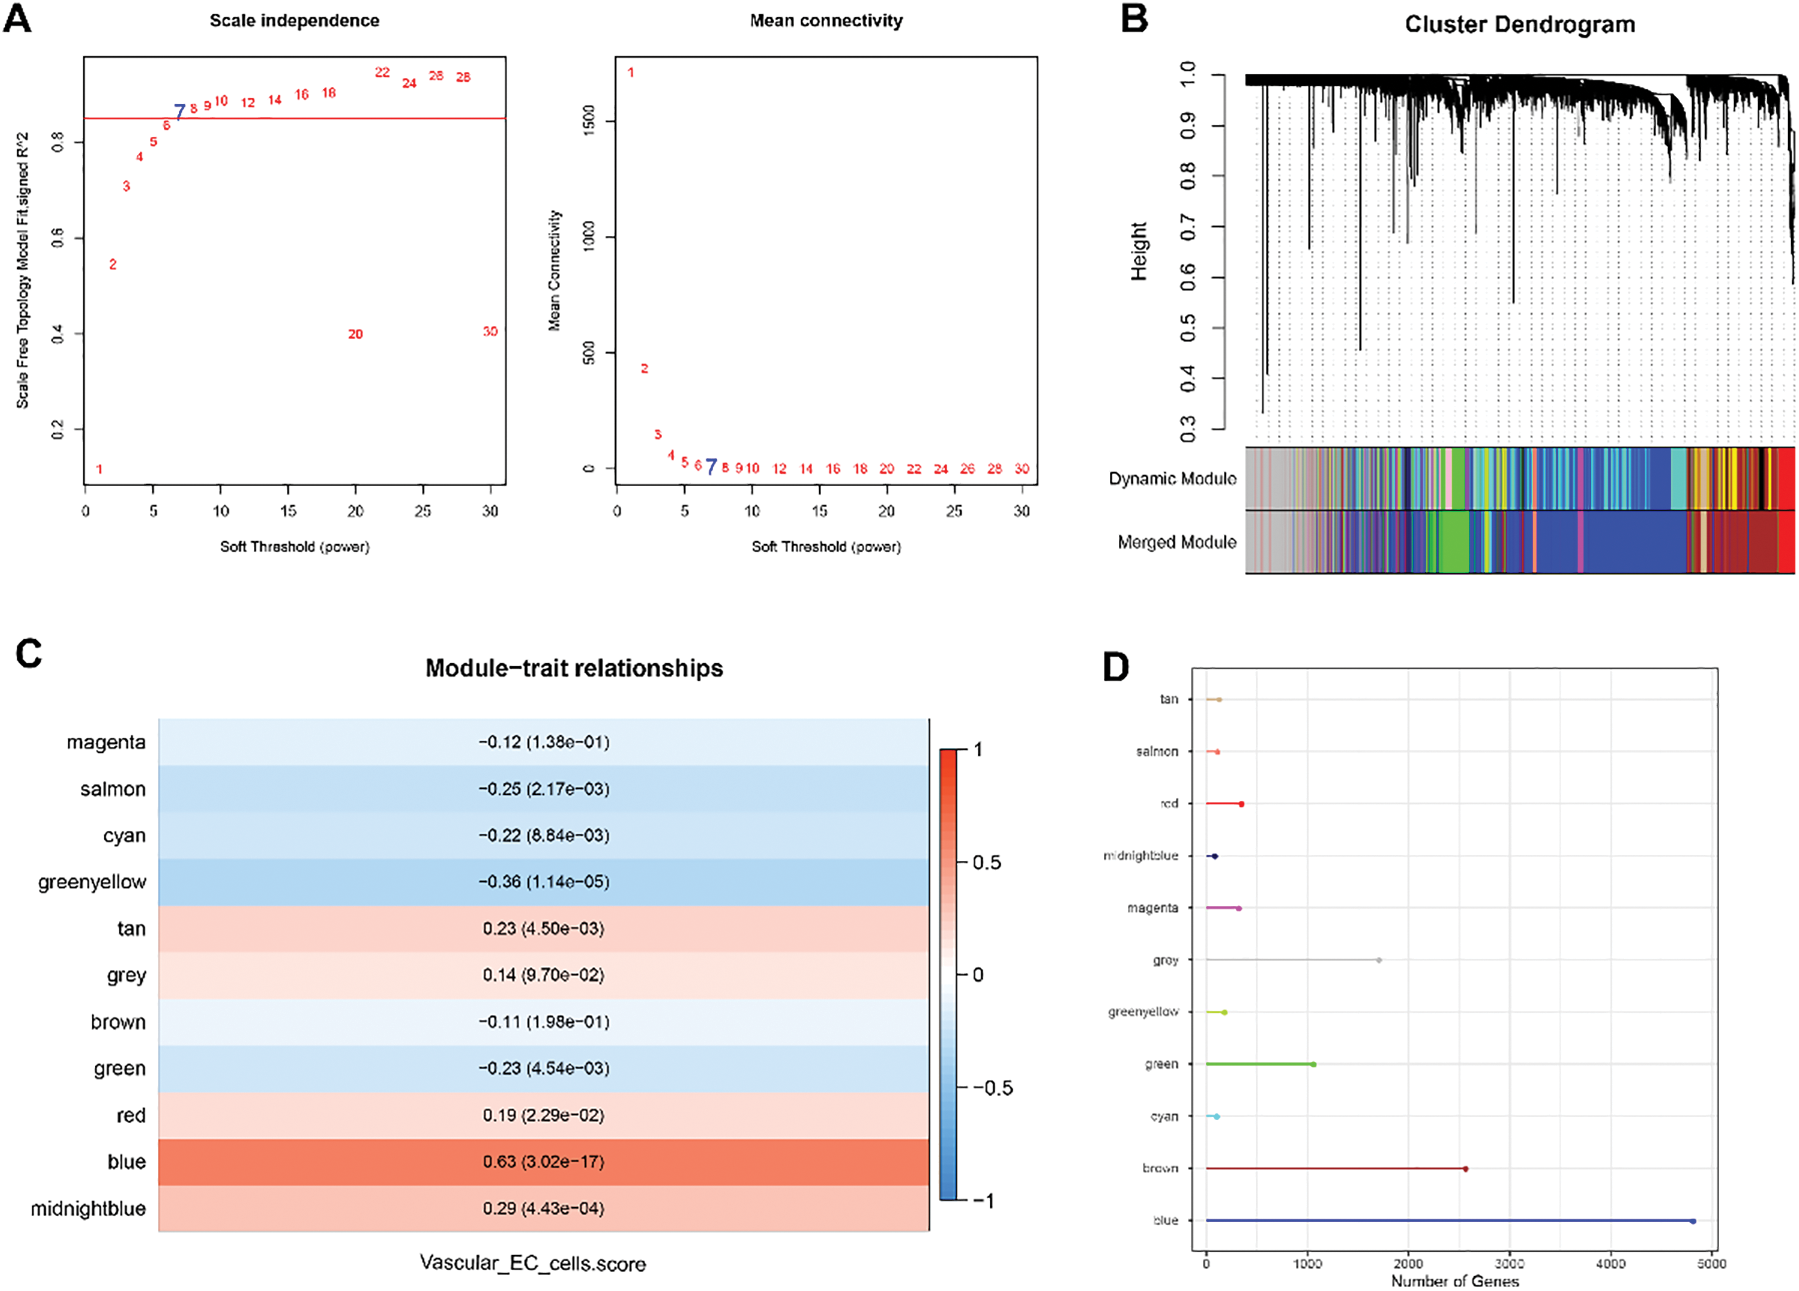
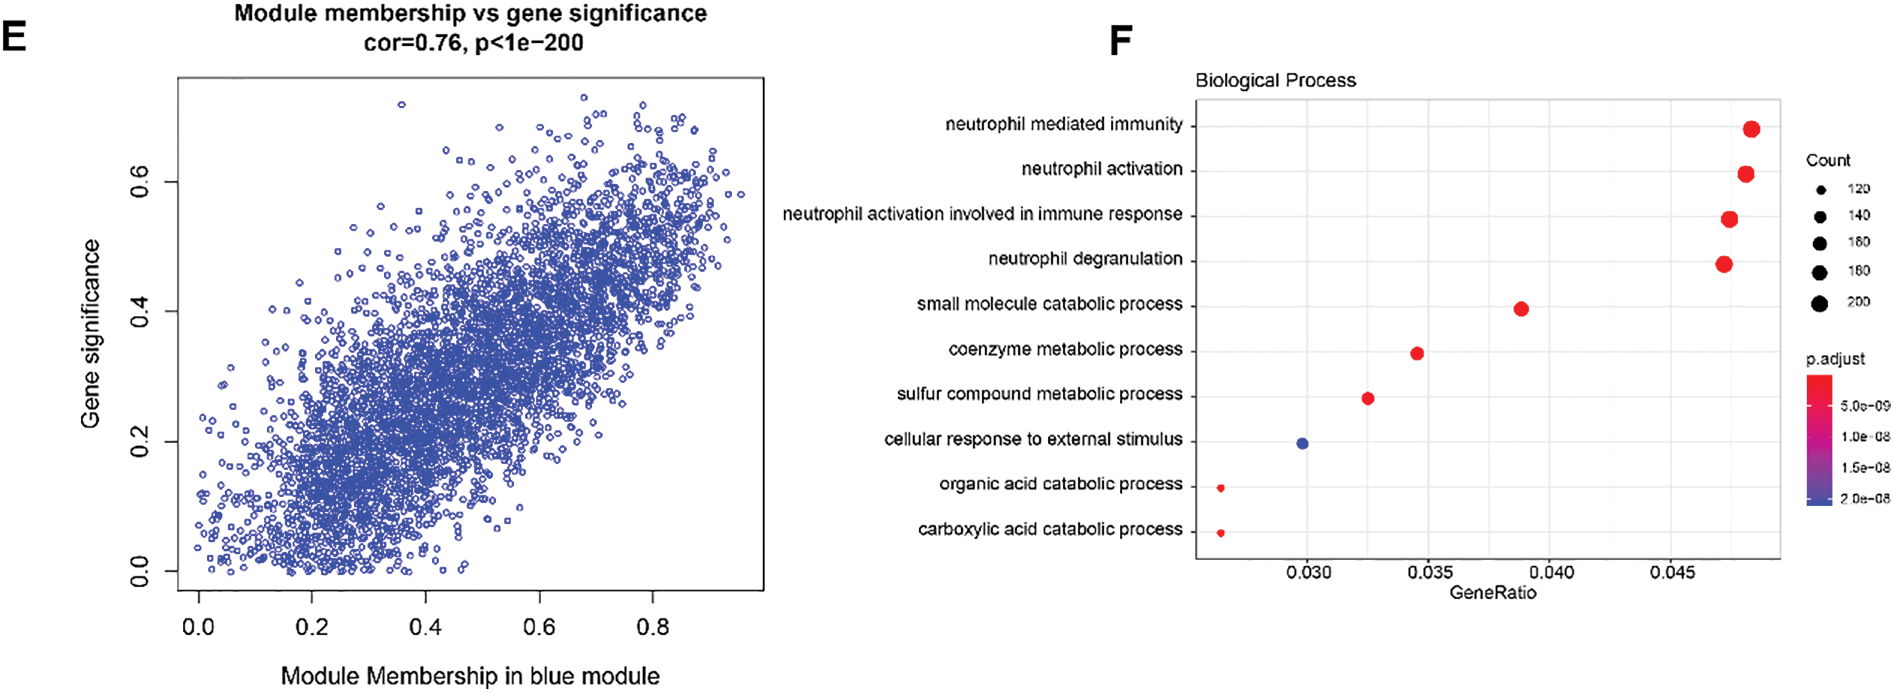
Figure 3: WGCNA to identify VECs-relevant gene modules. (A) Process on determining the optimal soft threshold (β) for WGCNA analysis. (B) Cluster dendrogram in WGCNA analysis. (C) Correlation between the gene modules and the VECs score (the numbers without the brackets were the correlation coefficient and those within the brackets were the p-values). (D) The number of genes in each gene modules. (E) The correlation between the blue gene module and the VECs score. (F) Functional enrichment analysis on genes in the blue module
3.4 Identification of DEGs in HCM
A total of 523 DEGs, including 198 upregulated DEGs and 325 downregulated DEGs, were identified from the dataset GSE36961 and visualized into a Volcano plot (Fig. 4A). The upregulated DEGs were intersected with the genes in the blue gene module to obtain 146 common genes (Fig. 4B). The heapmap showed that the expression of these common genes was upregulated in the HCM samples (Fig. 4C), therefore these genes were further analyzed to select HCM-specific key genes.
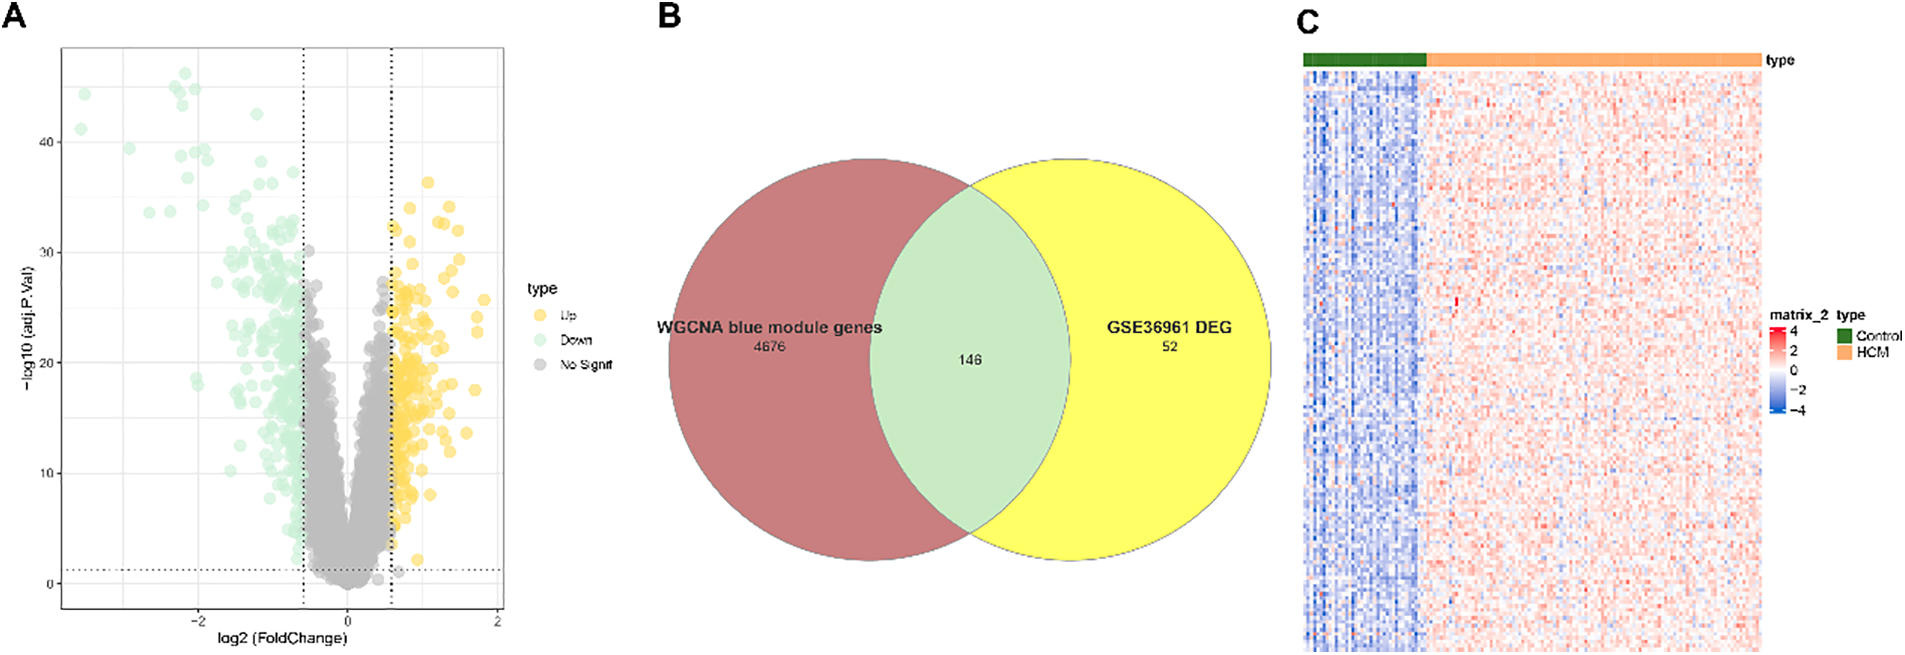
Figure 4: Identification of DEGs in HCM. (A) Volcano plot on the DEGs based on the dataset GSE36961. (B) Venn diagram on the common DEGs from the upregulated DEGs from the dataset GSE36961 and the genes in the blue module. (C) Heatmap on the expression levels of the common DEGs
3.5 Identification of Hub Genes via Machine Learning
Random forest analysis was performed on these 146 common genes to select the top 10 genes by importance using the algorithms “MeandecreaseAccuracy” and “MeandecreaseGini” (Fig. 5A). LASSO regression analysis was used to further reduce the number of genes. The minimum binomial deviance was found when the λ was 14, and accordingly the number of key markers was set to 14 (Fig. 5B). Five common genes, namely, DYRK1B, GADD45A, IVNS1ABP, LMOD2, and PHLDB2, were found in the intersection of the results of random forest analyses and LASSO regression analysis (Fig. 5C).
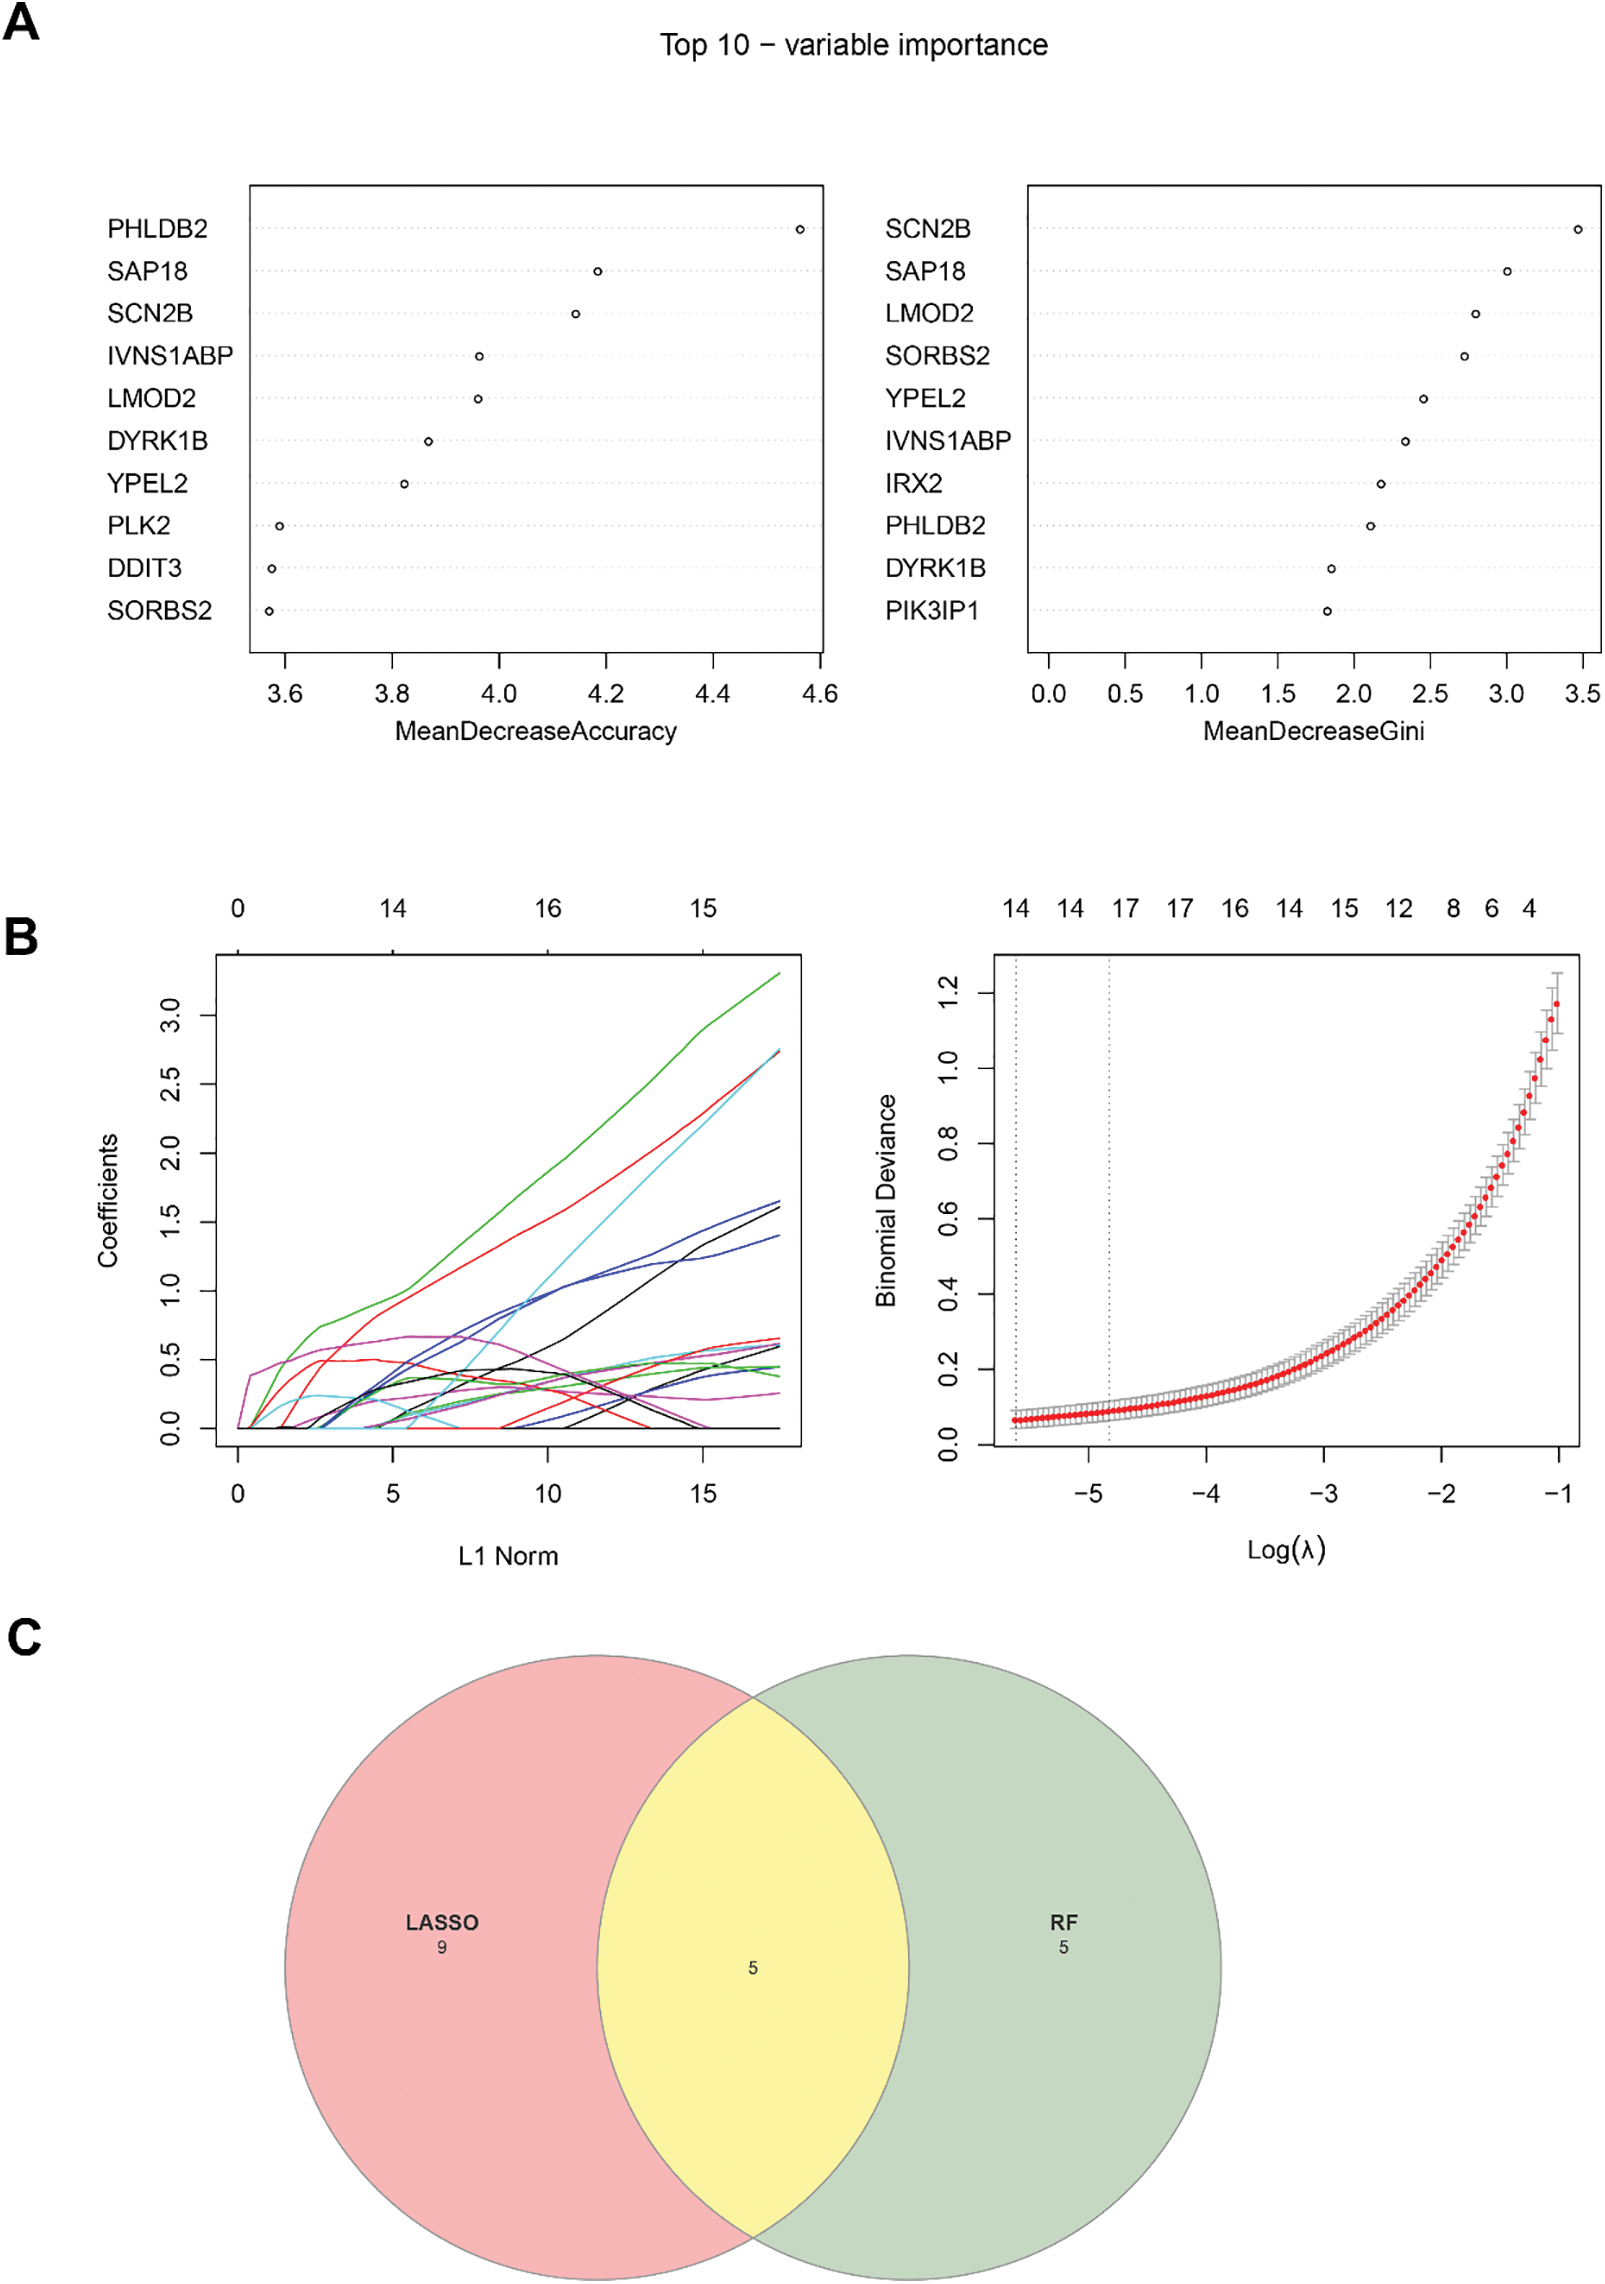
Figure 5: Identification of key genes via machine learning. (A) Top 10 genes identified based on the random forest analysis. (B) LASSO regression analysis to identify the key genes. (C) Venn diagram showing the common key genes from the random forest analysis and the LASSO regression analysis
3.6 Construction and Validation of the Diagnostic Model
Then the diagnostic efficacy of each hub gene was confirmed based on receiver operating characteristics (ROC) curve and area under the curve (AUC) value. With an AUC all higher than 0.8, the five genes demonstrated a strong diagnostic performance in the dataset GSE36961 (the training set) (Fig. 6A). The expression levels of these 5 hub genes in HCM and control samples showed that the five genes were upregulated in HCM samples (Fig. 6B). Similar results were also observed in the validation set GSE130036 and GSE249925 (Fig. 6C–F). The ROC plots, the sensitivity, specificity and F1 scores confirmed robust diagnostic capabilities of the five genes in the three datasets (Fig. 7A–C). Therefore, these five hub genes were verified as therapeutic targets in HCM.
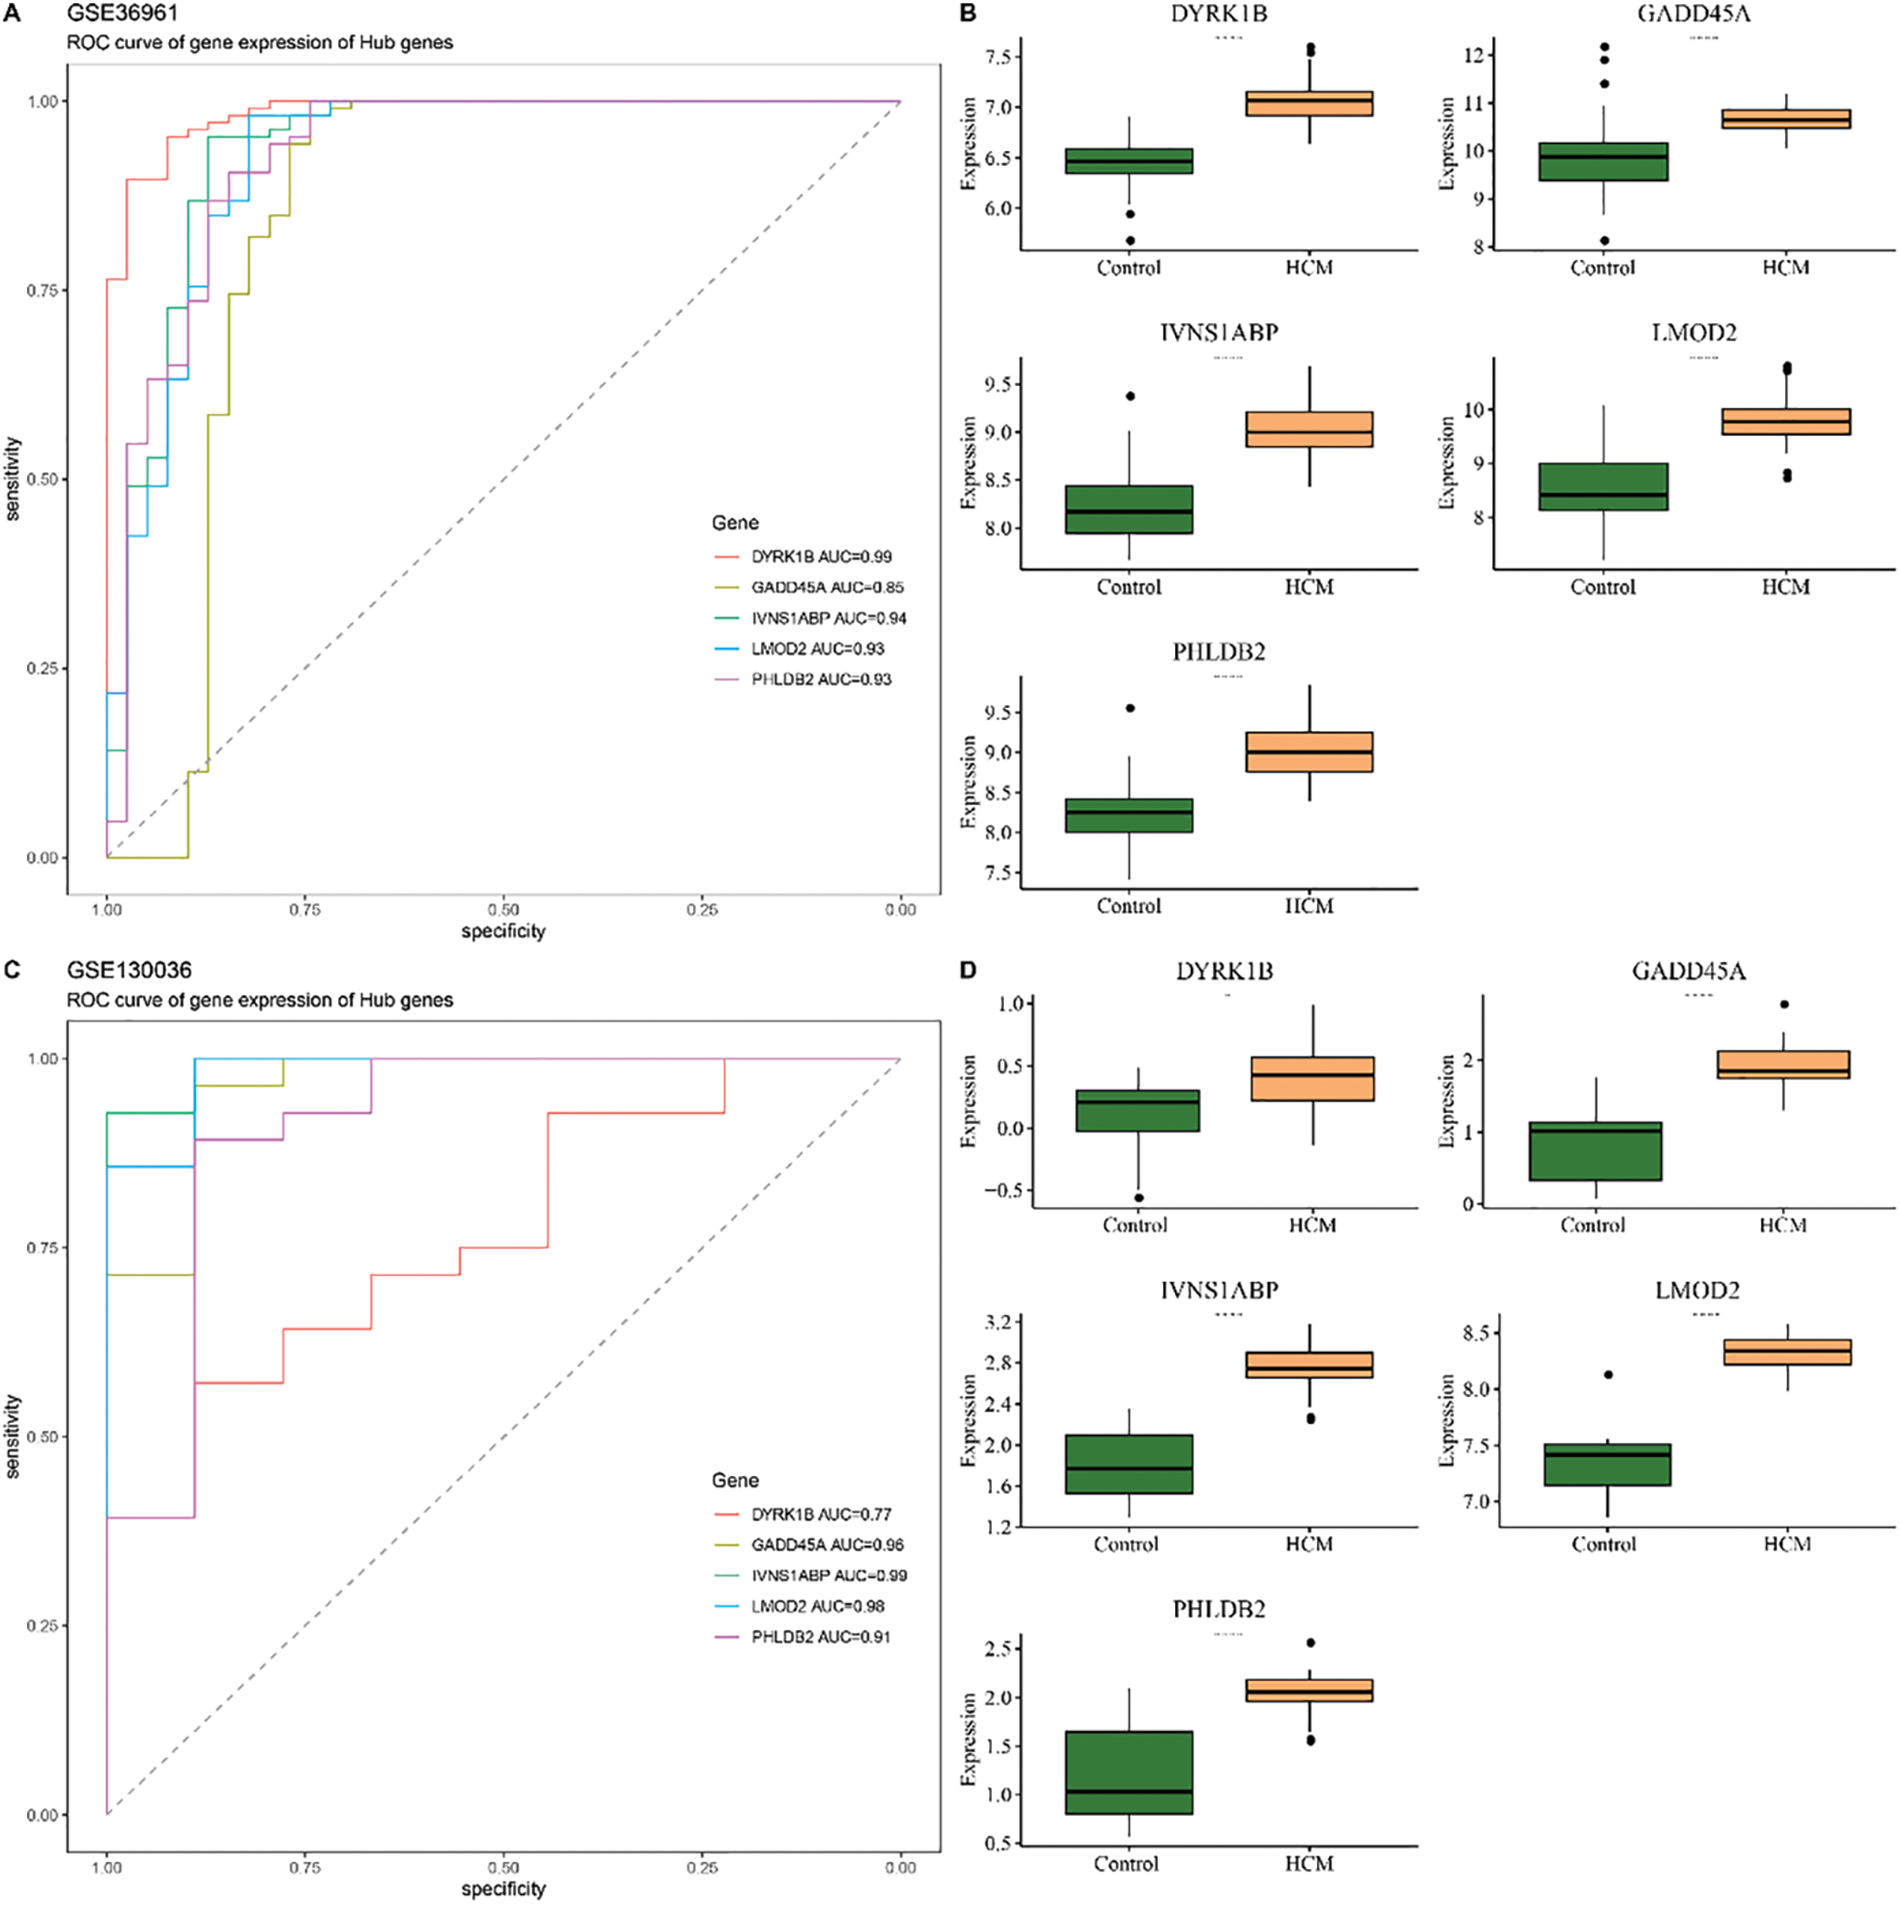
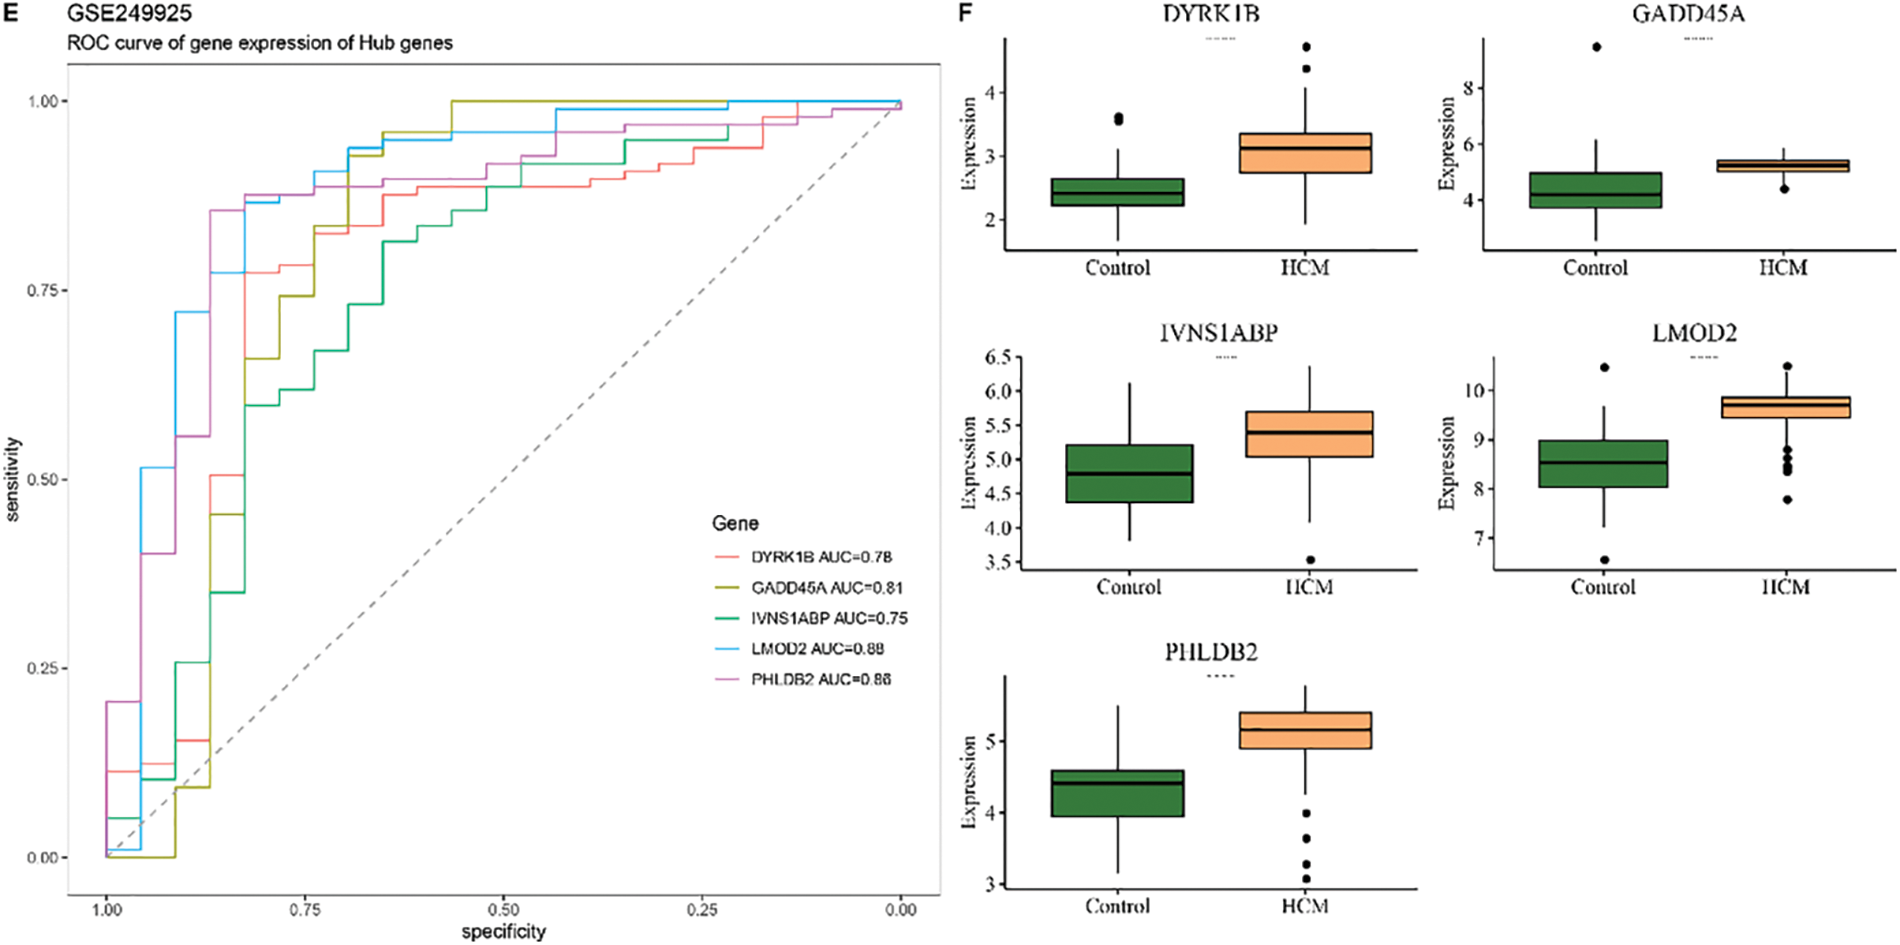
Figure 6: Construction and validation of the diagnostic model. (A) ROC curve and the AUC value of each of the five hub genes in the training set GSE36961. (B) Expression level of these hub genes in the HCM and Control tissue in the training set GSE36961. (C) ROC curve and the AUC value of each of the five hub genes in the validation set GSE130036. (D) Expression level of these hub genes in the HCM and Control tissue in the training set GSE130036. (E) ROC curve and the AUC value of each of the 5 hub genes in the validation set GSE249925. (F) Expression level of these hub genes in the HCM and Control tissue in the training set GSE249925
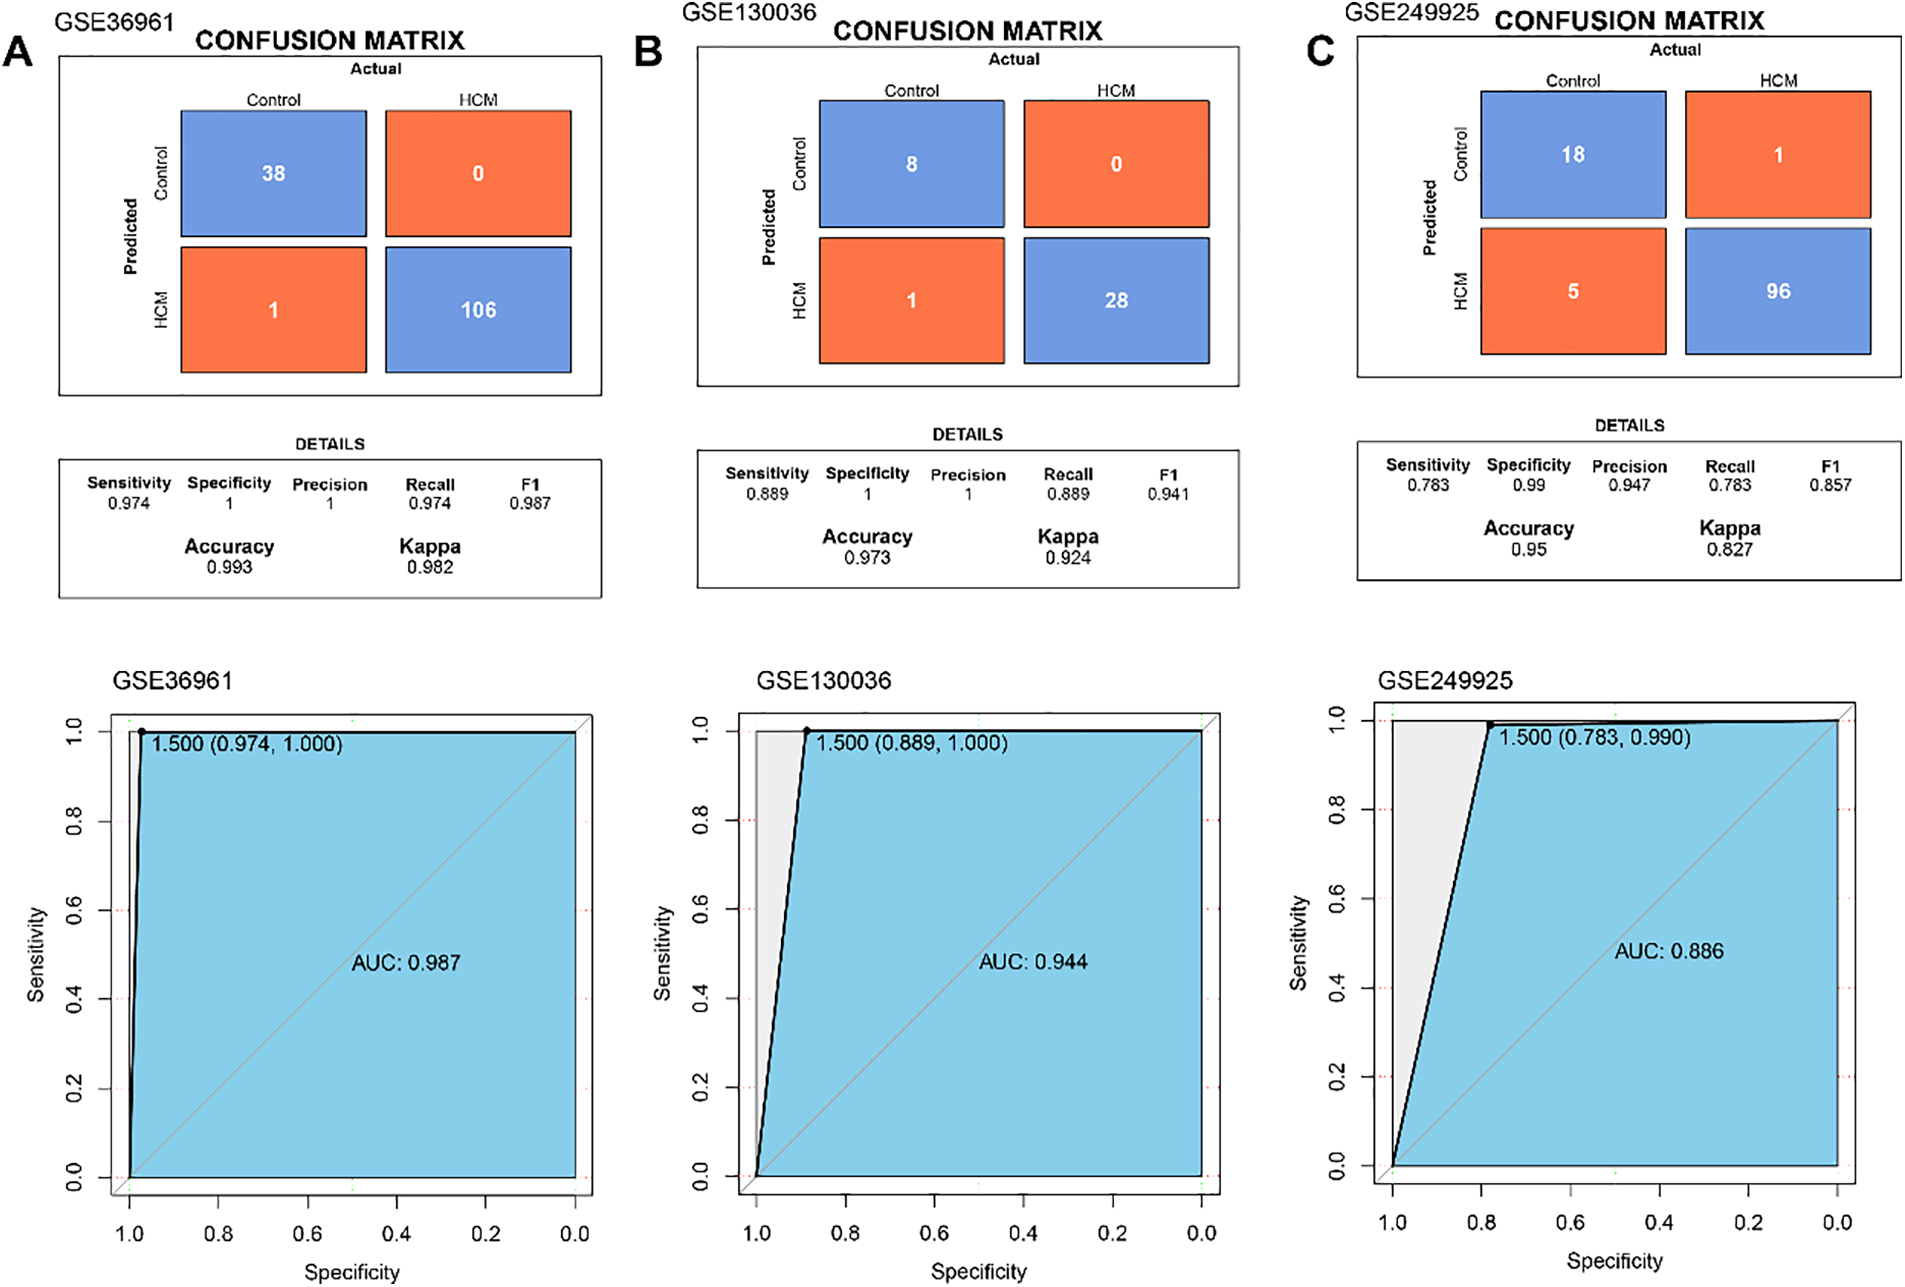
Figure 7: Performance evaluation in 3 datasets. (A) The ROC curve of hub gene expression, the overall predictive performance of the model reflected by ROC curve and confusion matrix in GSE36961. (B) The ROC curve of hub gene expression, the overall predictive performance of the model reflected by ROC curve and confusion matrix in GSE130036. (C) The ROC curve of hub gene expression, and the overall predictive performance of the model reflected by ROC curve and confusion matrix in GSE249925
In this study, based on the relevant datasets analyzed, we identified VECs as the most abundant key cell population in HCM samples. The VEC-related genes were mainly enriched in the pathways linked to blood vessel, immunity and cardiac function. WGCNA was applied to classify VEC-related gene modules. Subsequently, five high-expressed hub genes in HCM were discovered and used to construct a reliable diagnostic model. These results collectively highlighted the specificity of VEC-related biomarkers in HCM and provided the mechanisms underlying the pathogenesis of HCM.
Compared to other cell types, VECs play a significant role in promoting HCM. This study found a noticeable increase of VECs in HCM, with the DEGs predominantly enriched in vascular-related pathways such as vasculogenesis, VEGFs signaling pathway, and positive regulation of blood vessel endothelial cell migration. VEGFs in the heart is a main regulator of cardiac angiogenesis and exert cytoprotective, antioxidant, and anti-apoptotic effects on cardiomyocytes [29]. In HCM, microvascular dysfunction is an important pathological feature that precedes myocardial hypertrophy and has a significant impact on the long-term progression of the disease [30]. Previous research has outlined the transcriptomic profiles of cardiomyocytes in HCM and highlighted an upregulation of some extracellular matrix-related genes in the cardiomyocytes in HCM [31]. These evidence supported a significant role of VCMs in HCM. In the current study, WGCNA identified the blue gene modules as the module having the strongest correlation with VECs, and the genes in this module were enriched in pathways related to both metabolism and immunity. Metabolic changes in HCM have been reported, and some metabolomics data revealed an upregulation of pentose phosphate pathway and oxidative stress markers [32,33]. Further enrichment analysis of the genes specific to the modules revealed that these genes were mainly enriched in coenzyme metabolic process, carboxylic acid catabolic process and sulfur compound metabolic process, showing their involvement in the metabolism in the heart.
Machine learning analyses determined five hub genes (DYRK1B, GADD45A, IVNS1ABP, LMOD2, and PHLDB2) for HCM. DYRK1B, a member of the dual-specificity tyrosine-regulated kinases family, exhibits an upregulated expression in the myocardium of HCM patients. DYRK1B interacts with signal transducer and transcription activator 3 (STAT3) to aggravate cardiac hypertrophy and heart failure [33]. In addition, DYRK1A, another member of the DYRK family, affects the angiogenic response of VECs by regulating VEGF-dependent nuclear factor of activated T cells (NFAT) transcription [34]. The close relationship between DYRK1A and DYRK1B and their high expressions in human tissues [35] suggested a potential link between DYRK1B and VECs. GADD45A can modulate a variety of cellular processes associated with stress signaling and injury response [36]. Studies found that in myocardial ischemia-reperfusion injury, GADD45A is high-expressed in cardiac microvascular endothelial cells where it affects cell functions by regulating the JNK/p38 MAPK and STAT3/VEGF signaling pathways [37,38]. Silencing GADD45A can reduce the apoptosis of cardiac microvascular endothelial cells and improve the pathological damage of the myocardium [38]. IVNS1ABP is involved in acute myocardial infraction and functions as a neutrophil-derived programmed cell death marker with prognostic value [39]. As a critical modulator of the thin filament length, LMOD2 locates near the HCM locus CMH6 on human chromosome 7q3 and promotes the elongation of actin via polymerization at the pointed ends [40,41]. Some studies have shown that knockout of LMOD2 leads to abnormally short cardiac thin filaments, leading to dilated cardiomyopathy [42]. LMO2 is expressed in VECs and plays a crucial role in the early stage of angiogenesis, therefore it can be considered as a marker for vascular differentiation [43]. PHLDB2 is a protein containing two predicted coiled-coil domains and the pleckstrin homology domain. Previous studies reported that PHLDB2 has regulatory effects on synaptic plasticity [44] and affects the occurrence of cancer through vasculogenic mimicry [45]. In our study, a diagnostic model was successfully constructed using these five hub genes for the early detection and diagnosis of HCM (AUC > 0.7). However, despite the established correlation between the five key genes and VECs and their important roles in heart-related diseases, the potential clinical application value of these genes and the diagnostic model still requires further investigation.
However, several limitations of our study should be acknowledged. Firstly, although potential key genes were discovered applying bioinformatics analyses, these findings lacked experimental validation. It is equally necessary to employ techniques such as real-time quantitative PCR (qPCR) and immunohistochemistry. QPCR can accurately quantify the expression levels of the identified genes in independent tissue samples derived from HCM patients and healthy controls. By directly comparing the differences in gene expressions, we can clarify the expression changes of these genes during the disease progression. Meanwhile, immunohistochemistry can visualize the spatial distribution of the proteins encoded by these genes in a complex tissue microenvironment, providing crucial clues for further exploring their functional localization and potential pathogenic mechanisms. Secondly, a notable limitation was the absence of clinical trials. This would entail the recruitment of appropriate patient cohorts, establishment of control groups, and close monitoring of relevant clinical outcomes. Such trials can assess the accuracy of the diagnostic model in clinical setting. Furthermore, the sample size of this study was relatively homogeneous. To overcome this, we plan to include more HCM patient samples with different geographical, age, gender, and ethnic backgrounds to enhance the generalizability of our findings.
To conclude, our study discovered five VEC-related biomarkers in HCM and examined the underlying mechanisms of the pathogenesis of HCM. Based on the current results, a diagnostic model for HCM was developed. The current findings not only helped to gain a deeper understanding of the pathological process of HCM, but also provided important theoretical basis and practical guidance for the development of new therapeutic targets, early diagnosis, and personalized treatment of HCM. Our results could improve the prognosis and quality of life of HCM patients in clinical practice and also contribute to the studies of cardiovascular diseases.
Acknowledgement: None.
Funding Statement: This study is supported by Technology Project of Nantong Municipal Health Commission (grant number MSZ2022045).
Author Contributions: The authors confirm contribution to the paper as follows: study conception and design: Ying Wang, Weijun Zhang, Fei Cai; data collection: Yong Tao; analysis and interpretation of results: Ying Wang, Weijun Zhang, Fei Cai; draft manuscript preparation: Yong Tao, Ying Wang, Weijun Zhang, Fei Cai. All authors reviewed the results and approved the final version of the manuscript.
Availability of Data and Materials: The datasets generated and/or analyzed during the current study are available in the [GSE36961] repository, [https://www.ncbi.nlm.nih.gov/geo/query/acc.cgi?acc=GSE36961], [GSE130036] repository, [https://www.ncbi.nlm.nih.gov/geo/query/acc.cgi?acc=GSE130036], [GSE249925] repository, [https://www.ncbi.nlm.nih.gov/geo/query/acc.cgi?acc=GSE249925] and [GSE203274] repository, [https://www.ncbi.nlm.nih.gov/geo/query/acc.cgi?acc=GSE203274] (accessed on 30 October 2024).
Ethics Approval: Not applicable.
Conflicts of Interest: The authors declare no conflicts of interest to report regarding the present study.
Supplementary Materials: The supplementary material is available online at https://doi.org/10.32604/chd.2025.060406.
References
1. Maron BJ, Desai MY, Nishimura RA, Spirito P, Rakowski H, Towbin JA et al. Diagnosis and evaluation of hypertrophic cardiomyopathy: JACC state-of-the-art review. J Am Coll Cardiol. 2022;79(4):372–89. doi:10.1016/j.jacc.2021.12.002. [Google Scholar] [CrossRef]
2. Chou C, Chin MT. Genetic and molecular mechanisms of hypertrophic cardiomyopathy. Int J Mol Sci. 2023;24(3):32522. doi:10.3390/ijms24032522. [Google Scholar] [CrossRef]
3. Dong T, Gilliland Y, Kramer CM, Theodore A, Desai M. Multimodality imaging of hypertrophic cardiomyopathy. Prog Cardiovasc Dis. 2023;80:14–24. doi:10.1016/j.pcad.2023.08.004. [Google Scholar] [CrossRef]
4. Sabater-Molina M, Pérez-Sánchez I, Hernández Del Rincón JP, Gimeno JR. Genetics of hypertrophic cardiomyopathy: a review of current state. Clin Genet. 2018;93(1):3–14. doi:10.1111/cge.13027. [Google Scholar] [CrossRef]
5. Konno T, Chang S, Seidman JG, Seidman CE. Genetics of hypertrophic cardiomyopathy. Curr Opin Cardiol. 2010;25(3):205–9. doi:10.1097/HCO.0b013e3283375698. [Google Scholar] [CrossRef]
6. Krüger-Genge A, Blocki A, Franke RP, Jung F. Vascular endothelial cell biology: an update. Int J Mol Sci. 2019;20(18):4411. doi:10.3390/ijms20184411. [Google Scholar] [CrossRef]
7. Xu S, Ilyas I, Little PJ, Li H, Kamato D, Zheng X, et al. Endothelial dysfunction in atherosclerotic cardiovascular diseases and beyond: from mechanism to pharmacotherapies. Pharmacol Rev. 2021;73(3):924–67. doi:10.1124/pharmrev.120.000096. [Google Scholar] [CrossRef]
8. Zinovkina LA, Makievskaya CI, Galkin II, Zinovkin RA. Mitochondria-targeted uncouplers decrease inflammatory reactions in endothelial cells by enhancing methylation of the ICAM1 gene promoter. Curr Mol Pharmacol. 2023;17:e150823219723. doi:10.2174/1874467217666230815142556. [Google Scholar] [CrossRef]
9. Gimbrone MA Jr, García-Cardeña G. Endothelial cell dysfunction and the pathobiology of atherosclerosis. Circ Res. 2016;118(4):620–36. doi:10.1161/CIRCRESAHA.115.306301. [Google Scholar] [CrossRef]
10. Drera A, Rodella L, Brangi E, Riccardi M, Vizzardi E. Endothelial dysfunction in heart failure: what is its role? J Clin Med. 2024;13(9):2534. doi:10.3390/jcm13092534. [Google Scholar] [CrossRef]
11. Gaikwad AB, Sankrityayan H, Rao PD, Shelke V, Kulkarni YA, Mulay SR. Endoplasmic reticulum stress and renin-angiotensin system crosstalk in endothelial dysfunction. Curr Mol Pharmacol. 2023;16(2):139–46. doi:10.2174/1874467215666220301113833. [Google Scholar] [CrossRef]
12. Trimm E, Red-Horse K. Vascular endothelial cell development and diversity. Nat Rev Cardiol. 2023;20(3):197–210. doi:10.1038/s41569-022-00770-1. [Google Scholar] [CrossRef]
13. Xu Z, Gao Z, Fu H, Zeng Y, Jin Y, Xu B, et al. PTX3 from vascular endothelial cells contributes to trastuzumab-induced cardiac complications. Cardiovasc Res. 2023;119(5):1250–64. doi:10.1093/cvr/cvad012. [Google Scholar] [CrossRef]
14. Gogiraju R, Bochenek ML, Schäfer K. Angiogenic endothelial cell signaling in cardiac hypertrophy and heart failure. Front Cardiovasc Med. 2019;6:20. doi:10.3389/fcvm.2019.00020. [Google Scholar] [CrossRef]
15. Yang X, Cheng K, Wang L-Y, Jiang J-G. The role of endothelial cell in cardiac hypertrophy: focusing on angiogenesis and intercellular crosstalk. Biomed Pharmacother. 2023;163:114799. doi:10.1016/j.biopha.2023.114799. [Google Scholar] [CrossRef]
16. Mandawat A, Williams AE, Francis SA. Cardio-oncology: the role of big data. Heart Fail Clin. 2017;13(2):403–8. doi:10.1016/j.hfc.2016.12.010. [Google Scholar] [CrossRef]
17. Alonso-Betanzos A, Bolón-Canedo V. Big-data analysis, cluster analysis, and machine-learning approaches. Adv Exp Med Biol. 2018;1065:607–26. doi:10.1007/978-3-319-77932-4. [Google Scholar] [CrossRef]
18. Paik DT, Cho S, Tian L, Chang HY, Wu JC. Single-cell RNA sequencing in cardiovascular development, disease and medicine. Nat Rev Cardiol. 2020;17(8):457–73. doi:10.1038/s41569-020-0359-y. [Google Scholar] [CrossRef]
19. Delaney JR. Aneuploidy: an opportunity within single-cell RNA sequencing analysis. Biocell. 2021;45(5):1167–70. doi:10.32604/biocell.2021.017296. [Google Scholar] [CrossRef]
20. Wakabayashi T, Naito H. Cellular heterogeneity and stem cells of vascular endothelial cells in blood vessel formation and homeostasis: insights from single-cell RNA sequencing. Front Cell Dev Biol. 2023;11:1146399. doi:10.3389/fcell.2023.1146399. [Google Scholar] [CrossRef]
21. Wehrens M, de Leeuw AE, Wright-Clark M, Eding JEC, Boogerd CJ, Molenaar B, et al. Single-cell transcriptomics provides insights into hypertrophic cardiomyopathy. Cell Rep. 2022;39(6):110809. doi:10.1016/j.celrep.2022.110809. [Google Scholar] [CrossRef]
22. Tan Z, Chen X, Zuo J, Fu S, Wang H, Wang J. Comprehensive analysis of scRNA-Seq and bulk RNA-Seq reveals dynamic changes in the tumor immune microenvironment of bladder cancer and establishes a prognostic model. J Transl Med. 2023;21(1):223. doi:10.1186/s12967-023-04056-z. [Google Scholar] [CrossRef]
23. Korsunsky I, Millard N, Fan J, Slowikowski K, Zhang F, Wei K, et al. Fast, sensitive and accurate integration of single-cell data with Harmony. Nat Methods. 2019;16(12):1289–96. doi:10.1038/s41592-019-0619-0. [Google Scholar] [CrossRef]
24. Jia S, Zhai L, Wu F, Lv W, Min X, Zhang S, et al. Integrative machine learning algorithms for developing a consensus RNA modification-based signature for guiding clinical decision-making in bladder cancer. Oncologie. 2024;26(2):269–85. doi:10.1515/oncologie-2023-0348. [Google Scholar] [CrossRef]
25. Langfelder P, Horvath S. WGCNA: an R package for weighted correlation network analysis. BMC Bioinf. 2008;9:559. doi:10.1186/1471-2105-9-559. [Google Scholar] [CrossRef]
26. Wang Y, Zhuang H, Jiang XH, Zou RH, Wang HY, Fan ZN. Unveiling the key genes, environmental toxins, and drug exposures in modulating the severity of ulcerative colitis: a comprehensive analysis. Front Immunol. 2023;14:1162458. doi:10.3389/fimmu.2023.1162458. [Google Scholar] [CrossRef]
27. Yao Z, Huang H, Zhang S, Wang S, Xia Q, Liu Z. Exploring the bladder tissue microbiome in patients with muscle-invasive bladder cancer using 2bRAD-M sequencing. Oncologie. 2024;26(3):395–406. doi:10.1515/oncologie-2024-0079. [Google Scholar] [CrossRef]
28. Engebretsen S, Bohlin J. Statistical predictions with glmnet. Clin Epigenetics. 2019;11(1):123. doi:10.1186/s13148-019-0730-1. [Google Scholar] [CrossRef]
29. Woitek F, Zentilin L, Hoffman NE, Powers JC, Ottiger I, Parikh S, et al. Intracoronary cytoprotective gene therapy: a study of VEGF-B167 in a pre-clinical animal model of dilated cardiomyopathy. J Am Coll Cardiol. 2015;66(2):139–53. doi:10.1016/j.jacc.2015.04.071. [Google Scholar] [CrossRef]
30. Shridhar P, Glennon MS, Pal S, Waldron CJ, Chetkof EJ, Basak P, et al. MDM2 regulation of HIF signaling causes microvascular dysfunction in hypertrophic cardiomyopathy. Circulation. 2023;148(23):1870–86. doi:10.1161/CIRCULATIONAHA.123.064332. [Google Scholar] [CrossRef]
31. Lu J, Ren J, Liu J, Lu M, Cui Y, Liao Y, et al. High-resolution single-cell transcriptomic survey of cardiomyocytes from patients with hypertrophic cardiomyopathy. Cell Prolif. 2024;57(3):e13557. doi:10.1111/cpr.13557. [Google Scholar] [CrossRef]
32. Van der Velden J, Tocchetti CG, Varricchi G, Bianco A, Sequeira V, Hilfiker-Kleiner D, et al. Metabolic changes in hypertrophic cardiomyopathies: scientific update from the working group of myocardial function of the european society of cardiology. Cardiovasc Res. 2018;114(10):1273–80. doi:10.1093/cvr/cvy147. [Google Scholar] [CrossRef]
33. Zhuang L, Jia K, Chen C, Li Z, Zhao J, Hu J, et al. DYRK1B-STAT3 drives cardiac hypertrophy and heart failure by impairing mitochondrial bioenergetics. Circulation. 2022;145(11):829–46. doi:10.1161/CIRCULATIONAHA.121.055727. [Google Scholar] [CrossRef]
34. Rozen EJ, Roewenstrunk J, Barallobre MJ, Di Vona C, Jung C, Figueiredo AF, et al. DYRK1A kinase positively regulates angiogenic responses in endothelial cells. Cell Rep. 2018;23(6):1867–78. doi:10.1016/j.celrep.2018.04.008. [Google Scholar] [CrossRef]
35. Boni J, Rubio-Perez C, López-Bigas N, Fillat C, de la Luna S. The DYRK family of kinases in cancer: molecular functions and therapeutic opportunities. Cancers. 2020;12(8):2106. doi:10.3390/cancers12082106. [Google Scholar] [CrossRef]
36. Palomer X, Salvador JM, Griñán-Ferré C, Barroso E, Pallàs M, Vázquez-Carrera M. GADD45A: with or without you. Med Res Rev. 2024;44(4):1375–403. doi:10.1002/med.22015. [Google Scholar] [CrossRef]
37. Liu C, Liu H, Sun Q, Zhang P. MicroRNA, 1283 alleviates cardiomyocyte damage caused by hypoxia/reoxygenation via targeting GADD45A and inactivating the JNK and p38 MAPK signaling pathways. Kardiol Pol. 2021;79(2):147–55. doi:10.33963/KP.15696. [Google Scholar] [CrossRef]
38. Wang Y, Gao H, Cao X, Li Z, Kuang Y, Ji Y, et al. Role of GADD45A in myocardial ischemia/reperfusion through mediation of the JNK/p38 MAPK and STAT3/VEGF pathways. Int J Mol Med. 2022;50(6):144. doi:10.3892/ijmm.2022.5200. [Google Scholar] [CrossRef]
39. Zhu Y, Chen Y, Zu Y. Leveraging a neutrophil-derived PCD signature to predict and stratify patients with acute myocardial infarction: from AI prediction to biological interpretation. J Transl Med. 2024;22(1):612. doi:10.1186/s12967-024-05415-0. [Google Scholar] [CrossRef]
40. Lay E, Azamian MS, Denfield SW, Dreyer W, Spinner JA, Kearney D, et al. LMOD2-related dilated cardiomyopathy presenting in late infancy. Am J Med Genet A. 2022;188(6):1858–62. doi:10.1002/ajmg.a.62699. [Google Scholar] [CrossRef]
41. Conley CA, Fritz-Six KL, Almenar-Queralt A, Fowler VM. Leiomodins: larger members of the tropomodulin (Tmod) gene family. Genomics. 2001;73(2):127–39. doi:10.1006/geno.2000.6501. [Google Scholar] [CrossRef]
42. Pappas CT, Mayfield RM, Henderson C, Jamilpour N, Cover C, Hernandez Z, et al. Knockout of Lmod2 results in shorter thin filaments followed by dilated cardiomyopathy and juvenile lethality. Proc Nat Acad Sci USA. 2015;112(44):13573–8. doi:10.1073/pnas.1508273112. [Google Scholar] [CrossRef]
43. Gratzinger D, Zhao S, West R, Rouse RV, Vogel H, Gil EC, et al. The transcription factor LMO2 is a robust marker of vascular endothelium and vascular neoplasms and selected other entities. Am J Clin Pathol. 2009;131(2):264–78. doi:10.1309/AJCP5FP3NAXAXRJE. [Google Scholar] [CrossRef]
44. Xie MJ, Yagi H, Iguchi T, Yamazaki H, Hanamura K, Matsuzaki H, et al. Phldb2 is essential for regulating hippocampal dendritic spine morphology through drebrin in an adult-type isoform-specific manner. Neurosci Res. 2022;185:1–10. doi:10.1016/j.neures.2022.09.010. [Google Scholar] [CrossRef]
45. Eom S, Lee C. Functions of intronic nucleotide variants in the gene encoding pleckstrin homology like domain beta 2 (PHLDB2) on susceptibility to vascular dementia. World J Biol Psychiatry. 2013;14(3):227–32. doi:10.3109/15622975.2011.630407. [Google Scholar] [CrossRef]
Cite This Article
 Copyright © 2024 The Author(s). Published by Tech Science Press.
This work is licensed under a Creative Commons Attribution 4.0 International License , which permits unrestricted use, distribution, and reproduction in any medium, provided the original work is properly cited.
 Downloads
 Citation Tools