
 Submit a Paper
 Propose a Special lssue
 Open Access
ARTICLE
Predictive Value of Echocardiography Combined with Cardiopulmonary Exercise Testing for Functional Status and Adverse Outcomes of Adult Patients with Congenital Heart Disease
The First Affiliated Hospital of Kunming Medical University, Kunming, 650034, China
* Corresponding Author: Ailing Yang. Email:
Congenital Heart Disease 2025, 20(6), 703-716. https://doi.org/10.32604/chd.2025.072819
Received 04 September 2025; Accepted 15 December 2025; Issue published 10 February 2026
 View Full Text
 Download PDF
Abstract
Background: We aimed to explore the value of echocardiography plus cardiopulmonary exercise testing (CPET) for predicting the functional status and adverse outcomes of adult patients with congenital heart disease (CHD), and to develop a multivariate prediction model. Methods: Subjects (135 in total) in this single-center prospective cohort study were enrolled from adult patients suffering from CHD treated in this hospital during January 2021 and August 2023. Standardized echocardiography and CPET were conducted on all subjects at enrollment, with such indicators as left ventricular ejection fraction (LVEF), right ventricular function parameters, peak oxygen uptake (peak VO2), and carbon dioxide ventilatory equivalent slope [ventilation (VE)/carbon dioxide output (VCO2) slope] recorded. Results: In contrast with the non-event group, the event group exhibited higher levels of N-terminal pro-B-type natriuretic peptide (NT-proBNP) and lower LVEF and peak VO2 (p < 0.05). Four key predictors (age, NT-proBNP, LVEF and peak VO2) were acquired after Least Absolute Shrinkage and Selection Operator (LASSO) regression analysis. According to Cox analysis, age and NT-proBNP served as risk factors, while LVEF and peak VO2 acted as protective factors (p < 0.05). As to the Logistic model, its area under curve (AUC) was 0.920, the mean AUC in cross-validation was 0.919, and the SHAPLEY Additive exPlanations (SHAP) analysis results were in line with the Cox model. Conclusions: Echocardiography plus CPET is capable of effectively forecasting the functional status and adverse outcomes of adult CHD patients, and the key independent predictors are age, NT-proBNP, LVEF and peak VO2.Keywords
Congenital heart disease (CHD) is one of the most common congenital malformations, and evident improvements have been made in the long-term survival rate of patients suffering from CHD with the continuous advancement of surgery, perioperative management, and imaging technologies [1]. Accordingly, increasingly more CHD patients attain adulthood, but these patients are still at a lifetime risk of cardiac function deterioration, including heart failure, arrhythmias, and early death despite successful corrective or palliative surgery [2]. Hence, timely and accurate evaluation of functional status is of great clinical significance for long-term risk stratification and individualized management of adult CHD patients.
Echocardiography, a key imaging approach to assess cardiac structure and function, is able to offer several structural and functional indicators like left ventricular ejection fraction (LVEF) and right ventricular function. However, the above-mentioned indicators are static indicators, with certain limitations in reflecting cardiorespiratory reserve, exercise adaptation competence, and early functional decline [3]. Cardiopulmonary exercise testing (CPET) is capable of dynamically integrating and assessing the comprehensive responses of the heart, lungs, and surrounding tissues under exercise stress, and reflecting aerobic capacity and ventilation efficiency through such parameters as peak oxygen uptake (peak VO2) and carbon dioxide ventilatory equivalent slope [ventilation (VE)/carbon dioxide output (VCO2) slope], which has exhibited favorable prognostic value in various cardiovascular diseases [4]. Nonetheless, the systematic research on the application of echocardiography plus CPET indicators to the prediction of clinical outcomes in adult CHD patients remains scarce, and robust prediction models established based on evidence-based approaches are unavailable.
For the last few years, machine learning has been increasingly leveraged in construction of medical prognostic models since it can identify variables of the most predictive characteristic among multidimensional data and enhance the accuracy and interpretability of models [5]. A more comprehensive risk assessment system is expected to be developed by integrating structural imaging indicators, dynamic functional parameters, and biomarkers, thus enabling earlier identification of high-risk patients and optimization of follow-up and intervention strategies.
Given this, a prospective cohort design was adopted in the present study, baseline echocardiography and CPET indicators were integrated, key variables were obtained through the least absolute shrinkage and selection operator (LASSO) regression analysis, and a multivariate prediction model was established through Cox proportional hazards model and Logistic regression. Besides, the contribution of each variable to prediction was assessed by combining interpretable machine learning methods to validate the clinical value of echocardiography plus CPET for predicting the functional status and adverse outcomes of adult CHD patients, rendering a basis for precise risk stratification and dynamic management.
This single-center prospective cohort study aims at investigating the predictive value of baseline echocardiography plus CPET parameters for long-term functional status of adult CHD patients. Sample size calculation was accomplished as follows: as revealed by pre-experiments, the area under curve (AUC) of echocardiography plus CPET parameters for predicting heart failure readmission was about 0.78, and the AUC of univariate parameters was about 0.68. Sample size estimation was completed using PASS 15 software (α = 0.05, β = 0.2, loss-to-follow-up rate = 10%), based on which 120–150 patients should be enrolled to acquire sufficient statistical power. Therefore, totally 135 adult CHD patients completing a follow-up for at least 24 months prior to data analysis were recruited in the present study from January 2021 to August 2023. CHD subtypes were categorized into five clinically meaningful groups: ASD/PFO, VSD/AVSD, repaired TOF, PS/RVOT obstruction, and complex CHD (including TGA, ccTGA, and single-ventricle physiology). The subtype distribution and its association with primary outcomes were further analyzed to determine whether CHD morphology influenced prognosis. The present study had been reviewed and approved by the hospital Ethics Committee, and gotten the informed consent form signed by subjects.
2.2 Inclusion and Exclusion Criteria
The following inclusion criteria were adopted: (1) patients who were aged ≥18 years old and diagnosed with CHD, (2) those with stable condition, without signs of acute exacerbation of heart failure, and (3) those completing follow-up of ≥24 months as required by the present study.
The implemented exclusion criteria involved: (1) patients requiring emergency intervention due to acute heart failure, myocardial infarction or arrhythmia in past 4 weeks, (2) those intolerable to CPET (for instance, those with exercise contraindications, severe pulmonary diseases, or limb disability), (3) those with malignant tumors, severe liver or kidney dysfunction, or life expectancy < 2 years, or (4) those unable to complete follow-up (remote residence and unplanned long-term residence, for example).
2.3 Standardized Echocardiography
Standardized echocardiography was performed on all subjects at enrollment. In brief, standardized echocardiography was accomplished independently by two sonographers with senior titles using EPIQ 7C (Philips, Netherlands) or Vivid E95 (GE, USA), followed by mutually blinded assessment. Ultrasound parameters included LVEF, right ventricular fractional area change (RV FAC), tricuspid annular plane systolic excursion (TAPSE), tissue Doppler right ventricular S′ peak (RV-S′), and three-dimensional ventricular strain.
All ventricular strain analyses were performed offline using a uniform post-processing platform to avoid vendor-related variability. Speckle-tracking analysis was conducted with EchoPAC software (GE Healthcare, version 204), which uses an automated endocardial border detection algorithm with manual adjustments when necessary. Left ventricular global longitudinal strain (LV-GLS) was derived from apical four-chamber, two-chamber and three-chamber views, while right ventricular free-wall longitudinal strain (RV-FWS) was obtained from an RV-focused apical four-chamber view. All strain values were reported as peak systolic strain.
CPET was completed within one week after echocardiography. Briefly, all subjects underwent a symptom-restricted progressive load exercise test, and an exhaled gas analyzer (Ultima PF, MedGraphics, USA) was used for measurement based on either the Bruce protocol or the Ramp protocol depending on the physical condition of patients. The following parameters were recorded: peak VO2 (unit mL/kg/min), VE/VCO2 slope, anaerobic threshold (AT), and duration of exercise. During the test, the ECG and blood pressure were continuously monitored, and a valid test was considered in the case of respiratory exchange ratio (RER) ≥ 1.10 or exceeding 85% of the predicted maximum heart rate. Two standardized exercise protocols were used: the Bruce protocol and a symptom-limited Ramp protocol. The selection of protocol followed established CPET clinical practice. The Bruce protocol was applied to patients with good functional capacity, no significant exercise limitation, and the ability to tolerate larger stage-wise workload increments. The Ramp protocol was used in patients with lower exercise tolerance, chronotropic impairment, or CHD related physiological limitations, allowing smoother and individualized workload increments. Overall, 92 patients (68.15%) performed the Ramp protocol and 43 patients (31.85%) performed the Bruce protocol. Baseline peak VO2 and VE/VCO2 slope did not differ significantly between the two protocol groups (peak VO2: 17.84 ± 4.63 vs. 18.25 ± 4.37 mL/kg/min, p = 0.626; VE/VCO2 slope: 32.63 ± 5.25 vs. 33.13 ± 5.07, p = 0.603). Therefore, protocol type was unlikely to introduce systematic bias in the analysis.
2.5 Determination of Other Indicators
The six-minute walk test (6MWT) was conducted on all subjects at baseline to record walking distance and evaluate New York Heart Association (NYHA) functional classification [6]. Laboratory indicators such as blood routine, renal function, and N-terminal pro-B-type natriuretic peptide (NT-proBNP) were collected, and basic medication, surgical history, and concurrent diseases were recorded.
2.6 Follow-Up and Outcome Events
Followed-up was carried out on all subjects for 24 months through outpatient assessment and telephone interviews once every 6 months to collect information on survival status, readmission and functional variations of subjects. The primary outcomes included (1) all-cause death and (2) heart failure readmission, while secondary outcomes were (1) deterioration of ≥1 NYHA class from baseline, (2) a decline of >20% in the walking distance in 6MWT compared with baseline, and (3) obvious decreases in CPET parameters (e.g., a drop of ≥15% in peak VO2 and an elevation of ≥15% in VE/VCO2). All primary outcome events were adjudicated using a standardized process. When a hospitalization was reported, complete medical records were retrieved and reviewed. Heart failure readmissions were identified based on clinical symptoms, objective evidence of volume overload, and the requirement for intravenous diuretics or inotropic therapy, according to contemporary ESC heart failure criteria. Each event was independently evaluated by two senior cardiologists who were not involved in data collection. In cases of disagreement, a third cardiologist reviewed the case to reach a final consensus. This adjudication procedure ensured accurate event classification and minimized misclassification bias. If patients underwent additional surgical interventions or transplantation during follow-up, their subsequent data were right-censored.
The follow-up time for each patient was calculated from the date of baseline enrollment to the date of the first primary outcome event (all-cause death or heart failure readmission). For patients who did not experience a primary event, follow-up time was censored at the date of the last clinical assessment or at the end of the 24-month follow-up window, whichever came first. These time-to-event data were used for Cox proportional hazards modeling.
SPSS 26.0 software and Python language (mainly analysis libraries including scikit-learn, lifelines, statsmodels, and shap) were employed for data analysis in the present study. Continuous variables were first tested for normality using the Shapiro-Wilk test. Variables with a normal distribution were presented as mean ± standard deviation, and between-group comparisons were performed using the independent-samples t test. Variables with a non-normal distribution were expressed as median (interquartile range) and compared using the Mann-Whitney U test. Categorical variables were described as frequencies and percentages and compared using the χ2 test or Fisher’s exact test when appropriate. To identify the baseline predictors showing significantly strong correlations with primary outcome events, feature selection was first accomplished using the LASSO regression model, the optimal regularization parameter λ was then acquired through 10-fold cross-validation, and the variables exhibiting non-zero coefficients were retained for subsequent modeling. In survival analysis, the independent association between selected variables and primary outcome events were analyzed using the Cox proportional hazards model (lifelines.CoxPHFitter), with results reported as hazard ratios (HR) and their 95% confidence intervals (95% CI), and the log-likelihood ratio test was executed to assess the overall significance of the model. As to classification prediction, a machine learning Logistic regression model was established based on key variables to evaluate its ability to discriminate primary outcome events. Receiver operating characteristic (ROC) curves were plotted, and the AUC value was calculated to assess model performance. In addition, the optimal classification threshold was determined based on the Youden index, followed by calculation of other indicators such as sensitivity and specificity. 5-fold cross-validation was adopted to evaluate model robustness, and the AUC value of each fold and the mean AUC value were reported. Furthermore, to enhance model interpretability, SHAPLEY Additive exPlanations (SHAP) analysis was carried out to interpret the Logistic regression model, visually displaying the direction and contribution of each variable to the outputs predicted by the model. Measurement reproducibility was evaluated using intraclass correlation coefficients (ICC) and Bland-Altman analysis for key echocardiographic parameters. All statistical tests were two-tailed, and p < 0.05 denoted a difference of statistical significance.
3.1 Differences in Patients’ Baseline Characteristics between the Event and Non-Event Groups
The 135 adult CHD patients enrolled in the present study were assigned into an event group (n = 42) and a non-event group (n = 93) based on the presence and absence of primary outcome events (all-cause death and heart failure readmission) during follow-up. The two groups showed no statistically significant differences in gender, age, body mass index (BMI), history of cardiac surgery, NYHA functional class, hypertension and atrial fibrillation (p > 0.05), implying that the basic characteristics were comparable. The median follow-up duration for the entire cohort was 23.4 months (IQR 21.0–24.0). Among the 42 patients who experienced primary outcome events, the median time to event was 14.2 months (IQR 9.3–18.6). For patients without primary events, the median follow-up time at censoring was 24.0 months.
As to cardiac function-related indicators, the NT-proBNP level was significantly higher, whereas LVEF and left ventricular global longitudinal strain (LV-GLS) were significantly lower in the event group than in the non-event group (p < 0.05), signifying the presence of significant cardiac function impairment at baseline.
With respect to exercise capacity, the peak VO2 and AT significantly declined in the event group compared with those in the non-event group, suggesting poorer cardiopulmonary reserve capacity in the event group (p < 0.05). The exercise duration and the walking distance in 6MWT also slightly decreased in the event group in comparison to those in the non-event group, but the differences were of no statistical significance (p > 0.05). Right ventricular function-related parameters (TAPSE, RV FAC, RV-S′, and RV-FWS) also displayed some decreases in the event group compared with those in the non-event group, but the differences were not statistically significant (p > 0.05).
Additional baseline variables, including pharmacotherapy, residual postoperative lesions and major comorbidities, were also compared between the two groups. None of these factors demonstrated statistically significant differences. Therefore, they were unlikely to serve as major confounders in the relationship between baseline cardiopulmonary parameters and long-term outcomes (Table 1).
Table 1: Baseline characteristics of event and non-event groups.
| Item | Non-Eventgroup (n = 93) | Eventgroup (n = 42) | t/χ2 | p |
|---|---|---|---|---|
| Age (year) | 41.26 ± 11.88 | 44.53 ± 12.12 | 1.471 | 0.144 |
| Male [n (%)] | 52 (55.91%) | 25 (59.52%) | 0.154 | 0.695 |
| BMI (kg/m2) | 22.83 ± 3.24 | 23.45 ± 3.58 | 0.996 | 0.321 |
| NYHA class [I/II/III] | 34/45/14 | 10/20/12 | 4.192 | 0.123 |
| History of cardiac surgery [n (%)] | 64 (68.82%) | 29 (69.05%) | 0.001 | 0.979 |
| Hypertension [n (%)] | 24 (25.81%) | 17 (40.47%) | 2.944 | 0.086 |
| Atrial fibrillation [n (%)] | 16 (17.20%) | 12 (28.57%) | 2.274 | 0.132 |
| NT-proBNP (pg/mL) | 190 (120–260) | 240 (160–330) | - | 0.008 |
| LVEF (%) | 58.63 ± 5.57 | 56.18 ± 6.32 | 2.268 | 0.025 |
| TAPSE (mm) | 20.18 ± 2.07 | 19.45 ± 2.63 | 1.739 | 0.084 |
| RV FAC (%) | 40.83 ± 6.84 | 39.02 ± 7.46 | 1.384 | 0.169 |
| RV-S′ (cm/s) | 11.53 ± 1.84 | 10.89 ± 2.04 | 1.808 | 0.073 |
| RV-FWS (%) | −21.21 ± 3.13 | −20.37 ± 3.43 | 1.401 | 0.164 |
| LV-GLS (%) | −18.53 ± 2.27 | −17.13 ± 2.58 | 3.178 | 0.002 |
| Peak VO2 (mL/kg/min) | 19.64 ± 3.57 | 17.93 ± 3.34 | 2.627 | 0.010 |
| AT (mL/kg/min) | 12.28 ± 2.43 | 11.04 ± 2.63 | 2.675 | 0.008 |
| Exercise duration (min) | 8.2 (7.0–9.5) | 7.4 (6.1–8.8) | - | 0.056 |
| Walking distance in 6MWT (m) | 462 (398–512) | 438 (380–495) | - | 0.099 |
| ACEI/ARB (%) | 20 (21.51%) | 12 (28.57%) | 0.802 | 0.371 |
| β-blocker (%) | 26 (27.96%) | 14 (33.33%) | 0.402 | 0.526 |
| Diuretics (%) | 18 (19.35%) | 10 (23.81%) | 0.373 | 0.542 |
| Anticoagulants (%) | 15 (16.13%) | 9 (21.43%) | 0.529 | 0.467 |
| Residual shunt (%) | 8 (8.60%) | 5 (11.90%) | 0.339 | 0.561 |
| Moderate-severe valvular regurgitation (%) | 10 (10.75%) | 7 (16.67%) | 0.893 | 0.345 |
| Pulmonary hypertension (%) | 11 (11.83%) | 7 (16.67%) | 0.556 | 0.456 |
| COPD (%) | 3 (3.23%) | 2 (4.76%) | 0.225 | 0.635 |
| Renal impairment (%) | 4 (4.30%) | 3 (7.14%) | 0.455 | 0.499 |
| Anemia (%) | 9 (9.68%) | 6 (14.29%) | 0.532 | 0.466 |
3.2 Distribution of CHD Subtypes
The study population included five major CHD subtypes: ASD/PFO (35.6%), VSD/AVSD (25.2%), repaired TOF (16.3%), PS/RVOT obstruction (12.6%), and complex CHD (10.4%). The distribution of CHD subtypes did not differ significantly between the event group (n = 42) and the non-event group (n = 93) (all p > 0.05) (Table 2). This indicates that CHD morphology was unlikely to confound the associations between baseline cardiopulmonary parameters and long-term adverse outcomes.
Table 2: Distribution of congenital heart disease (CHD) subtypes in the total cohort and in the event vs. non-event groups.
| CHD Subtype | Total (n = 135) | Eventgroup (n = 42) | Non-Eventgroup (n = 93) | χ2 | p |
|---|---|---|---|---|---|
| ASD/PFO | 48 (35.6%) | 14 (33.4%) | 34 (36.6%) | 0.131 | 0.716 |
| VSD/AVSD | 34 (25.2%) | 11 (26.2%) | 23 (24.7%) | 0.032 | 0.856 |
| TOF repaired | 22 (16.3%) | 7 (16.7%) | 15 (16.1%) | 0.006 | 0.938 |
| PS/RVOT obstruction | 17 (12.6%) | 5 (11.9%) | 12 (12.9%) | 0.026 | 0.871 |
| Complex CHD | 14 (10.4%) | 5 (11.9%) | 9 (9.7%) | 0.154 | 0.694 |
| Total | 135 | 42 | 93 | - | - |
3.3 Occurrence of Primary Outcome Events
Among the 135 adult CHD patients followed up for 24 months, 42 cases of primary outcome events were observed during follow-up, with an event incidence rate of 31.11%, comprising 38 (28.15%) cases of heart failure readmission and 4 (2.96%) cases of all-cause death.
From the perspective of temporal distribution, 15 (11.11%) patients had primary outcome events within 6 months, including 14 cases of heart failure readmission and 1 case of death. At 12 months of follow-up, totally 32 (23.70%) cases of primary outcome events were observed, including 15 new cases of readmission and 2 new cases of death. At 18 months, the figure further increased to 38 (28.15%), including 6 new cases of readmission and 0 new cases of death. At 24 months of follow-up, the figure reached 42 (31.11%). The above results indicated that high-risk events mainly occurred in the first 12–18 months of follow-up. In the non-event group, a total of 93 (68.89%) patients did not experience heart failure readmission or death during follow-up.
3.4 Comparison of Secondary Outcome Events
During follow-up, significant clinical differences were also observed in functional status-related secondary outcome events. Overall, the incidence rate of functional deterioration was significantly higher in the event group than in the non-event group.
Specifically, totally 27 (20.00%) cases of deterioration of ≥1 NYHA class from baseline were recorded, including 45.24% (19/42) cases in the event group and only 8.60% (8/93) cases in the non-event group, and the difference was statistically significant between groups (p < 0.001). A total of 31 (22.96%) patients displayed a decline of >20% in the walking distance in 6MWT compared with baseline, with an incidence rate of 47.62% (20/42) in the event group and 11.83% (11/93) in the non-event group, and the difference was also of statistical significance between groups (p < 0.001). In terms of CPET, the proportion of patients experiencing a drop of ≥15% in peak VO2 was 47.62% (20/42) in the event group, significantly higher than that in the non-event group [15.05%] (14/93) (p < 0.001), while the proportion of patients with an elevation of ≥15% in VE/VCO2 slope was more significant in the event group (p < 0.001) (Table 3).
Table 3: Comparison of secondary outcome events.
| Indicator | Non-Eventgroup (n = 93) | Eventgroup (n = 42) | χ2 | p |
|---|---|---|---|---|
| Deterioration of ≥1 NYHA class from baseline [n (%)] | 8 (8.60%) | 19 (45.24%) | 24.271 | <0.001 |
| A decline of >20% in the walking distance [n (%)] | 11 (11.82%) | 20 (47.62%) | 20.952 | <0.001 |
| A drop of ≥15% in peak VO2 [n (%)] | 14 (15.05%) | 20 (47.62%) | 16.284 | <0.001 |
| An elevation of ≥15% in VE/VCO2 slope [n (%)] | 12 (12.90%) | 17 (40.48%) | 13.042 | <0.001 |
3.5 Major Prognostic-Related Variables Identified by LASSO Regression Analysis
To further identify the baseline predictors exhibiting associations with primary outcome events, LASSO regression analysis was performed to select variables from Table 1. With the optimal penalty value parameter λ determined through 10-fold cross-validation, it was uncovered that the minimum mean square error was observed at log(λ) = −3.55 (Fig. 1A), and the corresponding model had 4 variables with non-zero regression coefficients, namely age, LVEF, peak VO2 and NT-proBNP, implying that these four variables contribute more to prediction of primary outcome events. Further, according to the LASSO regression coefficient path diagram, with the increase in λ, the coefficients of most variables gradually converged to 0, whereas the coefficients of these four variables were still significantly non-zero at the optimal λ (Fig. 1B), proving their importance in the model.
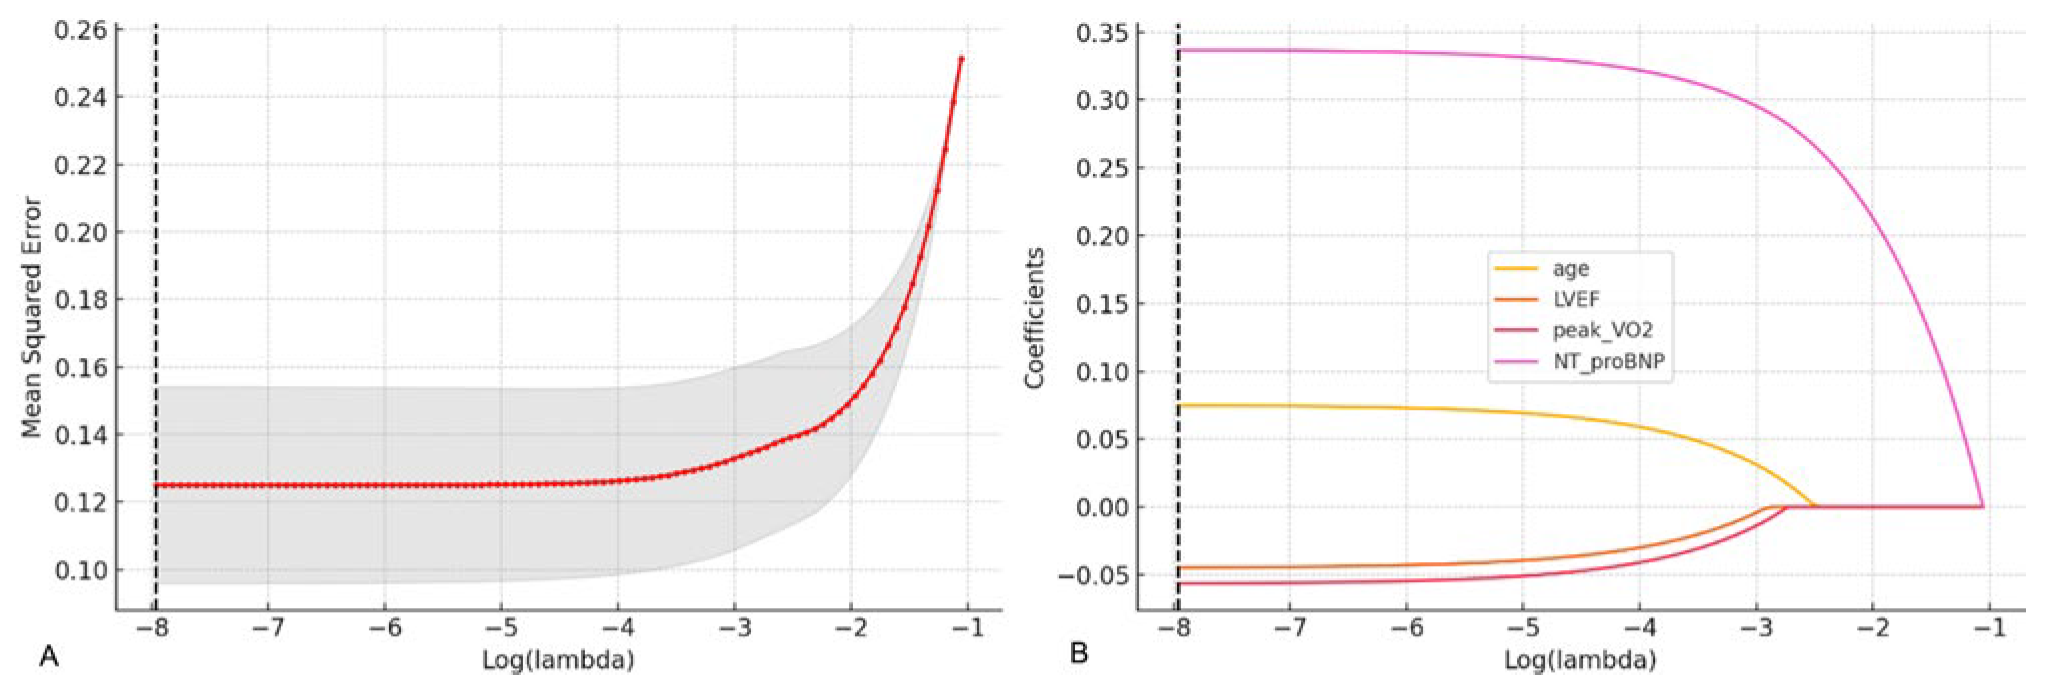
Figure 1: Variable selection by LASSO regression analysis. (A) Optimal λ value determined by 10-fold cross-validation. The horizontal axis is log(λ), and the vertical axis is the mean square error. The red dotted line represents the λ value corresponding to the minimum cross-validation error. (B) LASSO regression coefficient path diagram. The horizontal axis is log(λ), and the vertical axis is the variable regression coefficient. With the elevation in λ, coefficients gradually approach 0.
3.6 Independent Predictive Effect of Baseline Variables on Primary Outcome Events Assessed by Cox Regression Analysis
The risk factors of events were analyzed using the multivariate Cox proportional hazards regression model, and the results manifested that age (HR = 1.05, 95% CI: 1.03–1.07, p < 0.005) and NT-proBNP level (HR = 1.01, 95% CI: 1.00–1.01, p < 0.005) were independent risk factors for poor prognosis, whereas LVEF (HR = 0.94, 95% CI: 0.90–0.98, p < 0.005) and peak VO2 (HR = 0.91, 95% CI: 0.85–0.96, p < 0.005) served as protective factors against poor prognosis. The model had a favorable goodness of fit (concordance = 0.92) and possessed good predictive ability for primary outcome events. As revealed by the log-likelihood ratio test, the model as a whole demonstrated statistically significant performance (χ2 = 62.34, df = 4, p < 0.005) (Fig. 2).
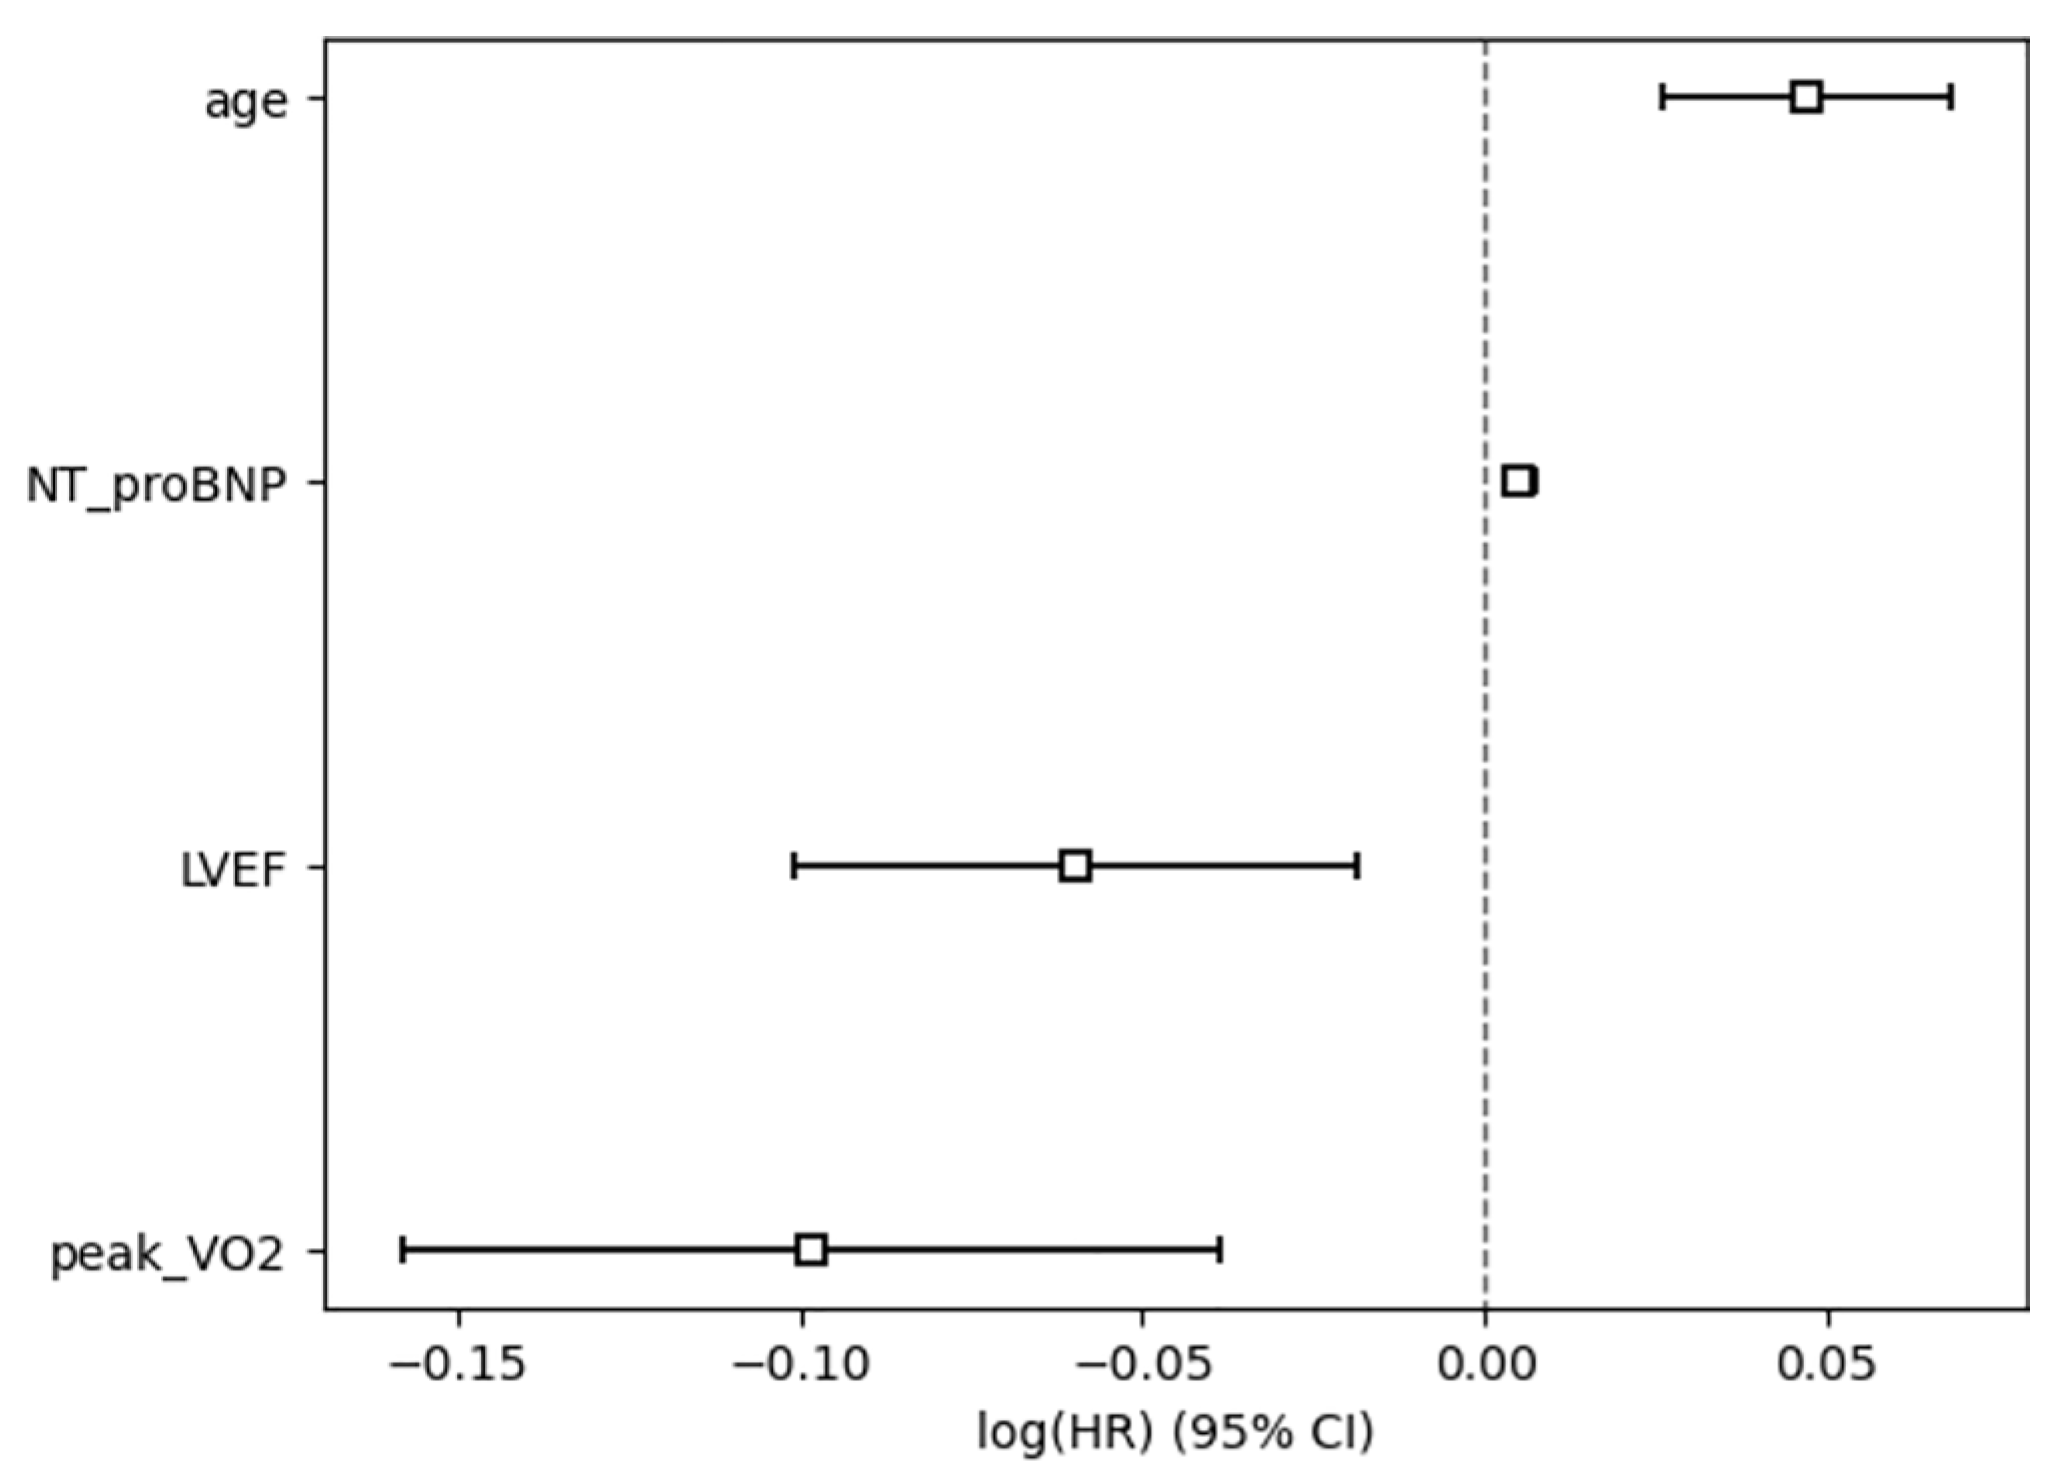
Figure 2: Cox regression analysis of baseline predictor variables for the risk of primary outcome events. The horizontal axis is log(HR), and the vertical axis is the variable name. Variables with HR > 1 [log(HR) > 0] are risk factors, while those with HR < 1 [log(HR) < 0] are protective factors. The CI excluding 0 indicated that the variable exerted a statistically significant effect on primary outcome events.
3.7 Results of ROC Analysis, Feature Contribution and Cross-Validation Based on Logistic Regression Model
To verify the effectiveness of key factors identified by Cox regression in classification prediction, a Logistic regression model was constructed, and its performance was assessed. According to ROC curve analysis, the AUC of the model was 0.920 (Fig. 3), suggesting good discriminant ability of the model. Youden index was calculated based on the ROC curve, and the optimal diagnostic threshold was determined to be 0.167, and the corresponding model sensitivity and specificity were 0.857 and 0.850, further confirming the high accuracy of the model in classification and identification. The results of 5-fold cross-validation revealed that the AUC in each fold was 0.928, 0.911, 0.944, 0.900 and 0.918, respectively, and the mean AUC was 0.919, further proving the robustness of the model.
Moreover, to further assess the importance and directionality of each variable to the prediction results of the model, SHAP analysis was conducted to interpret the Logistic regression model (Fig. 4). The results uncovered that age, NT-proBNP, peak VO2 and LVEF exerted significant effects on model prediction. Among them, age and NT-proBNP mainly had positive SHAP values, indicating that their increases will raise the probability of events predicted by the model. Peak VO2 and LVEF mainly displayed negative SHAP values, implying that their elevations may reduce the risk of events. The results of SHAP analysis further confirmed the predictive value and directional consistency of the above variables in the Logistic regression model.
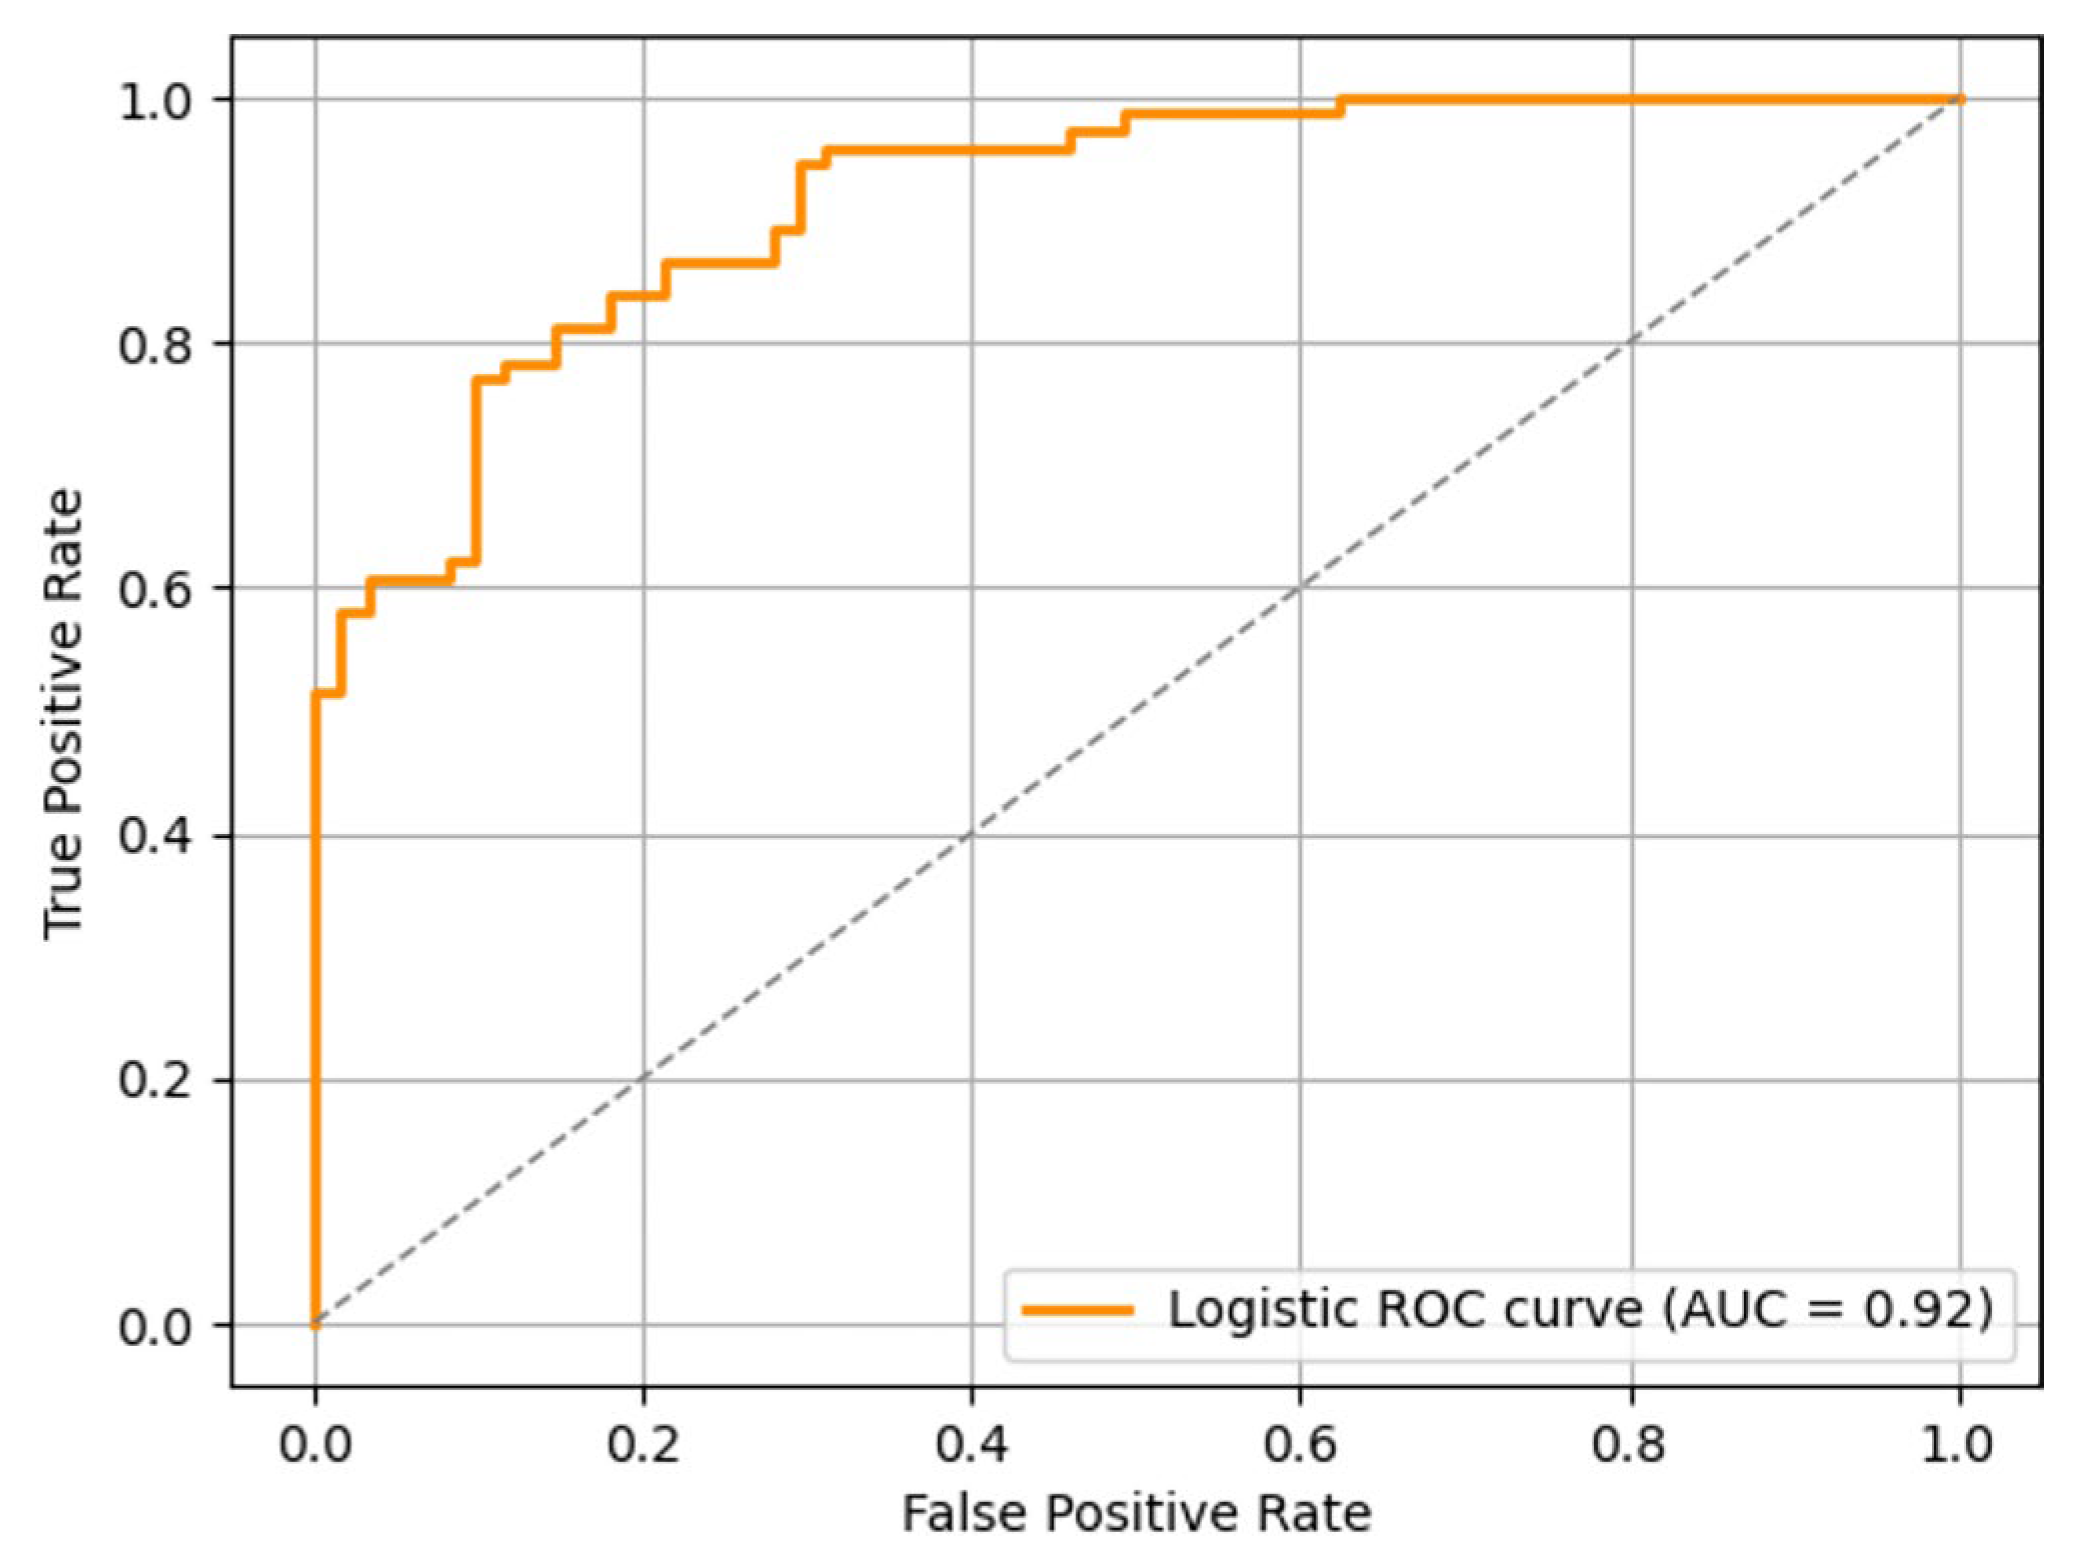
Figure 3: ROC curves plotted by the Logistic regression model.
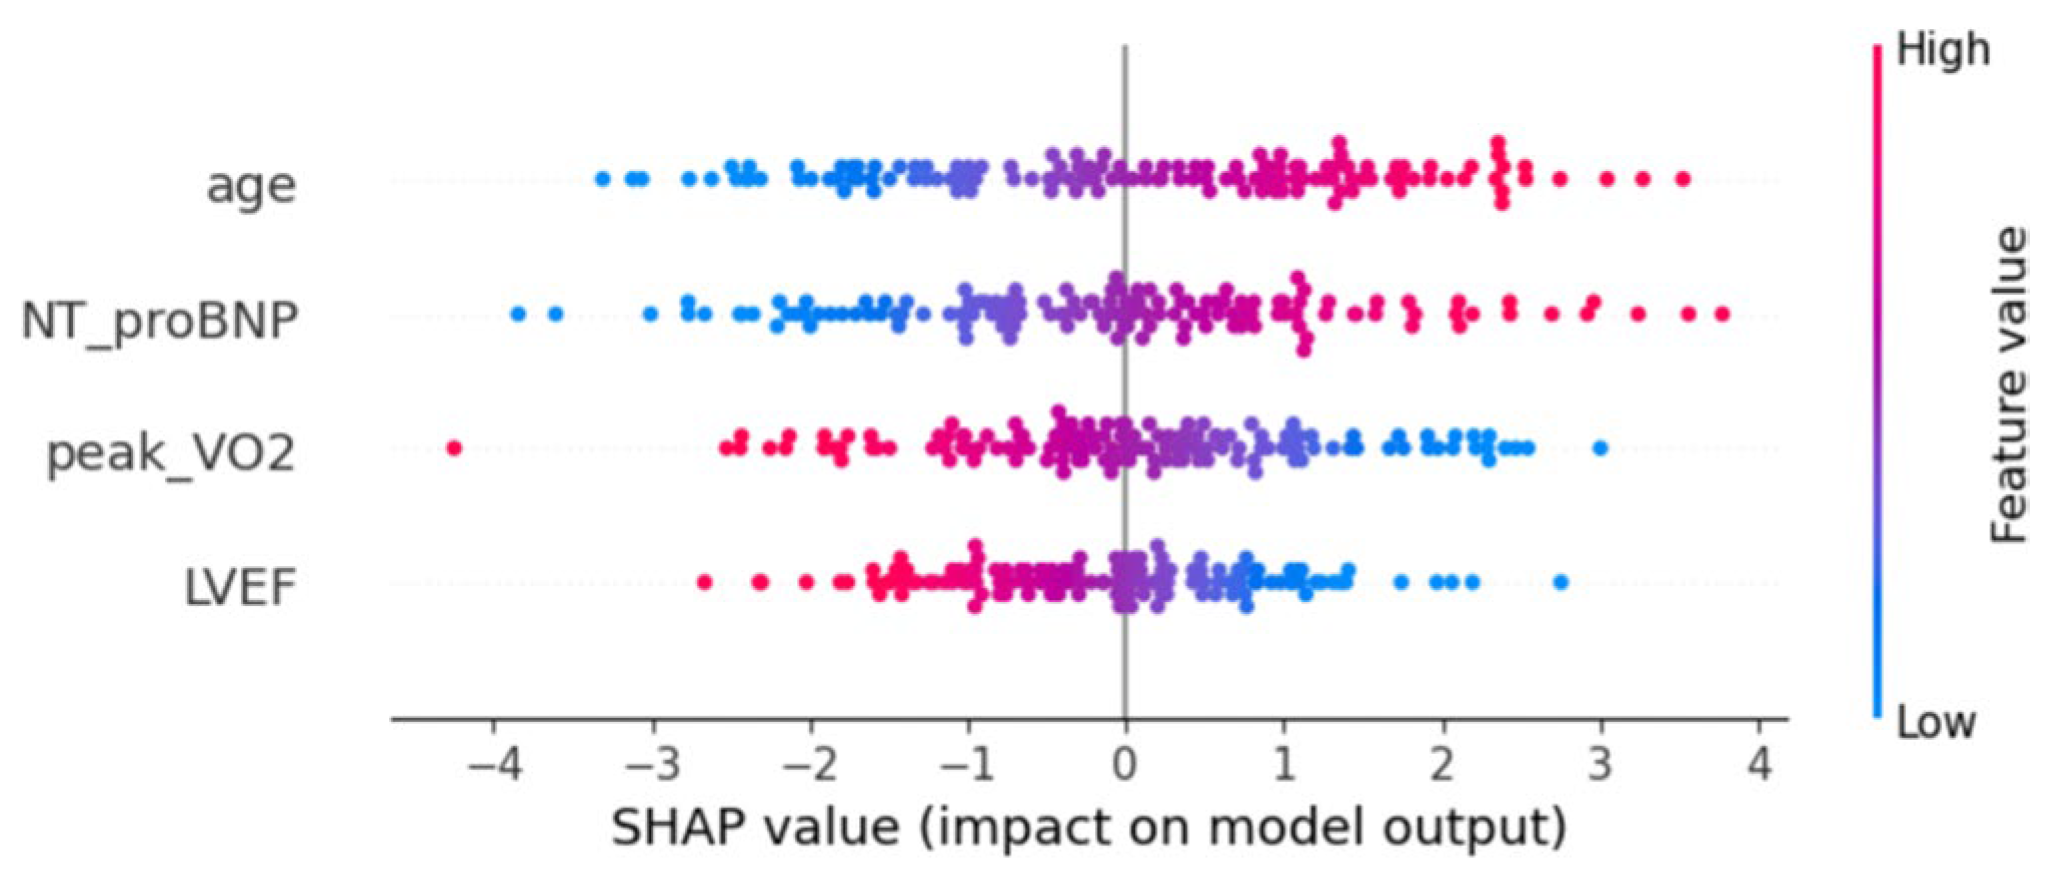
Figure 4: Distribution of SHAP values of variables of the Logistic regression model. Each point stands for the SHAP value of a sample on the corresponding variable. The horizontal axis represents the direction and magnitude (SHAP value) of variables’ effects on prediction results and the vertical axis is the variable name. The color of dots indicates the size of variable values (red for high values, and blue for low values).
3.8 Reproducibility of Echocardiographic Measurements
To assess measurement reproducibility, intra-observer and inter-observer variability analyses were conducted in 20 randomly selected subjects. Two experienced echocardiographers independently measured LVEF, TAPSE, RV FAC, S′, RV-FWS and LV-GLS. Intraclass correlation coefficients (ICC) and their 95 percent confidence intervals demonstrated excellent reproducibility for all parameters. For strain-derived indices, Bland-Altman analysis demonstrated narrow limits of agreement, with intra-observer LoA of +2.1% to −1.9% for LV-GLS and +3.1% to −2.9% for RV-FWS, and inter-observer LoA of +2.6% to −2.3% and +3.4% to −3.0%, respectively. LVEF also showed acceptable reproducibility (intra-observer LoA +4.2% to −4.0%; inter-observer LoA +5.1% to −4.8%). Detailed results are summarized in Table 4.
Table 4: Intra-observer and inter-observer reproducibility of echocardiographic measurements.
| Parameter | Intra-Observer ICC (95% CI) | Inter-Observer ICC (95% CI) | Intra-Observer LoA | Inter-Observer LoA |
|---|---|---|---|---|
| LVEF | 0.92 (0.86 to 0.96) | 0.89 (0.82 to 0.94) | +4.2% to −4.0% | +5.1% to −4.8% |
| TAPSE | 0.91 (0.84 to 0.95) | 0.88 (0.80 to 0.93) | Not applicable | Not applicable |
| RV FAC | 0.88 (0.80 to 0.93) | 0.85 (0.77 to 0.91) | Not applicable | Not applicable |
| S′ | 0.90 (0.83 to 0.94) | 0.86 (0.78 to 0.92) | Not applicable | Not applicable |
| RV-FWS | 0.87 (0.79 to 0.92) | 0.84 (0.75 to 0.90) | +3.1% to −2.9% | +3.4% to −3.0% |
| LV-GLS | 0.93 (0.88 to 0.96) | 0.90 (0.84 to 0.95) | +2.1% to −1.9% | +2.6% to −2.3% |
During the 24-month follow-up, primary outcome events emerged in 42 (31.11%) out of the 135 subjects, including heart failure readmission in 38 subjects and all-cause death in 4 subjects, implying that patients with stable CHD are still at a high risk of poor prognosis in the short and medium term. Notably, most events occurred within the first 12–18 months of follow-up, indicating that high-risk periods are predominantly concentrated in the early stage. These findings are basically in line with those of previous research on long-term outcomes of CHD patients after surgery: Adult CHD patients experience long-term risk of composite outcomes of heart failure, re-intervention, and even death, and early intervention does not guarantee a complete cure [7]. Therefore, for such patients, there is an urgent need to establish a more sensitive early risk identification mechanism and dynamic follow-up strategy.
Besides primary outcomes, secondary outcome events showing relations to functional status were also systematically assessed in the present study, including deterioration of NYHA class, a decline in walking distance in 6MWT, a drop in peak VO2, and an elevation in VE/VCO2 slope. it was uncovered that the incidence rates of these events significantly rose in the event group when contrasted with the non-event group, especially the deterioration of NYHA class (45.24% vs. 8.60%, p < 0.001) and a drop of ≥15% in peak VO2 (47.62% vs. 15.05%, p < 0.001), maintaining directional coherence with primary outcome event development. This signifies that in the adverse clinical trajectory of CHD patients, functional deterioration often serves as a precursor manifestation, which is consistent with the “functional decline-readmission-death” pathway recently delineated in studies on patients with heart failure. Obata et al. [8] proposed that functional status acted as a vital indicator for the prognosis of patients with heart failure, and heart failure patients with low activities of daily living (ADL) scores at discharge had a significantly higher risk of death and readmission. Polsinelli et al. [9] also discovered that heart failure readmission served as a crucial predictor of increased mortality after aortic valve surgery. Thus, proactive detection of CHD patients exhibiting progressive functional deterioration is paramount for prognostic optimization. In the present study, secondary outcomes were clearly quantified for the first time, with deterioration of ≥1 NYHA class from baseline, a decline of >20% in the walking distance in 6MWT, a drop of ≥15% in peak VO2 and an elevation of ≥15% in VE/VCO2 as the judgment nodes for progressive functional deterioration, rendering quantifiable dynamic monitoring benchmarks and intervention thresholds for clinical implementation.
Moreover, to investigate the key predictors of primary outcomes, LASSO regression was employed to identify variables, which were then verified by the Cox proportional hazards model. Finally, four variables were identified as independent predictors: age, LVEF, peak VO2 and NT-proBNP, with age and NT-proBNP as risk factors for poor prognosis and LVEF and peak VO2 as protective factors. The four variables demonstrated statistically significant independence in the Cox model (p < 0.05), and the concordance was 0.92, hinting favorable goodness of fit and strong discrimination ability of the model.
From a mechanistic perspective, age, NT-proBNP, LVEF, and peak VO2 possess well-established pathophysiological underpinnings for predicting clinical outcomes in adult CHD patients. Advancing age exhibits strong correlations with structural and functional degeneration of the cardiovascular system, including diminished aortic elasticity, cardiomyocyte apoptosis, and reduced ventricular compliance, all of which compromise cardiac adaptive capacity to pressure and volume stressors [10]. Additionally, age-related chronic inflammatory states may also accelerate progressive cardiac functional decline by boosting maladaptive ventricular remodeling and endothelial dysfunction [11]. Previous studies have manifested that the incidence rate of major adverse cardiovascular events (MACE) increases with age, and patients aged over 65 years old have a significantly reduced survival rate after extracorporeal cardiopulmonary resuscitation [12,13]. Elevations in NT-proBNP indicate abnormal increases in ventricular wall tension and pressure loading, especially sharp elevations in the case of ventricular dilation, increased left ventricular end-diastolic pressure and raised pulmonary artery pressure, which often indicate potential volume load imbalance and weakened ventricular compensatory function in CHD patients [14,15]. As revealed by a meta-analysis study, NT-proBNP can serve as a powerful predictor of death and cardiac events in adult CHD patients, and its elevation leads to nearly 2-fold increase in the risk of cardiovascular events [16]. Declines in LVEF represent a core manifestation of impaired LV pump function, usually implying myocardial injury and remodeling. CHD patients exhibit heightened vulnerability to transition from compensated states to decompensated phases owing to chronic ventricular volume or pressure load, triggering progressive declines in ejection fraction and increased risk of heart failure [17]. Leczycki et al. [18] found that CHD patients with moderate-to-severe impairments of systemic ventricular systolic function displayed a significantly increased risk of sudden cardiac death, and close associations were found between decreased LVEF and poor prognosis. Peak VO2 is a key indicator for cardiorespiratory reserve and aerobic metabolic capacity, and its decline is often related to limited cardiac output, abnormal pulmonary ventilation/perfusion, and peripheral oxygen utilization disorders, which is more common in CHD patients with right ventricular dysfunction and altered pulmonary blood flow [19]. Research has proved that peak VO2 demonstrates predictive efficacy comparable to LVEF yet outperforms it under dynamic stress conditions [20]. Collectively, the four indicators elucidate CHD prognosis through complementary dimensions: structural function, metabolic status, biomarkers and demographic characteristics, laying a scientific foundation for the construction of multi-dimensional risk assessment models. Although several echocardiographic and CPET parameters in our study remained within conventional normal reference ranges, the differences observed between the event and non-event groups still carry clear clinical significance in the context of adult congenital heart disease. Adult CHD patients frequently rely on long-term compensatory mechanisms to maintain apparently normal values, and even subtle reductions within the normal range may indicate declining cardiopulmonary reserve [21]. This is particularly true for parameters such as LVEF and peak VO2. For example, fractional decreases in LVEF that remain above the traditional lower limit of normal may still reflect progressive ventricular remodeling or early systolic dysfunction in patients with chronic volume or pressure load [22]. Similarly, declines in peak VO2 within the normal range often signal impaired exercise tolerance, reduced stroke volume augmentation or abnormal peripheral oxygen utilization, all of which are recognized as early markers of adverse outcomes in CHD [23]. NT-proBNP behaves in a similar way. Although absolute values may fall within the accepted normal range, modest increases can still reflect early ventricular wall stress or subclinical volume overload in CHD patients who generally have limited hemodynamic reserve [24]. Taken together, these subtle abnormalities should be regarded as early indicators of impaired cardiovascular adaptability rather than mere statistical variation without biological relevance.
Furthermore, to further verify model practicability, a Logistic regression model was established and assessed by ROC curve analysis, 5-fold cross-validation and SHAP analysis. The results uncovered that the AUC of the model was 0.920, with sensitivity and specificity of over 0.85, and the mean AUC in cross-validation was 0.919, hinting good robustness. SHAP analysis was further conducted to explore the direction and intensity of the individualization effect of each variable on model output, and it was confirmed that age and NT-proBNP acted as positive risk factors, while LVEF and peak VO2 functioned as negative protective factors, highly in line with the results of the Cox model. SHAP, a cutting-edge interpretive tool applied in the field of clinical machine learning in recent years, is capable of presenting the marginal effects of variables in an individualized and graphical manner, rendering doctors a clear risk attribution map [25]. In the present study, the SHAP plot clearly delineated the relationship between the variable value size and the predicted risk, which is expected to enhance clinical confidence and practical application possibilities. Although adult CHD encompasses diverse anatomical phenotypes, the major subtypes in our cohort were evenly distributed between the event and non-event groups without statistically significant differences. This suggests that baseline morphology was unlikely to confound the observed prognostic associations. Moreover, the four predictors identified by both LASSO and Cox analyses, including age, NT-proBNP, LVEF and peak VO2, are well-established prognostic markers with biological relevance that extends across different CHD morphologies. These factors support the applicability of the model to a broad adult CHD population, while acknowledging that subtype-specific validation in larger multicenter cohorts remains necessary. Additionally, although other clinical variables such as pharmacotherapy, residual lesions and comorbidities were compared between the groups, none demonstrated significant differences. Incorporating all of these variables into a multivariable Cox model would substantially increase the risk of overfitting due to the limited number of outcome events. For this reason, a parsimonious modeling strategy was adopted to ensure the stability and interpretability of the prognostic model.
Nevertheless, the present study had some limitations. First, a single-center prospective cohort design was adopted in the present study, the sample size was relatively limited, and effective risk stratification remained unattainable for certain CHD subtypes. Secondly, subjects were patients with stable CHD, and the extrapolation of the results obtained herein thus needs to be further validated in other high-risk groups. In addition, the present study did not differentiate between left-sided and right-sided heart failure. Right-sided heart failure is common in adults with CHD, especially those with pulmonary arterial hypertension, and in such patients LVEF may not adequately reflect global ventricular dysfunction. As a result, the prognostic impact of right ventricular impairment may have been underestimated, and future studies should consider incorporating more comprehensive right ventricular functional parameters. As to research methods, more complex nonlinear machine learning models (XGBoost, random forests, etc.) and deep learning architectures can be introduced, and fused modeling with clinical variables can be carried out in the future to enhance model performance. Meanwhile, development of such tools as clinical web-based risk scoring system and APP represents a viable pathway to facilitate the clinical translation of these research findings.
In conclusion, echocardiography plus CPET displays favorable value for forecasting the functional status and adverse outcomes of CHD patients. Based on prospective follow-up, age, NT-proBNP, LVEF and peak VO2 were identified as key independent factors for predicting all-cause death or heart failure readmission in adult CHD patients, and a multivariate prediction model with good discrimination ability and robustness was constructed. Notably, secondary outcomes such as deterioration of NYHA class, a decline in walking distance in 6MWT, a drop in peak VO2, and an elevation in VE/VCO2 slope showed a highly consistent trend with primary outcomes, implying that functional deterioration acts as a vital early warning sign.
Acknowledgement:
Funding Statement: The authors received no specific funding for this study.
Author Contributions: Conceptualization, Ling Lin and Yasha Liang; methodology, Ling Lin; software, Ling Lin; validation, Ling Lin, Yasha Liang and Yunyu Chen; formal analysis, Ling Lin; investigation, Ling Lin; resources, Rong Su; data curation, Hu Zhang; writing—original draft preparation, Ling Lin; writing—review and editing, Yasha Liang and Ailing Yang; visualization, Yunyu Chen; supervision, Ailing Yang; project administration, Rong Su. All authors reviewed the results and approved the final version of the manuscript.
Availability of Data and Materials: The data that support the findings of this study are available from the Corresponding Author, Ailing Yang, upon reasonable request.
Ethics Approval: This study was conducted in accordance with the Declaration of Helsinki and was approved by the Ethics Committee of The First Affiliated Hospital of Kunming Medical University (Approval No. KMH2021-012). Written informed consent was obtained from all participants prior to enrollment.
Conflicts of Interest: The authors declare no conflicts of interest to report regarding the present study.
Abbreviations
| CHD | congenital heart disease |
| LVEF | left ventricular ejection fraction |
| CPET | cardiopulmonary exercise testing |
| VE | ventilation |
| VCO2 | ventilation carbon dioxide output |
| LASSO | least absolute shrinkage and selection operator |
| RV FAC | right ventricular fractional area change |
| TAPSE | tricuspid annular plane systolic excursion |
| 6MWT | six-minute walk test |
| NYHA | New York Heart Association |
| NT-proBNP | N-terminal pro-B-type natriuretic peptide |
| HR | hazard ratios |
| SHAP | SHAPLEY Additive exPlanations |
| BMI | body mass index |
| LV-GLS | left ventricular global longitudinal strain |
| RV-S′ | right ventricular S′ peak |
References
1. Albertini L , Kawada S , Nair K , Harris L . Incidence and clinical predictors of early and late complications of implantable cardioverter-defibrillators in adults with congenital heart disease. Can J Cardiol. 2023; 39( 3): 236– 45. doi:10.1016/j.cjca.2022.12.012. [Google Scholar] [CrossRef]
2. Meng X , Song M , Zhang K , Lu W , Li Y , Zhang C , et al. Congenital heart disease: types, pathophysiology, diagnosis, and treatment options. MedComm. 2024; 5( 7): e631. doi:10.1002/mco2.631. [Google Scholar] [CrossRef]
3. Gurson SC . Pulmonary atresia with ventricular septal defect without major aorto-pulmonary collateral arteries: echocardiography and the role of computed tomography and magnetic resonance imaging. World J Pediatr Congenit Heart Surg. 2025; 16( 2): 183– 90. doi:10.1177/21501351241289128. [Google Scholar] [CrossRef]
4. Das BB , Godoy A , Kadish T , Niu J . Maximal versus sub-maximal effort during cardiopulmonary exercise testing in adults with congenital heart disease: outcome analysis of short-term cardiac-related events. Cardiol Young. 2021; 31( 1): 91– 6. doi:10.1017/S104795112000339X. [Google Scholar] [CrossRef]
5. Du X , Wang H , Wang S , He Y , Zheng J , Zhang H , et al. Machine learning model for predicting risk of in-hospital mortality after surgery in congenital heart disease patients. Rev Cardiovasc Med. 2022; 23( 11): 376. doi:10.31083/j.rcm2311376. [Google Scholar] [CrossRef]
6. Rohde LE , Zimerman A , Vaduganathan M , Claggett BL , Packer M , Desai AS , et al. Associations between New York heart association classification, objective measures, and long-term prognosis in mild heart failure: a secondary analysis of the PARADIGM-HF trial. JAMA Cardiol. 2023; 8( 2): 150– 8. doi:10.1001/jamacardio.2022.4427. [Google Scholar] [CrossRef]
7. Downing KF , Nembhard WN , Rose CE , Andrews JG , Goudie A , Klewer SE , et al. Survival from birth until young adulthood among individuals with congenital heart defects: CH STRONG. Circulation. 2023; 148( 7): 575– 88. doi:10.1161/CIRCULATIONAHA.123.064400. [Google Scholar] [CrossRef]
8. Obata H , Izumi T , Yamashita M , Mitsuma W , Suzuki K , Noto S , et al. Characteristics of elderly patients with heart failure and impact on activities of daily living: a registry report from super-aged society. J Card Fail. 2021; 27( 11): 1203– 13. doi:10.1016/j.cardfail.2021.05.008. [Google Scholar] [CrossRef]
9. Polsinelli VB , Sun JL , Greene SJ , Chiswell K , Grunwald GK , Allen LA , et al. Hospital heart failure medical therapy score and associated clinical outcomes and costs. JAMA Cardiol. 2024; 9( 11): 1029. doi:10.1001/jamacardio.2024.2969. [Google Scholar] [CrossRef]
10. Jakob P , Lansky AJ , Basir MB , Schonning MJ , Falah B , Zhou Z , et al. Characteristics and outcomes of older patients undergoing protected percutaneous coronary intervention with impella. J Am Heart Assoc. 2025; 14( 9): e038509. doi:10.1161/jaha.124.038509. [Google Scholar] [CrossRef]
11. Damluji AA , Forman DE , Wang TY , Chikwe J , Kunadian V , Rich MW , et al. Management of acute coronary syndrome in the older adult population: a scientific statement from the American heart association. Circulation. 2023; 147( 3): e32– 62. doi:10.1161/cir.0000000000001112. [Google Scholar] [CrossRef]
12. Group TDT , Bosserdt M , Serna-Higuita LM , Feuchtner G , Merkely B , Kofoed KF , et al. Age and computed tomography and invasive coronary angiography in stable chest pain: a prespecified secondary analysis of the DISCHARGE randomized clinical trial. JAMA Cardiol. 2024; 9( 4): 346. doi:10.1001/jamacardio.2024.0001. [Google Scholar] [CrossRef]
13. George N , Stephens K , Ball E , Crandall C , Ouchi K , Unruh M , et al. Extracorporeal membrane oxygenation for cardiac arrest: does age matter? Crit Care Med. 2024; 52( 1): 20– 30. doi:10.1097/ccm.0000000000006039. [Google Scholar] [CrossRef]
14. Pérez-Solé N , de Dios E , Gavara J , Ríos-Navarro C , Marcos-Garces V , Merenciano H , et al. NT-proBNP to guide risk stratification after cardiac rehabilitation in patients with ST-segment elevation myocardial infarction. Eur J Intern Med. 2025; 137: 83– 9. doi:10.1016/j.ejim.2025.04.027. [Google Scholar] [CrossRef]
15. Ahmad A , Lim LL , Morieri ML , Tam CH , Cheng F , Chikowore T , et al. Precision prognostics for cardiovascular disease in Type 2 diabetes: a systematic review and meta-analysis. Commun Med. 2024; 4( 1): 11. doi:10.1038/s43856-023-00429-z. [Google Scholar] [CrossRef]
16. Ghalenoo SR , Mahmoodi Z . Predicting outcome in adult patients with congenital heart disease: a systematic review and meta-analysis on the predictive value of NT-proBNP and high-sensitive troponin T. Int J Vasc Med. 2025; 2025( 1): 1210312. doi:10.1155/ijvm/1210312. [Google Scholar] [CrossRef]
17. Kadoya Y , Omaygenc MO , Abtahi SS , Sritharan S , Nehmeh A , Yam Y , et al. Prognostic value of systolic left ventricular ejection fraction using prospective ECG-triggered cardiac CT. J Cardiovasc Comput Tomogr. 2025; 19( 1): 58– 63. doi:10.1016/j.jcct.2024.10.006. [Google Scholar] [CrossRef]
18. Leczycki P , Banach M , Maciejewski M , Bielecka-Dabrowa A . Heart failure risk predictions and prognostic factors in adults with congenital heart diseases. Front Cardiovasc Med. 2022; 9: 692815. doi:10.3389/fcvm.2022.692815. [Google Scholar] [CrossRef]
19. Wadey CA , Weston ME , Dorobantu DM , Pieles GE , Stuart G , Barker AR , et al. The role of cardiopulmonary exercise testing in predicting mortality and morbidity in people with congenital heart disease: a systematic review and meta-analysis. Eur J Prev Cardiol. 2022; 29( 3): 513– 33. doi:10.1093/eurjpc/zwab125. [Google Scholar] [CrossRef]
20. Burstein DS , Menachem JN , Opotowsky AR . Exercise testing for assessment of heart failure in adults with congenital heart disease. Heart Fail Rev. 2020; 25( 4): 647– 55. doi:10.1007/s10741-019-09867-1. [Google Scholar] [CrossRef]
21. Egbe AC , Miranda WR , Pellikka PA , DeSimone CV , Connolly HM . Prevalence and prognostic implications of left ventricular systolic dysfunction in adults with congenital heart disease. J Am Coll Cardiol. 2022; 79( 14): 1356– 65. doi:10.1016/j.jacc.2022.01.040. [Google Scholar] [CrossRef]
22. van Rosendael PJ , Taha K , Guglielmo M , Teske AJ , van der Harst P , Sieswerda G , et al. Prognostic significance of echocardiographic deformation imaging in adult congenital heart disease. Eur J Clin Invest. 2024; 54( 8): e14200. doi:10.1111/eci.14200. [Google Scholar] [CrossRef]
23. Ferri K , Gich I , Guerra-Balic M , Oviedo GR , Doñate M , Parra M , et al. Aerobic capacity in adults with congenital heart disease: more than VO2peak, a follow-up study. Life. 2022; 12( 12): 2118. doi:10.3390/life12122118. [Google Scholar] [CrossRef]
24. Hendriks PM , van den Bosch AE , Geenen LW , Baggen VJM , Eindhoven JA , Kauling RM , et al. Blood biomarkers predict 10-year clinical outcomes in adult patients with congenital heart disease. JACC Adv. 2024; 3( 9): 101130. doi:10.1016/j.jacadv.2024.101130. [Google Scholar] [CrossRef]
25. Wang K , Tian J , Zheng C , Yang H , Ren J , Liu Y , et al. Interpretable prediction of 3-year all-cause mortality in patients with heart failure caused by coronary heart disease based on machine learning and SHAP. Comput Biol Med. 2021; 137: 104813. doi:10.1016/j.compbiomed.2021.104813. [Google Scholar] [CrossRef]
Cite This Article
 Copyright © 2025 The Author(s). Published by Tech Science Press.
This work is licensed under a Creative Commons Attribution 4.0 International License , which permits unrestricted use, distribution, and reproduction in any medium, provided the original work is properly cited.
 Downloads
 Citation Tools