
 Submit a Paper
 Propose a Special lssue
 Open Access
ARTICLE
Optimization of the Placement and Size of Photovoltaic Source
1 RT-M2A Laboratory, Mathematics Department, College of Science, Jouf University, Sakaka, Saudi Arabia
2 University of Ghardaia, LACoSERE Laboratory, University Laghouat, Algeria
3 School of Science and Engineering, Al Akhawayn University in Ifrane, Morocco
* Corresponding Author: Maawiya Ould Sidi. Email:
Computers, Materials & Continua 2023, 74(1), 1855-1870. https://doi.org/10.32604/cmc.2023.030032
Received 17 March 2022; Accepted 26 April 2022; Issue published 22 September 2022
 View Full Text
 Download PDF
Abstract
This paper presents a new optimization study of the placement and size of a photovoltaic source (PVS) in a distribution grid, based on annual records of meteorological parameters (irradiance, temperature). Based on the recorded data, the production output as well as the daily average power (24-h vector) of the PVS is extracted over the year. When a power vector is available, it can be used as an input when searching for the optimal size of the PVS. This allows to take into account the constraint of the variation of the power generated by this source considering the variation of the power consumed by the electrical loads during the whole day. A multi-objective fitness function has been considered. The latter minimizes the active losses and maximizes the voltage stability index during the day, while considering the constraints of the system, that is, the security, technical, geographical, and meteorological constraints. This problem was solved using the Non-dominated Sorting Genetic Algorithm NSGA-II optimization technique under MATLAB 2021. It was applied to the distribution network of Ghardaïa of 59 nodes.Keywords
The supply of electrical energy is carried out in different phases, that is, production, transport, distribution, and consumption. The phase of distribution is considered the most important, researchers have studied the development of distribution networks of electrical energy, such as the integration of new technologies, among them the sources of clean energy towards the environment [1]. In this context, the depletion of fossil sources on the one hand, and on the other hand, the climate warming due to the use of sources that produce greenhouse gases. Renewable energies (RE) are essential sources to limit the impact on the planet. Renewable energy sources offer interesting technical advantages such as the proximity of these sources to the places of consumption, which reduces the losses due to the Joule effect caused by the transport of electrical energy [2], and the facility of implementation in a shorter time. The presence of production sources in the distribution network allows us to be independent from the transmission network. In case of a general blackout, these sources ensure the continuity of service locally. RE technology continues to develop to achieve higher efficiency and lower cost per kWh. This challenge has encouraged governments to promote the field of renewable energy.
On the other side, the potential of renewable energy in the world depends on the geo-climatic specificities of each country. Indeed, Algeria is located in a region highly exposed to the sun and naturally has a very large solar potential, which has enabled its government to implement programs to integrate renewable sources into the electric network [3]. According to the Solar Atlas of Algeria, the duration of insolation on almost the entire national territory exceeds 5 kWh/m2/day, which represents a solar potential of 169.44 TWh/year, which is the largest potential in the Mediterranean basin, [4]. The annual sunshine duration is more than 2000 h, which can reach 3900 h in the highlands and Sahara, depending on the region and time of year. The exploitation of solar energy through photovoltaics is an important opportunity for Algeria. Currently, Algeria’s energy needs are met almost exclusively by hydrocarbons, especially natural gas, the most available energy. Other forms of energy are only used when gas cannot be used. In the long term, the continuation of the current national energy consumption model may make the supply-demand balance for this energy source problematic. A forecast study shows that the level of natural gas needs of the national market would be around 55 billion m3 in 2030. In this context, the Algerian government has set a provisional program of integration of photovoltaic sources by 2030, with a total power of 10.575 GW [5].
During the optimal integration of renewable sources, the different parameters of the grid are positively influenced, such as, the active losses are reduced, the voltage is improved in all nodes of the network, and the power factor is better. However, during the nonoptimal integration of these sources, negative impacts can be caused [6]. For this reason, it is essential to provide an optimal integration of these sources. In the literature, a lot of research has been presented discussing the optimization of the placement problem and the optimal size of renewable sources (photovoltaic or wind) [7]. However, the majority of these researches have considered these renewable sources (intermittent sources) with fixed power, while they are variable during the day, as they vary according to the meteorological conditions.
A very few publications consider intermittent sources with variable power, among these publications as an example, the study in [8] presents a tailored model of photovoltaic production and a procedure to estimate the optimal placement of SPVs in the distribution network, with the objective of minimizing losses, using Monte Carlo method. In reference [9], a hybrid optimization method has been proposed for the optimal placement of wind turbines that combines a multiobjective genetic algorithm and the market-based optimal power flow to minimize the total energy losses and maximize the net present value associated with the investment of wind turbines. The method is designed for distribution system operators owning distributed generators to find the optimal number and size of wind turbines among different potential combinations. The NSGA-II method is used to select the optimal sites and sizes of wind turbines from all candidate buses. In [10], a methodology based on weighting factors is proposed to minimize the annual energy losses by determining the optimal wind turbine size, using the genetic algorithm. In [11], a methodology has been presented to optimally provide different types of decentralized generation based on renewable energy in the distribution network, to minimize the annual energy losses. The latter is based on the generation of a probabilistic generation/load model that combines all possible operating conditions of the renewable sources with their probabilities. The planning problem is formulated as a nonlinear mixed integer programming. They developed a mathematical multistage distribution planning model to optimally integrate and supply large-scale hybrid renewable sources consisting of photovoltaic, biomass, wind, and capacitor banks into the distribution network. Probabilistic scenario-based methods, namely, beta and Weibull distributions, were applied to model the random behavior of solar irradiation and wind speed. Biomass was considered as a controllable source. The proposed planning model determines the optimal timing, number, size, and placement of the hybrid renewable sources in the distribution network considering reactive compensators, having the objective to maximize the power of these hybrid sources generated and absorbed in the distribution network. This optimization problem is formulated as a stochastic linear mixed integer program [12]. The research [13] presents the problem of determining the optimal placements and size of renewable energy-based distribution generation with gravity energy storage in the distribution network, using the Constriction Coefficient Particle Swarm Optimization (CPSO) technique to reduce total energy losses. The stochastic nature of solar, wind, load and storage unit sources has been addressed using the probabilistic technique. Others have proposed a probabilistic method to discretize the continuous joint power distribution of wind sources. They combined the probabilistic approach with the Multiobjective Particle Swarm Optimization MOPSO and NSGAII method, to determine the size and placement of distributed generation, considering the uncertainties and correlations between wind sources [14]. In [15], the authors presented a methodology for the integration of renewable distributed generation to minimize annual energy losses. Analytical expressions are first proposed to identify the optimal size and power factor of renewable distributed generation for each placement to minimize annual energy losses, while considering the time-varying characteristics of demand and generation. The deterministic and probabilistic optimal placement and size of wind turbines in distribution power systems were studied having the objectives of minimizing active losses, improving the voltage profile, and maximizing the voltage stability index, using a method called spotted β-chaotic sequence hyena optimizer. The wind generation and power demand are determined by the Monte Carlo method [16]. A method named Hybrid Multi-Objective Optimizer based on teach-learn-Grey Wolf, has been applied to identify the optimal placements and sizes of photovoltaic and wind sources in the distribution system, while reducing losses and unsupplied energy [17]. A method has been proposed in [18] based on data clustering to determine the best placement and optimal size of wind turbines in distribution systems considering wind uncertainty and wake effect. The intermittency of wind turbine production makes the optimization problem more difficult. The use of probabilistic methods for such analyses proves effective in giving more reliable results. Monte Carlo simulation based on data clustering is used to group the wind farm output power into clusters. The targeted objective function is the minimization of the loss and maximization of the voltage profile. In the paper [19], a research work has been approached from two points of view, such as the simultaneous minimization of total energy losses of a distribution network and the improvement of the profit for the owner of decentralized sources based on renewable energy. The stochastic nature of these sources such as wind and photovoltaics is taken into account with appropriate probabilistic models. To solve this problem, a hybrid metaheuristic algorithm is proposed, which combines the phaseurs particle swarm optimization and the gravitational search algorithm. A study in [20] has been reported to determine the placement and size of distributed generation to improve voltage stability. The probabilistic nature of the load and generation of the renewable source is considered in this work. The proposed method proceeds with the selection of candidate nodes in which to install the sources on the system, favoring voltage profile sensitive buses and thus improving the voltage stability margin. The placement and sizing of the sources are formulated using mixed integer nonlinear programming with an objective function of improving voltage stability; the constraints are the system voltage limits, feeder capacity, and source penetration level.
The contribution of this work is based on considering the PVS as a variable production during the day. Therefore, the load profiles and the photovoltaic generation profiles are considered as variable data (based on the weather conditions of the region where the PVS is located). Then, the metaheuristic optimization technique based on NSGA-II is used to obtain the optimal placement and size of the PV source to be integrated into the GHARDAIA electric distribution network. The objective function considered in this study is the minimization of the active losses and the maximization of the voltage stability index while taking into account the constraints of the system (security, technical, geographical, and meteorological constraints). Meteorological constraints are based on the production history of the Oued Nechou photovoltaic source. The proposed study has been applied to a real distribution network, namely, the Algerian distribution network (59 nodes), under the MATLAB 2021 tool.
For this objective, this paper has been structured as follows: the first part deals with the modeling of the Optimization Problem of the Size and Placement of the Photovoltaic source (OPSPV) in the distribution network. The second part presents the mathematical tools (soft and hard) used for the optimization of the studied problem. The third part presents the application of the NSGA-II method to the OPSPV problem. The fourth part presents the definition of the simulated network and exposes the results and their interpretations. Finally, a conclusion will close this work.
To determine the optimal size and placement of the photovoltaic source, a mathematical model is chosen containing the constraint equalities, constraint inequalities and the objective function.
The objective function (or cost function) represents the criterion used for the optimization of a given system by minimizing a fitness function under various constraints. In this study, we will minimize the active power losses and maximize the voltage stability index, detailed below:
- First function is the minimization of active losses: Losses in a distribution network are one of the important parameters that determine the costs of electricity supply and the technical problems of the network. The distributed generation connected to the network should be able to minimize the active losses without creating a problem, so the first objective function to minimize is:
where
- Second function is to improve voltage stability: voltage instability can cause network collapse (blackout) [21]. To avoid this problem, it must be ensured that the network operating point is far from the voltage bifurcation point. Therefore, the second objective function is to improve the voltage stability of the network by maximizing the Voltage Stability Index (
From Eqs. (2), (3), it can be deduced that:
The roots of Eq. (4) are real if :
The voltage stability index
For stable operation, the
Where
To simplify the mathematical manipulation, the second objective function associated with
where
These constraints represent the balance of active and reactive power (in the presence of photovoltaic sources) that must be maintained at each time
The active and reactive powers generated by the reference generator (conventional production) are represented by (
These constraints represent the physical limits of the electrical equipment (generators, lines and PV sources) as well as the voltage safety limits at the distribution network nodes. These constraints are detailed in the following paragraphs.
To maintain the safety of the generators, they must operate within acceptable limits. These limits are given by the following relationships:
The power passed through the distribution lines must be within the acceptable operating limits which is given by the following equation:
where
To ensure the security of the electrical equipment, it must be operated between the maximum and minimum values of the admissible voltages, which translates into the following equation:
During the integration of intermittent sources in the electrical distribution network, perhaps have an imbalance in power, for this it is essential to limit the penetration rate (
2.4 Connection Constraints for Cecentralized Generation
Concerning the connection of a decentralized generation (DG) in the Algerian electrical network, a ministerial decree was published defining the technical conditions of connection as follows [24]: the DG of power lower than 120 kW, will be connected in the low voltage network. For the source with a power lower than 10000 kW, their connection is done on the network 10 and 30 kV. For the source with a power between 10000 and 40000 kW the connection is made on the 60 kV network. For the powers higher than 40000 kW, the connection is made on the 220 kV network.
To achieve the objectives related to the selection of sites for solar stations, a careful examination of the technical, environmental, and economic criteria used in the world must be carried out. This led to the identification of relevant criteria, adapted to the physical and socio-economic specificities of our geographical area. The choice of sites for the implementation of renewable energy production is based on the following criteria [3]:
– The proximity of the decentralized generation site to the source station.
– Accessibility (proximity of a road for transport possibility), road axis to the next port city.
– Water availability (in the case of a solar thermal plant).
– The availability of surface area.
– Available land space and its topography.
– Meteorological conditions.
2.6 Adjustment of the Constraints
In the process of optimizing the problem under study, one can probably come across infeasible solutions, this is due to the random search aspect of the technique used. Penalization methods allow to take into consideration violations of constraints on continuous variables [25]. One way often used in such cases is to penalize the objective functions (which measure the quality of a solution). To handle the inequality constraints on the state variables, including the voltage of the load nodes and the power transiting to the power line, the augmented objective function is computed as follows:
where the penalty factors of the load node voltage and apparent power, transmitted in the distribution lines are represented by
NSGA-II is a stochastic metaheuristic optimization method that was proposed by Deb et al. [26], as an improvement of NSGA. The NSGA-II algorithm has been shown to be one of the most efficient and well-known algorithms for multi-objective optimization [27]. The NSGA-II algorithm based on a multi-level classification of individuals. The latter uses a sorting procedure based on non-dominance or Pareto optimal, an elitist approach that preserves the diversity of the populations by saving the best solutions found in previous generations on the one hand, and on the other hand a comparison operator based on a crowding distance calculation. NSGA-II is among the most widely used methods in the literature, due to its efficiency and robustness [27]. Fig. 1 shows the optimization strategy using the NSGA-II method.
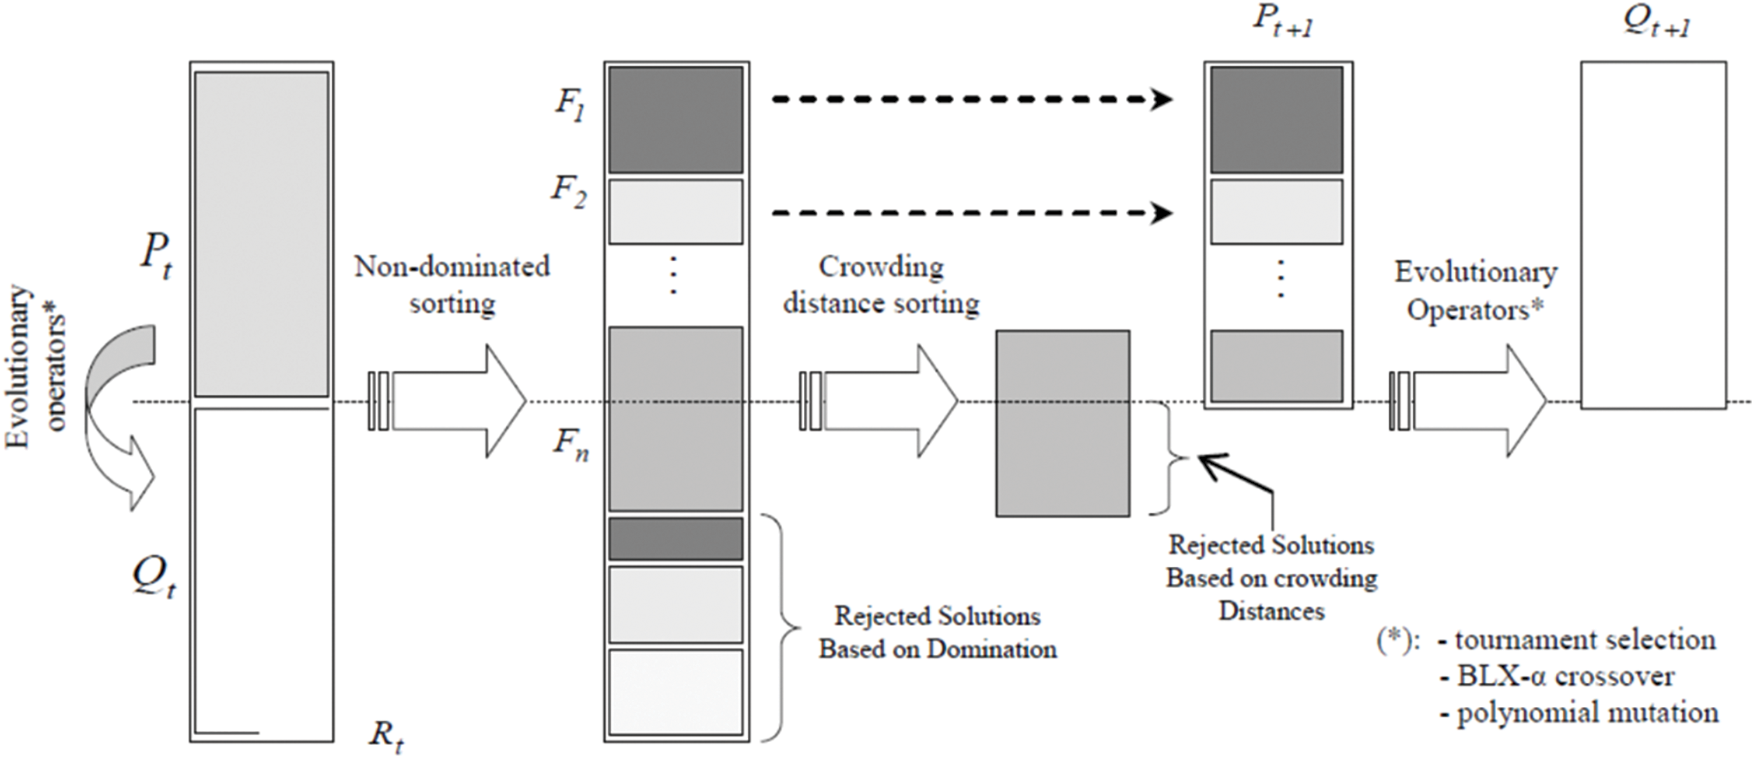
Figure 1: NSGA-II strategy
It is important to note that the NSGA-II algorithm finds a multitude of Pareto optimal solutions. Among these solutions, the best compromise (unique solution) is chosen using the fuzzy logic method; this is done by modeling each solution according to each objective by a membership function µi, which is defined as follows [26]:
For each non-dominated solution, we normalize the associated membership function by the following expression:
where
3.1 Application of the NSGA-II Technique
In this section, the NSGA-II technique is applied to the OPSPV taking into account the minimization of the joule losses and maximization of the voltage stability index, for different combinations of placement and size of the PVs. Fig. 2 represents the flowchart of the NSGA-II method and its steps:
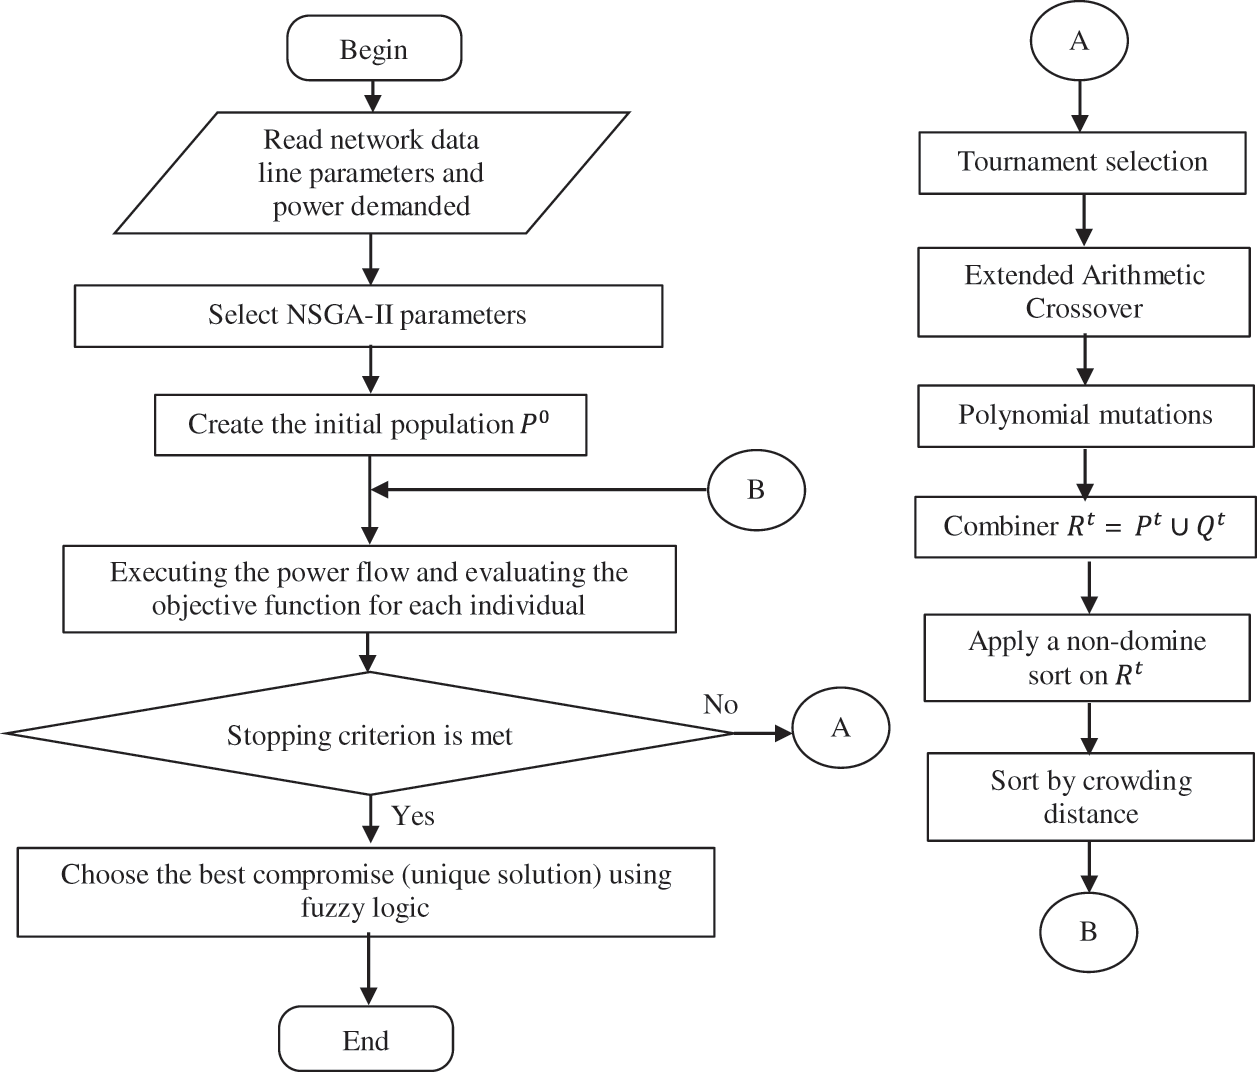
Figure 2: Flow chart of the NSGA-II method
Step 1: Insert network data (line parameters, loads, PV generator) and NSGA-II method parameters, namely, population size
Step 2: Randomly generate an initial population
where round (.) determines the value of a number rounded to the nearest integer, and rand gives a uniformly distributed random number that belongs to the interval [0,1].
Step 3: Calculate the power flow for each individual and evaluate the objective functions (
Step 4: After performing power flow, check the limits of the voltage and apparent powers using Eqs. (13) and (14). If these limits are satisfied, go to the next step, if not satisfied, penalize the objective function using formulas (16)–(18).
Step 5: Create a new population
Step 6: Combine the parent and child populations then create
Step 7: Perform a nondominant sort on
Step 8: Generate a new population
Step 9: When all solutions of
Step 10: Create the population of offspring
Step 11: Deduce the Pareto frontier and choose the best compromise.
Step 12: Display the results.
3.2 Dependent and Independent Variables
The OPSPV problem has already been posed by the formulas above, but it is important to define the dependent (state) and independent (control) variables involved. The vector
The vector
In order to solve the OPSPV problem using NSGA-II, the chromosome structure must be defined beforehand, which is shown in Fig. 3.
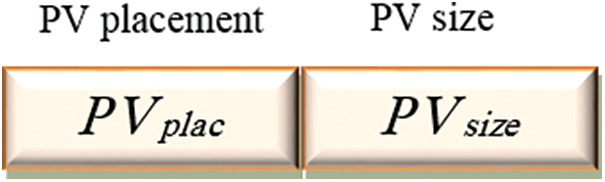
Figure 3: Structure of the OPSPV independent variables
4 Variation of PV Production and Consumption
In this study, we are interested in decentralized production based on renewable energy such as the photovoltaic source. Contrary to conventional generation, PVS is modeled as a variable source (intermittent source), this comes back to the character of the primary source (irradiation and temperature variations). Due to the intermittent character and the level of power injected, PVS connected to the distribution network, can cause changes in the transit currents and thus changes in the Joule effect losses (losses are proportional to the square of the current). For this reason, it is more real to take into account the variation of the PV production in the procedure of optimization of the placement and size of the PVS in a distribution network. To simulate the variation of the PV production, it is necessary to have historical data of the daily production depending on the meteorological parameters (PV production profile) and thus to have historical data of the daily consumption (load profile). These data are taken into account in the power flow calculation. The study proposed in this paper has been applied to a real distribution network, namely, the Ghardaïa network, which is located in the south of Algeria. For this purpose, meteorological data (irradiation, temperature, time, and date) have been recorded during the whole year 2020 in the Ghardaïa region. Using daily profiles of meteorological data of one year, one can easily determine the variation of the average power (daily profile) produced by a photovoltaic source located in the region of Ghardaïa.
4.1 Description of the Studied Network
The distribution network studied is of aerial type, supplied by a 220/60 kV source station, connected to the national network through two 2*120 MVA power transformers. This network contains practically 05 source stations 60/30 kV supplying the various localities of the Wilaya of Ghardaia, which is located at a distance of 600 km south of Algeria. The network in question actually contains 1950 nodes (1950 medium voltage/low voltage distribution stations) with a total power demand in summer of 144.87 MW and 70.9 MVAr (this demand is constituted by three types of consumers such as, industrial, residential and commercial) with 23254 low voltage customers. Due to the large size of this network, and to avoid a considerable simulation time, it is considered only the 60 kV distribution network while the 30 and 10 kV parts have been represented by equivalent networks (see Fig. 4). The reason for this consideration is that most of the 30 and 10 kV network parts are located in urban areas. After the simplification, the equivalent network contains 59 nodes (including 58 load nodes and 01 reference node), 12 lines the 60 kV, 43 lines the 30 kV and 04 lines the 10 kV.
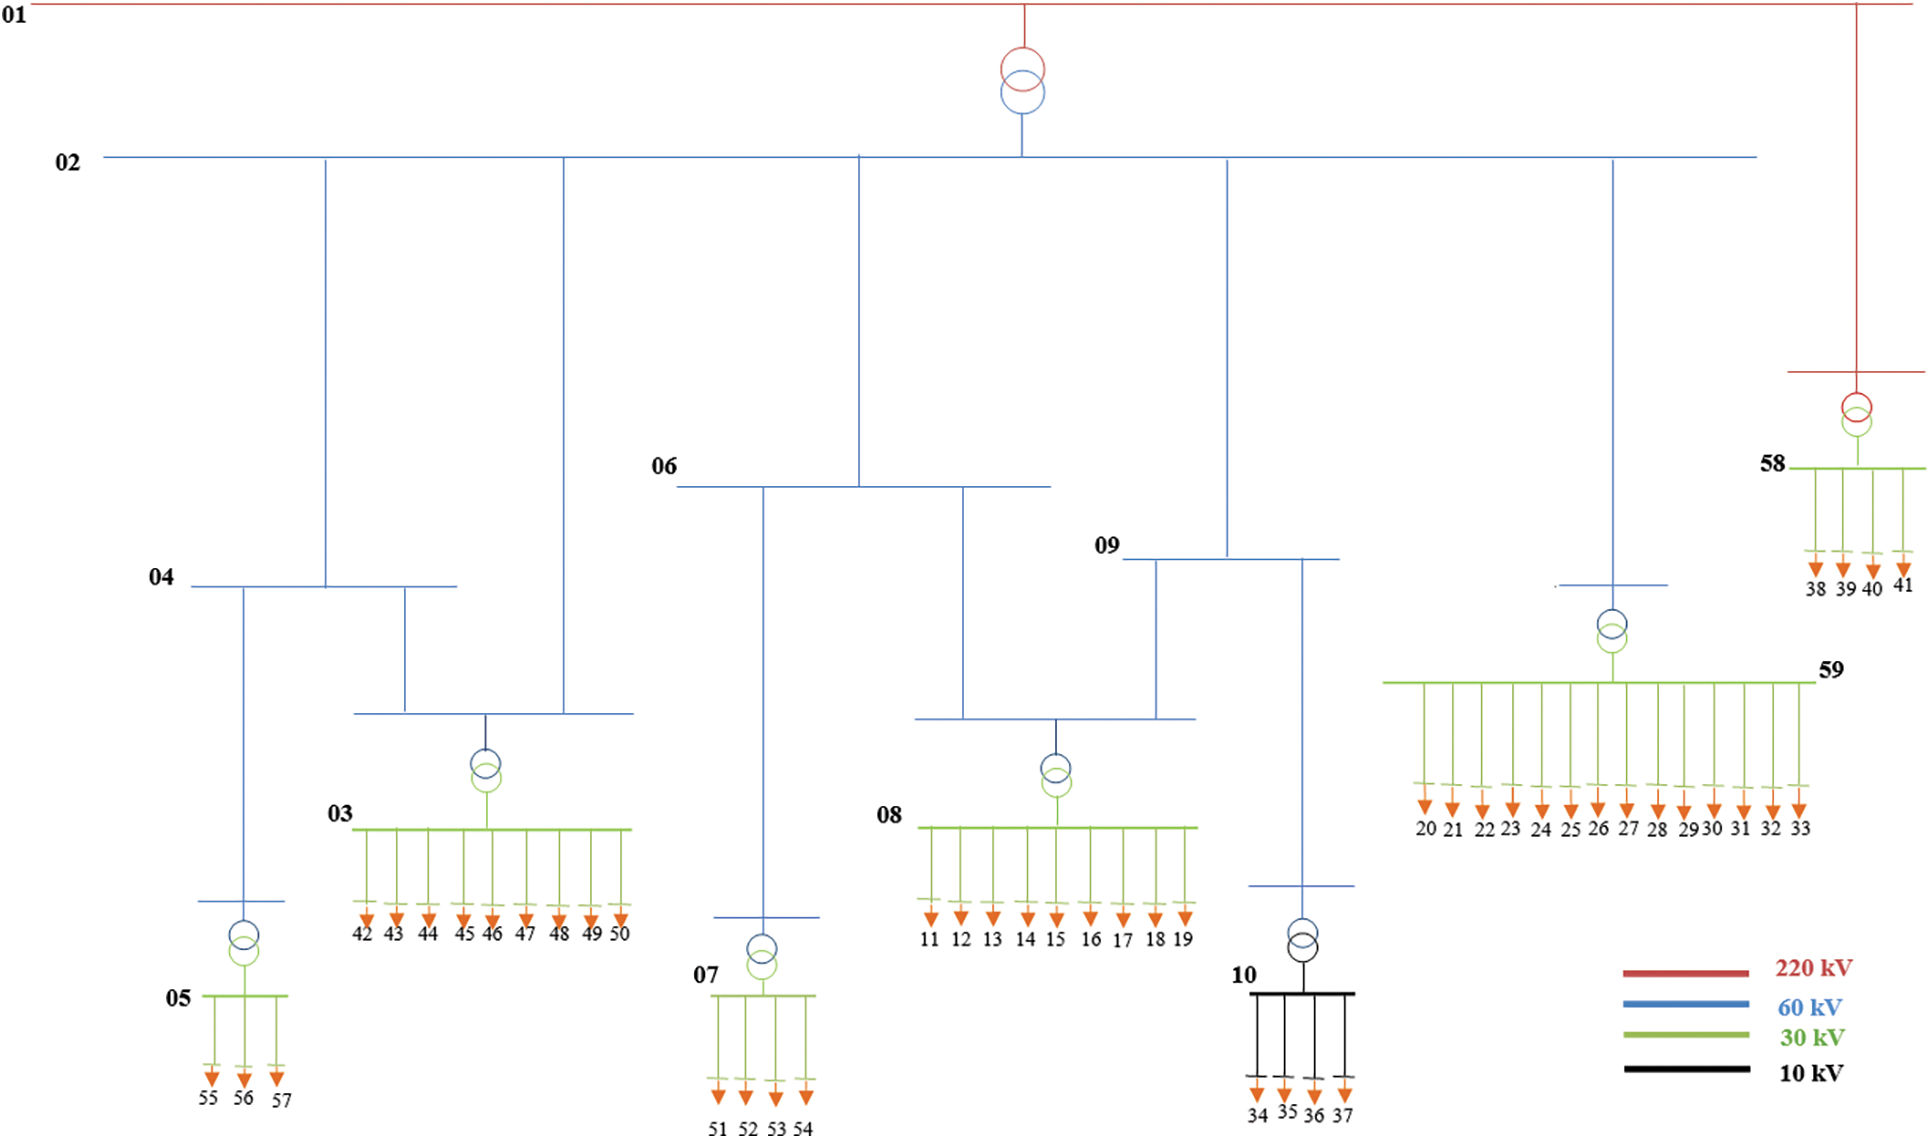
Figure 4: Topology of the overhead network with different voltage levels
It is important to note that the Oued Nechou PV plant is located in the same area of the studied network (Ghardaia distribution network). This study is based on the records of the power produced from this PV plant. The annual record in each 30 min (10614 records during the year 2020) is given by Fig. 5.
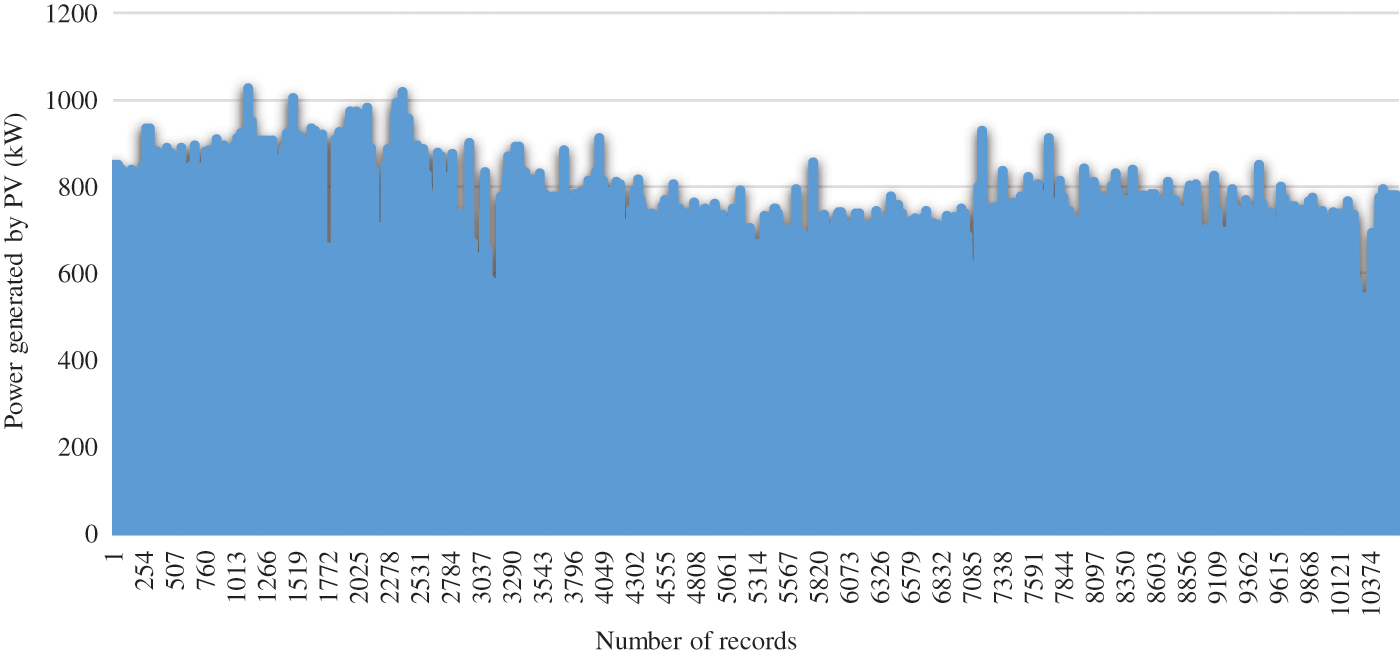
Figure 5: Annual recording of the power generated by the Oued Nechou PV source
Based on Fig. 5, the average annual power generated by the Oued Nechou photovoltaic source of an average year is shown in Fig. 6. The total average annual power of the overhead distribution network of 60, 30 and 10 kV of a same year is illustrated by Fig. 7.
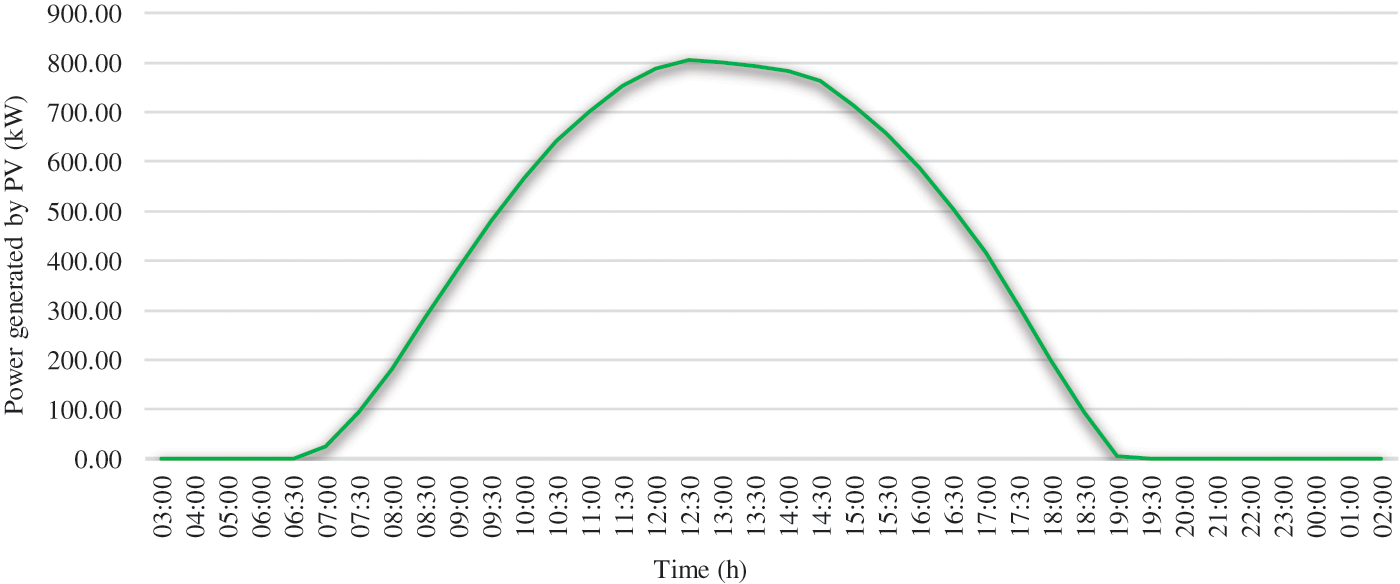
Figure 6: Hourly profile of the photovoltaic production of Oued nechou
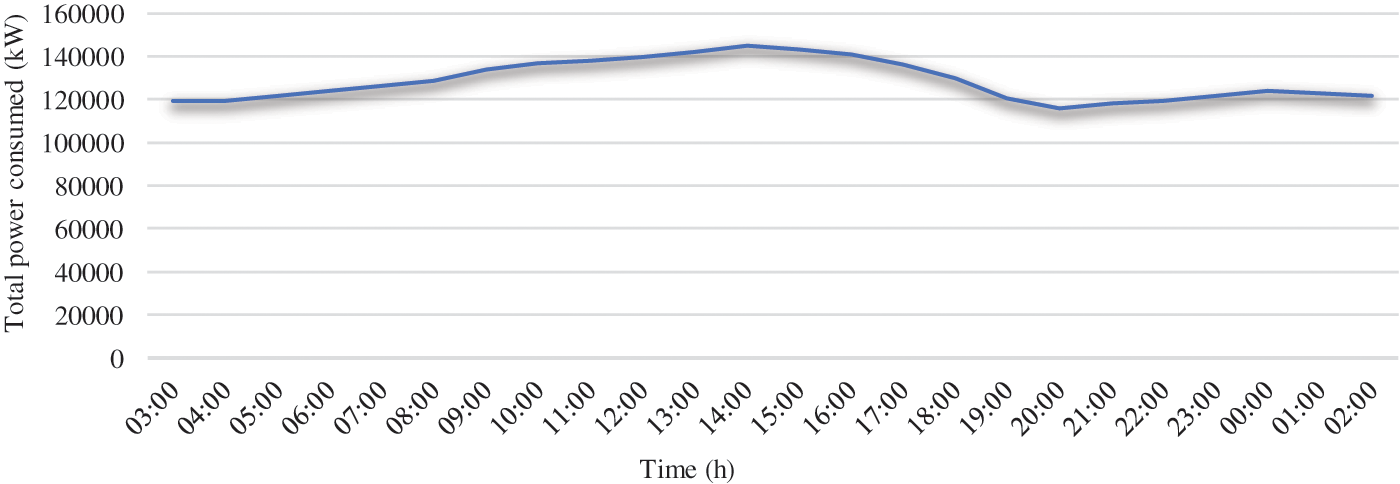
Figure 7: Hourly profile of the total consumption of the Ghardaïa network
5 Simulation Results of the OPSPV Problem
To determine the optimal placement and size of the PV source on the Ghardaïa network, it is duly necessary to consider all security, technical, geographical (large areas) and meteorological (large solar array) constraints. For these reasons, many nodes are excluded from the candidate list. The set of candidate nodes is therefore relatively small compared to the total number of nodes. Initially, the optimization process, using NSGA-II adopted in this simulation, sets a location among the candidate nodes and chooses a PV size randomly (within the permissible limits). Then and since the PV output varies during the day, the power flow is executed for each hour during the 24 h. Because of the variation in the power injected by the PV source and the power absorbed by the load, the developed program then minimizes the sum of all hourly active losses and maximizes the stability index throughout the day. The NSGA-II method scans the entire search space and finds the appropriate size and the optimal placement (among the candidate nodes for the PV placement) having the minimum of the sum of all hourly active losses and the maximum VSI during that same day.
It is important to note that, the size of the PV source, randomly chosen by the NSGA-II method, is rounded to multiples of a predefined power vector (representing the daily productions of the PV source according to the meteorological parameters of the Ghardaïa region).
It is worth mentioning that in addition to the constraints stated in § II.3, other constraints have been considered in this practical study. The first constraint is due to the technical conditions required for the connection of decentralized productions to the Algerian distribution network (see § II.4). In which, it is required that the size of the PV to be installed depends on the voltage level of the node (220, 60 or 30 kV) where the source should be connected. This constraint is taken care of in the optimization process by making the selection of candidate nodes based on the voltage levels.
The second constraint concerns the geographical placement (the site must meet the criteria mentioned by § II.6). This constraint is met by selecting only those nodes located in large areas, to allow the implementation of the PV source. In this study, it is important to point out that the meteorological conditions (irradiation, temperature, humidity, etc.), are assumed to be uniform for the whole region of Ghardaïa.
After optimization, the optimal placement found is node 46 (situated at the locality of Zelfana which is attached to the departure El-Hassay 30 kV from the source substation 60/30 kV of Guerrara) with an optimal size to be installed of 5760 kWp as peak power (this power which is less than 10000 kW, therefore verifies well the constraint of the voltage level).
The sum of the total active losses of the distribution network 59 nodes with and without the PV source installed during the day are respectively, 172.79 and 179.61 MW. Fig. 8 shows the hourly power injected by the optimal PV source obtained by the optimization method used. From Fig. 8, it can be noticed that the PV source operates from 06:00 in the morning until 20:00 in the evening, this is explicated by the presence of irradiation in the region of Ghardaïa during the day of 16/07/2017 chosen in this study.
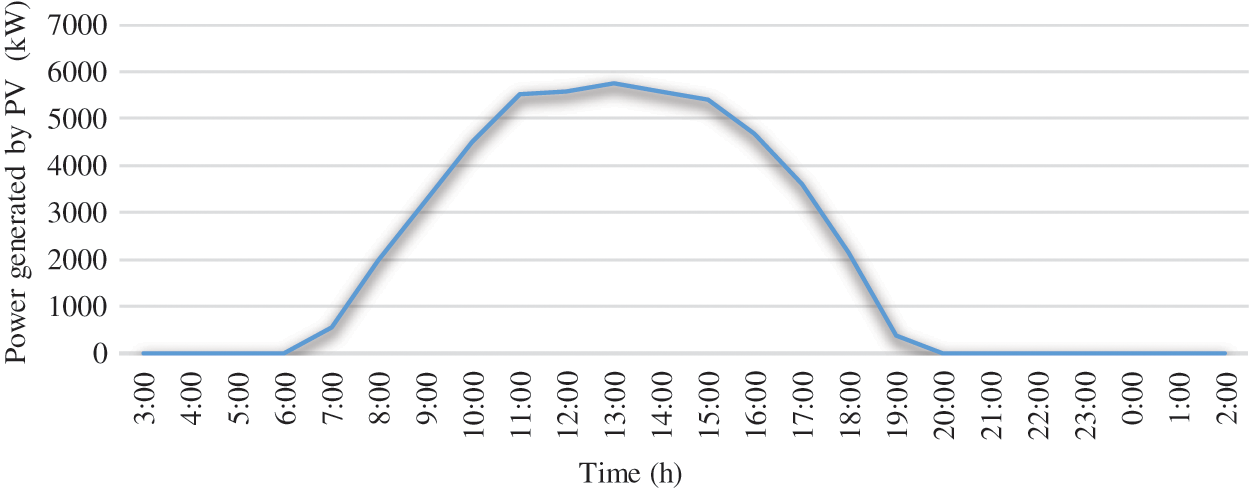
Figure 8: Hourly power generated by the PV obtained by the NSGA-II method
Figs. 9 and 10 illustrate respectively the hourly minimum values of the VSI and the hourly minimum voltages in the absence and presence of the optimal PV source found. From these, it can be clearly seen that the VSI and the minimum voltage improve in the same way and this depends on the power injected by the PV.
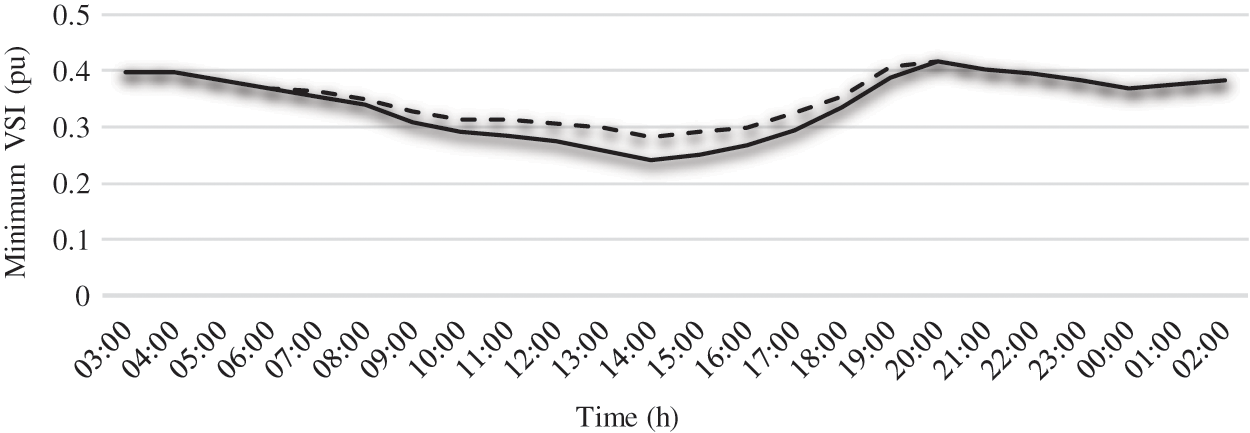
Figure 9: Minimum VSI with and without PV source for each hour
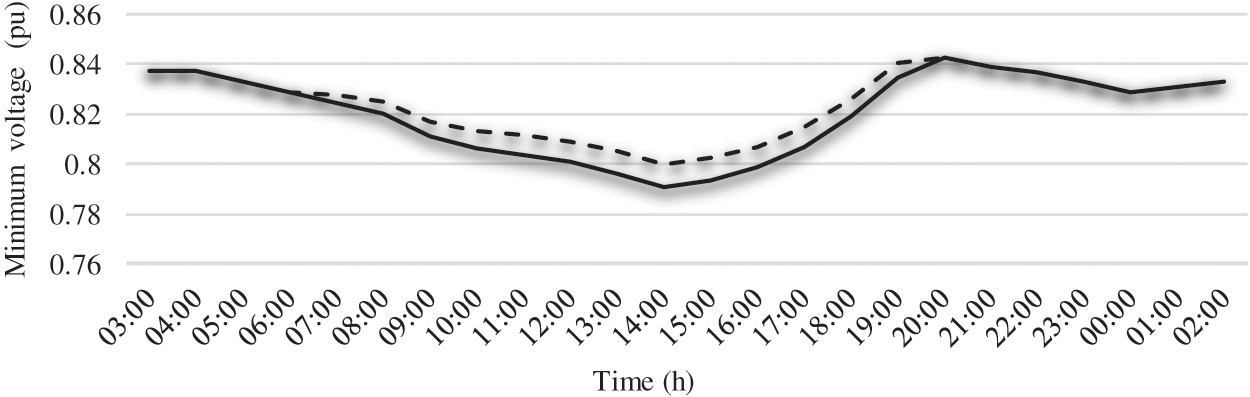
Figure 10: Minimum voltages with and without PV source for each hour
The total hourly active losses of the 59-node distribution network, with and without PV determined by NSGA-II, are shown in Fig. 11. It is found that the difference (between the case of absence and presence of PV) of the active losses increases when the photovoltaic source is operating. That is, the more the power injected by PV increases, the more the losses decrease. This confirms the curve form of the power produced by a photovoltaic source. After determining the best placement for the photovoltaic source.
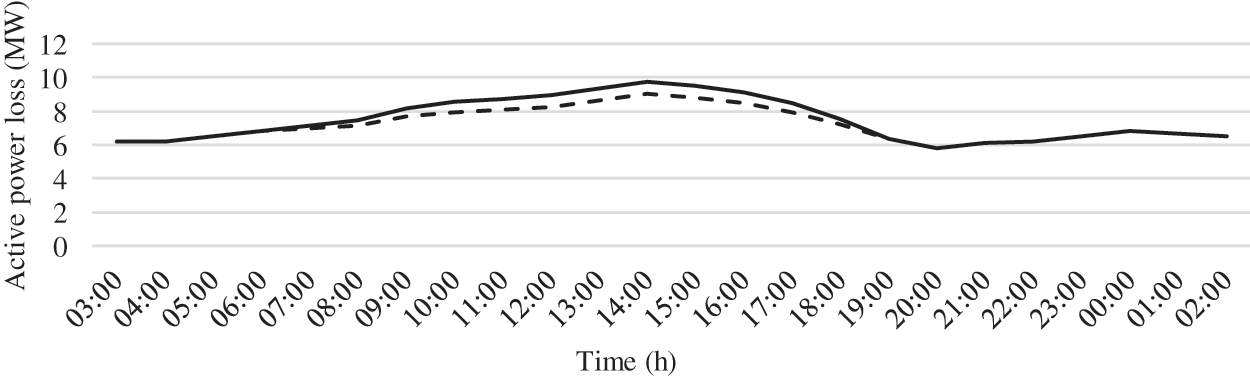
Figure 11: Active power loss with and without PV source for each hour
In this work, a new study was presented to determine the optimal placement and size of a photovoltaic source in a real distribution network (Ghardaïa network) considering the variation of PV consumption and production during the day and based on the meteorological conditions of this region. A multi-objective function was used considering simultaneously the minimization of the daily active losses and the maximization of the voltage stability index, using NSGA-II method. This function is subject to technical, security, geographical and meteorological constraints. This work has shown that for a better operation of this network, it is required to install a photovoltaic source of optimal size 5760 kW with a suitable placement in the region of Zelfana which is 60 km away from the place of Wilaya of Ghardaïa. As a future work, it is proposed to insert hybrid sources such as photovoltaic-capacitor bank, to improve the VSI, the voltage profile, and losses.
Funding Statement: The authors extend their appreciation to the deanship of Scientific Research at Jouf University for founding this work through research grant no (DSR2020-02-387). https://www.ju.edu.sa/.
Conflicts of Interest: The authors declare that they have no conflicts of interest to report regarding the present study.
References
1. N. Hadjsaid, J. F. Canard and F. Dumas, “Dispersed generator generation impact on distribution networks,” IEEE Computer Applications in Power, vol. 12, no. 2, pp. 22–28, 1999. [Google Scholar]
2. T. Adefarati and R. C. Bansal, “Integration of renewable distributed generators into the distribution system: A review,” IET Renewable Power Generation, vol. 10, no. 7, pp. 873–884, 2016. [Google Scholar]
3. M. Mosbah and M. Kobbi, “L’impact des ENR sur l’exploitation des réseaux électriques,” in 1er Conférence sur les Métiers de la Distribution, Centre de Recherche de Développement Electricité et du Gaz, Ecole Ben Aknoun, Alger 15-16 Février 2017, 2017. [Google Scholar]
4. C. Chitour, “Les énergies renouvelables et la maitrise de l’énergie en Algérie,” in Post-graduation spécialisée: Economie de l’Energie, Ecole Nationale Polytechnique El Harrache, Alger, Algérie, Acte du séminaire du 25 Juin, 2008. [Google Scholar]
5. A. Khattara, M. Mosbah, R. Zine, M. Ould-Sidi, S. Hamid-Oudjana et al., “Optimal wind turbine site for voltage stability improvement using genetic algorithm technique,” Lecture Notes in Networks and Systems, vol. 361, pp. 175–182, 2022. [Google Scholar]
6. W. El Khattam and M. M. A. Salama, “Distributed generation technologies, definitions and benefits,” Electric Power Systems Research, vol. 71, no. 2, pp. 119–128, 2004. [Google Scholar]
7. U. Sultana, A. B. Khairuddin, M. M. Aman, A. S. Mokhtar and N. Zareen, “A review of optimum DG placement based on minimization of power losses and voltage stability enhancement of distribution system,” Renewable and Sustainable Energy Reviews, vol. 63, no. 2, pp. 363–378, 2016. [Google Scholar]
8. G. Guerra and J. A. Martinez, “A Monte Carlo method for optimum placement of photovoltaic generation using a multicore computing environment,” in IEEE PES General Meeting Conf. & Exposition, National Harbor, MD, USA, pp. 1–5, 2014. [Google Scholar]
9. P. Siano and G. Mokryani, “Evaluating the benefits of optimal allocation of wind turbines for distribution network operators,” IEEE Systems Journal, vol. 9, no. 2, pp. 629–638, 2015. [Google Scholar]
10. F. Ugranli and E. Karatepe, “Optimal wind turbine sizing to minimize energy loss,” International Journal of Electrical Power & Energy Systems, vol. 53, no. 4, pp. 656–663, 2013. [Google Scholar]
11. Y. M. Atwa, E. F. El-Saadany, M. M. Salama and R. Seethapathy, “Optimal renewable sources mix for distribution system energy loss minimization,” IEEE Transactions on Power Systems, vol. 25, no. 1, pp. 360–370, 2010. [Google Scholar]
12. A. Olusayo, J. Ajeigbe, L. Munda and Y. Hamam, “Optimal allocation of renewable energy hybrid distributed generations for small-signal stability enhancement,” Energies, vol. 24, no. 12, pp. 4777, 2019. [Google Scholar]
13. A. Rathore and N. P. Patidar, “Optimal sizing and allocation of renewable based distribution generation with gravity energy storage considering stochastic nature using particle swarm optimization in radial distribution network,” Journal of Energy Storage, vol. 35, no. 1, pp. 102282, 2021. [Google Scholar]
14. A. A. L. Ahmad, R. Sirjani and S. Daneshvar, “New hybrid probabilistic optimisation algorithm for optimal allocation of energy storage systems considering correlated wind farms,” Journal of Energy Storage, vol. 29, no. 2, pp. 1–21, 2020. [Google Scholar]
15. D. Q. Hung, N. Mithulananthan and K. Y. Lee, “Optimal placement of dispatchable and non dispatchable renewable DG units in distribution networks for minimizing energy loss,” Electrical Power and Energy Systems, vol. 55, pp. 179–186, 2014. [Google Scholar]
16. A. Naderipour, S. A. Nowdeh, P. B. Saftjani, Z. Abdul-Malek, M. W. B. Mustafa et al., “Deterministic and probabilistic multi-objective placement and sizing of wind renewable energy sources using improved spotted hyena optimizer,” Journal of Cleaner Production, vol. 286, no. 1, pp. 124941, 2021. [Google Scholar]
17. S. A. Nowdeh, I. F. Davoudkhani, M. H. Moghaddam, E. S. Najmi, A. Y. Abdelaziz et al., “Fuzzy multi-objective placement of renewable energy sources in distribution system with objective of loss reduction and reliability improvement using a novel hybrid method,” Applied Soft Computing, vol. 77, no. 3, pp. 761–779, 2019. [Google Scholar]
18. O. Sadeghian, A. Oshnoei, M. Tarafdar-Hagh and M. Kheradmandi, “A clustering-based approach for wind farm placement in radial distribution systems considering wake effect and a time-acceleration constraint,” IEEE Systems Journal, vol. 15, no. 1, pp. 985–995, 2020. [Google Scholar]
19. J. Radosavljević, N. Arsić, M. Milovanović and A. Ktena, “Optimal placement and sizing of renewable distributed generation using hybrid metaheuristic algorithm,” Journal of Modern Power Systems and Clean Energy, vol. 8, no. 3, pp. 499–510, 2020. [Google Scholar]
20. R. S. Al AbriEhab, F. El-Saadany and Y. M. Atwa, “Optimal placement and sizing method to improve the voltage stability margin in a distribution system using distributed generation,” IEEE Transactions on Power Systems, vol. 28, no. 1, pp. 326–334, 2013. [Google Scholar]
21. D. Jianfeng, Z. Shuangx and L. Zongxiang, “A new risk indices based under voltage load shedding scheme,” in Transmission and Distribution Conf. and Exhibition, Asia and Pacific, IEEE, Power Engineering Society General Meeting, pp. 1–5, 2005. [Google Scholar]
22. M. Chakravorty and D. Das, “Voltage stability analysis of radial distribution networks,” International Journal of Electrical Power & Energy Systems, vol. 23, no. 2, pp. 129–135, 2001. [Google Scholar]
23. R. Caire, T. Tran-Quoc, N. Retière, N. Hadjsaid, S. Martino et al., “Case studies on the operating ok 20 kV distribution network with large-scale low-voltage dispersed generators,” in 17th Int. Conf. on Electricity distribution CIRED 2003, Barcelona, Spain, pp. 12–15, 2003. [Google Scholar]
24. M. Mosbah, S. Arif, R. D. Mohammedi, S. Hamid Oudjana and R. Zine, “Multiobjective optimization for many wind based DG position and sizes in practical distribution network using modified differential evolution technique,” in 2018 3rd Int. Conf. on Pattern Analysis and Intelligent Systems (PAIS), Tebessa, Algeria, pp. 1–6, 2018. [Google Scholar]
25. J. A. Momoh, M. E. El-Hawary and R. Adapa, “A review of selected optimal power flow literature to 1993 part 11: Newton, Linear programming and interior point methods,” IEEE Transactions on Power Systems, vol. 14, no. 1, pp. 105–111, 1993. [Google Scholar]
26. K. Deb, A. Pratap, S. Agarwal and T. Meyarivan, “A fast and elitist multiobjective genetic algorithm: NSGA-II,” IEEE Transactions on Evolutionary Computation, vol. 6, no. 2, pp. 182–197, 2002. [Google Scholar]
27. C. Zhang and X. Ma1, “NSGA-II algorithm with a local search strategy for multiobjective optimal design of dry-type air-core reactor,” Mathematical Problems in Engineering, vol. 2015, ID 839035, pp. 1–9, 2015. [Google Scholar]
Cite This Article
 Copyright © 2023 The Author(s). Published by Tech Science Press.
This work is licensed under a Creative Commons Attribution 4.0 International License , which permits unrestricted use, distribution, and reproduction in any medium, provided the original work is properly cited.
 Downloads
 Citation Tools