
 Submit a Paper
 Propose a Special lssue
 Open Access
ARTICLE
Intelligent Machine Learning Enabled Retinal Blood Vessel Segmentation and Classification
1 Department of Computer Science, College of Computer Science and Information Technology, King Faisal University, P.O. Box 400, AlAhsa, 31982, Saudi Arabia
2 College of Computer Science and Information Systems, Najran University, Najran, 61441, Saudi Arabia
* Corresponding Author: Nora Abdullah Alkhaldi. Email:
Computers, Materials & Continua 2023, 74(1), 399-414. https://doi.org/10.32604/cmc.2023.030872
Received 04 April 2022; Accepted 06 May 2022; Issue published 22 September 2022
 View Full Text
 Download PDF
Abstract
Automated segmentation of blood vessels in retinal fundus images is essential for medical image analysis. The segmentation of retinal vessels is assumed to be essential to the progress of the decision support system for initial analysis and treatment of retinal disease. This article develops a new Grasshopper Optimization with Fuzzy Edge Detection based Retinal Blood Vessel Segmentation and Classification (GOFED-RBVSC) model. The proposed GOFED-RBVSC model initially employs contrast enhancement process. Besides, GOAFED approach is employed to detect the edges in the retinal fundus images in which the use of GOA adjusts the membership functions. The ORB (Oriented FAST and Rotated BRIEF) feature extractor is exploited to generate feature vectors. Finally, Improved Conditional Variational Auto Encoder (ICAVE) is utilized for retinal image classification, shows the novelty of the work. The performance validation of the GOFED-RBVSC model is tested using benchmark dataset, and the comparative study highlighted the betterment of the GOFED-RBVSC model over the recent approaches.Keywords
Recent advancements permit fundus images to be done by using smartphones with a traditional handheld indirect ophthalmoscopy lens. Several medical experts, namely orthoptists, ophthalmologists, and optometrists, check for conditions or healthcare problems through retinal fundus images [1]. Additionally, observing the retina change in fundus images is a means to check a person undergoing anti-malarial therapy [2,3]. Retinal vessel segmentation is an effective method to examine arteries and veins in the retinal area. Medical experts use fundus imaging to find several kinds of healthcare problems, and blood vessel segmentation is very important in the analysis method [4]. In recent times, fundus vessel segmentation method was created because of its significance. The output from a manual segmentation is the correct form of output. Manual segmentation is as easy; however, it is a dull process [5]. It may also be subject to mistakes owing to its tiredness. Moreover, there are variances among segmentation outcomes from different individuals because each person may convert the image differently. Therefore, simpler and quicker segmentation techniques must be designed [6].
The way towards sorting and positioning sharp discontinuities in an image is termed edge detection [7]. The discontinuities are immediate variations in pixel concentration that identify the blood vessels in a retinal image [8,9]. Conventional methods for edge recognition link with convolving the image by an operator, which is enhanced to be sharp to massive gradients in the image though returning value of zero in uniform zones. There is a lot of edge detecting approaches offered; every technique is planned to be perceptive to specific forms of edges [10].
Orujov et al. [11] propose a contour recognition based image processing technique based Mamdani (Type-2) fuzzy rules. The presented technique employs the green channel dataset from retinal fundus image as input, median filter for excluding background, and contrast limited adaptive histogram equalization (CLAHE) is applied for enhancing contrast. The researchers in [12] present the retinal image extraction and segmentation of blood vessels through thresholding, morphological processing, adaptive histogram equalization, and edge recognition. Roy et al. [13] designed a Clifford matched filter as a mask that operates for extracting retinal blood vessels. The edge point is denoted as a scalar unit or Grade-0 vector. Discrete edge point alongside the edge of blood vessel is the edge pixel rather than constant edge.
Ooi et al. [14] developed the operation of semi-automatic image segmentation in retinal images through a user interface based operation that enables distinct edge recognition variables on distinct regions of similar images. Tchinda et al. [15] introduces a novel methodology for segmenting blood vessels. This technique depends on traditional edge recognition filter and artificial neural network (ANN). Initially, edge detection filter is exploited for extracting the feature vector. The resultant feature is utilized for training an ANN system.
This article develops a new Grasshopper Optimization with Fuzzy Edge Detection based Retinal Blood Vessel Segmentation and Classification (GOFED-RBVSC) model. The proposed GOFED-RBVSC model initially employs contrast enhancement process. Besides, GOAFED approach is employed to detect the edges in the retinal fundus images in which the membership functions are adjusted by the use of grasshopper optimization algorithm (GOA). Followed by ORB (Oriented FAST and Rotated BRIEF) feature extractor is exploited to generate feature vectors. Finally, Improved Conditional Variational Auto Encoder (ICAVE) is utilized for retinal image classification. The performance validation of the GOFED-RBVSC model is tested using a benchmark dataset.
In this study, a new GOFED-RBVSC model has been developed for effectively detecting the blood vessels and classifying retinal fundus images. Primarily, the GOFED-RBVSC model employed contrast enhancement process. In addition, GOAFED technique is exploited to recognize the edges in the retinal fundus images in which the membership functions are adjusted by the use of GOA. Followed by, ORB feature extractor is exploited to generate feature vectors. Finally, ICAVE model can be employed to classify retinal images. Fig. 1 demonstrates the overall block diagram of GOFED-RBVSC technique.

Figure 1: Block diagram of GOFED-RBVSC technique
2.1 Edge Detection Using GOAFED Model
At the preliminary level, the images are pre-processed, and the edges are identified using the GOAFED model. Fuzzy set A denotes the set of collectively arranged pairs composed of the components
Now
Now m and
Four characteristics: Vertical Gradient
The rest of the features are configured correspondingly with two linguistic parameters. In the fuzzy scheme, the following rule has been determined when the input value from each gradient are black, as well as determine NotEdge. The primary value for the UMF and LMF functions are experimentally chosen.
Fuzzy edge detection can be implemented according to the fuzzy selection of the maximal gradient. The scheme was capable of adapting all the images through the Fuzzy Type-2 operation.
To optimally tune the MFs involved in the FED model, the GOA is utilized. A Grasshopper is an insect and separated into a bug. Generally, the plant harvest fails when it uses all the plant crops. The grasshopper swarm composed of distinctive trademark, in which the adults and swarm nymph [16] are existing. The swarming nymph has significant positioning in a larval phase. It can be expressed in the following equation.
Whereas
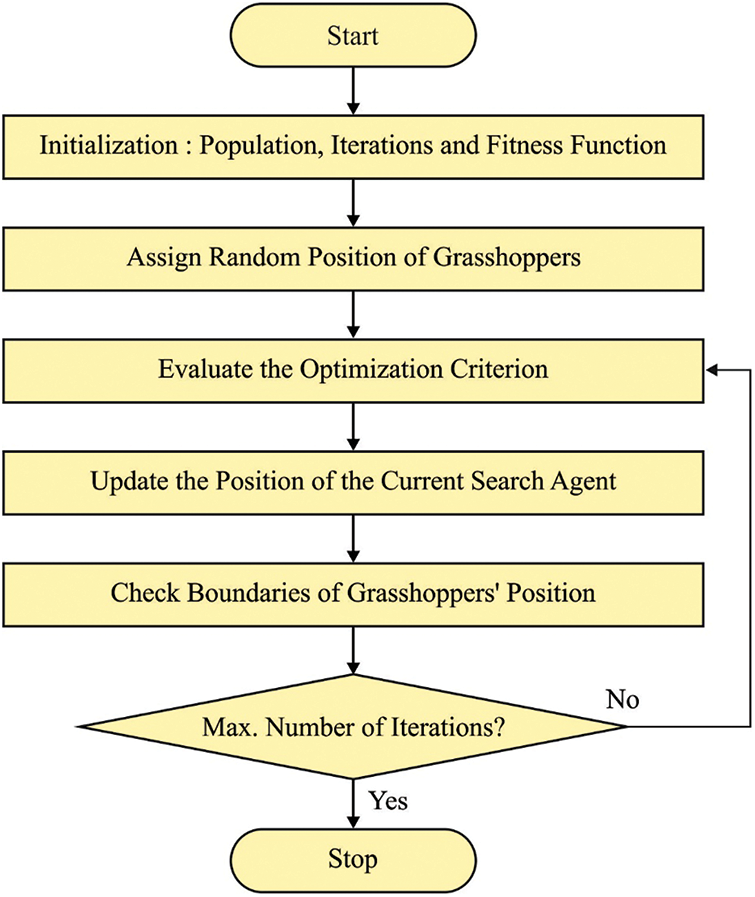
Figure 2: Flowchart of GOA
Thus,
Whereas l denotes the attractive length scale, f illustrates the intensity of attraction, and the capability can be illustrated. The gravitational force
Now, g represents the gravitational constant,
The arithmetical approach is effective by limited parameters for exploitation and exploration in optimization phases.
Next to the edge detection process, the ORB feature extractor is exploited to make feature vectors. The pre-processed image was distributed to the ORB-based feature extracted to generate a valuable group of features. Orientation elements were more in FAST, which utilizes robust measured of corner orientations [17]. The patch moment was utilized for detecting centroid as:
Whereas
Consider the moment in Eq. (4), the centroid was reached by using the following equation:
The vector was developed in the centre of centroid
Whereas atan2 implies the quadrant aware form of arctan. Let the concern of illumination parameters of corners which could not be deliberated due to the angle measured endure similar irrespective of corners. The rotational invariance was improved by promising the moment viz., estimated in terms of
In which
Accordingly, the feature is a patch function assumed as vector of n binary test was offered as:
During this case, it can be utilize Gaussian distribution nearby the centre of patches and selective vector length
Afterward, utilizing
Afterward, the BRIEF steering function was provided as:
In the final stage, the ICAVE model can be employed to classify retinal images [18]. It is modelled by conditioning the encoder and decoder to class Y. Now, the encoder
The conditional likelihood distribution of CVAE encoder and decoder is associated with class label Y. Hence, it is given in the following:
Here,
In this section, the experimental validation of the GOFED-RBVSC model is tested using the benchmark diabetic retinopathy [20] from Kaggle repository, which contains images under five distinct classes.
Fig. 3 shows the sample set of images obtained by the edge detection process. The first row indicates the input fundus images (mild), and the edge detected image is shown in second row. The next row represnets the moderate retinal fundus image, and the respective edge detected version is given in the last row.
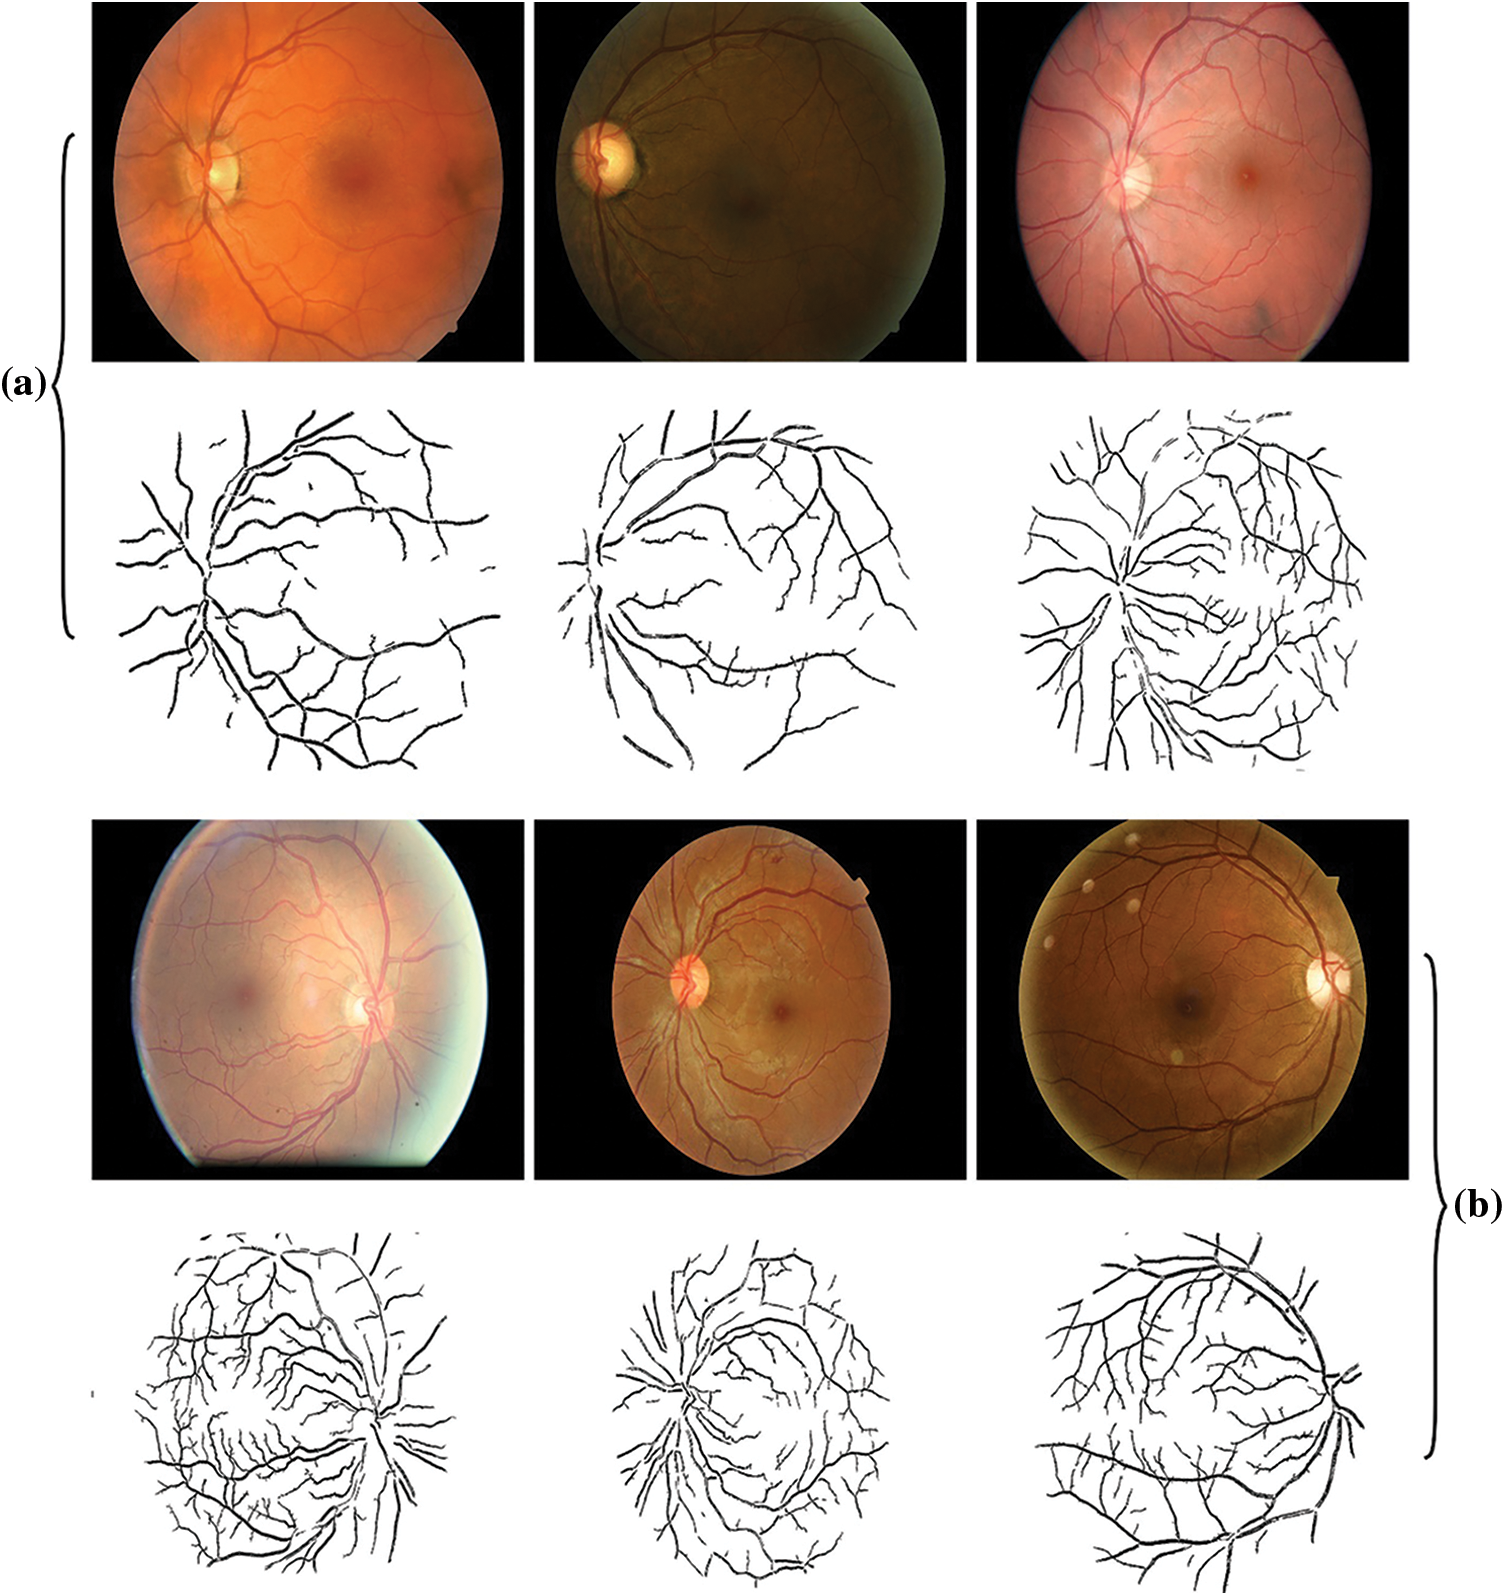
Figure 3: a (Mild) and b (Moderate)
Fig. 4 demonstrates the confusion matrices offered by the GOFED-RBVSC model. On 70% of training set (TRS), the GOFED-RBVSC model has recognized 17845 samples as normal, 1645 samples as mild, 3345 samples as moderate, 169 samples as severe, and 301 samples as proliferative. In addition, on 30% of testing set (TSS), the GOFED-RBVSC method has identified 7676 samples as normal, 661 samples as mild, 1414 samples as moderate, 97 samples as severe, and 142 samples as proliferative.
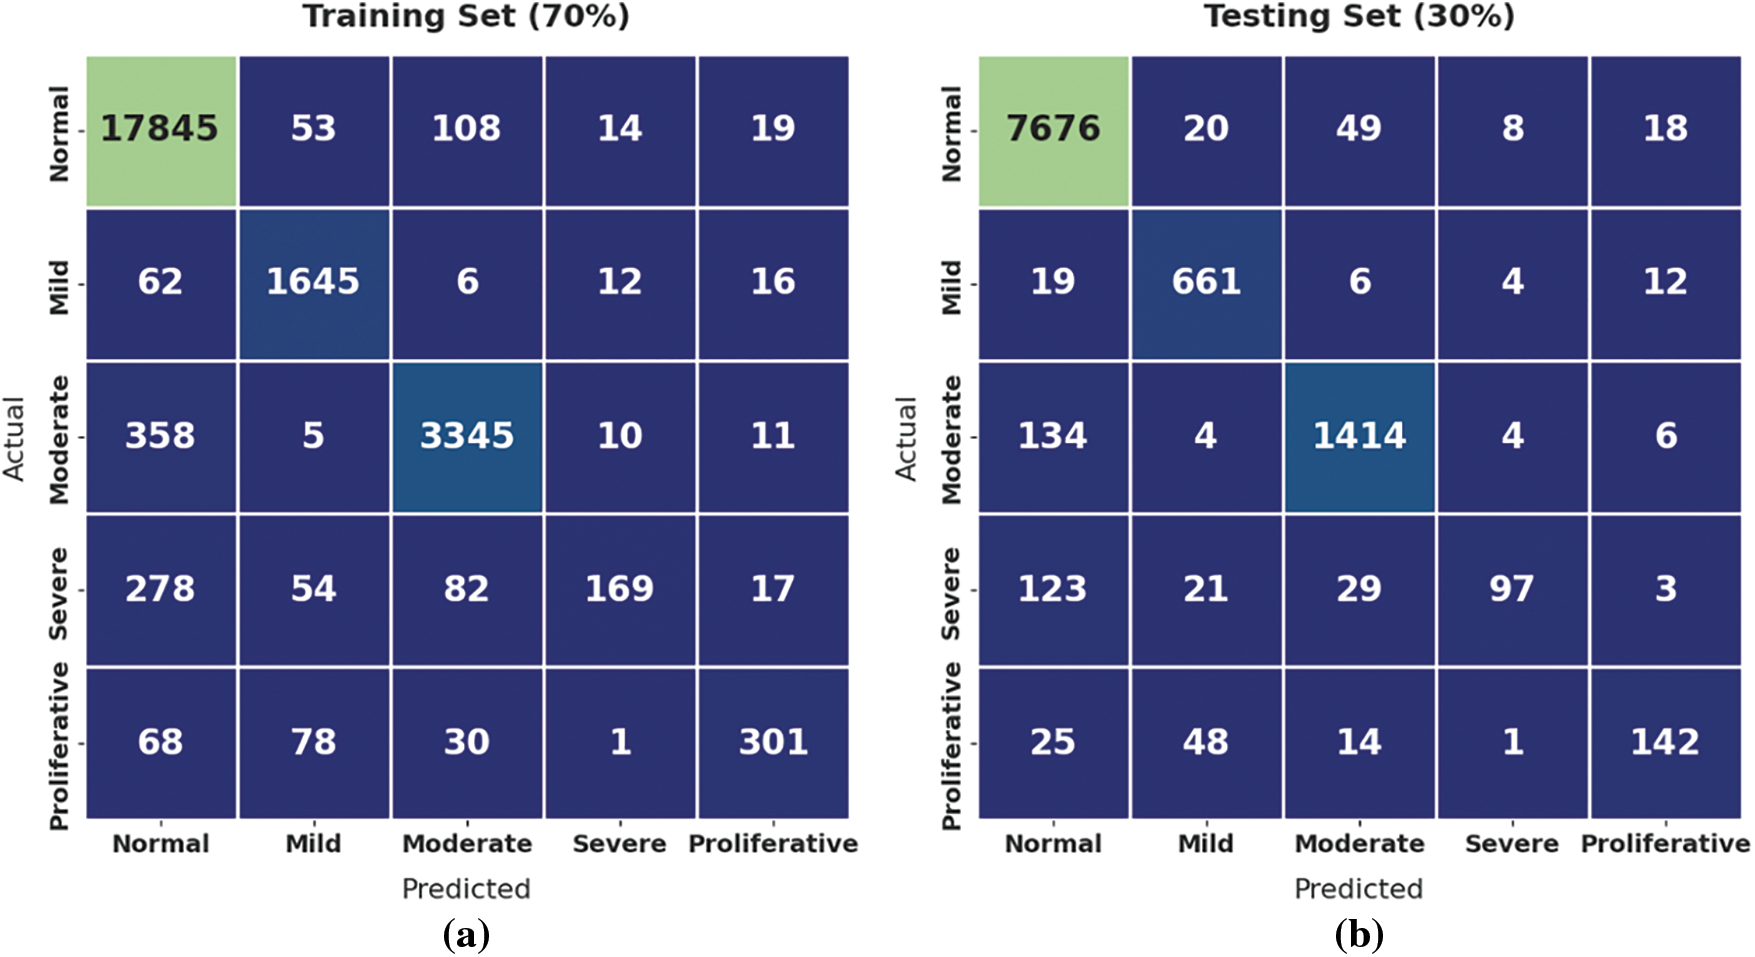
Figure 4: Confusion matrix of GOFED-RBVSC technique
Tab. 1 reports the overall classifier results of the GOFED-RBVSC model on different classes.
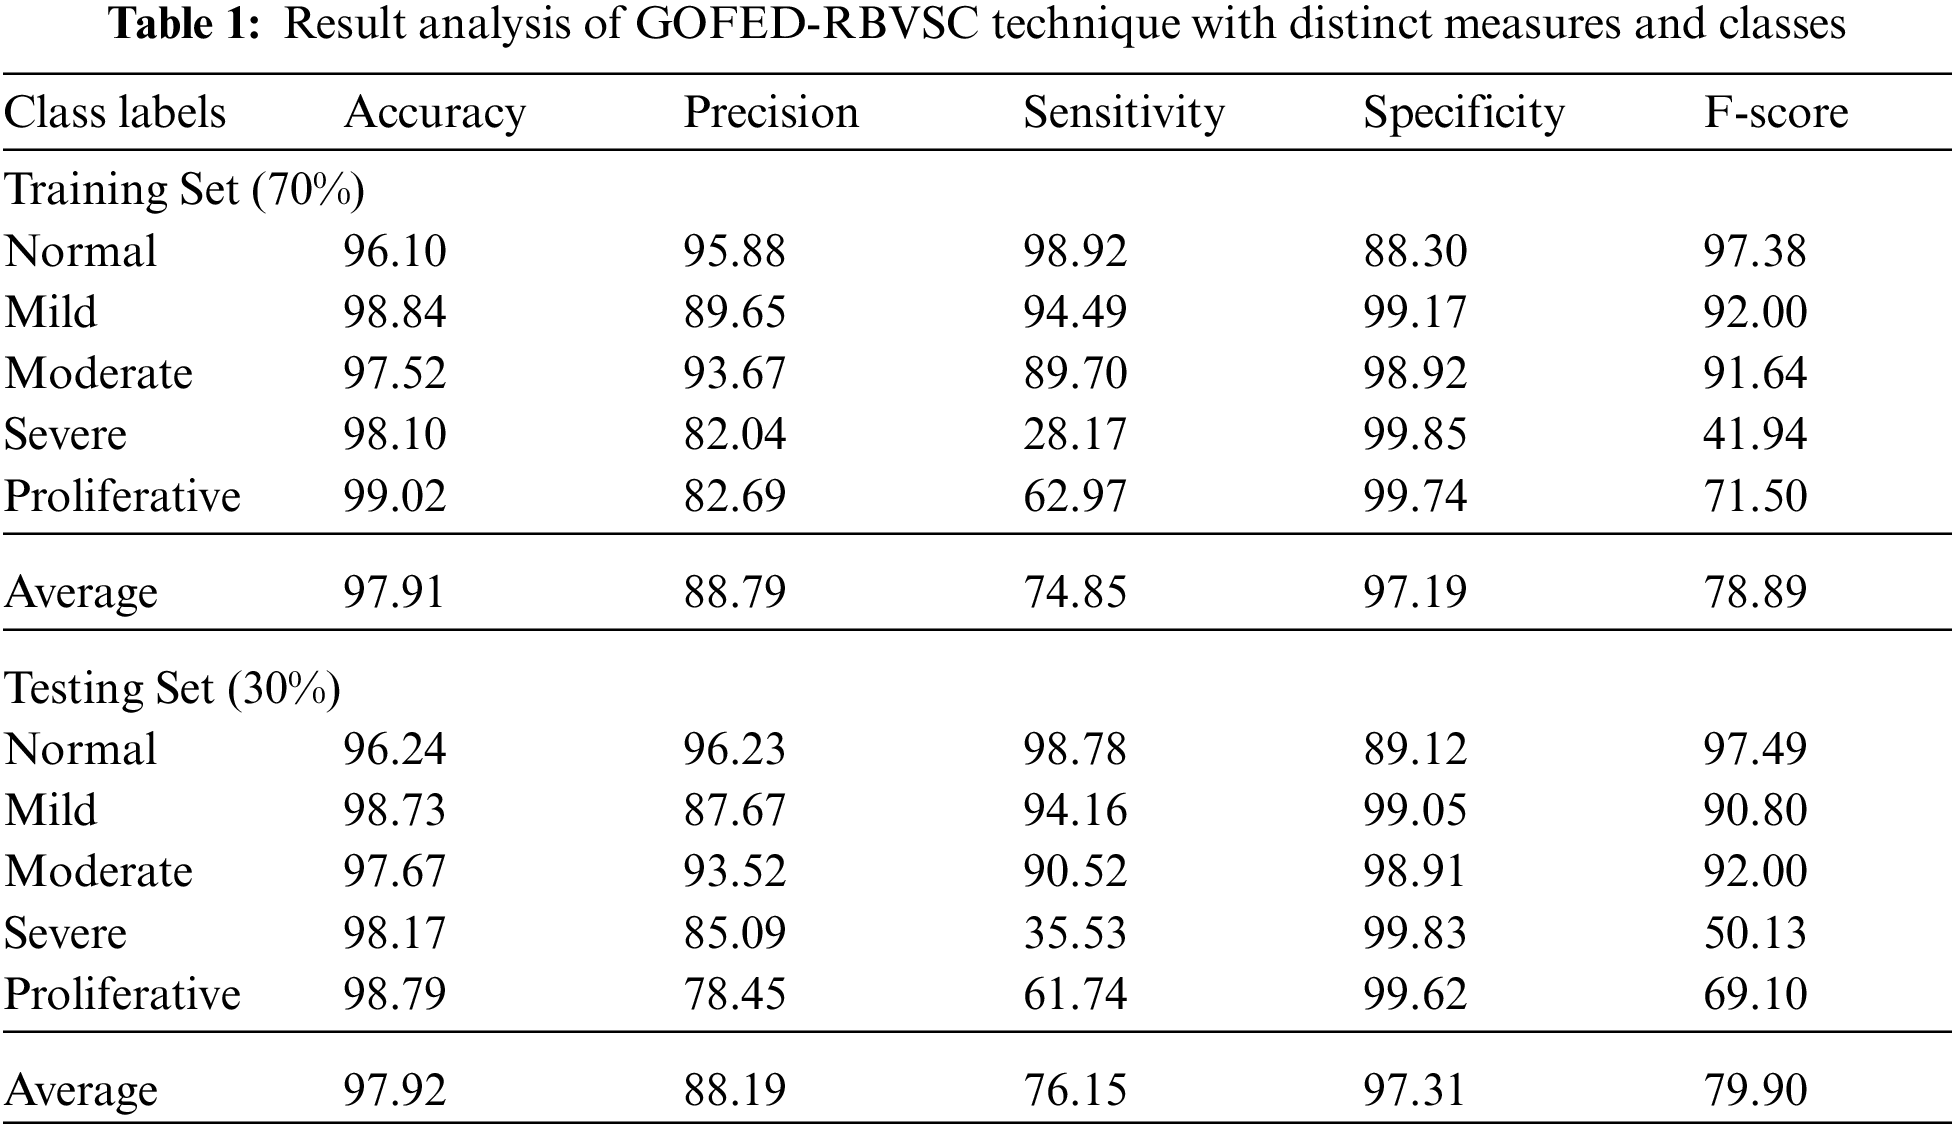
Fig. 5 portrays the retinal fundus classification outcomes of the GOFED-RBVSC model on 70% of TRS. The GOFED-RBVSC model has recognized normal images with
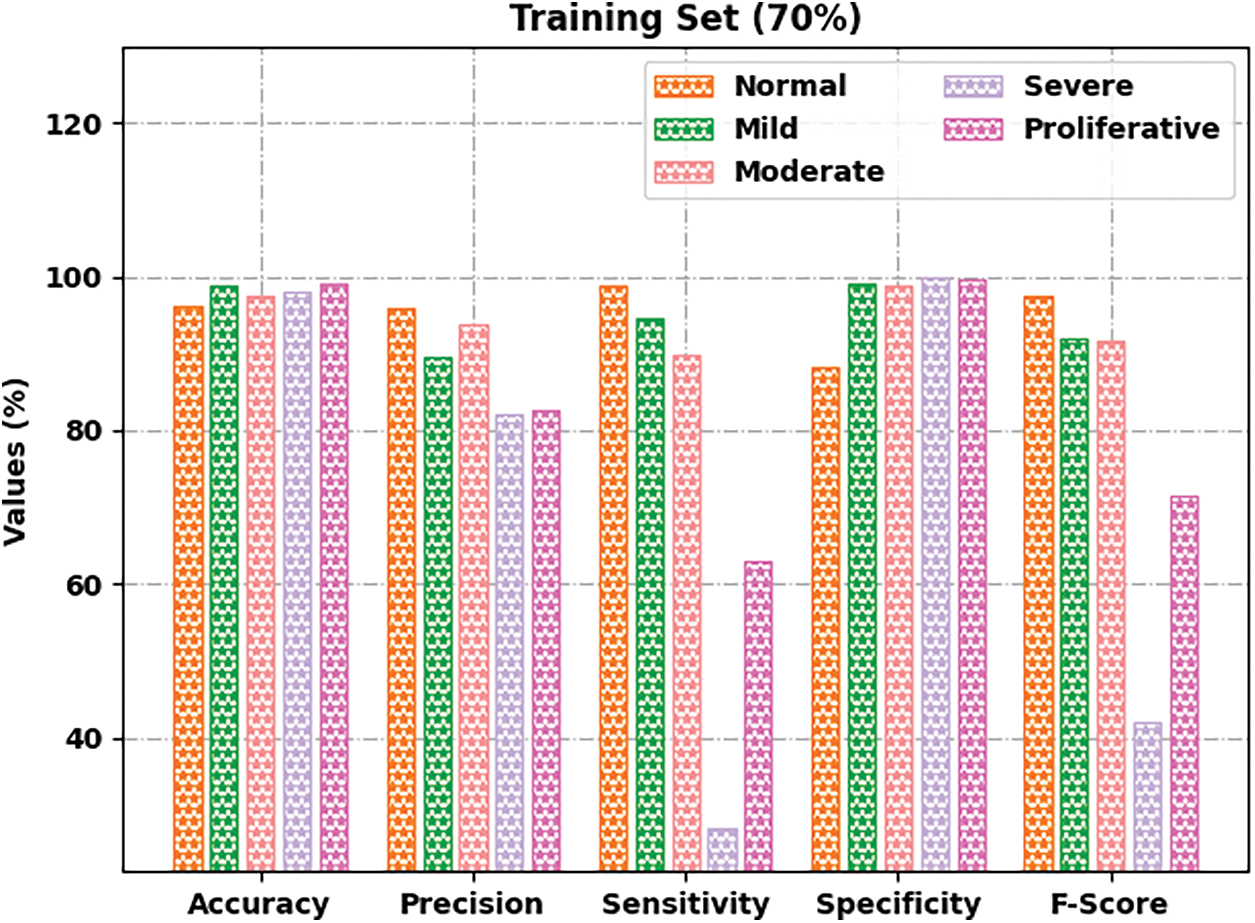
Figure 5: Result analysis of GOFED-RBVSC technique on 70% of TRS
Fig. 6 depicts the retinal fundus classification outcomes of the GOFED-RBVSC method on 30% of TSS. The GOFED-RBVSC model has recognized normal images with
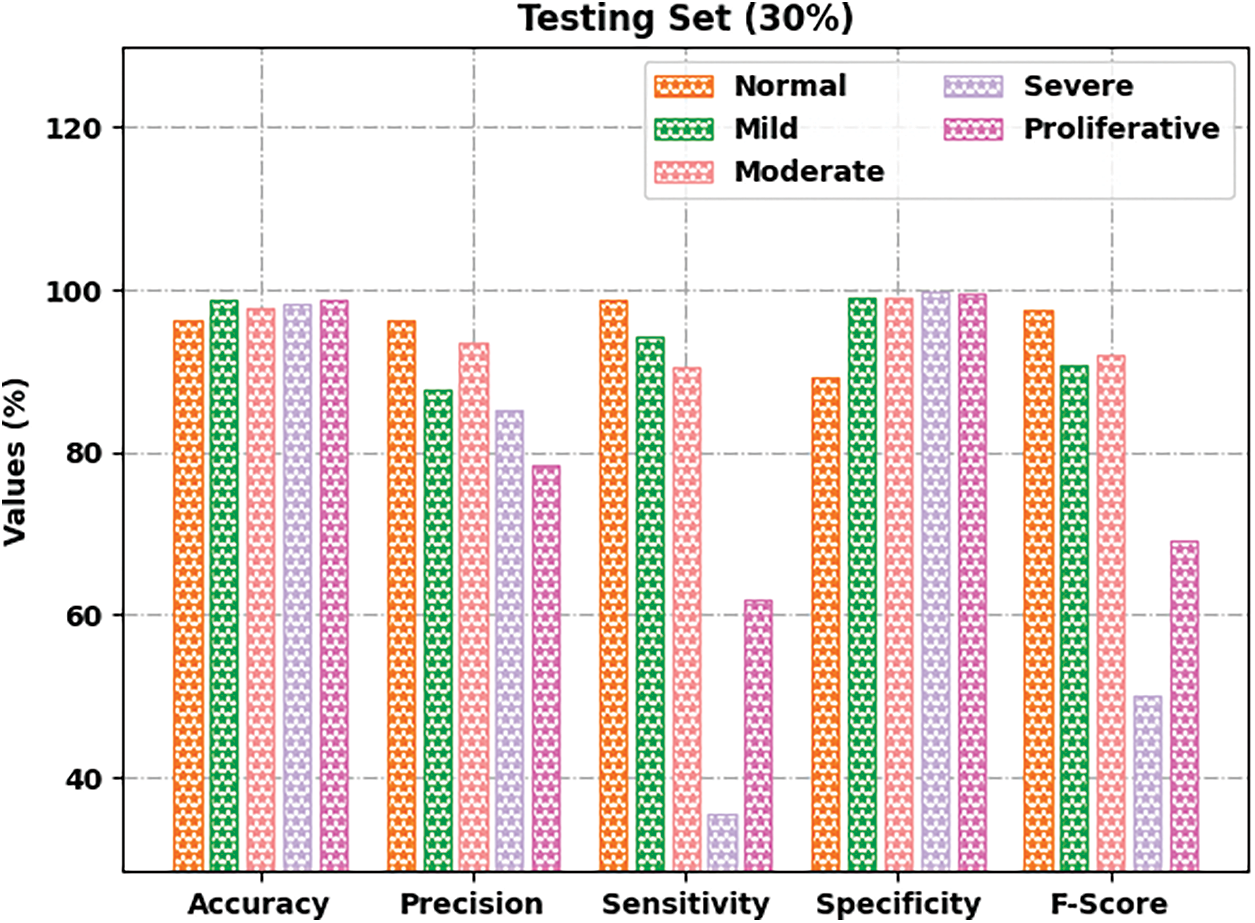
Figure 6: Result analysis of GOFED-RBVSC technique on 30% of TSS
The training accuracy (TA) and validation accuracy (VA) attained by the GOFED-RBVSC model on test dataset is demonstrated in Fig. 7. The experimental outcomes implied that the GOFED-RBVSC model had gained maximum values of TA and VA. In specific, the VA is seemed to be higher than TA.
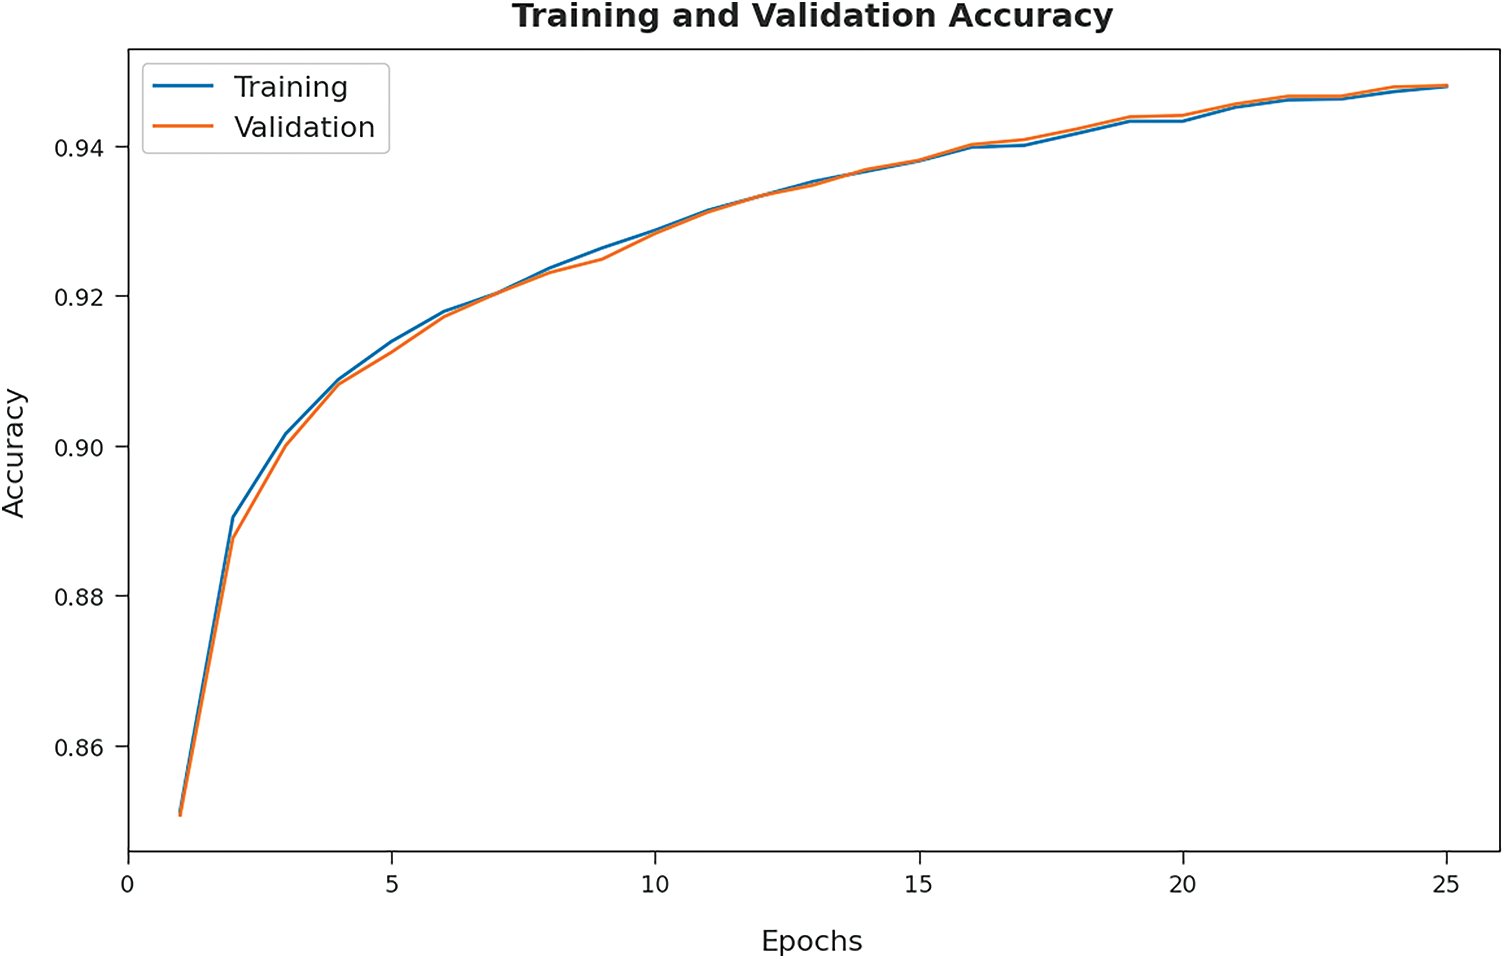
Figure 7: TA and VA graph analysis of GOFED-RBVSC technique
The training loss (TL) and validation loss (VL) achieved by the GOFED-RBVSC model on test dataset are established in Fig. 8. The experimental outcomes inferred that the GOFED-RBVSC model had accomplished least values of TL and VL. In specific, the VL is seemed to be lower than TL.
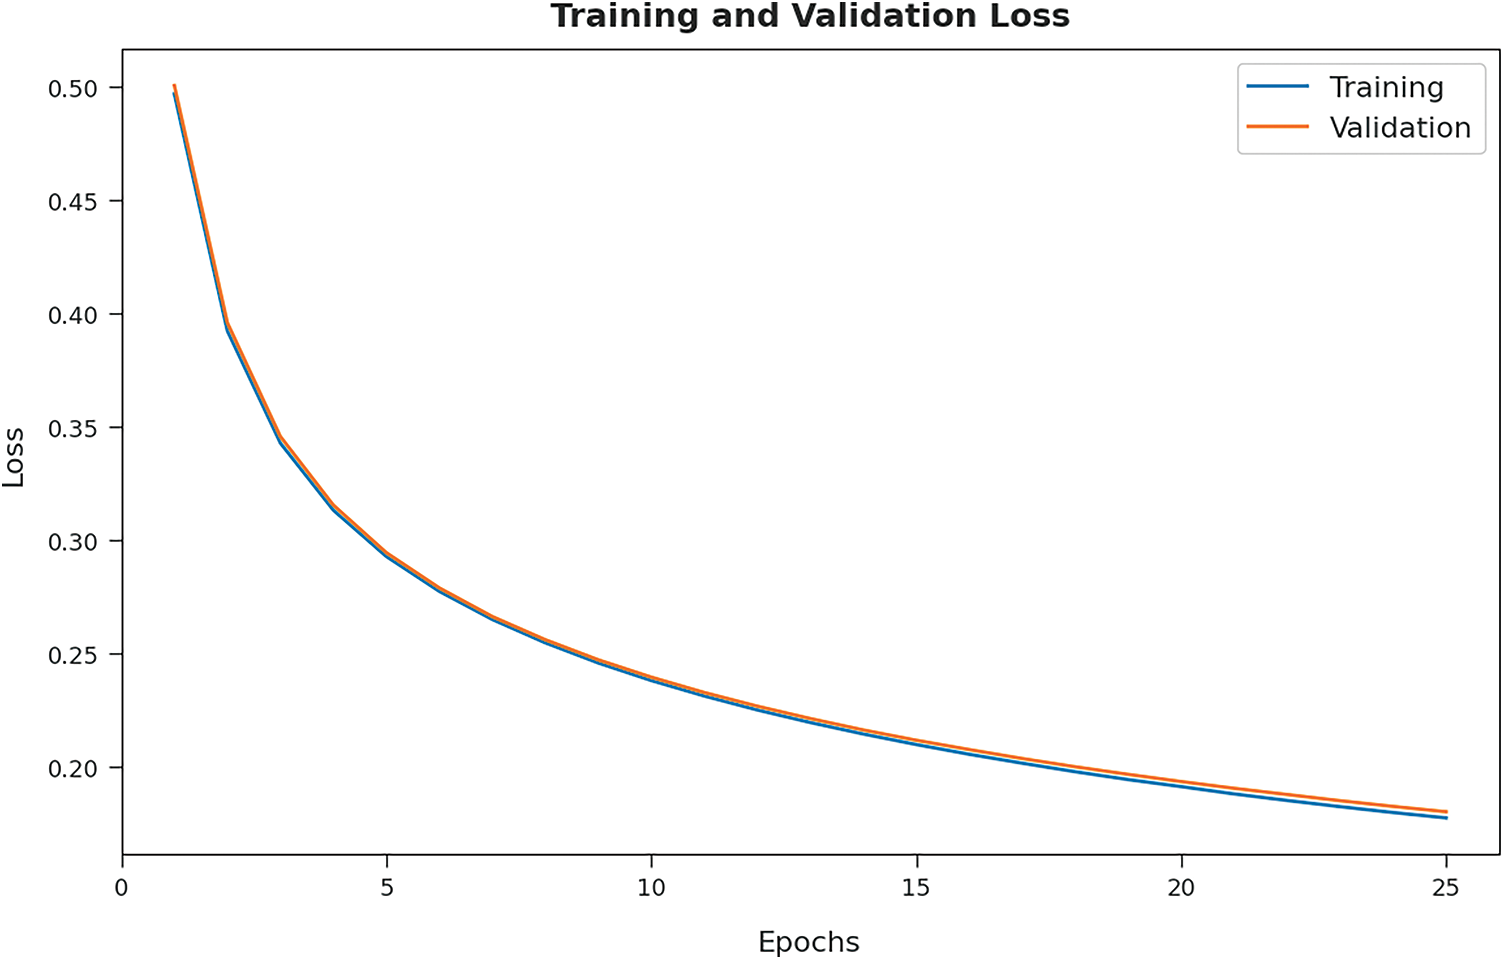
Figure 8: TL and VL graph analysis of GOFED-RBVSC technique
A brief precision-recall examination of the GOFED-RBVSC model on test dataset is portrayed in Fig. 9. By observing the figure, it is noticed that the GOFED-RBVSC model has accomplished maximum precision-recall performance under all classes.
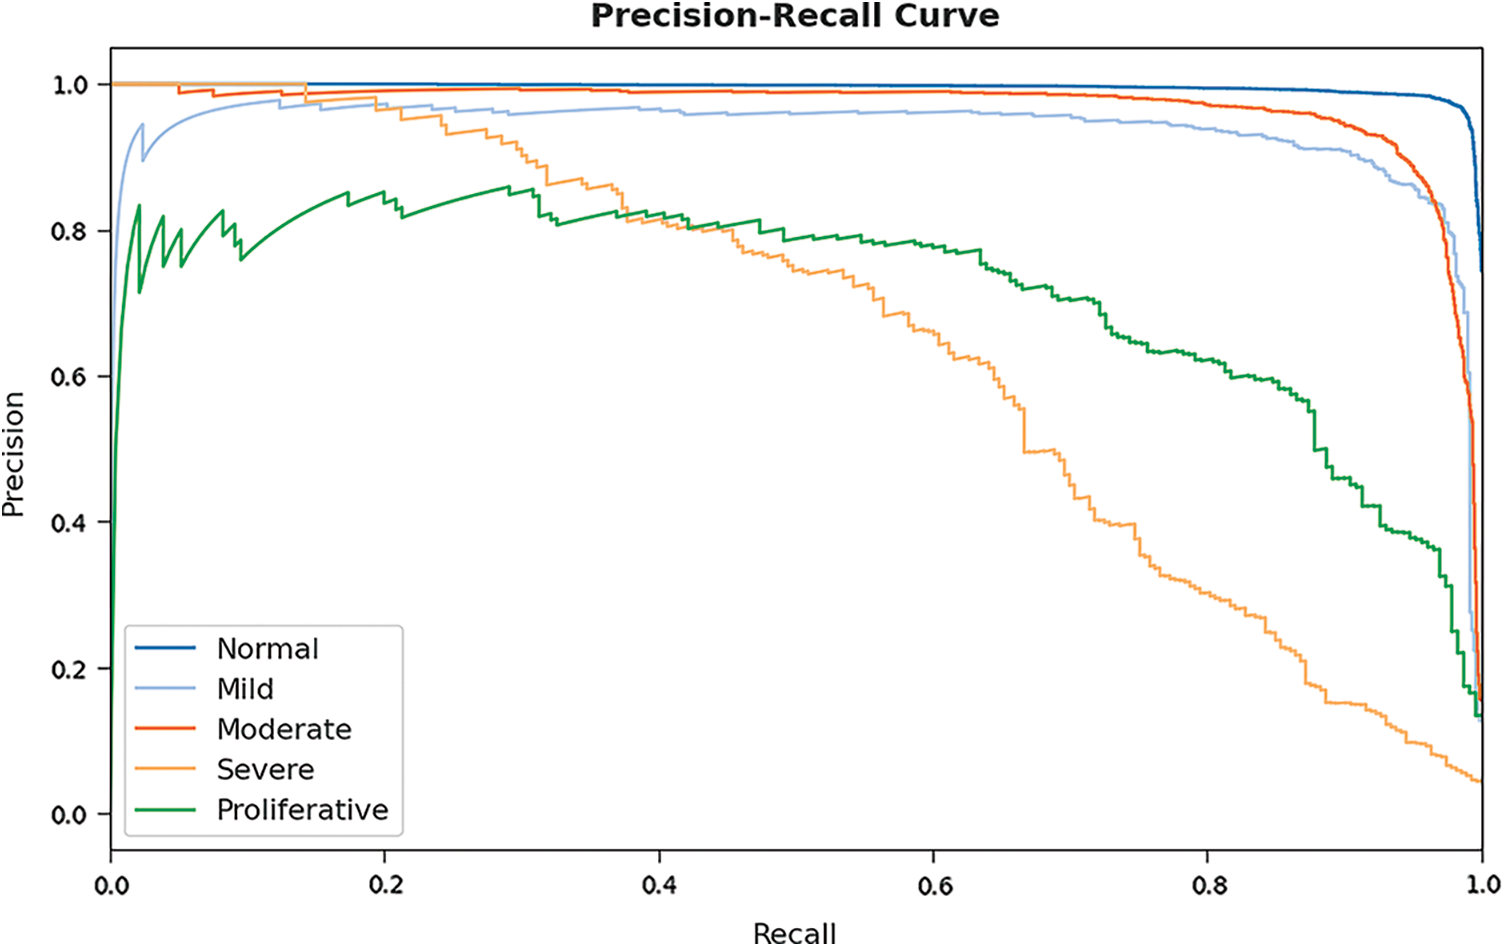
Figure 9: Precision-recall curve analysis of GOFED-RBVSC technique
A detailed ROC investigation of the GOFED-RBVSC model on test dataset is portrayed in Fig. 10. The results indicated that the GOFED-RBVSC model had exhibited its ability in categorizing five different classes such as normal, mild, moderate, severe, and proliferative on the test datasets.
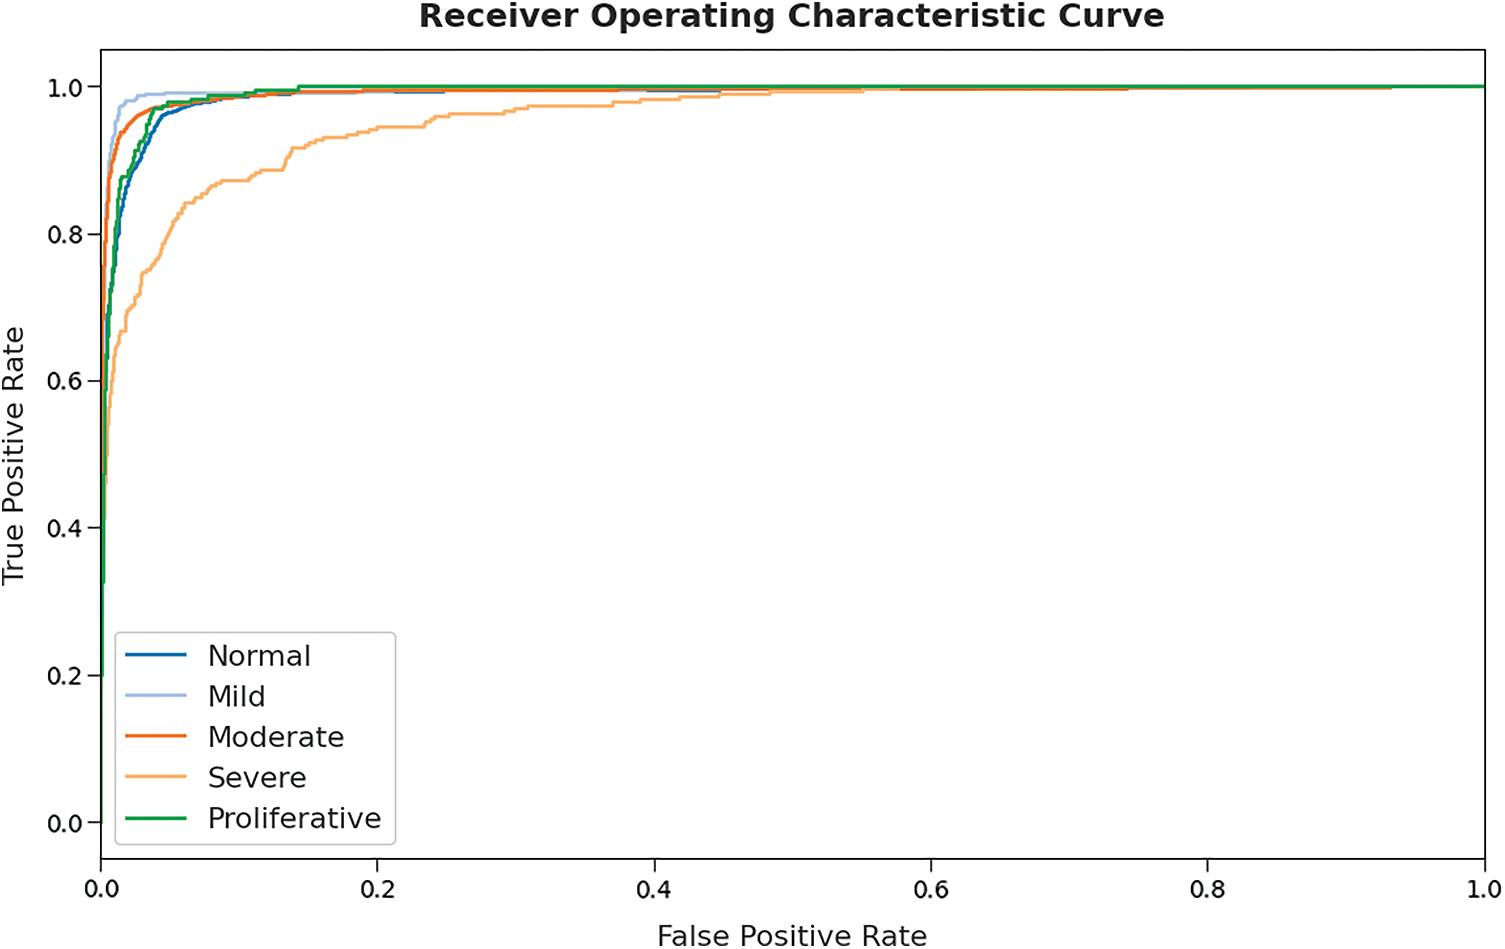
Figure 10: ROC curve analysis of GOFED-RBVSC technique
Extensive comparative study of the GOFED-RBVSC model with other models is made in Tab. 2 [21–23].
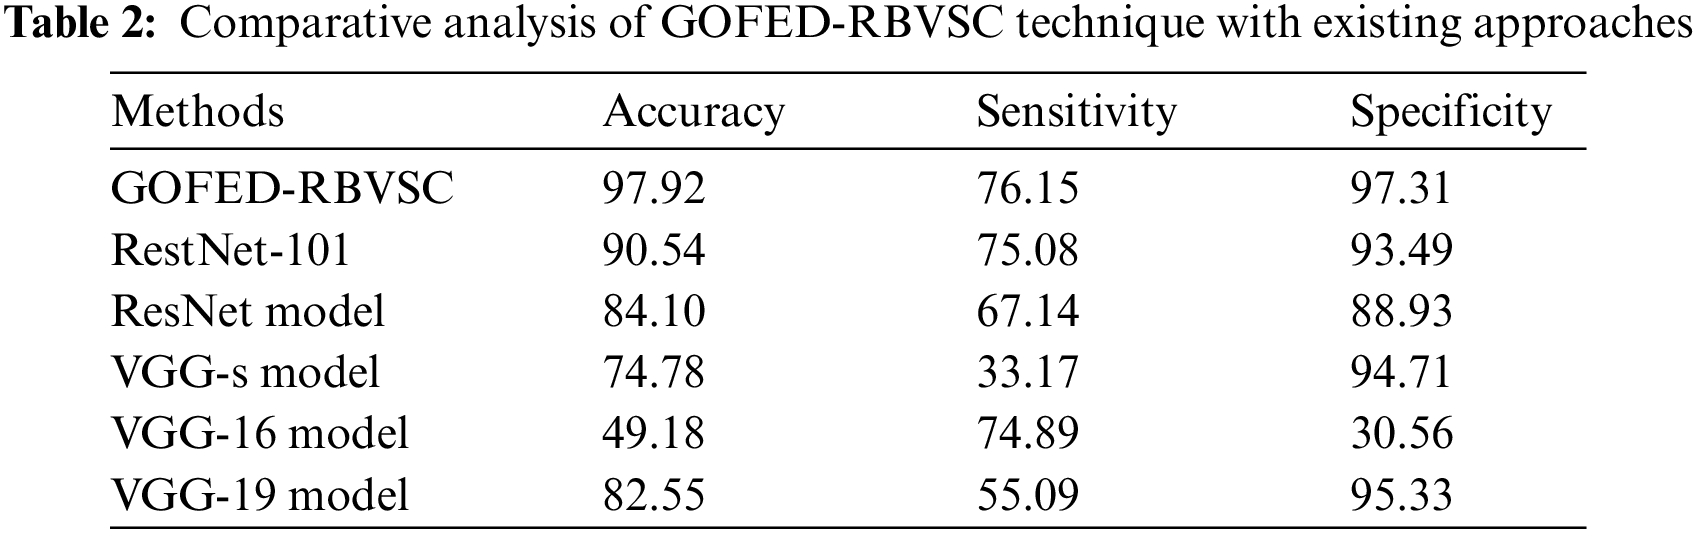
Fig. 11 reports a detailed
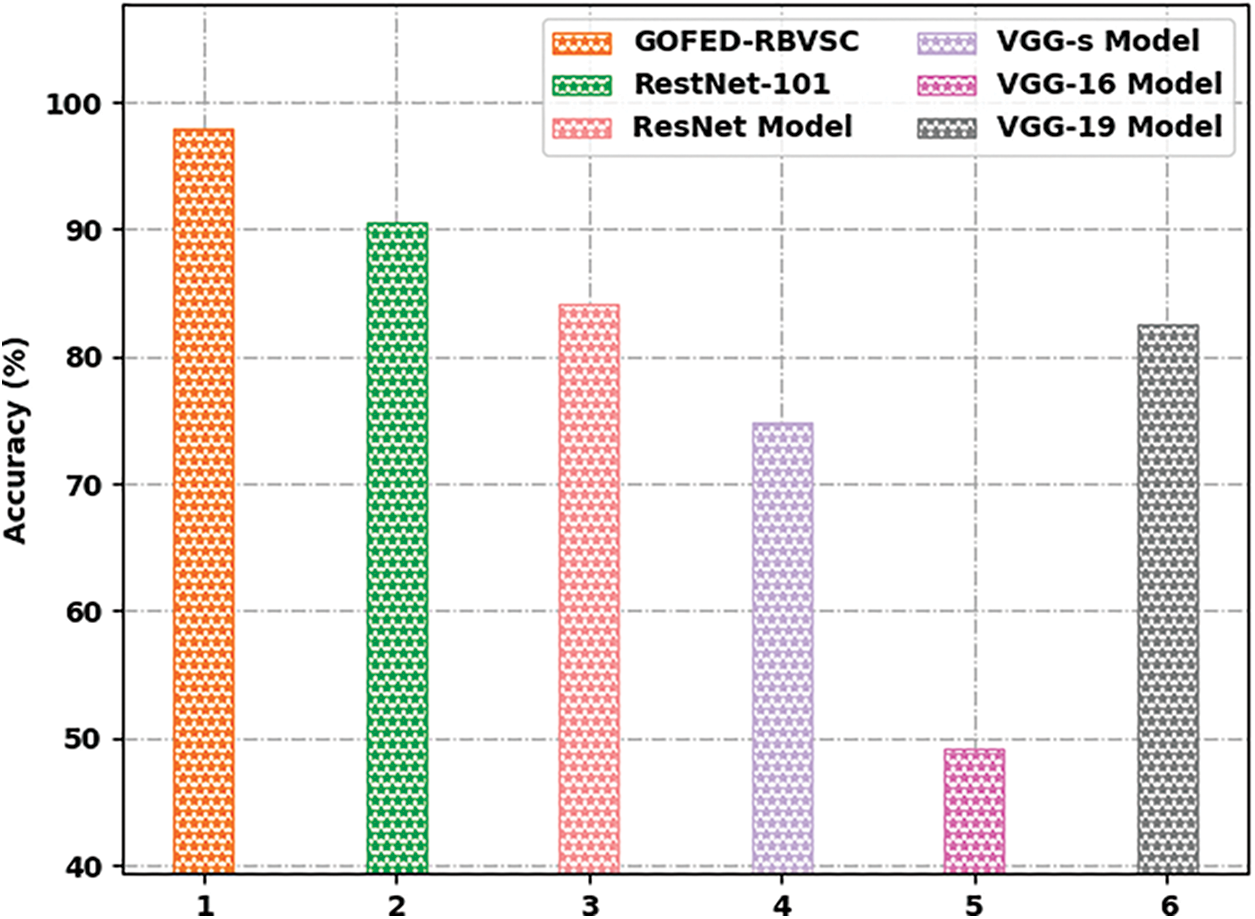
Figure 11:
Fig. 12 reports a comprehensive
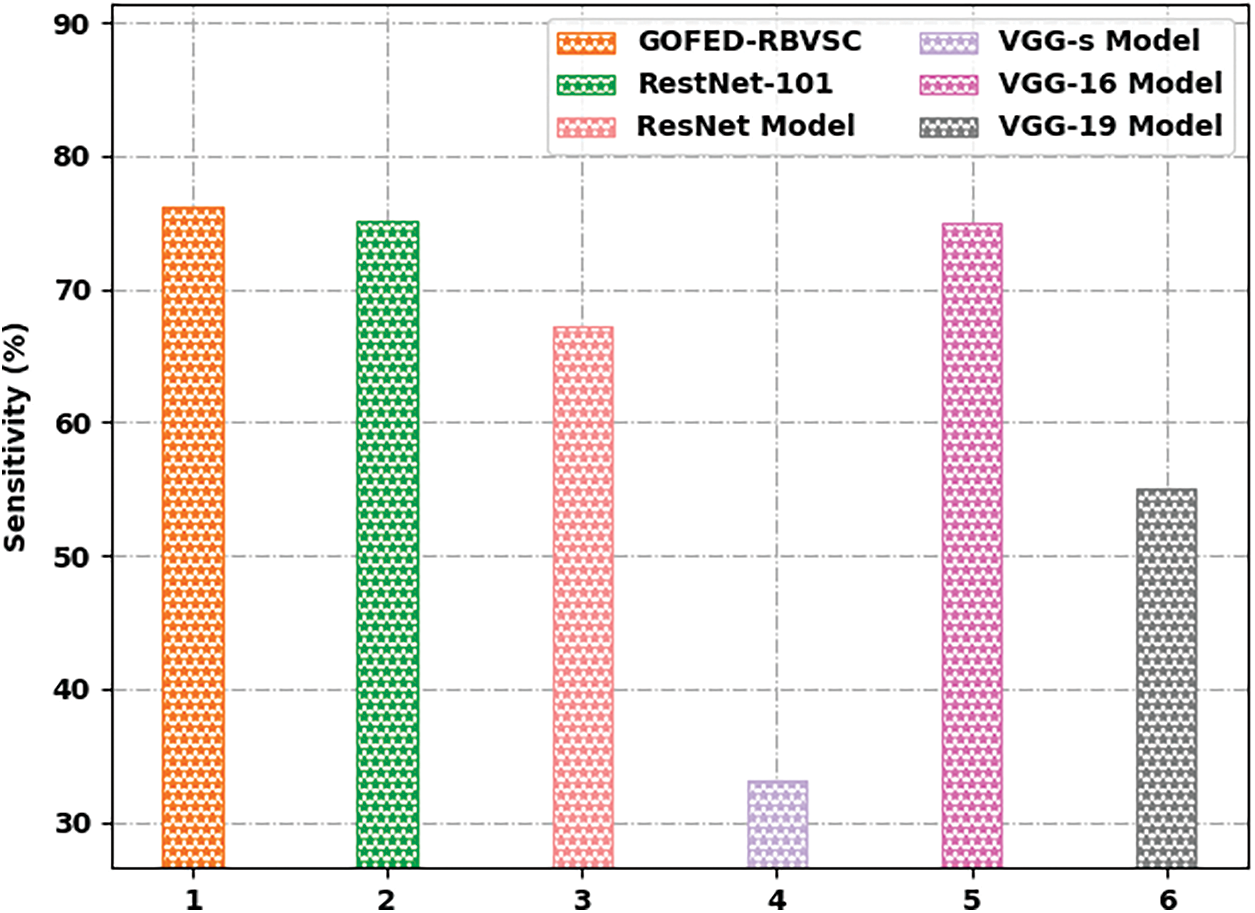
Figure 12:
Fig. 13 reports a comprehensive
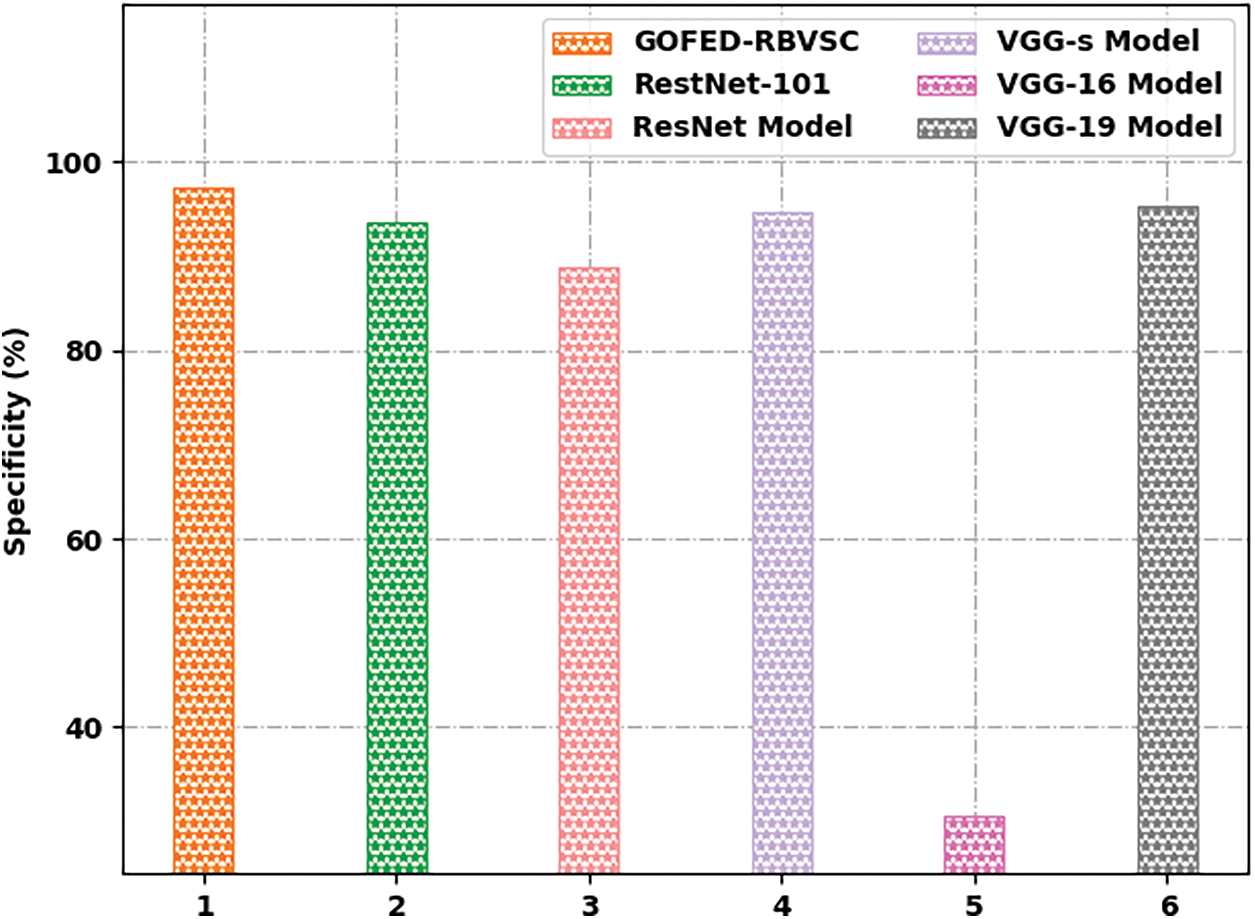
Figure 13:
In this study, a new GOFED-RBVSC model has been developed for effectively segmenting the blood vessels and classifying retinal fundus images. Primarily, the GOFED-RBVSC model employed contrast enhancement process. In addition, GOAFED technique is applied to detect the edges in the retinal fundus images in which the use of GOA adjusts the membership functions. Followed by, ORB feature extractor is exploited to generate feature vectors. Finally, ICAVE model can be employed to classify retinal images. The performance validation of the GOFED-RBVSC model is tested using benchmark dataset, and the comparative study highlighted the betterment of the GOFED-RBVSC model over the recent approaches. In future, deep instance segmentation models can be derived to improve the overall classification performance.
Funding Statement: The authors received no specific funding for this study.
Conflicts of Interest: The authors declare that they have no conflicts of interest to report regarding the present study.
References
1. B. Gui, R. J. Shuai and P. Chen, “Optic disc localization algorithm based on improved corner detection,” Procedia Computer Science, vol. 131, pp. 311–319, 2018. [Google Scholar]
2. S. Moccia, E. D. Momi, S. El Hadji and L. Mattos, “Blood vessel segmentation algorithms—Review of methods, datasets and evaluation metrics,” Computer Methods and Programs in Biomedicine, vol. 158, pp. 71–91, 2018. [Google Scholar]
3. Y. Lin, H. Zhang and G. Hu, “Automatic retinal vessel segmentation via deeply supervised and smoothly regularized network,” IEEE Access, vol. 7, pp. 57717–57724, 2019. [Google Scholar]
4. W. Wang, X. Huang, J. Li, P. Zhang and X. Wang, “Detecting COVID-19 patients in X-ray images based on MAI-nets,” International Journal of Computational Intelligence Systems, vol. 14, no. 1, pp. 1607–1616, 2021. [Google Scholar]
5. Y. Gui and G. Zeng, “Joint learning of visual and spatial features for edit propagation from a single image,” the Visual Computer, vol. 36, no. 3, pp. 469–482, 2020. [Google Scholar]
6. W. Wang, Y. T. Li, T. Zou, X. Wang, J. Y. You et al., “A novel image classification approach via dense-MobileNet models,” Mobile Information Systems, 2020. https://doi.org/10.1155/2020/7602384. [Google Scholar]
7. S. R. Zhou, J. P. Yin and J. M. Zhang, “Local binary pattern (LBP) and local phase quantization (LBQ) based on gabor filter for face representation,” Neurocomputing, vol. 116, pp. 260–264, 2013. [Google Scholar]
8. Y. Song, D. Zhang, Q. Tang, S. Tang and K. Yang, “Local and nonlocal constraints for compressed sensing video and multi-view image recovery,” Neurocomputing, vol. 406, pp. 34–48, 2020. [Google Scholar]
9. F. Li, C. Ou, Y. Gui and L. Xiang, “Instant edit propagation on images based on bilateral grid,” Computers Materials & Continua, vol. 61, no. 2, pp. 643–656, 2019. [Google Scholar]
10. P. M. Samuel and T. Veeramalai, “VSSC net: Vessel specific skip chain convolutional network for blood vessel segmentation,” Computer Methods and Programs in Biomedicine, vol. 198, pp. 105769, 2021. [Google Scholar]
11. F. Orujov, R. Maskeliūnas, R. Damaševičius and W. Wei, “Fuzzy based image edge detection algorithm for blood vessel detection in retinal images,” Applied Soft Computing, vol. 94, pp. 106452, 2020. [Google Scholar]
12. S. N. Sangeethaa and P. U. Maheswari, “An intelligent model for blood vessel segmentation in diagnosing dr using cnn,” Journal of Medical Systems, vol. 42, no. 10, pp. 175, 2018. [Google Scholar]
13. S. Roy, A. Mitra, S. Roy and S. K. Setua, “Blood vessel segmentation of retinal image using clifford matched filter and clifford convolution,” Multimedia Tools and Applications, vol. 78, no. 24, pp. 34839–34865, 2019. [Google Scholar]
14. A. Z. H. Ooi, Z. Embong, A. I. A. Hamid, R. Zainon, S. L. Wang et al., “Interactive blood vessel segmentation from retinal fundus image based on canny edge detector,” Sensors, vol. 21, no. 19, pp. 6380, 2021. [Google Scholar]
15. B. S. Tchinda, D. Tchiotsop, M. Noubom, V. L. Dorr and D. Wolf, “Retinal blood vessels segmentation using classical edge detection filters and the neural network,” Informatics in Medicine Unlocked, vol. 23, pp. 100521, 2021. [Google Scholar]
16. S. Mirjalili, S. Mirjalili, S. Saremi, H. Faris and I. Aljarah, “Grasshopper optimization algorithm for multi-objective optimization problems,” Applied Intelligence, vol. 48, no. 4, pp. 805–820, 2017. [Google Scholar]
17. J. Weberruss, L. Kleeman, D. Boland and T. Drummond, “FPGA acceleration of multilevel ORB feature extraction for computer vision,” in 2017 27th Int. Conf. on Field Programmable Logic and Applications (FPL), Ghent, Belgium, pp. 1–8, 2017. [Google Scholar]
18. Y. Yang, K. Zheng, C. Wu and Y. Yang, “Improving the classification effectiveness of intrusion detection by using improved conditional variational autoencoder and deep neural network,” Sensors, vol. 19, no. 11, pp. 2528, 2019. [Google Scholar]
19. C. Zhang, R. Barbano and B. Jin, “Conditional variational autoencoder for learned image reconstruction,” Computation, vol. 9, no. 11, p. 114, 2021. [Google Scholar]
20. Diabetic Retinopathy Detection, Kaggle.com, Accessed: 23-Apr-2022, https://www.kaggle.com/c/diabetic-retinopathy-detection/data. [Google Scholar]
21. K. Yazhini and D. Loganathan, “Artificial intelligence-based optimal residual network model for diabetic retinopathy image classification,” in Artificial Intelligence Applications for Smart Societies, Studies in Distributed Intelligence, Cham: Springer, pp. 147–159, 2021. [Google Scholar]
22. R. F. Mansour, “Deep-learning-based automatic computer-aided diagnosis system for diabetic retinopathy,” Biomedical Engineering Letters, vol. 8, no. 1, pp. 41–57, 2018. [Google Scholar]
23. R. F. Mansour, E. M. Abdelrahim and A. S. Al-Johani, “Identification of diabetic retinal exudates in digital color images using support vector machine,” Journal of Intelligent Learning Systems and Applications, vol. 5, no. 3, pp. 135–142, 2013. [Google Scholar]
Cite This Article
 Copyright © 2023 The Author(s). Published by Tech Science Press.
This work is licensed under a Creative Commons Attribution 4.0 International License , which permits unrestricted use, distribution, and reproduction in any medium, provided the original work is properly cited.
 Downloads
 Citation Tools