
 Submit a Paper
 Propose a Special lssue
 Open Access
ARTICLE
Detection of Left Ventricular Cavity from Cardiac MRI Images Using Faster R-CNN
1 Faculty of Electrical and Electronic Engineering, Universiti Tun Hussein Onn Malaysia, Parit Raja, Batu Pahat, 86400, Johor, Malaysia
2 Department of Computer Science, College of Science and Arts, Sharurah, Najran University, Najran, 61441, Saudi Arabia
3 Department of Computer Science, Faculty of Computer Science and Info. Systems, Thamar University, Dhamar, 87246, Yemen
4 Department of Computer Science, College of Computer Science and Information Systems, Najran University, Najran, 61441, Saudi Arabia
* Corresponding Author: Zakarya Farea Shaaf. Email:
Computers, Materials & Continua 2023, 74(1), 1819-1835. https://doi.org/10.32604/cmc.2023.031900
Received 29 April 2022; Accepted 12 June 2022; Issue published 22 September 2022
 View Full Text
 Download PDF
Abstract
The automatic localization of the left ventricle (LV) in short-axis magnetic resonance (MR) images is a required step to process cardiac images using convolutional neural networks for the extraction of a region of interest (ROI). The precise extraction of the LV’s ROI from cardiac MRI images is crucial for detecting heart disorders via cardiac segmentation or registration. Nevertheless, this task appears to be intricate due to the diversities in the size and shape of the LV and the scattering of surrounding tissues across different slices. Thus, this study proposed a region-based convolutional network (Faster R-CNN) for the LV localization from short-axis cardiac MRI images using a region proposal network (RPN) integrated with deep feature classification and regression. The model was trained using images with corresponding bounding boxes (labels) around the LV, and various experiments were applied to select the appropriate layers and set the suitable hyper-parameters. The experimental findings show that the proposed model was adequate, with accuracy, precision, recall, and F1 score values of 0.91, 0.94, 0.95, and 0.95, respectively. This model also allows the cropping of the detected area of LV, which is vital in reducing the computational cost and time during segmentation and classification procedures. Therefore, it would be an ideal model and clinically applicable for diagnosing cardiac diseases.Keywords
Detecting anatomical organs has been receiving increased attention in medical image analysis because it only extracts ROI from the background. Recently, short-axis MRI images have played an essential role in the evaluation of cardiac functions [1,2] to diagnose cardiovascular diseases such as myocardial infarction (MI) [3]. Cardiac MRI images consist of the LV and right ventricle, surrounded by other organs such as the lungs and diaphragm. Thus, LV localization is extremely useful in reducing computational load, particularly for deep learning algorithms. The fundamental advantage of LV localization is that it improves the effectiveness of subsequent techniques like regression [4] and segmentation [5–7] by extracting only the LV area and ignoring the other organs, as illustrated in Fig. 1.
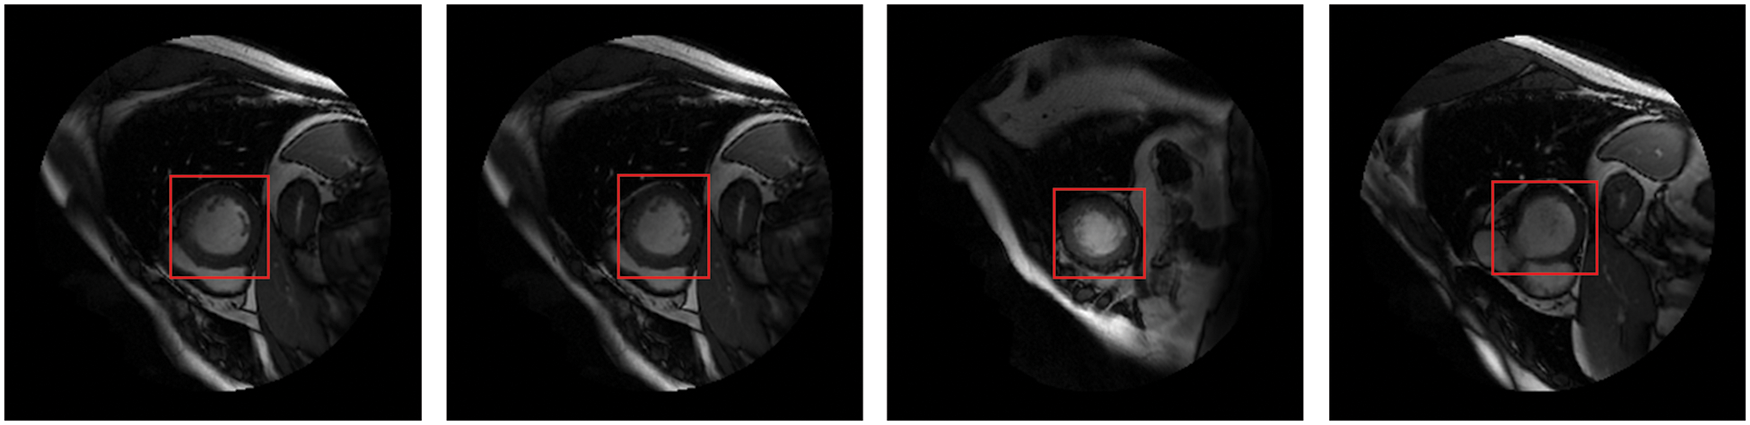
Figure 1: The LV localization from cardiac short-axis MRI images at various shapes and sizes
There are a limited number of methods for the automatic detection of cardiac objects, for instance, model-based [8–10], machine learning [11], and deep learning models [12–14]. Due to some reasons, such as inhomogeneous intensity, diversities in the size and shape of LV at different slices, and an insignificant intensity difference between LV and surrounding tissues, the accurate localization of LV from MRI images is critical. The emergence of the region-based convolutional neural network (R-CNN) in 2014 had a significant influence on object detection. R-CNN has inspired the development of new methods like Fast R-CNN [15], Faster R-CNN [16], you only look once (YOLO) [17], single-shot detector (SSD) [18], and region-based fully convolutional network (R-FCN) [19]. The CNN-based detection techniques, including one-phase (YOLO and SSD), two-phase (R-CNN, Fast R-CNN, and Faster R-CNN), and anchor-free based methods, have achieved satisfactory performance for object detection, especially for natural images. Among these methods, Faster R-CNN was preferred since it surpassed other methods in speed and accuracy [20]. Wang et al. [14] also determined that LV detection currently relies on two-phase methods, and Faster R-CNN demonstrated the most outstanding performances. However, its ability to directly detect the LV from cardiac MRI images is still limited.
This paper proposes a Faster R-CNN model with a region proposal network to accurately detect the LV from short-axis MRI images at all different slices. The network is based on three main phases: CNN layers for feature extraction from input images; RPN with anchors that generate candidate regions of the LV region; and regression and classification layers that locate the LV by bounding box and determine the objectness score, respectively.
The rest of this paper is structured as follows. Section 2 describes some previous related works. Section 3 introduces the materials and methods, and the experimental results and discussion are explained in Section 4. Section 5 represents the conclusion.
The LV has a vital role in cardiac functionality and has been widely considered for studies of LV analysis. In computer vision, LV detection has been applied using traditional object detection methods such as the circular Hough transform [21], Fourier analysis, and a spectrum-based tool [9]. The main limitation of these methods is that they are based on handcrafted features with poor image region representation, which impacts detection speed and accuracy. Various CNN-based detection methods have been proposed to overcome these issues and were shown to perform well. As explained by Wang et al. [14], these approaches can be classified as one-phase, two-phase, and anchor-free. YOLO [17] and SSD [18] are one-phase detection techniques aiming to direct classification and regression to the sliding windows. R-CNN [22], Fast R-CNN [15] and Faster R-CNN [16] are two-phase detection methods that produce proposals separately and consequently perform regression and classification. Anchor-free methods, such as Centernet [23] and Cornernet [24], use inferred key point locations to detect the position of objects directly.
Recently, several studies for LV identification based on deep learning algorithms from MRI images have been proposed [25,26]. Wang et al. [13] developed landmark detection that localizes LV in cardiac MRI using deep distance metric learning and CNN regression. The salient patches in this method were created using a distance learning module that learns deep patch characteristics in cardiac MRI images without requiring extensive labelling. The salient patches are fed into the CNN regression model, which infers landmark localization based on the salient samples. Before LV segmentation, Abdeltawab et al. [27] created a fully convolutional neural network (FCN) to detect the LV blood pool center-point. Tao et al. [28] created a CNN to detect LV as the first step toward fully automated quantifying LV function from short-axis MRI. Long short-term memory (LSTM) has been proposed for LV detection from MRI sequences [29], but the sequence of cardiac MRI images is not consistent same as a video sequence, and some frames have transformation; and the LSTM architecture did not have a regression module, causing faulty detection frames. The goal of the sliding window was to generate fixed size and position proposals, which were then classified using CNN [30]. The detection box and ground truth overlap at a low rate due to the position of proposals with fixed size and position. Niu et al. [31] proposed a hybrid model that combines region proposal, deep feature classification, and regression to locate myocardial and LV tissue in cardiac MRI images. Their method generated candidate regions on images using structural similarity-enhanced super voxel over-segmentation and hierarchical clustering and then employed a deep-stacked sparse auto-encoder (SSAE) network to represent the candidate regions based on deep feature learning. The SSAE can learn in-depth features but cannot efficiently merge myocardial and blood pool areas with significant gray-scale variances, decreasing detection box accuracy. Furthermore, the quantity of positive features is insufficient, and too many negative features cause an imbalance of positive and negative features in network training, resulting in unsatisfactory detection outcomes.
Deep learning approaches designed for assisted diagnosis require large-scale medical training data. This criterion may be tough to achieve in the medical field, where limited datasets are available and expert data labelling is cost-effective [32]. Transfer learning (TL) in convolutional neural networks from the natural domain to the medical domain has emerged rapidly [33]. As a result, instead of training from scratch, fine-tuning a pre-trained CNN has been proposed as an effective application of transfer learning from a specific domain with big annotated datasets to a target medical domain with small annotated datasets. Networks such as AlexNet [34], ResNet [35], VGGNet [36], GoogLeNet [37] and DenseNet [38] are trained on the ImageNet dataset [39] and can be fine-tuned for medical problem analysis. Kora et al. [40] have investigated transfer learning in medical image analysis.
The design of frameworks for object detection in MRI images requires more consideration because MRI can only be gathered by professional medical equipment with a limited amount of data, as opposed to natural images, which may provide an adequate amount of data. Due to the scarcity of medical MRI data, training deeper networks, which require large amounts of data in order to reach high accuracy, becomes problematic. According to Wang et al. [14], in one-stage and anchor-free detection techniques, the network seems to be a black box with difficulty in detecting objects directly from input images. Thus, based on the preceding restrictions, LV detection is mostly depends on two-stage approaches.
Faster R-CNN has demonstrated state-of-the-art performance among these two-stage detection algorithms. However, it has limitations in detecting LV from cardiac MRI due to factors such as varying LV’s shape and size in cardiac MRI slices and complex organ structures with little distinction between LV and other organs in cardiac MRI images. Based on the literature reviewed above, this paper proposes a CNN network for LV detection that uses the Faster R-CNN technique. The detected LV area can be cropped and used in segmentation and classification techniques for cardiac analysis.
The procedures of the proposed method for LV localization are summarized by the flowcharts presented in Fig. 2. The DICOM (digital imaging and communication in medicine) images are prepared and labelled as input for the proposed network. The steps are as follows: (i) labelling of the MRI images; (ii) selection of the network’s layers and hyper-parameters; (iii) training and testing the trained model for LV localization; and (iv) cropping ROI of the LV area. Several experiments were carried out to select the optimum algorithm, such as stochastic gradient descent with momentum (SGDM), root mean square propagation (RMSProp), and adaptive moment estimation (Adam) [41].
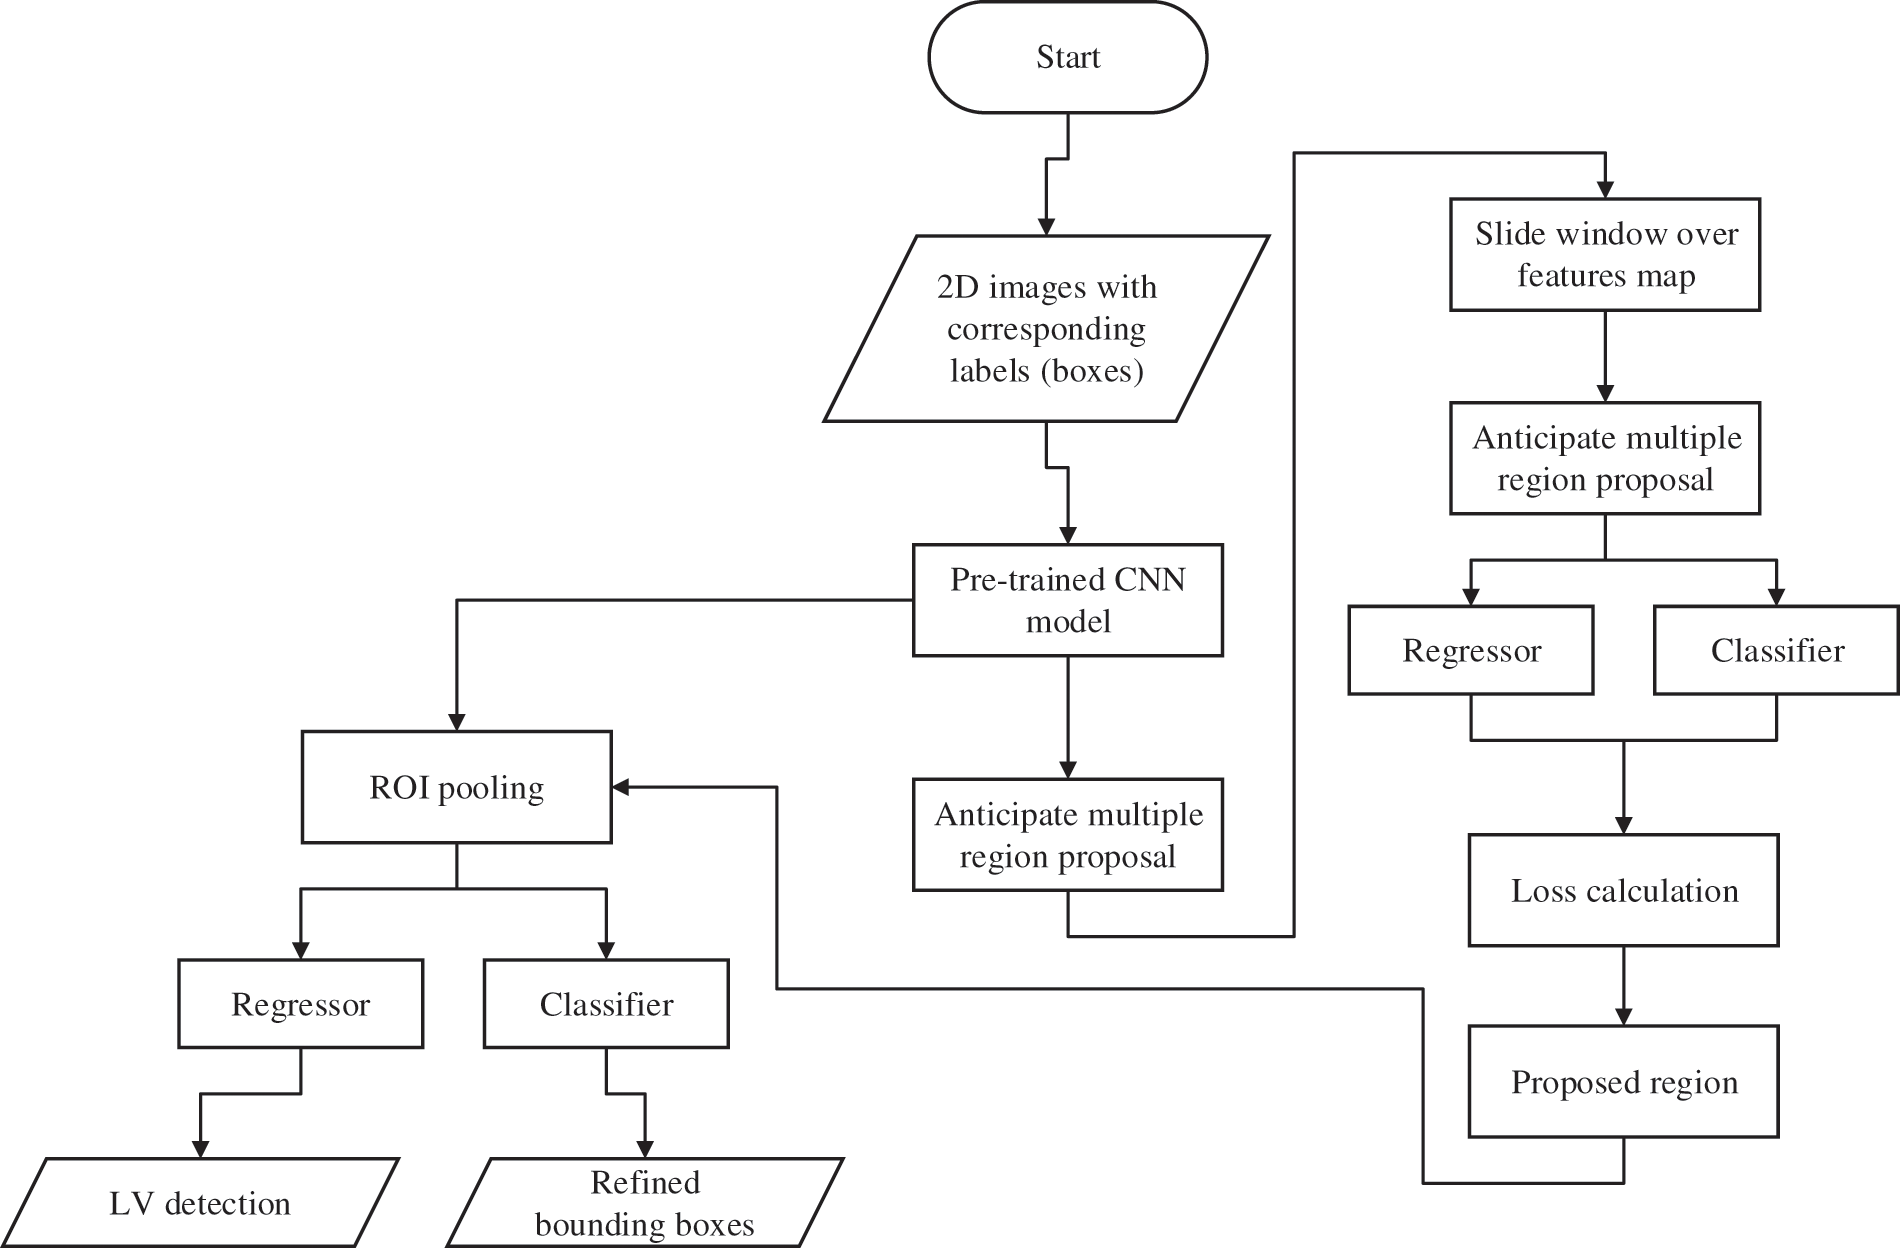
Figure 2: Flowchart of the process flow for the proposed network
The dataset used in this study is Sunnybrook cardiac dataset (SCD) from the left ventricle segmentation challenge held by the MICCAI workshop in 2009 [42], which is available with a public domain license in the Cardiac Atlas Project dataset. The data set includes short-axis MRI images for 45 subjects mixed with patients and pathologies classified as healthy, hypertrophy, heart failure with infarction, and heart failure without infarction. The images were acquired in short-axis view as steady-state free precession (SSFP) to obtain 20 frames in 6–12 slices from the base to the apex. The acquired images are 8 mm thick and 256 × 256 pixels in size. The images are in DICOM format, the original medical imaging standard. Preprocessing steps such as converting to portable network graphics (PNG) format and image labelling were applied to provide the ground truth. The images were divided into two groups: 80% for training and 20% for testing. The visualization of the LV area (indicated by a red arrow), consisting of original images, contours, and mesh surface plots, is presented in Fig. 3.
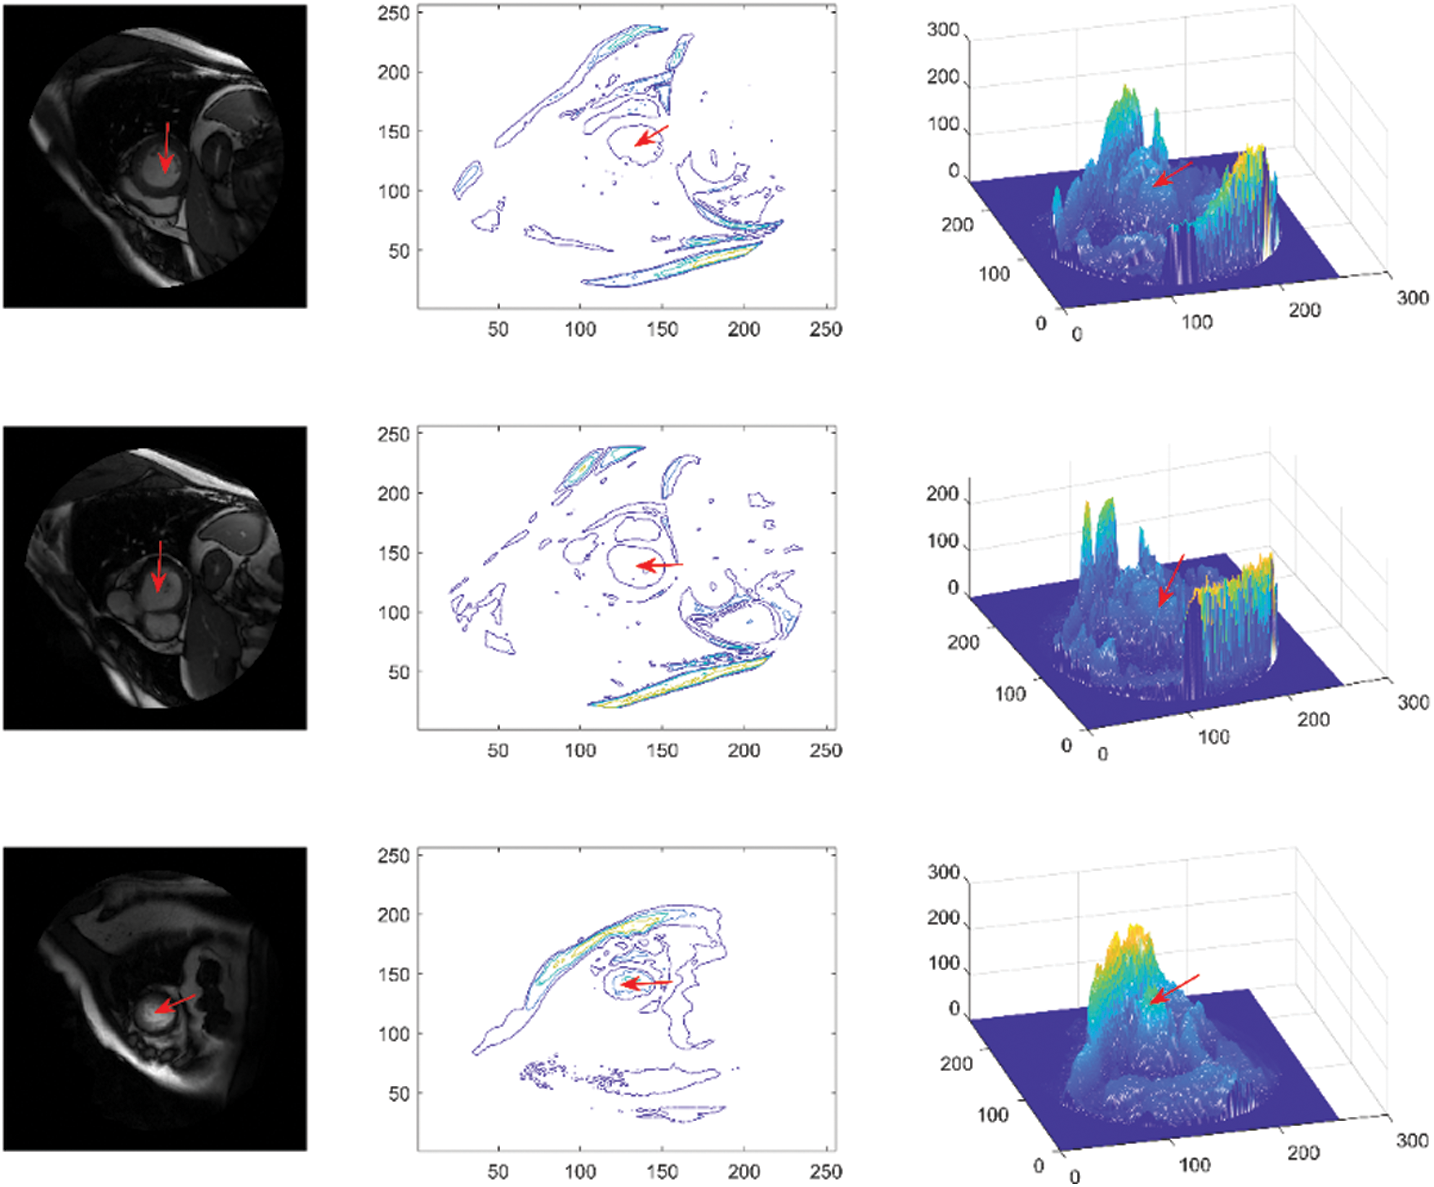
Figure 3: Sunnybrook data visualization, representing original images (first column), contours (second column) and mesh surfaces (third column)
3.2 Analytical Framework for Detection Model
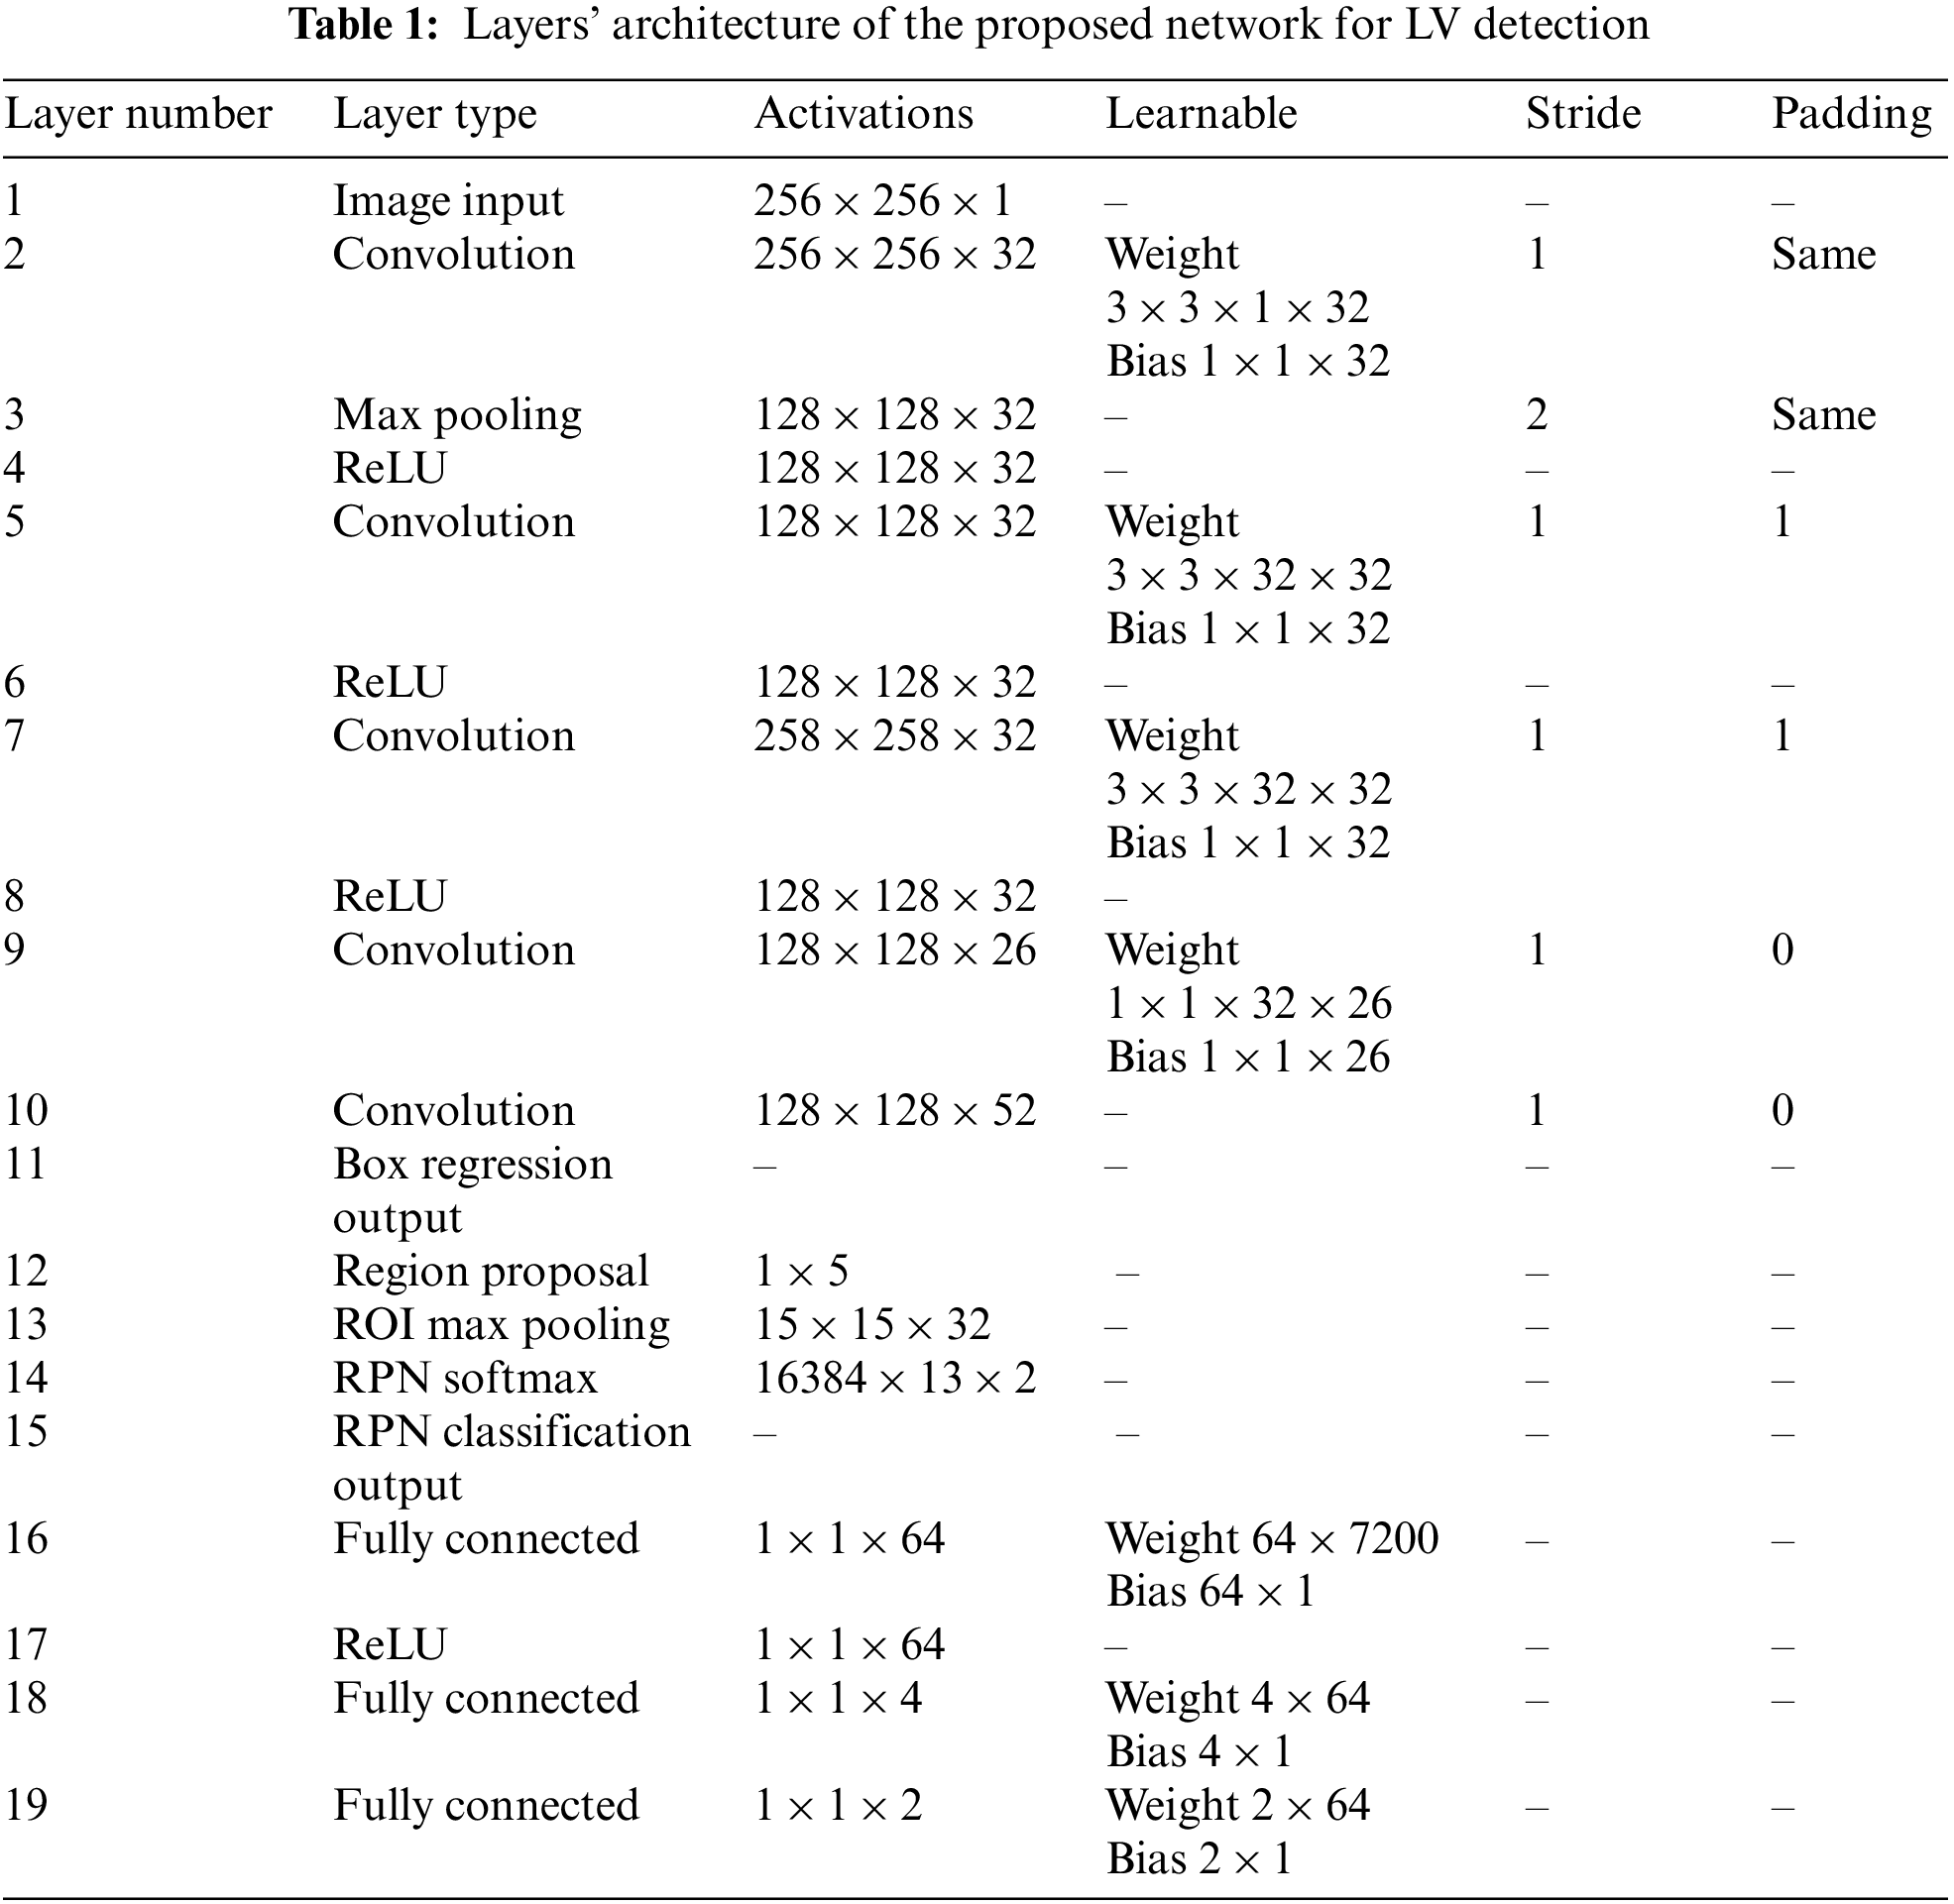
The proposed general architecture for the detection of LV in cardiac short-axis MRI images is shown in Fig. 4. The model has three main components: feature extraction layers, a region proposal network, and classification and regression layers. The feature extraction layers are composed of convolution layers, pooling layers, and rectified linear unit activation function (ReLU) layers, where filters are trained to extract relevant features in the images. The RPN is used in the convolution layers’ final feature map to determine the existence of the LV and anticipate its bounding box. The RPN-proposed regions are then fed into fully connected neural networks to predict LV class (classification) and bounding boxes (regression) in the last section. Tab. 1 describes the network’s architecture layers, including activation filters and learnable parameters.

Figure 4: Overall architecture of the proposed network for left ventricle detection
3.3 Layers of Region Proposal Network
The RPN consists of a convolution layer, an RPN softmax layer, an RPN classification layer, and an RPN box regression layer, which generates a region proposal of the LV based on the abjectness score of the input image. Compared to the selective search algorithm for generating region proposals in R-CNN and Fast R-CNN modules, the region proposals generated by the RPN network can be trained end-to-end to detect the LV with better and faster-detected regions. The RPN employs the neural network attention concept to direct the Fast R-CNN module to the location of the LV in the image. A sliding window traverses the features map to generate a candidate region proposal; each proposal is parametrized according to a reference box known as an anchor box, typically centered at a sliding window with dimensions of 256-d. The number of anchors (K) is based on two main image parameters: scale (size) and aspect ratios (width (W)/height (H)), and the total number of anchors in the image are W × H × K. As shown in Fig. 5, the network is reiterated by feeding two fully connected layers for bounding box regression and classification, respectively, which determine whether the detected region is LV or background. Therefore, the estimation of anchor boxes from training data impacts the detector’s accuracy and efficiency.

Figure 5: Working principle of RPN
3.4 Network Training and Processing Hardware
The network was trained using SGDM as an optimization algorithm with 4 mini-batch sizes, 10 epochs, and a 0.001 learning rate. The overlap ranges for the trained detector are set in three ranges, as explained in Eq. (1). The loss function to train the RPN algorithm is defined in Eq. (2).
where i represents the index of anchor, p represents the probability of being an object or not,
The accuracy, precision, recall, and boundary F1 score were used to evaluate the proposed network’s performance of the LV detection, as shown in the following equations:
where
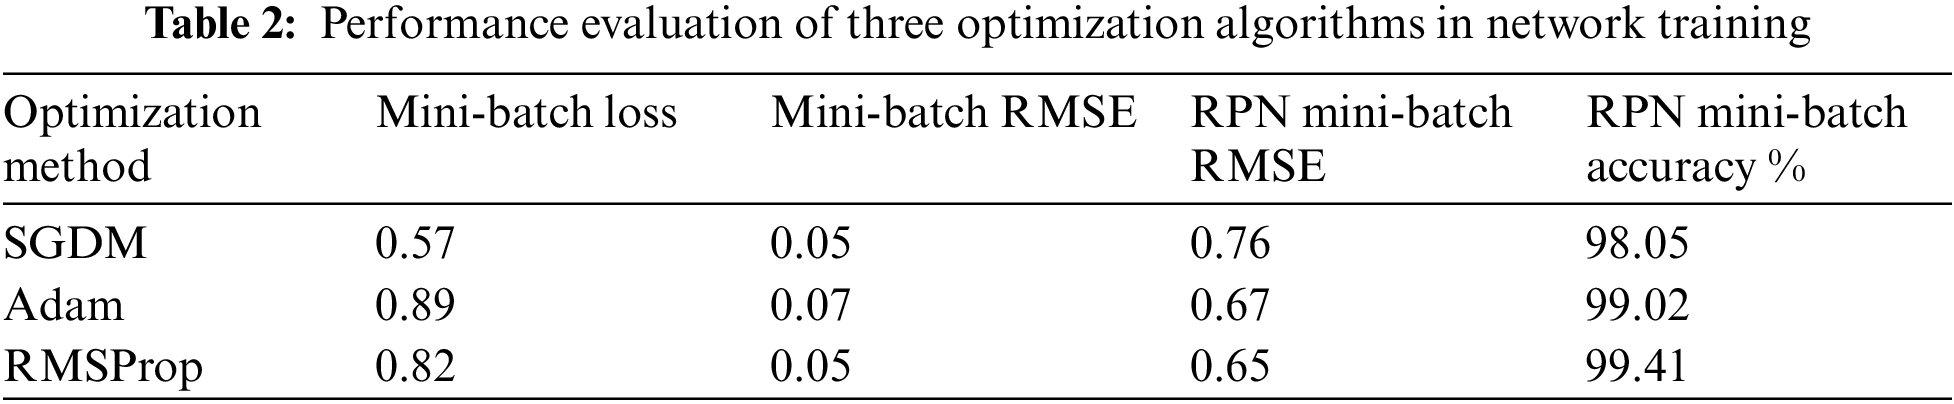
The proposed network was trained on labelled short-axis MRI images to detect the LV area. Three optimization algorithms were used to compare the performance of the trained networks, as shown in Tab. 2. The RPN accuracy for SGDM is lower compared to the other two solvers. However, it gained the highest accuracy during the testing phase. The RPN accuracies in the testing phase were 98.05%, 99.02% and 99.41% for SGDM, Adam, and RMSProp, respectively. In terms of mini-batch loss, SGDM achieved a value of 0.57, which is the lowest among all. The values of mini-batch RMSE for both SGDM and RMSProp were 0.05 and 0.07 for Adam; and RPN mini-batch RMSE values were 0.76, 0.67, and 0.65 for SGDM, Adam, and RMSProp, respectively. Thus, SGDM approach was selected as the optimization algorithm with a 0.001 learning rate and four training batches. The candidate box IOU of the RPN was settled as positive when
Based on the selected hyper-parameters in the training option, the training performance of the proposed network was efficient. Fig. 6 shows the training performance of the network; the training accuracy started with high values because the model was re-trained utilizing transfer learning to detect LV area. The training loss curve for regression and classification parts is also shown there. It can be observed that the loss values reduce steadily as the number of iterations increases, indicating that the network eventually adapts to the region proposal transformation with a superior performance of candidate anchors in classification and regression. For anchor boxes estimation, visualization of the labelled box is an initial step for understanding the range of LV sizes in the datasets based on box area and aspect ratio, such as width and height, as shown in Fig. 7 (left). Because the LV area is variable in size, manually selecting anchor boxes is time-consuming. Therefore, clustering algorithms that can group similar boxes based on meaningful metrics are required. The outcomes of anchor box estimation based on intersection over union (IoU) are depicted in Fig. 7 (right). The mean IoU is 0.95, which is greater than 0.5, ensuring that the overlap between anchor and boxes in training data is good. Although an increasing number of anchors can enhance the mean IoU, applying more anchors for object detection causes overfitting and increases the computational cost. As a result, four anchors were selected and used in the network training with satisfactory speed and accuracy.
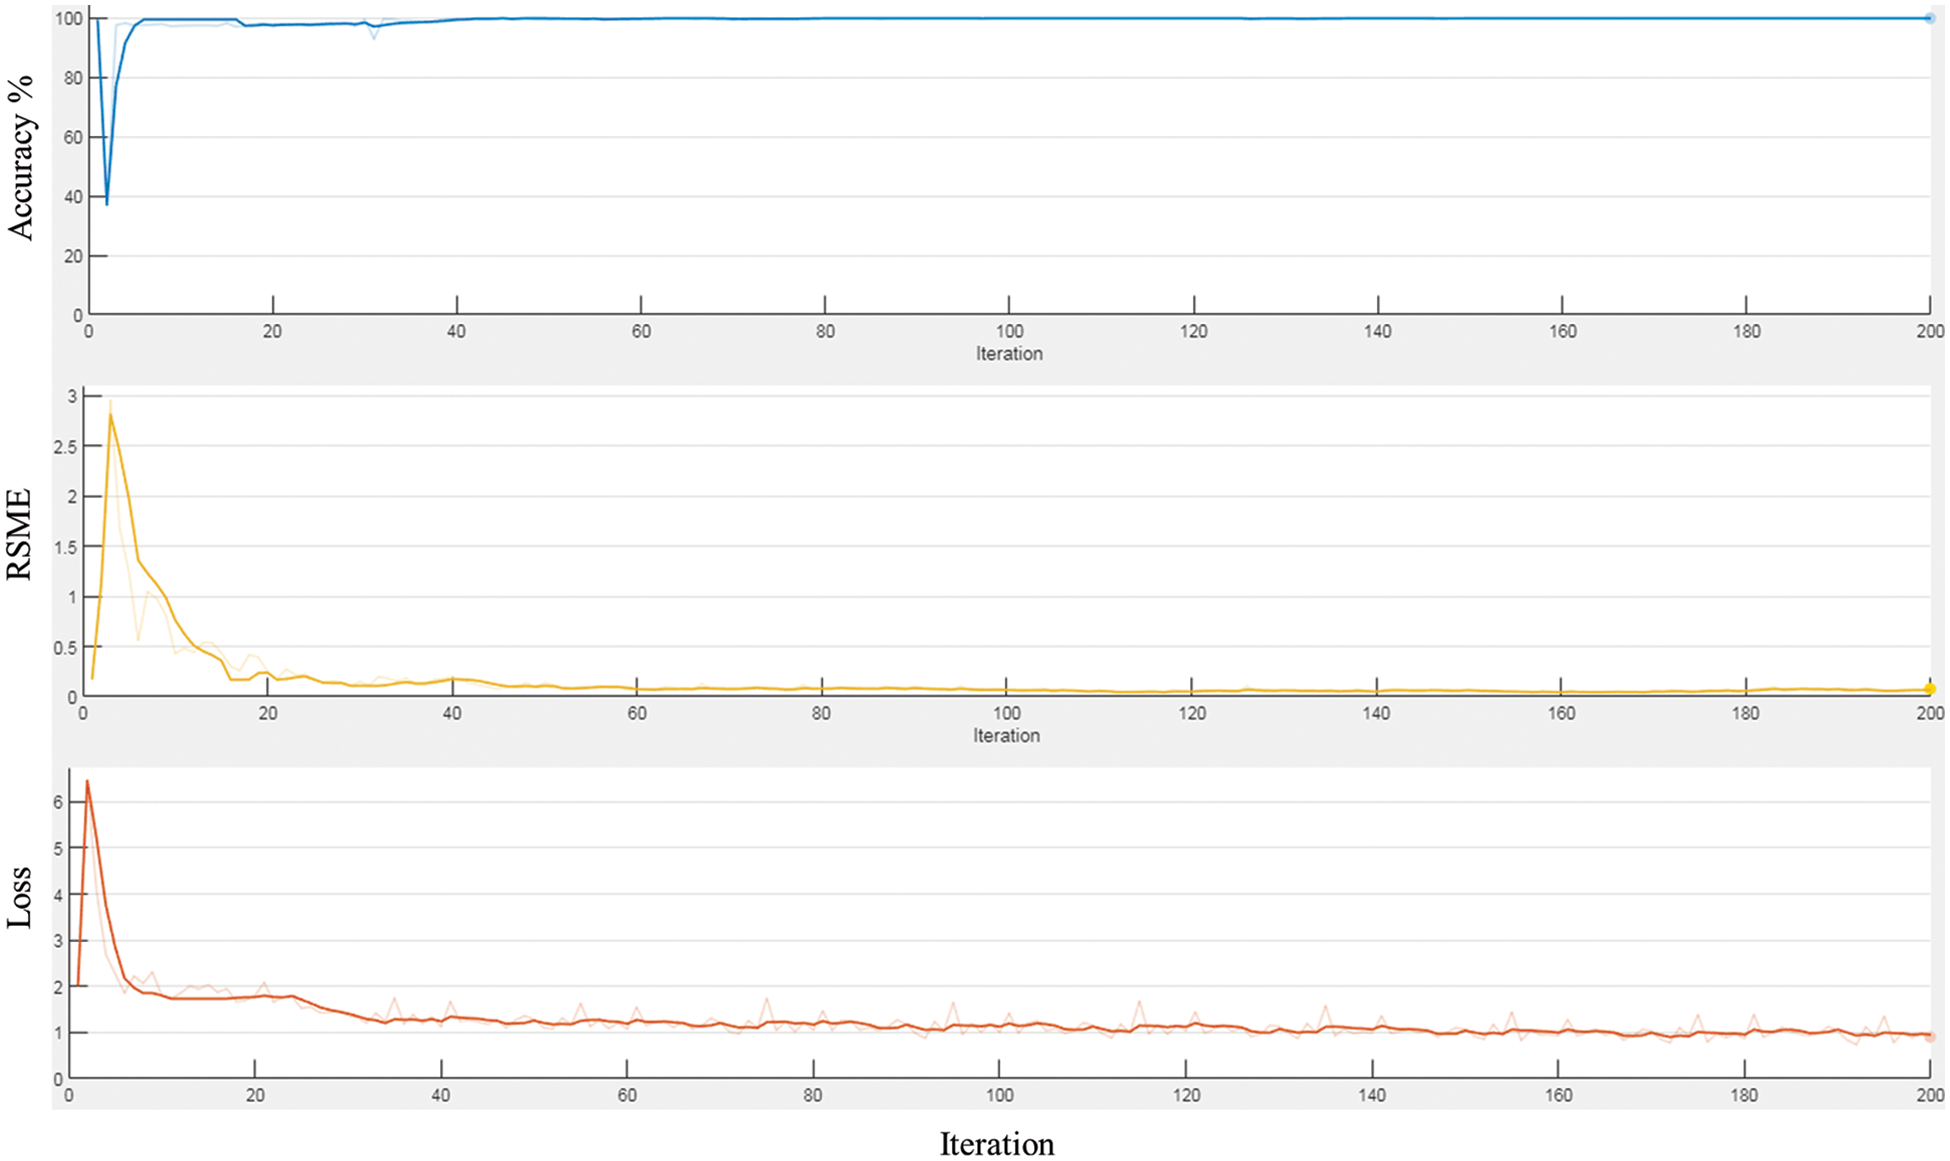
Figure 6: The training performance the proposed network
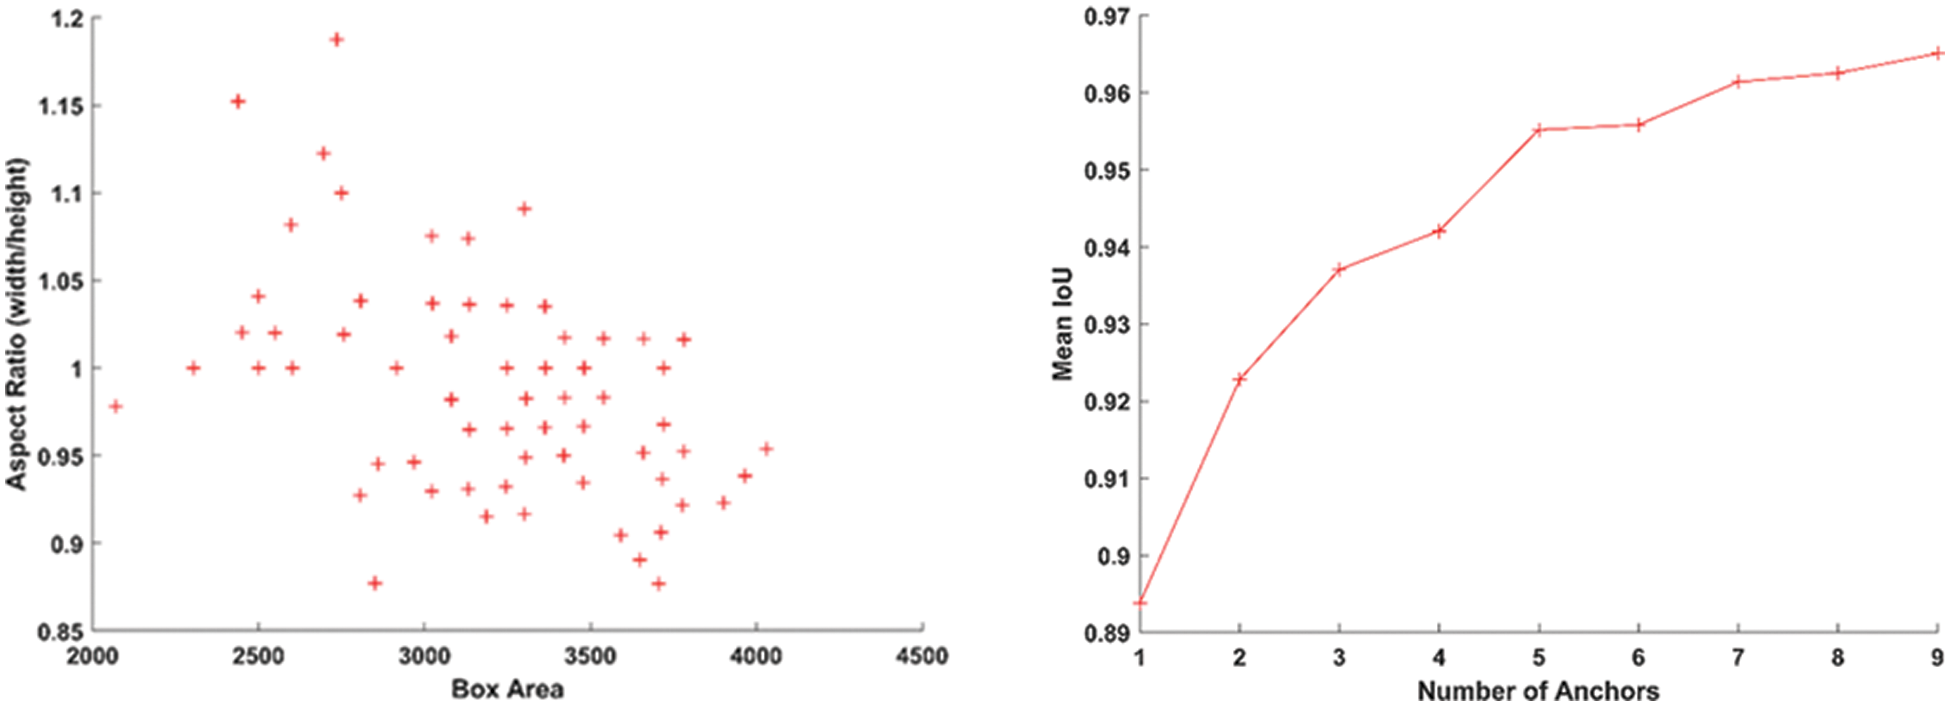
Figure 7: The plot for group of objects that have same size and shape in MRI image (left), and anchor boxes estimation (right)
In order to investigate the efficacy of the proposed model on various subjects, ten distinct subjects from the testing dataset were applied during the testing phase. The test results were evaluated using the overlap ratio index, which achieved efficient detection of the LV from cardiac MRI images using the labelled images as a reference, as in Eq. (7).
In terms of LV detection, the proposed network outperforms the R-CNN network. Tab. 3 shows the performance evaluation for the proposed model utilizing a cardiac cycle of 20 slices at end-diastolic and end-end systolic phases. Fig. 8 depicts the proposed network’s visual detection results, with yellow rectangles representing ground truth (labels) and red rectangles representing outcomes of the proposed detection model. The greater the overlapping, the better the network performs. The results reveal that the suggested technique can recognize the LV area and myocardium with high accuracy thanks to the Faster R-CNN that combines candidate region proposals, classification, and regression algorithms.
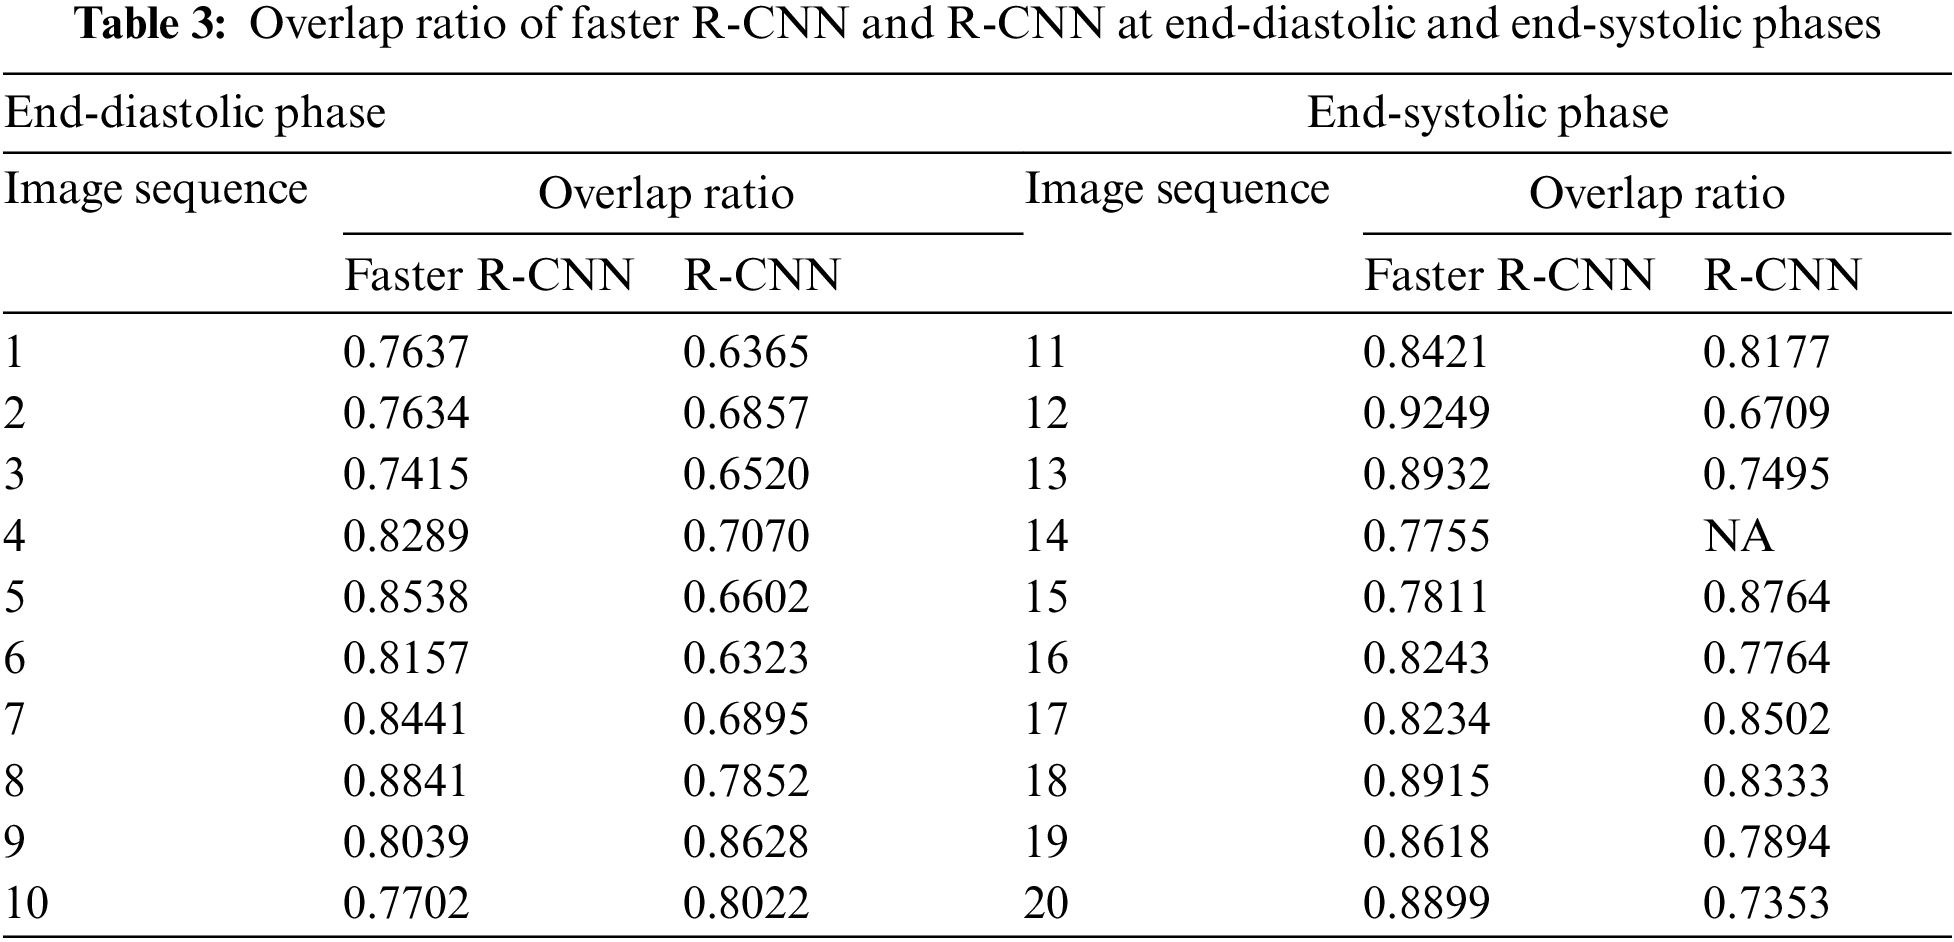
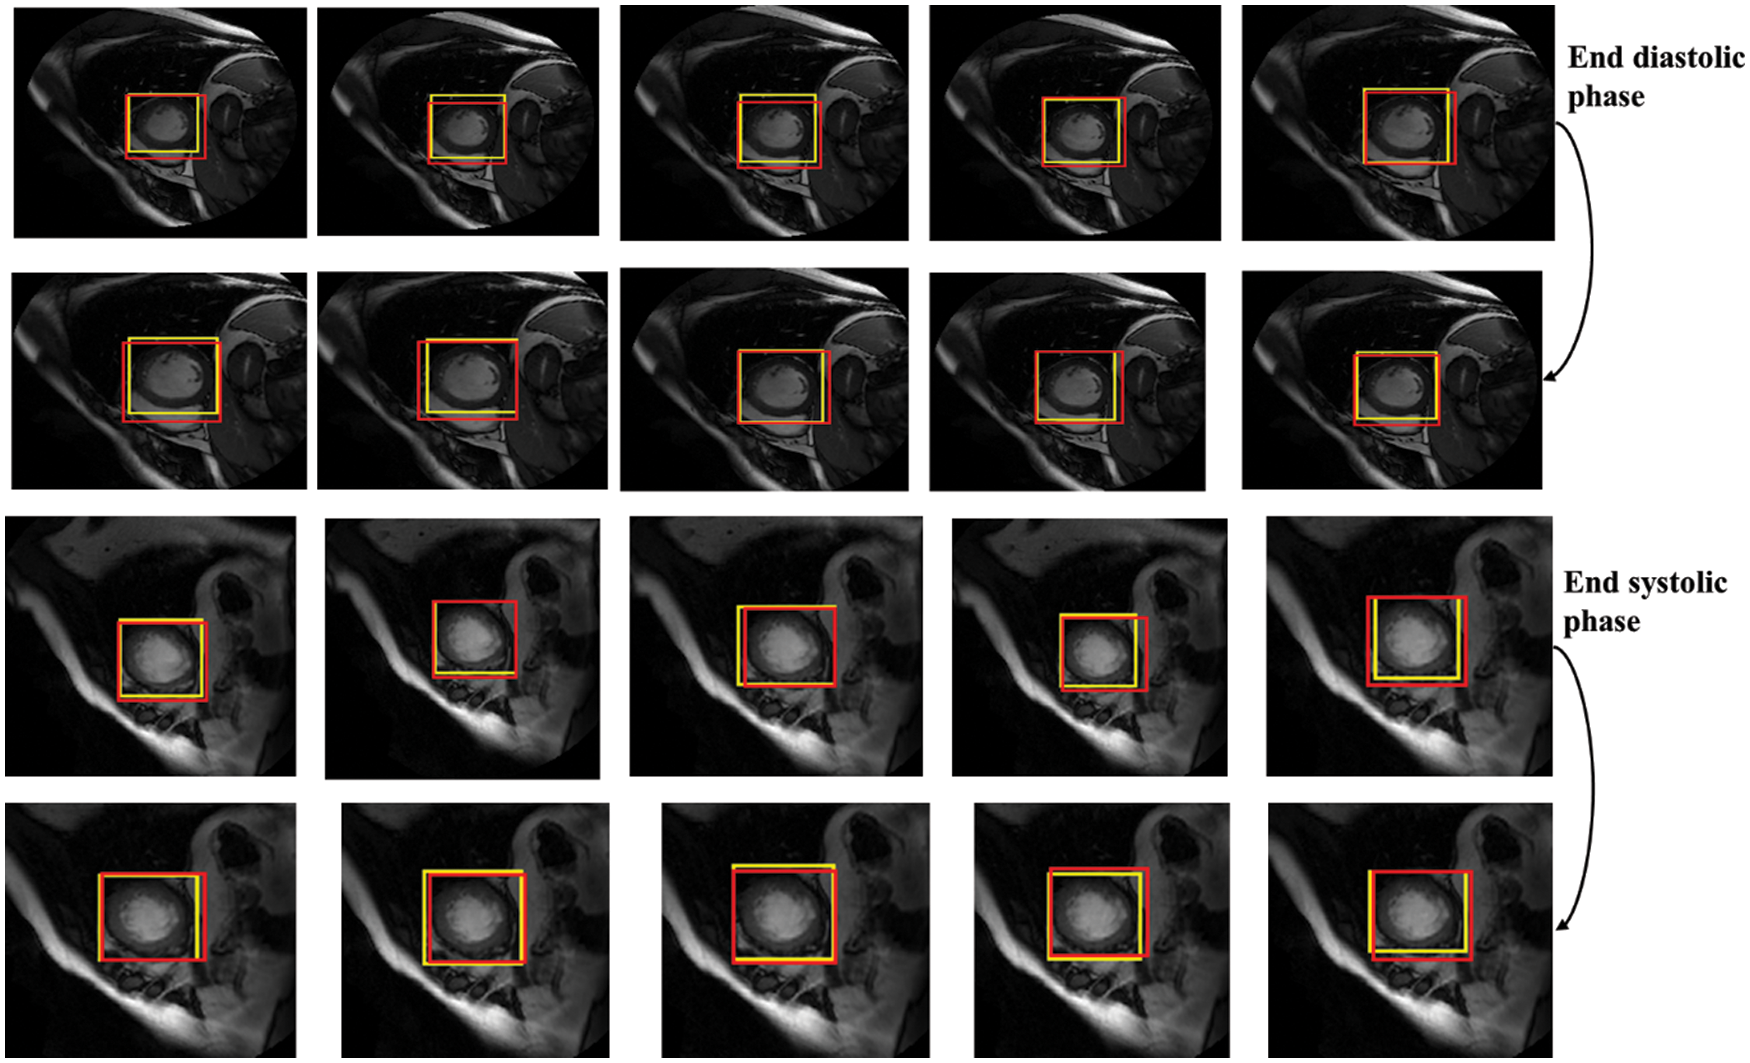
Figure 8: Detection results of the proposed network in different slices, the yellow rectangles represent ground truth (labels) and red ones represent results of the proposed detection model
The results of the proposed network achieved efficient LV detection with accurate detection at various shapes and sizes of the LV during end-diastolic and end-systolic phases. The detection method has an adaptability to different individuals. Hence, it can achieve a more efficient performance utilizing RPN than R-CNN. Based on the detection of LV using the proposed network, the LV region can be cropped for segmentation and classification with less computational cost and time.
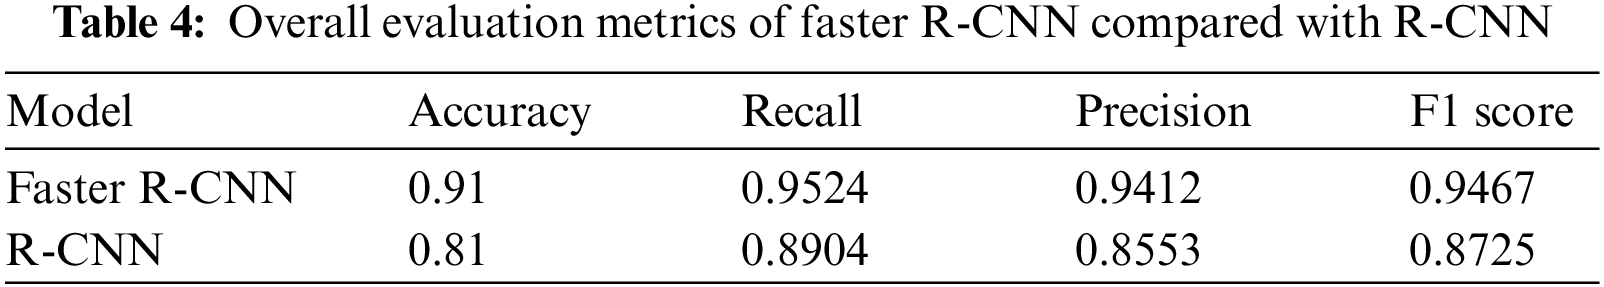
Based on the evaluation of metrics including accuracy, precision, recall, and F1 score, this method significantly improved over the conventional R-CNN. The main reason is that the applied RPN generates anchors that can discriminate the LV area in MRI images and significantly produces candidate boxes around the LV during the training and testing phases. These surrounding candidate boxes are suppressed to some extent to avoid false detection of LV due to the availability of similar regions to the LV in MRI images. In the Sunnybrook dataset, the detection model generates a robust detection method for cardiac short-axis MRI images. Fig. 9 depicts the proposed network’s performance for ten subjects. Accuracy, recall, precision, and F1-score range from 0.80 to 0.95, 0.89 to 1, 0.84 to 1, and 0.88 to 0.97, respectively. Tab. 4 compares the network’s overall performance to traditional R-CNN performance using the same dataset. Since it generates anchors to the entire feature map of the images, the proposed Faster R-CNN has effective performance while simultaneously avoiding false detection. The adaptive anchors can be adapted to LV areas of varying scales, increasing the relevancy of candidate anchors surrounding the LV and improving the network’s capacity to distinguish tough negative samples.
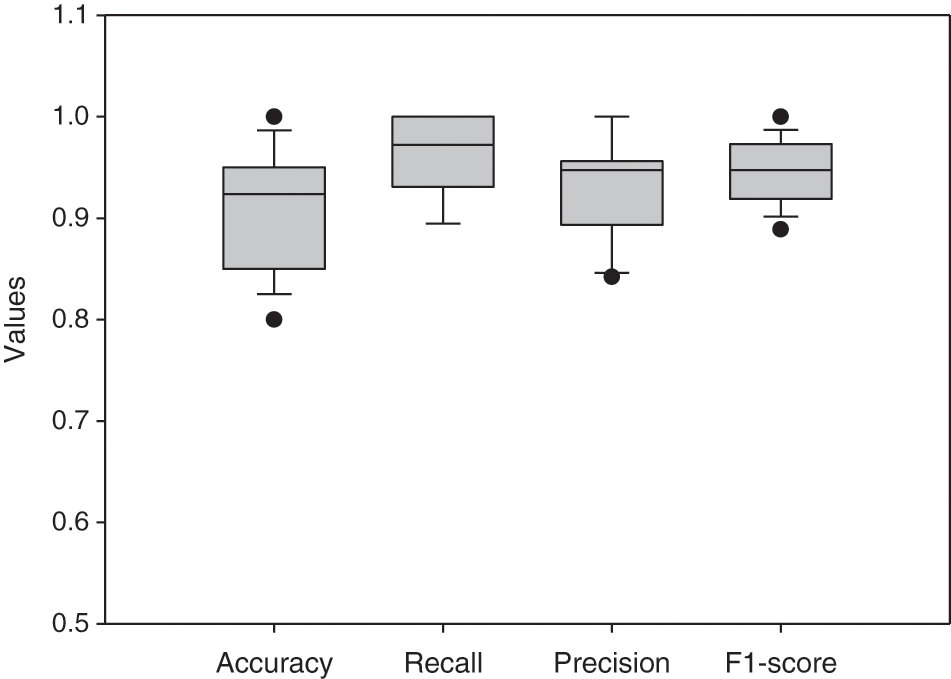
Figure 9: Boxplot for the network’s evaluation metrics of 10 different subjects
The application of LV detection using Faster R-CNN can be used before classification and segmentation of the LV by only localizing and cropping the LV region. This detection decreases the size of input images with less complexity, resulting in less required computational cost and faster time. Fig. 10 shows the original image, contour and mesh surface plots for an output image by Faster RCNN, representing the LV area in a red rectangle. It is clearly shown that the extracted images have simpler structures than original images.

Figure 10: Visualization of detected LV area by the proposed model, red rectangle represents LV region and orange one represents right ventricle region
Compared to R-CNN, the proposed model provides significant detection in most MRI images in the Sunnybrook data set, with a practical ability to avoid false detection and missed detection of the LV region. However, due to some factors, such as inhomogeneity in LV and unavoidable problems (intensities of cardiac MRI images, low-resolution images, noisy images, and redundant images), it is inevitable that false rate detection will still occur, as shown in Fig. 11.
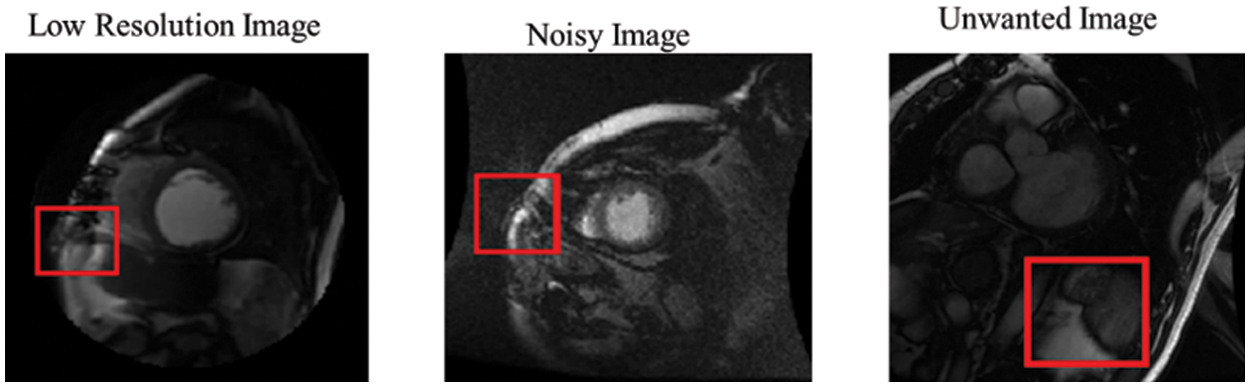
Figure 11: False detection results of the proposed network
4.1 Comparison with Recent Methods
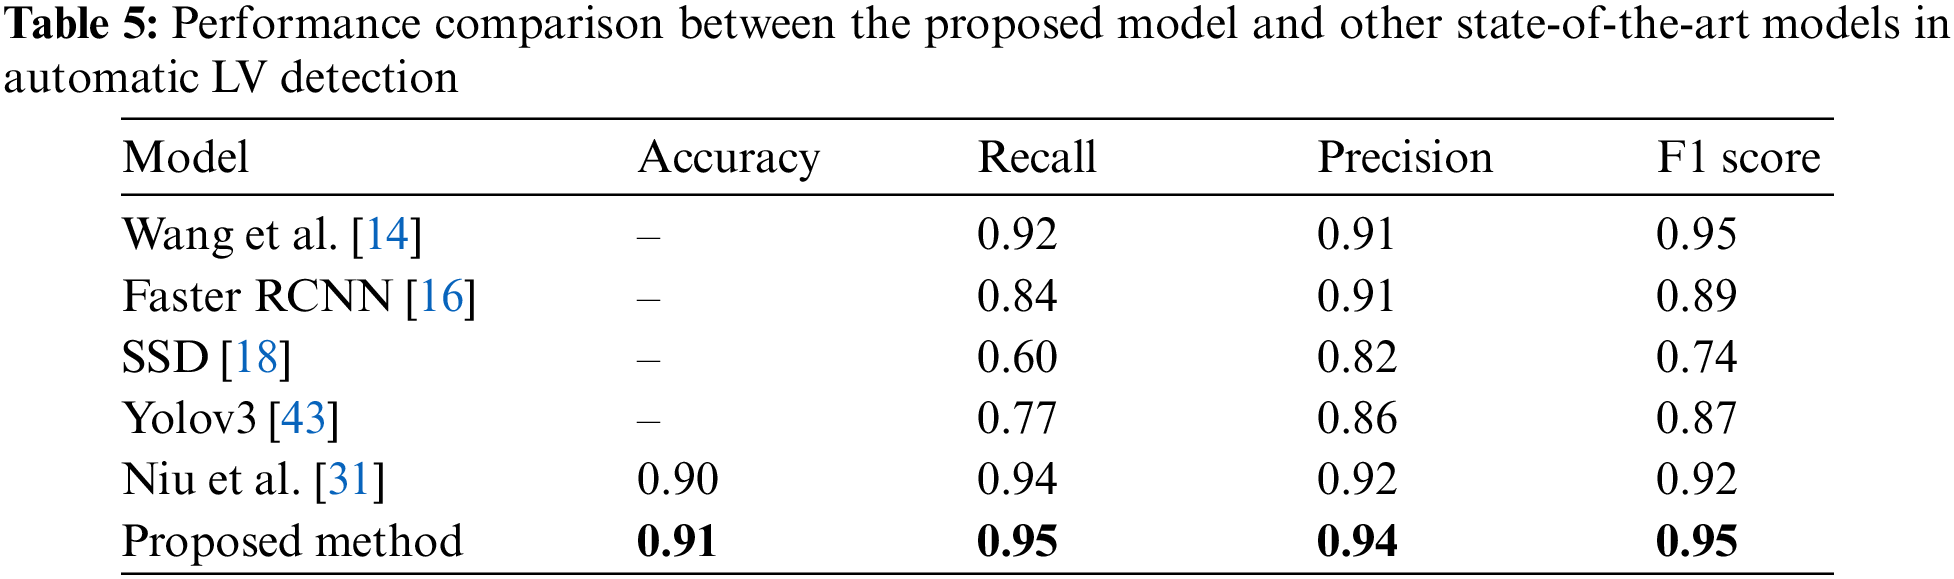
The performance investigation of the proposed network was based on a comparison with various recent methods. Tab. 5 summarizes the models’ performance evaluations. Wang et al. [14] proposed a CNN model for LV detection by combining discriminative dictionary learning and sequence tracking. They compared their proposed model with Faster R-CNN [16], SSD [18], and Yolov3 [43] to investigate the model’s performance. Niu et al. [31] developed a hybrid model to detect myocardium from cardiac MRI images by merging region proposal with deep feature classification and regression. Then, an SSAE was adopted to represent the regions by learning a discriminative feature. Based on these comparisons, the proposed model for LV detection outperformed other models with values of 0.91, 0.95, 0.94, and 0.95 for accuracy, recall, precision, and F1 score, respectively.
The left ventricle detection from cardiac MRI images is an essential prior step for image segmentation and registration in cardiac disease diagnosis. This study proposed an efficient CNN network for LV detection utilizing Faster-RCNN with a region proposal network. The network was trained using short-axis MRI images with the corresponding bounding boxes around the LV area. Adaptive anchors in a region proposal network locate the LV during the testing phase; the anchors can identify the candidate region based on scale and aspect ratio. This new approach outperformed the former in all evaluation metrics compared to traditional R-CNN. The model can effectively learn from annotated volumetric images (ground-truth) without requiring much training data. The experimental findings demonstrated the proposed network’s efficacy in various evaluation criteria such as accuracy, recall, precision, and boundary F1 score. Extending the network for three-dimensional detection of LV from cardiac MRI images is suggested for future investigation.
Funding Statement: This research was supported by the Ministry of Higher Education (MOHE) through the Fundamental Research Grant Scheme (FRGS) (FRGS/1/2020/TK0/UTHM/02/16) and the Universiti Tun Hussein Onn Malaysia (UTHM) through an FRGS Research Grant (Vot K304).
Conflicts of Interest: The authors declare that they have no conflicts of interest to report regarding the present study.
References
1. Q. Zheng, H. Delingette and N. Ayache, “Explainable cardiac pathology classification on cine MRI with motion characterization by semi-supervised learning of apparent flow,” Medical Image Analysis, vol. 56, pp. 80–95, 2019. [Google Scholar]
2. N. Zhang, G. Yang, Z. Gao, C. Xu, Y. Zhang et al., “Deep learning for diagnosis of chronic myocardial infarction on nonenhanced cardiac cine MRI,” Radiology, vol. 291, no. 3, pp. 606–607, 2019. [Google Scholar]
3. M. Chen, L. Fang, Q. Zhuang and H. Liu, “Deep learning assessment of myocardial infarction from mr image sequences,” IEEE Access, vol. 7, pp. 5438–5446, 2019. [Google Scholar]
4. L. K. Tan, Y. M. Liew, E. Lim and R. A. McLaughlin, “Convolutional neural network regression for short-axis left ventricle segmentation in cardiac cine MR sequences,” Medical Image Analysis, vol. 39, pp. 78–86, 2017. [Google Scholar]
5. Y. Lan and R. Jin, “Automatic segmentation of the left ventricle from cardiac MRI using deep learning and double snake model,” IEEE Access, vol. 7, pp. 128641–128650, 2019. [Google Scholar]
6. Y. Guo, L. Bi, Z. Zhu, D. D. Feng, R. Zhang et al., “Automatic left ventricular cavity segmentation via deep spatial sequential network in 4D computed tomography,” Computerized Medical Imaging and Graphics, vol. 91, pp. 101952, 2021. [Google Scholar]
7. Z. F. Shaaf, M. M. A. Jamil, R. Ambar, A. A. Alattab, A. A. Yahya et al., “Automatic left ventricle segmentation from short-axis cardiac MRI images based on fully convolutional neural network,” Diagnostics, vol. 12, no. 2, pp. 414, 2022. [Google Scholar]
8. Z. Wang, “Automatic localization and segmentation of the ventricles in magnetic resonance images,” IEEE Transactions on Circuits and Systems for Video Technology, vol. 8215, no. c, pp. 1, 2020. [Google Scholar]
9. L. Zhong, J. M. Zhang, X. Zhao, R. S. Tan and M. Wan, “Automatic localization of the left ventricle from cardiac cine magnetic resonance imaging: A new spectrum-based computer-aided tool,” PLoS One, vol. 9, no. 4, pp. e92382, 2014. [Google Scholar]
10. L. K. Tan, Y. M. Liew, E. Lim, Y. F. Abdul Aziz, K. H. Chee et al., “Automatic localization of the left ventricular blood pool centroid in short axis cardiac cine MR images,” Medical & Biological Engineering & Computing, vol. 56, no. 6, pp. 1053–1062, 2018. [Google Scholar]
11. V. D. A. Kumar, C. Swarup, I. Murugan, A. Kumar, K. U. Singh et al., “Prediction of cardiovascular disease using machine learning technique-a modern approach,” Computers, Materials and Continua, vol. 71, no. 1, pp. 855–869, 2022. [Google Scholar]
12. S. Kermani, M. Ghelich Oghli, A. Mohammadzadeh and R. Kafieh, “NF-RCNN: Heart localization and right ventricle wall motion abnormality detection in cardiac MRI,” Physica Medica, vol. 70, pp. 65–74, 2020. [Google Scholar]
13. X. Wang, S. Zhai and Y. Niu, “Left ventricle landmark localization and identification in cardiac MRI by deep metric learning-assisted CNN regression,” Neurocomputing, vol. 399, pp. 153–170, 2020. [Google Scholar]
14. X. Wang, F. Wang and Y. Niu, “A convolutional neural network combining discriminative dictionary learning and sequence tracking for left ventricular detection,” Sensors, vol. 21, no. 11, pp. 3693, 2021. [Google Scholar]
15. R. Girshick, “Fast R-CNN,” in 2015 IEEE Int. Conf. on Computer Vision (ICCV), Santiago, Chile, pp. 1440–1448, 2015, https://doi.org/10.1109/ICCV.2015.169. [Google Scholar]
16. S. Ren, K. He, R. Girshick and J. Sun, “Faster R-CNN: Towards real-time object detection with region proposal networks,” IEEE Transactions on Pattern Analysis and Machine Intelligence, vol. 39, no. 6, pp. 1137–1149, 2017. [Google Scholar]
17. J. Redmon, S. Divvala, R. Girshick and A. Farhadi, “You only look once: Unified, real-time object detection,” in Proc. of the IEEE Computer Society Conf. on Computer Vision and Pattern Recognition, vol. 2016-Decem, Las Vegas, NV, USA, pp. 779–788, 2016. [Google Scholar]
18. W. Liu, D. Anguelov, D. Erhan, C. Szegedy, S. Reed et al., “SSD: Single shot multibox detector,” in Proceedings of the European Conference on Computer Vision (ECCV) 2016. Lecture Notes in Computer Science, Amsterdam, Netherlands, Springer, pp. 21–37, 2016. [Google Scholar]
19. J. Dai, Y. Li, K. He and J. Sun, “R-FCN: Object detection via region-based fully convolutional networks,” Advances in Neural Information Processing Systems, vol. 29, pp. 379–387, 2016. [Google Scholar]
20. J. Huang, V. Rathod, C. Sun, M. Zhu, A. Korattikara et al., “Speed/Accuracy trade-offs for modern convolutional object detectors,” in 2017 IEEE Conf. on Computer Vision and Pattern Recognition (CVPR), Honolulu, HI, USA, pp. 3296–3297, 2017, https://doi.org/10.1109/CVPR.2017.351. [Google Scholar]
21. Z. F. Shaaf, M. M. A. Jamil and R. Ambar, “Automatic localization of the left ventricle from short-axis MR images using circular hough transform,” in Proc. of the Third Int. Conf. on Trends in Computational and Cognitive Engineering. Lecture Notes in Networks and Systems (LNNS 348), Springer, Singapore, pp. 501–508, 2022. [Google Scholar]
22. R. Girshick, J. Donahue, T. Darrell and J. Malik, “Rich feature hierarchies for accurate object detection and semantic segmentation,” in 2014 IEEE Conf. on Computer Vision and Pattern Recognition, Columbus, OH, USA, pp. 580–587, 2014, https://doi.org/10.1109/CVPR.2014.81. [Google Scholar]
23. X. Zhou, V. Koltun and P. Krähenbühl, “Tracking objects as points,” in Proceedings of the European Conference on Computer Vision (ECCV) 2020. Lecture Notes in Computer Science, Glasgow, UK, Springer, pp. 474–490, 2020. [Google Scholar]
24. H. Law and J. Deng, “CornerNet: Detecting objects as paired keypoints,” in Proceedings of the European Conference on Computer Vision (ECCV) 2018, Lecture Notes in Computer Science, Munich, Germany, Springer, pp. 765–781, 2018. [Google Scholar]
25. F. Yang, Y. He, M. Hussain, H. Xie and P. Lei, “Convolutional neural network for the detection of end-diastole and end-systole frames in free-breathing cardiac magnetic resonance imaging,” Computational and Mathematical Methods in Medicine, vol. 2017, pp. 1–10, 2017. [Google Scholar]
26. M. R. Avendi, A. Kheradvar and H. Jafarkhani, “A combined deep-learning and deformable-model approach to fully automatic segmentation of the left ventricle in cardiac MRI,” Medical Image Analysis, vol. 30, pp. 108–119, 2016. [Google Scholar]
27. H. Abdeltawab, F. Khalifa, F. Taher, N. S. Alghamdi, M. Ghazal et al., “A deep learning-based approach for automatic segmentation and quantification of the left ventricle from cardiac cine MR images,” Computerized Medical Imaging and Graphics, vol. 81, pp. 101717, 2020. [Google Scholar]
28. Q. Tao, W. Yan, Y. Wang, E. H. M. Paiman, D. P. Shamonin et al., “Deep learning-based method for fully automatic quantification of left ventricle function from cine MR images: A multivendor, multicenter study,” Radiology, vol. 290, no. 1, pp. 81–88, 2019. [Google Scholar]
29. B. Kong, Y. Zhan, M. Shin, T. Denny and S. Zhang, “Recognizing end-diastole and end-systole frames via deep temporal regression network,” in International Conference on Medical Image Computing and Computer-Assisted Intervention, Athens, Greece, Springer, pp. 264–272, 2016. [Google Scholar]
30. A. Helwan and D. Uzun Ozsahin, “Sliding window based machine learning system for the left ventricle localization in MR cardiac images,” Applied Computational Intelligence and Soft Computing, vol. 2017, pp. 1–9, 2017. [Google Scholar]
31. Y. Niu, L. Qin and X. Wang, “Myocardium detection by deep SSAE feature and within-class neighborhood preserved support vector classifier and regressor,” Sensors (Switzerland), vol. 19, no. 8, pp. 1–24, 2019. [Google Scholar]
32. H. Hermessi, O. Mourali and E. Zagrouba, “Deep feature learning for soft tissue sarcoma classification in MR images via transfer learning,” Expert Systems with Applications, vol. 120, pp. 116–127, 2019. [Google Scholar]
33. X. Zhang, J. Zhou, W. Sun, and S. K. Jha, “A lightweight CNN based on transfer learning for COVID-19 diagnosis,” Computers, Materials and Continua, vol. 72, no. 1, pp. 1123–1137, 2022. [Google Scholar]
34. A. Krizhevsky, I. Sutskever and G. E. Hinton, “ImageNet classification with deep convolutional neural networks,” Advances in Neural Information Processing Systems, vol. 25, pp. 1097–1105, 2012. [Google Scholar]
35. K. He, X. Zhang, S. Ren and J. Sun, “Deep residual learning for image recognition,” in 2016 IEEE Conf. on Computer Vision and Pattern Recognition (CVPR), vol. 2016-Decem, Las Vegas, NV, USA, pp. 770–778, 2016. [Google Scholar]
36. H. Qassim, A. Verma and D. Feinzimer, “Compressed residual-VGG16 CNN model for big data places image recognition,” in 2018 IEEE 8th Annual Computing and Communication Workshop and Conf. (CCWC), Las Vegas, USA, pp. 169–175, 2018. [Google Scholar]
37. C. Szegedy, V. Vanhoucke, S. Ioffe, J. Shlens and Z. Wojna, “Rethinking the inception architecture for computer vision,” in Proc. of the IEEE Computer Society Conf. on Computer Vision and Pattern Recognition, Las Vegas, NV, USA, 2016, https://doi.org/10.1109/CVPR.2016.308. [Google Scholar]
38. G. Huang, Z. Liu, L. Van Der Maaten and K. Q. Weinberger, “Densely connected convolutional networks,” in Proc.-30th IEEE Conf. on Computer Vision and Pattern Recognition, CVPR 2017, vol. 2017-January, Honolulu, HI, USA, pp. 2261–2269, 2017. [Google Scholar]
39. C. Szegedy, W. Liu, Y. Jia, P. Sermanet, S. Reed et al., “Going deeper with convolutions,” in Proc. of the IEEE Computer Society Conf. on Computer Vision and Pattern Recognition, vol. 07–12-June, Boston, MA, USA, pp. 1–9, 2015, https://doi.org/10.1109/CVPR.2015.7298594. [Google Scholar]
40. P. Kora, C. P. Ooi, O. Faust, U. Raghavendra, A. Gudigar et al., “Transfer learning techniques for medical image analysis: A review,” Biocybernetics and Biomedical Engineering, vol. 42, no. 1, Elsevier B.V., pp. 79–107, 2022. [Google Scholar]
41. D. P. Kingma and J. L. Ba, “Adam: A method for stochastic optimization,” in 3rd Int. Conf. on Learning Representations, ICLR 2015-Conf. Track Proc., San Diego, CA, USA, 2015. [Google Scholar]
42. P. Radau, Y. Lu, K. Connelly, G. Paul, A. J. Dick et al., “Evaluation framework for algorithms segmenting short axis cardiac MRI.,” The MIDAS Journal. Cardiac MR Left Ventricle Segmentation Challenge, vol. 49, 2009, http://hdl.handle.net/10380/3070. [Google Scholar]
43. J. Redmon and A. Farhadi, “YOLO9000: Better, faster, stronger,” in 2017 IEEE Conf. on Computer Vision and Pattern Recognition (CVPR), Honolulu, HI, USA, pp. 6517–6525, 2017, https://doi.org/10.1109/CVPR.2017.690. [Google Scholar]
Cite This Article
 Copyright © 2023 The Author(s). Published by Tech Science Press.
This work is licensed under a Creative Commons Attribution 4.0 International License , which permits unrestricted use, distribution, and reproduction in any medium, provided the original work is properly cited.
 Downloads
 Citation Tools