
 Submit a Paper
 Propose a Special lssue
 Open Access
ARTICLE
Real-Time Multiple Guava Leaf Disease Detection from a Single Leaf Using Hybrid Deep Learning Technique
1 Department of CS&SE, Islamic International University, Islamabad, 44000, Pakistan
2 Department of IT Services, University of Okara, Okara, 56310, Pakistan
3 Department of CS, University of Okara, Okara, 56310, Pakistan
4 Department of Botany, University of Okara, Okara, 56310, Pakistan
5 Department of Computer, College of Science and Arts in Ar Rass, Qassim University, Ar Rass, Qassim, 52571, Saudi Arabia
* Corresponding Author: Tamim Alkhalifah. Email:
Computers, Materials & Continua 2023, 74(1), 1235-1257. https://doi.org/10.32604/cmc.2023.032005
Received 03 May 2022; Accepted 22 June 2022; Issue published 22 September 2022
 View Full Text
 Download PDF
Abstract
The guava plant has achieved viable significance in subtropics and tropics owing to its flexibility to climatic environments, soil conditions and higher human consumption. It is cultivated in vast areas of Asian and Non-Asian countries, including Pakistan. The guava plant is vulnerable to diseases, specifically the leaves and fruit, which result in massive crop and profitability losses. The existing plant leaf disease detection techniques can detect only one disease from a leaf. However, a single leaf may contain symptoms of multiple diseases. This study has proposed a hybrid deep learning-based framework for the real-time detection of multiple diseases from a single guava leaf in several steps. Firstly, Guava Infected Patches Modified MobileNetV2 and U-Net (GIP-MU-NET) has been proposed to segment the infected guava patches. The proposed model consists of modified MobileNetv2 as an encoder, and the U-Net model’s up-sampling layers are used as a decoder part. Secondly, the Guava Leaf Segmentation Model (GLSM) is proposed to segment the healthy and infected leaves. In the final step, the Guava Multiple Leaf Diseases Detection (GMLDD) model based on the YOLOv5 model detects various diseases from a guava leaf. Two self-collected datasets (the Guava Patches Dataset and the Guava Leaf Diseases Dataset) are used for training and validation. The proposed method detected the various defects, including five distinct classes, i.e., anthracnose, insect attack, nutrition deficiency, wilt, and healthy. On average, the GIP-MU-Net model achieved 92.41% accuracy, the GLSM gained 83.40% accuracy, whereas the proposed GMLDD technique achieved 73.3% precision, 73.1% recall, 71.0% mAP@0.5 and 50.3 mAP@0.5:0.95 scores for all the aforesaid classes.Keywords
Guava (Psidium guajava L.) has achieved commercial significance in subtropics and tropics due to its broad flexibility to wide climatic and soil conditions and high medicinal and nutritional values. Guava fruits and leaves both have remarkable minerals and nutrition [1]. It is widely cultivated in South Asian countries (India and Pakistan) and produced in Cuba, Hawaiian Island, and Brazil [2]. Pakistan has become the fifth-largest guava-producing country globally, with a total production of 2.3 million tons in 2019 [3]. Several by-products are also being prepared from raw guava besides its fresh consumption. However, the quality of the product is heavily affected by plant diseases affecting both the quality and quantity of the raw material, not only soaring the production cost but loss of quality also. According to the Food and Agricultural Organization (FAO) Report, in 2050, the world’s population will reach 9.1 billion, and for a stable food supply, global food production should be increased by 70% [4,5].
Various methods have been developed to diagnose plant diseases [6–9]. One of the primary and straightforward approaches is visual observation. However, this traditional plant disease analysis technique depends on the farmers’ experience, which is the most uncertain and unreliable. Compared with conventional plant disease diagnostics, the researchers have introduced a spectrometer to analyze the plant leaves as healthy and infected [6]. Another method is to identify the disease using molecular methods, i.e., the polymerase chain reaction [7] or real-time polymerase chain reaction [8]. However, such techniques are challenging, expensive, time-consuming and require a highly professional operation coupled with massive crop protection chemicals. Disease diagnosis and relevant pesticide choice decisions are frequently made in the field based on visual observations, resulting in wrong decisions [9]. Thus, the application of digital cameras and smartphones aided with an image-based automated framework is relatively more practical and convenient than the conventional system.
With the innovations of Computer Vision (CV), Machine Learning (ML) and Artificial Intelligence (AI), advancements have been accomplished in creating computerized models, enabling precise and timely detection of plant leaf diseases. Within a decade, ML and AI innovations have achieved a massive intrigue in the accessibility of several high-speed computing devices and processors that have improved the processing time, reliability and accuracy of the results/output obtained. For automation of plant disease detection, various strategies, including conventional machine learning methods like SVM (Support Vector Machine), KNN (K-nearest neighbour), random forest etc., are used. A significant variation prevails in the accuracies of the methods employed [1,10]. Research conducted by Song et al. [10] used the SVM-based multi-classifier to detect corn leaf diseases and achieved 89.6% detection accuracy. On the other hand, Abirami et al. [1] proposed KNN and SVM-based classifiers to detect guava leaf diseases. Five types of guava leaf diseases were observed by utilizing a sample of 125 images for both the classifiers achieving 92% and 97.2% identification accuracy with KNN and SVM, respectively. Though the proposed methods achieved multiple detections, identification accuracy is comparatively low, particularly for managing massive databases containing various imperative features.
In the last few years, Deep Learning (DL) has been primarily used in agriculture [11–13] to evolve, control, sustain and upgrade agricultural production. Deep learning helps illuminate a few complex tasks like pattern analysis, image classification, facial expression, medical disease classification, relation extraction, sentiment and natural language processing [14–18]. Ji et al. [19] proposed a CNN-based disease detection technique to detect the diseases of grape plants using the PlantVillage dataset. This method achieved a 99.17% validation and 98.57% test accuracy. Likewise, Jiang et al. [20] suggested a real-time deep learning-based technique relying on CNNs to classify the apple leaf diseases on the ALDD (Apple Leaf Disease Dataset). The proposed method achieved 78.80% mAP (mean Absolute Precision) and 23.13 FPS (frames per second) speed for five types of apple leaf diseases. Rehman et al. [21] proposed a CNN to detect the five types of apple leaf diseases. The proposed method achieved a 97.17% classification accuracy. Shah et al. [22] improved the results of the Residual Teacher/Student (ResTS) technique based on CNN to classify the 14 crop species using the PlantVillage dataset. The proposed method introduced residual connections and batch normalization in three components (Teacher, Decoder and Student). The proposed method achieved a 99.1% f1 score.
Dissimilarities in guava diseases prevail globally due to various factors such as the shape of the disease, symptoms, colour of leaves, varieties of guava and environmental factors. No study has proposed detecting and localizing multiple diseases on a single guava leaf image in the literature reported. Real-time guava disease detection is one step ahead and more challenging due to the possibility of multiple diseases on a single leaf. Although a guava leaf and fruit disease dataset has already been developed [23], it presents a single disease on a single leaf. So, considering this issue, we developed a real-time Guava Multiple Leaf Disease Detection (GMLDD) and Localization model using YOLOv5 on a self-created Guava Leaf Disease Dataset (GLDD) from the central Punjab region of Pakistan. The proposed method detected the infected patch from the videos of guava fields. Besides, infected and healthy leaves from the infected patches are segmented using a python script to form the datasets. Subsequently, annotations of the segmented leaves are ensured with the assistance of a plant pathologist to detect anthracnose, nutrient deficiency, wilt diseases, insect attack and healthy leaves. The contributions of the study are as follows:
1. A Guava Infected Patches Modified MobileNetV2 and U-Net (GIP-MU-NET) segmentation technique is developed to segment the infected guava patches. The proposed GIP-MU-NET model consists of modified MobileNetv2 as the encoder and up-sampling layers of U-Net as the decoder.
2. A novel Guava Leaf Segmentation Model (GLSM) is developed to segment the guava leaves from the healthy and infected patches.
3. A real-time Guava Multiple Leaf Disease Detection (GMLDD) model is developed based on YOLOv5 to detect and localize multiple diseases from a single guava leaf. To the best of our knowledge, this is the first-ever model employed to observe various diseases on a sole guava leaf image. The proposed method can precisely detect and localize multiple diseases, including anthracnose, nutrient deficiency, wilt diseases and insect attacks, from a single image.
4. A first-ever Guava Leaf Diseases Dataset (GLDD) is developed to detect the various diseases on a single leaf. The dataset consists of five classes: anthracnose, nutrient deficiency, wilt diseases, insect assault, and healthy.
The rest of the article is organized as the literature review in Section 2, the materials & methods in Section 3, the research results in Section 4, and Section 5 presents the conclusion and future work followed by the references.
Some work has been presented in the literature on guava leaf disease detection, but the methodology exercised focused only on detecting a single disease from a single leaf or fruit. Al Haque et al. [24] proposed a deep learning method based on CNN to witness the fruit canker, anthracnose and fruit rot. This research on guava fruit in Bangladesh achieved 95.61% accuracy; however, it did not detect the multiple diseases on a single leaf. Howlader et al. [25] proposed the first-ever deep CNN-based technique to classify guava leaf diseases with an accuracy of 98.74%, providing their dataset with four distinct classes rust, algal leaf spot, whitefly and healthy. Almadhor et al. [26] proposed an AI-Driven framework to detect the rust, canker, mummification and dot diseases on guava leaves and fruit based on high imagery resolution sensor DSLR camera. The dataset contains only 393 sample images. RGB (Red Green Blue), HSV (Hue Saturation Value) colour histogram and local binary pattern (LBP) texture features were extracted. Complex tree, fine KNN, bagged tree, boosted tree, and cubic SVM classifiers were used to catalogue the guava leaf and fruit diseases, where the bagged tree classifier achieved 99% accuracy. Perumal et al. [27] proposed a single disease detection technique based on a support vector machine (SVM) to classify the healthy, bacterial blight and anthracnose diseases on a single guava leaf. The proposed method achieved 98.17% accuracy.
Leaf segmentation with a complex background was also a challenging and complicated task. Few researchers worked on different plant leaf segmentation, such as [28,29]. Gimenez-Gallego et al. [28] segment the multiple tree’s leaves like lemon, orange, almond, olive, loquat, fig, cherry and walnut trees from the natural background using the SVM and SegNet deep learning model. SVM achieved 83.11% accuracy, and SegNet gained 86.27% accuracy. Research conducted by Yang et al. [29] performed segmentation of 15 species using Mask R-CNN deep learning model with VGG16. They used a dataset of 2500 images and achieved 91.5% accuracy.
You Only Learn One (YOLO) is a unique technique in deep learning to detect multiple objects and localize the object. Many types of research have been accomplished on disease detection and other classification using this technique, attaining good results. Kasper-Eulaers et al. [30] proposed a technique based on YOLOv5 to detect the real-time spot parking during winter using Rest Area Dataset. The proposed method achieved a reasonable confidence rate for the front cabin while facing the challenge of finding the rear of a vehicle, especially away from the camera. Wang et al. [31] suggested a modified YOLOv5 model, which detected the Morphological of FR I and FR II Radio Galaxies. They modified the varifocal loss, included a convolution kernel attention mechanism, and reduced the stride size. The proposed method achieved 82.3% mAP@0.5. Yao et al. [32] made a modified YOLOv5 model that detected the real-time four types of kiwi fruit defects. Kiwi fruit dataset was developed, and it achieved 94.7% mAP@0.5. Roy and Bhaduri [33] proposed a real-time deep learning model to detect the multiple diseases of apple leaf (scab and rust) on a single leaf using YOLOv4. The proposed method achieved 92.2% mAP, 95.9% f1 score and 56.9 frames per second (FPS). To accelerate the model, TensorRT is leveraged to optimize inference time. Wang et al. [34] presented a You Only Learn One Representation (YOLOR) model to identify the multiple objects using the publicly available COCO dataset. They believed their result showed excellent capability in catching the physical meaning of different tasks. The cooperative network could generate a united representation to concurrently aided tasks. Zhang et al. [35] presented a real-time method to detect the 2D objects from images by aggregating several popular one-stage object detectors to train the model using YOLOR. They achieved 75% accuracy on Waymo open dataset. Lu et al. [36] proposed an efficient semi-supervised learning structure and reliable virtual label generation strategy for object detection. They adopted an ensemble learning approach utilizing pre-trained YOLOR models for excellent pseudo-labels for self-training. Their model achieved 81.27% accuracy.
Different varieties of guava exist in other regions of the world. Therefore, variations in guava diseases prevail worldwide for several reasons, including the shape of the disease, symptoms, colour of leaves, varieties of guava and environmental factors. In literature, all research is done on a single disease on a single leaf, but the earlier works failed to detect the multiple diseases on a single leaf. Most of the crops or leaves were attacked with various diseases on a single leaf. As reported in the literature, real-time disease detection and localization is another problem [33]. To the best of our knowledge, no work has been reported on the detection of multiple diseases of guava on a single leaf. Also, no work has been done on guava disease spot localization. Guava leaf segmentation is another problem, and there is no single work exists for guava leaf segmentation. In literature, only a dataset of a single disease on a single leaf exists for the guava leaf. Still, the real-time dataset of guava for multiple leaf diseases is also unavailable. So, there is a need to develop a dataset which can detect the various guava diseases on a single leaf. Therefore, it is a dire need to create a technique which can detect the numerous diseases on a single leaf and segmentation of a guava leaf. The proposed work has been designed to resolve the above guava diseases and segmentation problems.
This research proposes a hybrid deep learning model for real-time guava multiple disease detection and localization from a single guava leaf. The proposed method consists of three parts. The first part detects the infected guava patches from the guava tree images using GIP-MU-NET. Secondly, the Guava Leaf Segmentation Model (GLSM) is proposed to segment the guava leaves from images. The final part detects the multiple diseases of a guava leaf using the GMLDD model. The flow chart of the proposed method is shown in Fig. 1.

Figure 1: Flowchart of the proposed hybrid deep learning model
The performance of deep learning models heavily depends on an appropriate and valid dataset. We developed two real-time datasets of guava, i.e., the Guava Patches Dataset and Guava Leaf Diseases Dataset from the Okara district in the Central Punjab region of Pakistan. The detailed description of datasets is as follows:
3.1.1 Guava Patches Dataset (GPD)
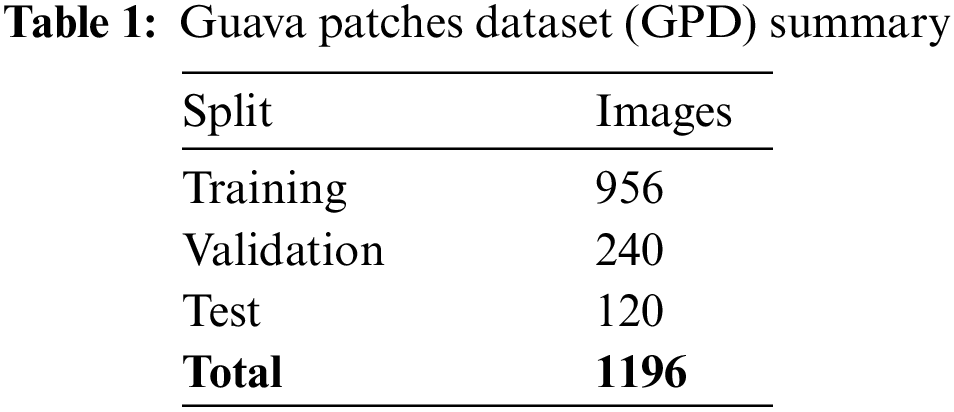
A real-time dataset was developed in the form of videos and pictures. Different capturing devices, including mobile phones, digital cameras, and drones, were used to ensure variations in the real-time dataset. The capturing distance for the mobile phone and digital cameras was 1 foot to 2 feet, whereas the drone’s capturing distance was 5 to 10 feet. Since drone fanning distorted the videos and images because of plant leaf movement, we maximized the plant and drone distance as much as possible. District Okara in the central Punjab region of Pakistan was selected for the present research work due to the increased guava cultivation. We focused on the varieties of guava from the district Okara, namely Choti Surahi, Bari Surahi, Gola, Golden and Sadabahar. The images and videos were captured under varying conditions, including morning, evening, noon, cloudy, sunny, rainy, and different seasons (summer, winter, spring and autumn), to monitor the environmental variations and their effect on disease incidence and intensity. The images were taken at different resolutions to incorporate the variations in the dataset quality. With the help of Python code, guava plant videos were converted into frames (images). Then, with the assistance of plant disease experts, patches of plant images were annotated into infected ones (Fig. 2), ensuring the dataset’s authenticity. LabelMe tool [37] was used to make the annotations, and the binary masks of the annotated images were generated with the help of python code. The Guava Patches Dataset (GPD) contained 500 images of healthy and infected patches exhibited in Tab. 1. The dataset can be accessed online [38].

Figure 2: (a) Infected patches images (b) Infected patches masks
3.1.2 Guava Leaf Diseases Dataset (GLDD)
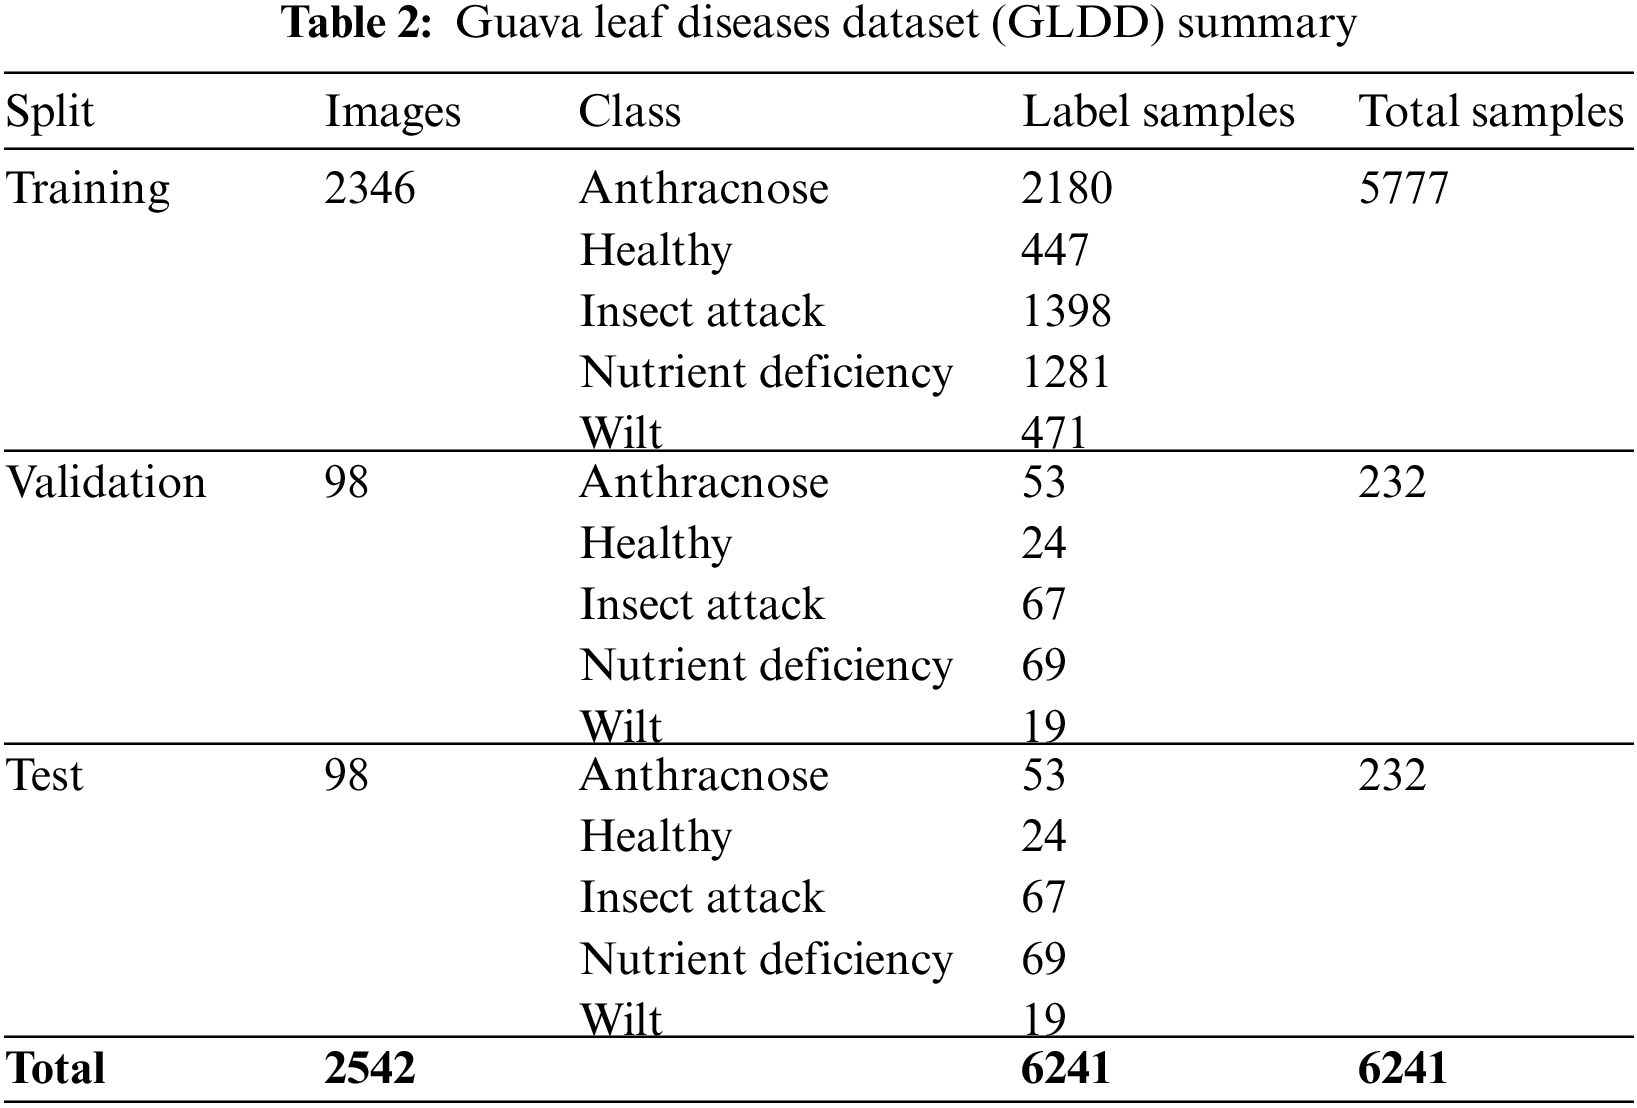
Using the Guava Patches Dataset, the guava leaf images were extracted using the proposed GLSM model. The leaves were annotated with the help of plant pathologists into five classes: nutrient deficiency, insect attack, anthracnose, wilt, and healthy, as depicted in Fig. 3. The five classes contain 2542 images with 6241 targets (labels/annotations) are shown in Tab. 2. The dataset can be accessed online [39]. After annotating the images of GPD and GLDD, the Roboflow [40] was employed to perform the auto-orient with EXIF-orientation stripping and resizing the image size into 416 × 416. Deep learning models needed massive training data, which helped avoid over-fitting. Therefore, enhanced the datasets with the help of data augmentation techniques applied using the Roboflow website. For this purpose, different data augmentation techniques were applied, such as horizontal flip with 50% probability, vertical flip with 50% probability, 90-degree rotation with equal chance (upside-down, clockwise and counter-clockwise), random rotation degree range −15 and + 15, random shear degree range −15 to + 15 vertically and −15 to + 15 horizontally and random brightness between −25% to + 25% available on the Roboflow website.

Figure 3: Examples of guava leaf multiple diseases. Images
3.2 Image Preprocessing (Data Division)
All datasets were split into the training, validation, and test sets used for the proposed model’s training, validation, and testing. An unseen dataset was used afterwards to ensure the model’s fitness. The GPD training set included 1196 images with the same number of masks (targets/labels) for the infected classes, as shown in Tab. 1. The training set of the GPD dataset consisted of 956 images and targets, and the validation set had 240 images with masks. Whereas, the test set included 120 images with the same number of masks.
The Guava Leaf Diseases Dataset was divided into training, validation and test sets having 2346, 98, 98 images, and 5777, 232, and 232 targets, respectively, as shown in Tab. 2. The training set of GLDD consisted of 2180, 447, 1398, 1281 and 473 labels for anthracnose, healthy, insect attack, nutrient deficiency and wilt class. The validation set included 53 targets for anthracnose, 24 for healthy, 67 for insect attack, 69 for nutrient deficiency and 19 annotations for wilt class. At the same time, the test set contained 53, 24, 67, 69 and 19 images for anthracnose, healthy, insect attack, nutrient deficiency and wilt class.
3.3.1 Guava Infected Patches Modified MobileNetV2 and U-Net (GIP-MU-Net) Segmentation Technique
The first step is to segment the infected guava patches. For this purpose, we developed a novel deep learning model called GIP-MU-Net. The proposed method implements an encoder-decoder U-Net [41] architecture. However, we replaced the encoder part with the modified MobileNetV2. The computational cost is further reduced by eliminating the block IDs 6, 9, 10, 13, and 16. The filters are also decreased from 160 to 128, 320 to 160, and 1280 to 256. As a decoder, the up-sampled component of U-Net is employed. MobileNetV2 [42] is a neural network designed for machines with low processing capability, such as mobile devices. The MobileNetV2 offers favourable results in terms of accuracy while needing less memory and processing cost. It also turns them into a high-speed network for image processing. MobileNetV2 is a lightweight convolutional neural network employed in synchronous functions for two reasons: first, it has fewer trainable parameters than classic convolution; second, it has fewer training parameters and lower computing costs. Fig. 4 depicts the GIP-MU-Net architecture with encoder-decoder components. MobileNetV2 is adjusted to extract features from the input dataset. For the segmentation task, these characteristics are supplied to GIP-MU-Net. This research uses the following hyperparameters: 416 × 416 image size, 8 batch size, 125 epochs, 1e-4 starting learning rate, binary cross-entropy loss function and Adam optimizer. The ReduceLROnPlateau function reduces the learning rate with a 0.1 factor. When the val_accuracy does not improve to 10 epochs, min_lr of 1e-6 is used. The best val_accuracy weight has been saved.

Figure 4: Architecture of the proposed GIP-MU-Net model
3.3.2 Guava Leaf Segmentation Model (GLSM)
This study aims to make the Guava Leaf Segmentation Model (GLSM) from a U-Net-like model to segment guava leaves from the images. The suggested GLSM model’s architecture is depicted in Fig. 5. The encoder section of this model accepts 416 × 416 × 3 dimensions as input, and the encoder part’s output is then passed on to the next part of the model. As a result, the encoder part’s output was processed by the decoder. The encoder comprises two components: the entry block and the residual block. In encoder Conv2D, batch normalization and ReLu activation functions are used. The residual block consists of ReLu, SepereableConv2D, and batch normalization. Three residual blocks are employed in the encoder. The structure of each residual block is the same. Sixteen filters are applied in the entry block. The first residual block has 32 filters, 64 filters in the second residual block, and 128 filters are included in the third residual block. In the next section, the decoder uses inverted residual blocks containing ReLu, Conv2Dtranspose, and batch normalization. All the inverted residual blocks are now concatenated. We use four inverted residual blocks in the decoder. In the decoder, filters are used in reverse order, such as 128, 64, 32, and 16 filters in the first, second, third, and fourth inverted residual block. This research uses the following hyperparameters: 416 × 416 image size, 4 batch size, 75 epochs, and 1e-4 learning rate. The proposed model is compiled using the binary_crossentropy loss function and Adam optimizer. The ReduceLROnPlateau function reduces the learning rate with a 0.1 factor. When the val_accuracy does not improve to 10 epochs, min_lr of 1e-6 is used. The examples of guava leaf images concerning respective masks are shown in Fig. 6.
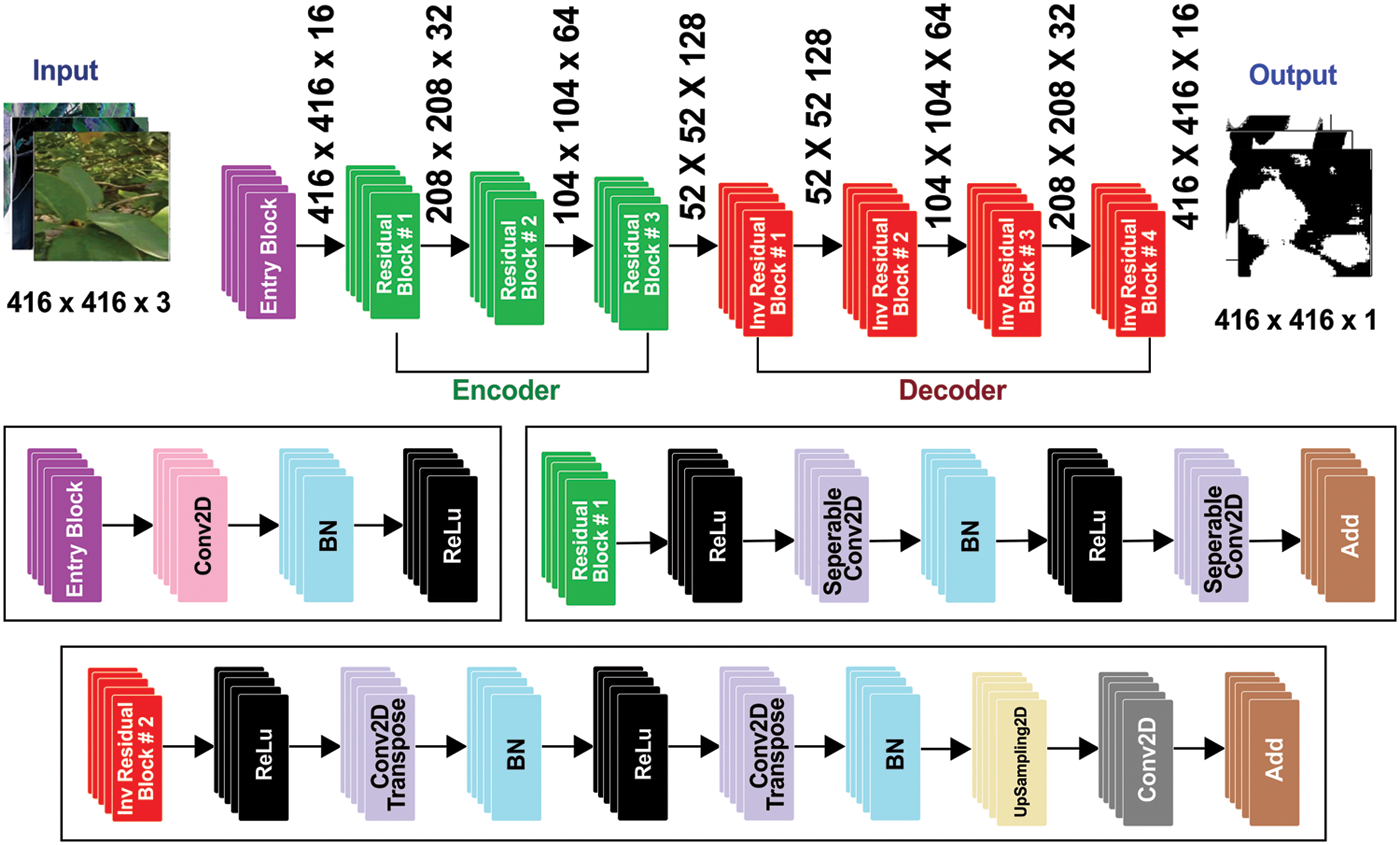
Figure 5: Architecture of the proposed GLSM model
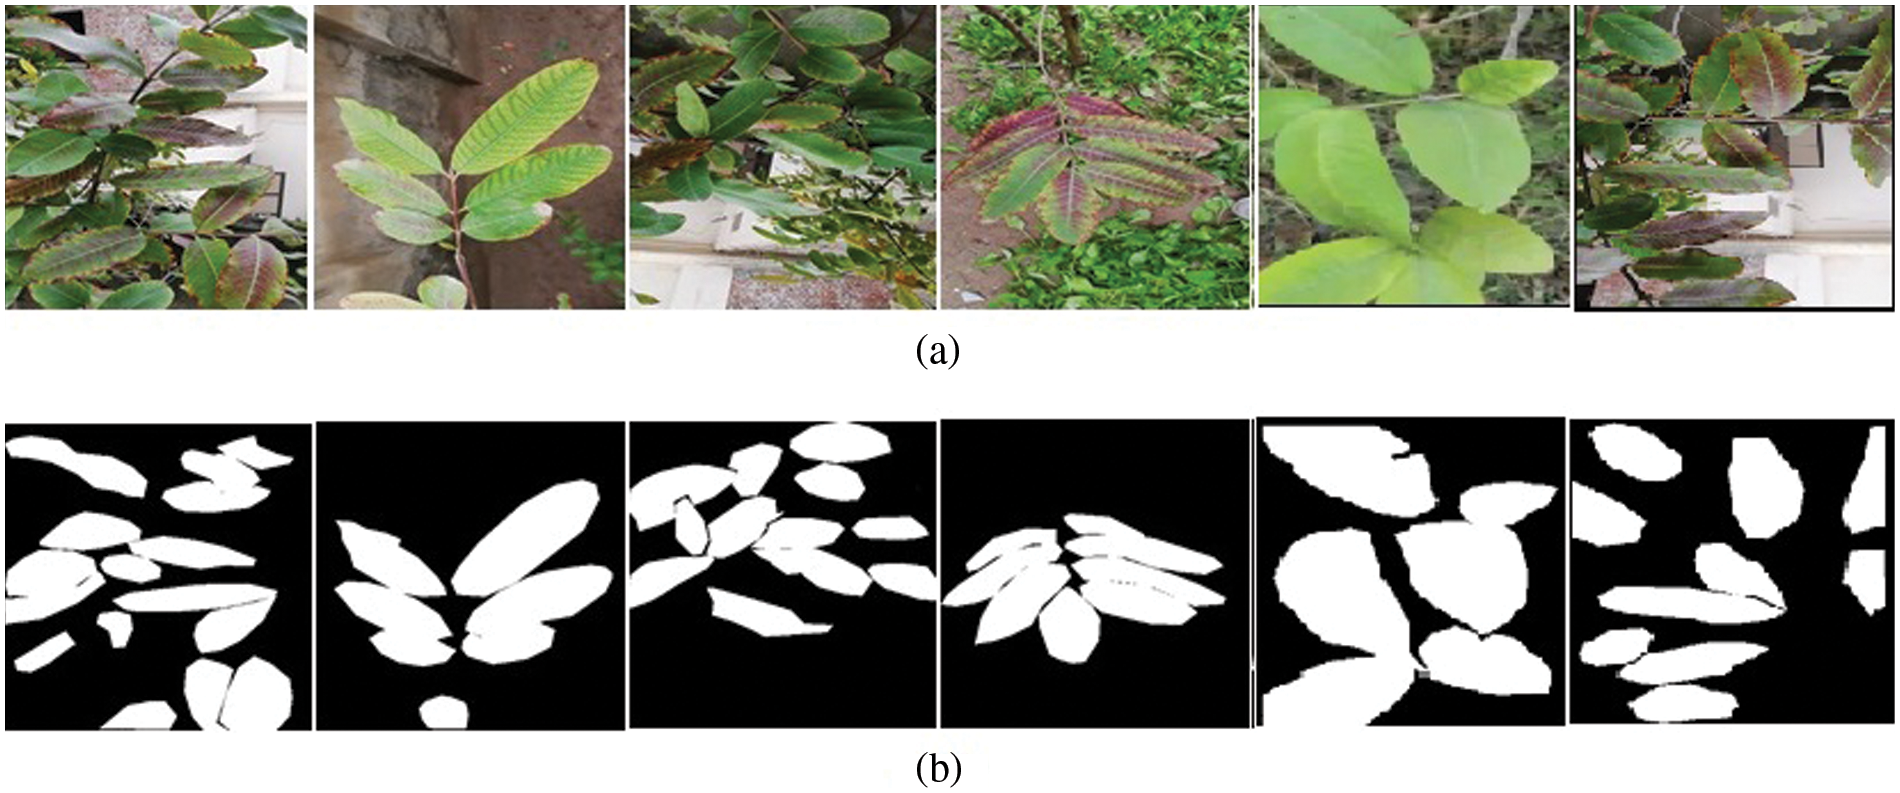
Figure 6: (a) Examples of guava leaf images and (b) Examples of guava leaves’ masks
3.3.3 Guava Multiple Leaf Disease Detection (GMLDD) Technique on a Single Leaf
The YOLO model [43] was used to detect objects with the help of deep neural networks. YOLO highlights the target class information and its position in the input image. It highlights the object with a small rectangle frame to obtain the positioning and class. YOLO had grown from version 1 to version 5. The YOLOv5 network provided the advantages of being fast, small in size and excellent accuracy over the previous four versions. In the area of object detection, Fast R-CNN [44], SSD [45], YOLO [43] and Faster R-CNN [46] all had appeared. The YOLO algorithm was related to the end-to-end detection approach. YOLO considered object detection as solving the regression problems with the help of a single end-to-end framework to accomplish the input from the actual picture to the output of the target position at the same time. YOLO’s detection capabilities could obtain real-time processing that was ideal for handling massive amounts of image data [47]. As a result, the YOLO technique could cope with the data volume problem; hence, it was used as a foundation for the method. YOLOv5 model structure is presented in Fig. 7, with every square representing a convolution module constructed by stacking numerous convolution networks. It splits the image into N × N grids, and the target’s centre is liable for this target. Every candidate box can predict five values, i.e., x, y, w, h and l. The target’s central point coordinates (such as the galaxy’s centre) were represented by x and y; the width and height of the box were w and h, and l (class) was the target class. The YOLOv5 model’s loss function had two parts to predict these five values simultaneously. One was classification loss, while the other was regression loss. The original YOLOv5’s classification loss was a focal loss, and the regression loss was Inter-section over Union (IOU) loss, as shown in Eq. (1).
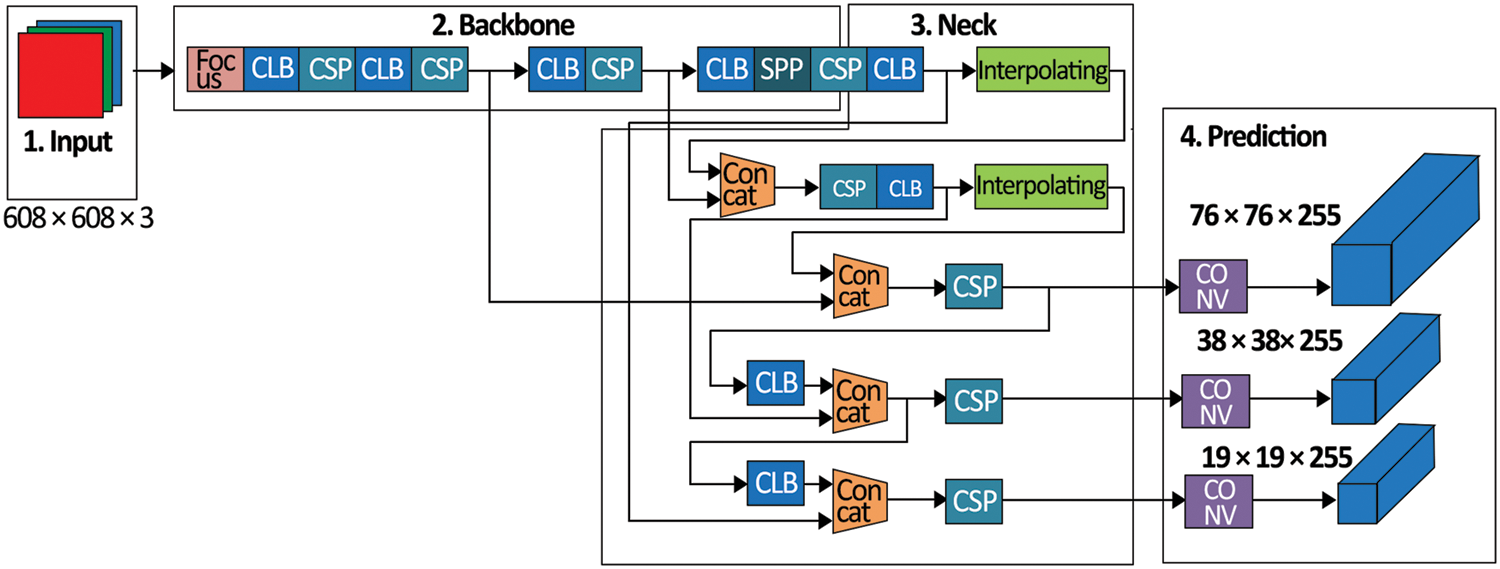
Figure 7: Architecture of the proposed GMLDD model
As previously stated, the YOLO method used fewer calculations; thus, it was faster and more accurate. Moreover, there were still certain limitations while detecting a small object like RGs. The varifocal loss was employed rather than a focal loss in the original YOLOv5 to improve the model. The proposed model obtained a significant capacity to locate and categorize galaxies upon training with the help of a dataset.
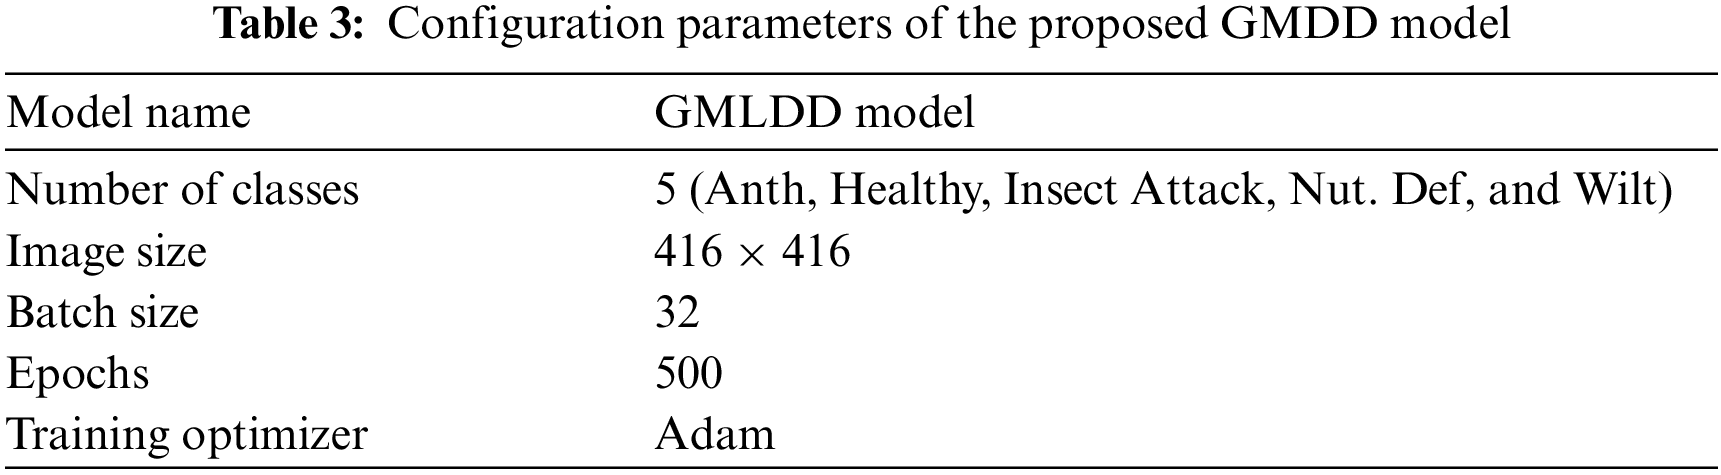
In the original YOLOv5 neural network model’s structure [46], every trapezoid or rectangle indicated a module enclosed by many neural networks with a single layer that was coupled. The Cross-Stage-Partial connections (CSPs) neural network modules used three (3) convolutions on the feature maps before processing it with four distinct scales of max pooling. The 1 × 1, 5 × 5, 9 × 9, and 13 × 13 pixels were the kernel sizes. It was utilized to capture the essential contextual characteristics. The primary purpose of convolutional neural networks (CNNs) was to extract the image information, which compromised convolution, pool operation and activation. The Adam optimizer is one of the extensively used optimizer. It has been adopted as a standard for deep learning studies and is suggested as the default optimization approach. Furthermore, the algorithm is simple to develop, has a shorter execution time, consumes less memory, and takes minimal tuning than any optimization technique [19]. Therefore, we used the Adam optimizer in this research. The configuration details of the proposed GMLDD method are represented in Tab. 3.
The proposed model was quantitatively evaluated using the following performance evaluation criteria: precision, recall, f1 score, and mean Average Precision (mAP).
where the number of correctly identified is indicated by true positive (TP), the number of misclassification diseases indicated by false positive (FP), and the number of missed diseases that should be detected but not detected is represented by false negative (FN).
One well-known metric which combines precision and recall, called the f1 score, is defined as:
The proposed model performance was evaluated using mAP to calculate the harmonic average of recall and accuracy.
where the number of guava diseases represented in C and N was represented by the number of IOU (Intersection over Union) thresholds, The IOU threshold represented k, precision indicated by P(k), and recall was represented by R(k).
The proposed models were trained and tested using freely available Google Colab with powerful GPUs without configuration requirements. The freely available LabelMe tool [37] was used to annotate the datasets. Roboflow [40] website was used to resize the images, data augmentation, and data splitting. The models were trained from scratch.
The experimental results focused on the following:
1. The performance of the proposed Guava Infected Patches Modified MobileNetV2 and U-Net (GIP-MU-NET) segmentation techniques was evaluated with the help of the Guava Patches Dataset (GPD).
2. Guava Leaf Segmentation Model (GLSM) was applied to extract the region of interest (leaf) from leaf patches.
3. The proposed Guava Multiple Leaf Diseases Detection Model performance was measured using Guava Leaf Diseases Dataset (GLDD) to identify and localize the guava multiple diseases on a single leaf.
4. We compared the proposed GMLDD model with other YOLO variants.
4.1 Proposed Guava Infected Patches Modified MobileNetV2 and U-Net (GIP-MU-Net) Performance
The experiment used an Adam optimizer and a batch size of 04 with 125 epochs for training. The performance graph of the proposed model observed in Fig. 8 exhibits the training and validation set loss and accuracy performance of the proposed model. It shows that the training loss decreases rapidly till 57 epochs, which is stable at less than 10%. On the other hand, validation loss decreases rapidly till 15 epochs, which then is steady at less than 30%. Fig. 8b also depicts the training and validation accuracy of the proposed GIP-MU-Net. It demonstrates that training accuracy increases rapidly till 40 epochs, reaching almost 96.62%, whereas validation accuracy increases till 20 epochs, reaching almost 96.62%, whereas92.38%. The proposed GIP-MU-Net model performance is measured on unseen data (test set) as shown in Tab. 4. It shows that the proposed model achieved 92.41% accuracy on unseen data. The proposed model predicted patch results can be seen in Fig. 9. All the metrics indicate the excellent performance of the GIP-MU-Net.
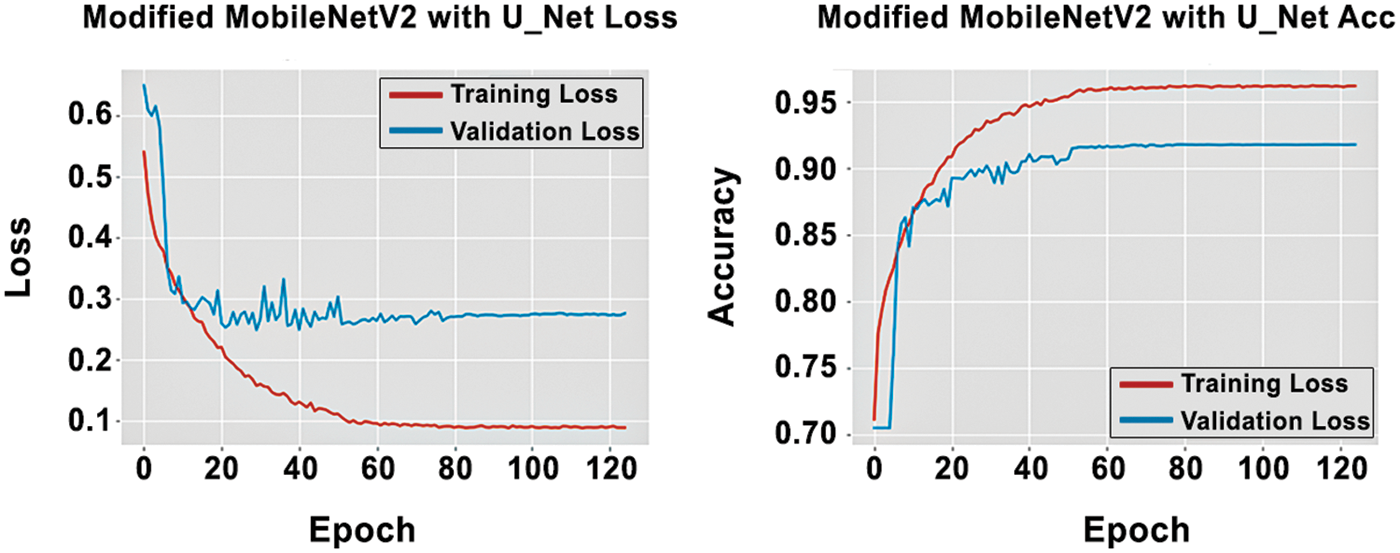
Figure 8: Training and validation graph of the GIP-MU-NET model

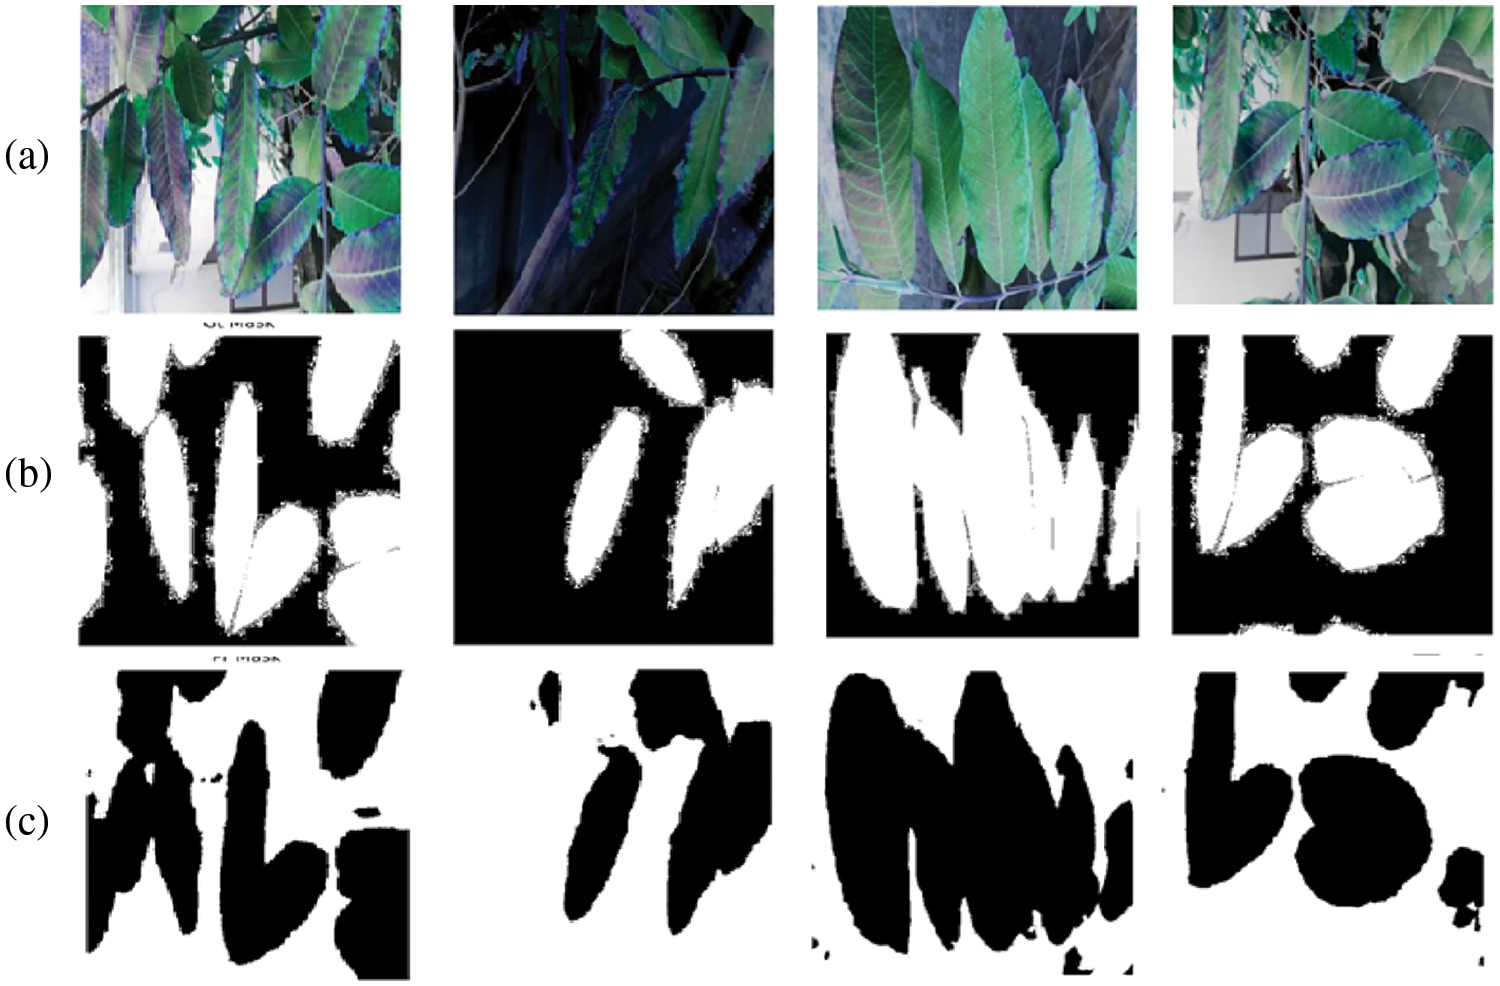
Figure 9: (a) Original image (b) Generated mask (c) Predicted mask of infected patches Predictions
We suggest the following recommendations to improve the performance of the patch detection model: 1) Enhanced the dataset could improve its performance of the dataset. The deep learning methods required massive data samples for training; otherwise, overfitting occurred. Therefore, the dataset’s enhancement could resolve the overfitting problem [30]. 2) Other techniques that could use to enhance the dataset are data augmentation techniques. In this research, we used only three data augmentation techniques. Therefore, with the help of proper data augmentation techniques, the dataset can be enhanced.
4.2 Proposed Guava Leaf Extraction Model (GLSM) Performance
The experiment used an Adam optimizer and a batch size of 4 with 50 epochs for training. The performance graph of the proposed model can be seen in Fig. 10, which indicates the performance of the proposed model. Fig. 10 shows that the proposed GLSM method’s training loss decreases rapidly to 25% till 50 epochs; on the other hand, validation loss drops quickly to 37% till 20 epochs after that loss decrease slowly to 35% after 50 epochs. The training accuracy of the proposed method increases rapidly at the start. It gradually reaches 86% after 50 epochs, and the validation accuracy also increases rapidly till 17 epochs, reaching 82% after 50 epochs. The proposed method is tested on the unseen data (test data) to measure the model’s performance. The proposed method gained 83.40% accuracy on 119 unseen images, as in Tab. 5. The proposed GLSM guava segmentation predictions can be viewed in Fig. 11. The proposed method achieved good performance on the less amount of data. The performance of the proposed GLSM model can be increased after the training on the large-scale dataset. To resolve the problem of underfitting or overfitting dataset should be increased massively, or the dataset can be enhanced by using the data augmentation techniques.

Figure 10: Training and validation graph of the GLSM

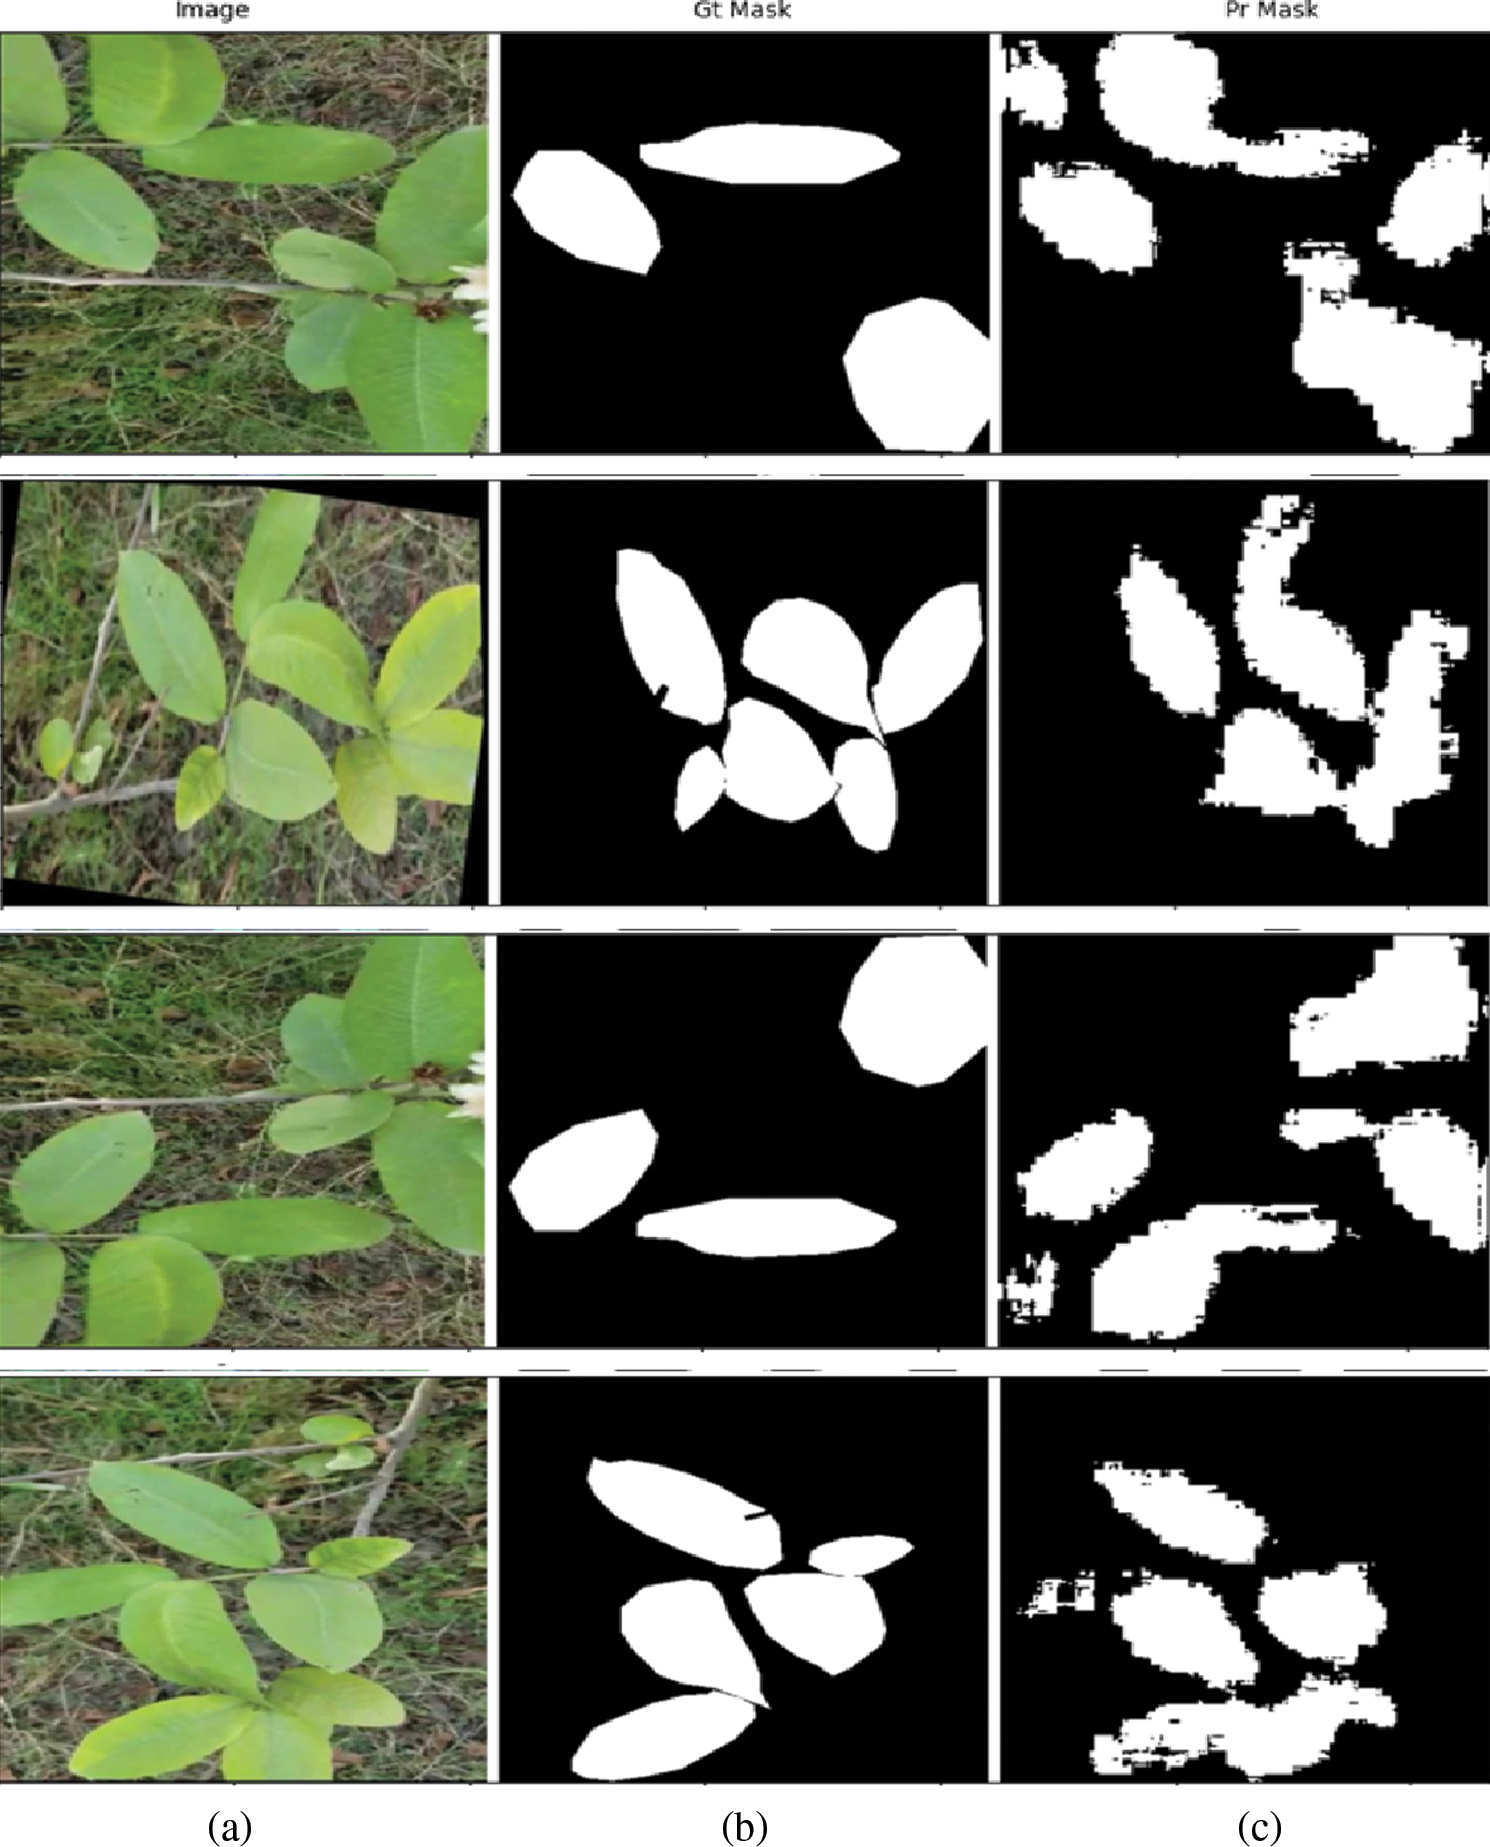
Figure 11: (a) Original image (b) Generated mask (c) Predicted mask of the GLSM
4.3 Proposed Guava Multiple Leaf Diseases Detection (GMLDD) Model Performance
The experiment used an Adam optimizer and a batch size of 32 with 500 epochs for training. The graph of the proposed model can be seen in Fig. 12, which highlights the model’s training and validation set performance. Fig. 13 depicts the performance of the proposed method.

Figure 12: Training and validation graph of the GMLDD model
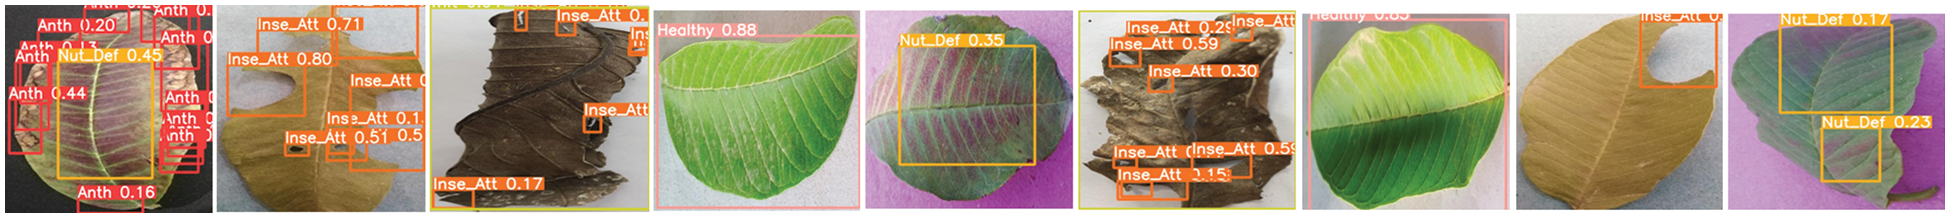
Figure 13: The proposed GLMDD model predictions
Fig. 12 illustrates three types of losses, including the box, objectness, and classification loss. The box loss indicated to what extent the model detected the object’s centre and how much the detected bounding box masked an object? Objectness loss meant a probability measure for the presence of an object in a suggested zone of interest. If the image window likely contained an item, objectivity would be high. The algorithm’s classification loss indicated how effectively the model could predict the proper class of a given object [30]. The precision, recall and mAP improved rapidly after 55 epochs. On the other hand, box loss, objectness loss and classification loss declined rapidly after 55 epochs, as shown in Fig. 12.
The proposed model inference was calculated on unseen data (test set) of five classes, including anthracnose, healthy, insect attack, nutrient deficiency and wilt. The test set contained 98 images with 232 targets (labels) for all classes, as shown in Tab. 6. The proposed model achieved 45.4% precision, 54.7% recall, 44.3% mAP@0.5 and 14.0% mAP@0.5:0.95 scores on 53 labels of anthracnose. Healthy category consisted of 24 labels with 93.3% precision, 100% recall, 95.9% mAP@0.5 and 92.0% mAP@0.5:0.95 scores (Tab. 6). In the insect attack, a total of 67 targets were used, achieving 64.6% precision, 79.1% recall, 79.8% mAP@0.5 and 35.3% mAP@0.5:0.95 scores (Tab. 6). Nutrient deficiency class was having 69 targets, gained 66.5% precision, 31.7% recall, 35.5% mAP@0.5 and 11.9% mAP@0.5:0.95 scores (Tab. 6). Wilt disease with 19 targets accomplished 96.3% precision, 100% recall, 99.5% mAP@0.5 and 98.2% mAP@0.5:0.95 (Tab. 6). The proposed method achieved 73.3% precision, 73.1% recall, 71.0% mAP@0.5 and 50.3 mAP@0.5:0.95 scores in all classes (Tab. 6), indicating good performance.

The proposed method confusion matrix is presented in Fig. 14. The confusion matrix reflected the recommended approach of the relevant class’s superior classification accuracy in a dark colour, whereas a lighter colour represented misclassified samples. Correct predictions were displayed diagonally in the confusion matrix, whereas off-diagonally displayed incorrect predictions. The proposed model achieved 70.8% correct and 29.2% wrong predictions for all categories (Fig. 14). The anthracnose class achieved 53%, the healthy category attained 100%, the insect attack gained 75%, nutrient deficiency accomplished 26% correct predictions, and the wilt class predicted 100% accurate predictions.
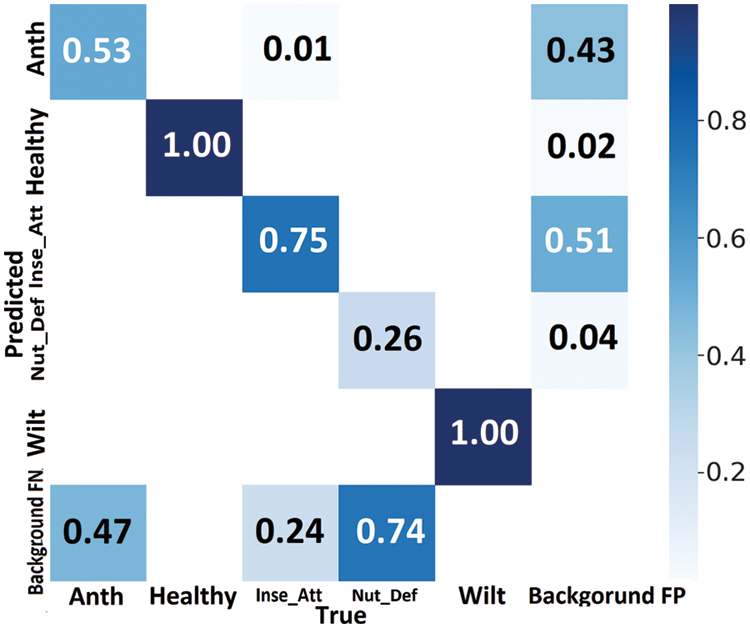
Figure 14: The proposed GMLDD model confusion matrix
In the p graph, as shown in Fig. 15a, precision is plotted on the y-axis and confidence level on the x-axis for different probability thresholds. The p-curve graph shows that precision gradually increased from confidence level 0 and reached its maximum level of 100% at confidence level > 0.53 on anthracnose disease. The healthy class achieved > 90% precision from ≥ 0.05 to 78 confidence level. At ≥ 84.3 confidence level, the healthy class reached maximum precision of 100%. Insect class precision gradually increased from a confidence level of 0 to 55 and reached 100% precision at ≥ 79 confidence level (Fig. 15a). The precision of the nutrient deficiency class gradually increased from a confidence level of 0 to 50. After which, precision decreased rapidly to 50% from a confidence level of 51 to 56, and it gained its maximum limit from ≥ 57% confidence onwards. On the other hand, the wilt class got > 95% precision and gradually increased from a confidence level of 0.03 onwards. All the categories’ precision gradually increased at a confidence level of below 84.3 and achieved maximum precision ≥ 84.3 confidence level. Therefore, our model performed well concerning precision at ≥ 84.3 confidence level.
Fig. 15b exhibits recall curve (r-curve) graph represented recall (y-axis) and confidence level (x-axis) on test data. The r-curve graph showed that the proposed model achieved almost 82% recall of anthracnose class at 0 confidence level. It gradually decreased between 1 to 58 confidence levels and reached 0 at > 58 confidence levels. The healthy type of the proposed method achieved 100% recall at < 70 confidence level; after 70 confidence levels, recall of the healthy class decreased rapidly. In the end, it became 0 recall at > 89 confidence level. Insect attack class attained 97% recall at 0 confidence level, then gradually decreased from 1 to 81 confidence level and became 0 at ≥ 82 confidence level. Nutrient deficiency recall started from > 90% at confidence level 0 following a rapid decrease from 1 to 51 confidence level reached to 0 from ≥ 50 confidence level. On the other hand, wilt class recall expressed a sharp plateau reaching the climax at confidence level < 83, which sharply decreased to 0 recall on > 88 confidence level. The proposed method achieved 97% recall for all the classes at 0 confidence level, followed by a gradual decrease approaching 0 at ≥ 88 for all classes (Fig. 15b).
The precision-recall curve (PR-curve) represented the balance between precision and recall for various thresholds. A large area under the curve indicated high recall and precision, indicating a low false-positive rate, and high recall indicated a low false-negative rate. The results showed that our model expressed a high area under the curve, meaning thereby the proposed model achieved good performance. The anthracnose, healthy, insect attack, nutrient deficiency and wilt class achieved 44.3 mAP@0.5, 95.9 mAP@0.5, 79.8 mAP@0.5, 35.5 mAP@0.5 and 99.5 mAP@0.5, respectively, whereas all categories attained 71.0 mAP@0.5 (Fig. 15c).
The f score, sometimes known as the f1 score, measures a model’s accuracy on a dataset, as shown by the f1 curve in Fig. 15d. The f score was the harmonic mean of the model’s precision and recall. It combined the model’s precision and recall. The greater the f1 score, with 0 being the worst and 100 being the best accuracy was. Anthracnose class at 0.03% recall at 0 confidence level gradually reached almost 50% f1 score at confidence level 23, then decreasing rapidly and becoming 0 f1 scores at < 58 confidence level. The healthy class achieved > 97 f1 scores at confidence level ≤ 80, then the f1 curve rapidly reduced and became 0 at confidence level > 88. The insect attack class of the proposed method attained a 10% f1 score at confidence level 0. It gradually increased till confidence level 56, achieved a 75% f1 score at confidence level 57, then gradually decreased, and became 0 at confidence level of ≥ 81. With nutrient deficiency class, the proposed method secured a 3.0% f1 score at confidence level 0, followed by a gradual increase. It got a 42% f1 score at confidence level 18, and then a rapid decrease touched 0 at a confidence level of ≥ 52 (Fig. 15d). On the other hand, the wilt class achieved > 97 f1 scores at < 77 confidence level, and it got a 100% f1 score at confidence levels from 78 to 82. Then, the f1 score of the wilt class rapidly decreased and approached 0 at a confidence level of > 88. In contrast, all categories achieved a 12% f1 score at 0 confidence level, followed by a gradual increase approaching a 72% f1 score at 22.2 confidence levels. After a 22.3 confidence level, the f1 score gradually decreased and became 0 after ≥ 88 confidence level. The results showed that the proposed model achieved the highest f1 score at a 22.2 confidence level (Fig. 15d).
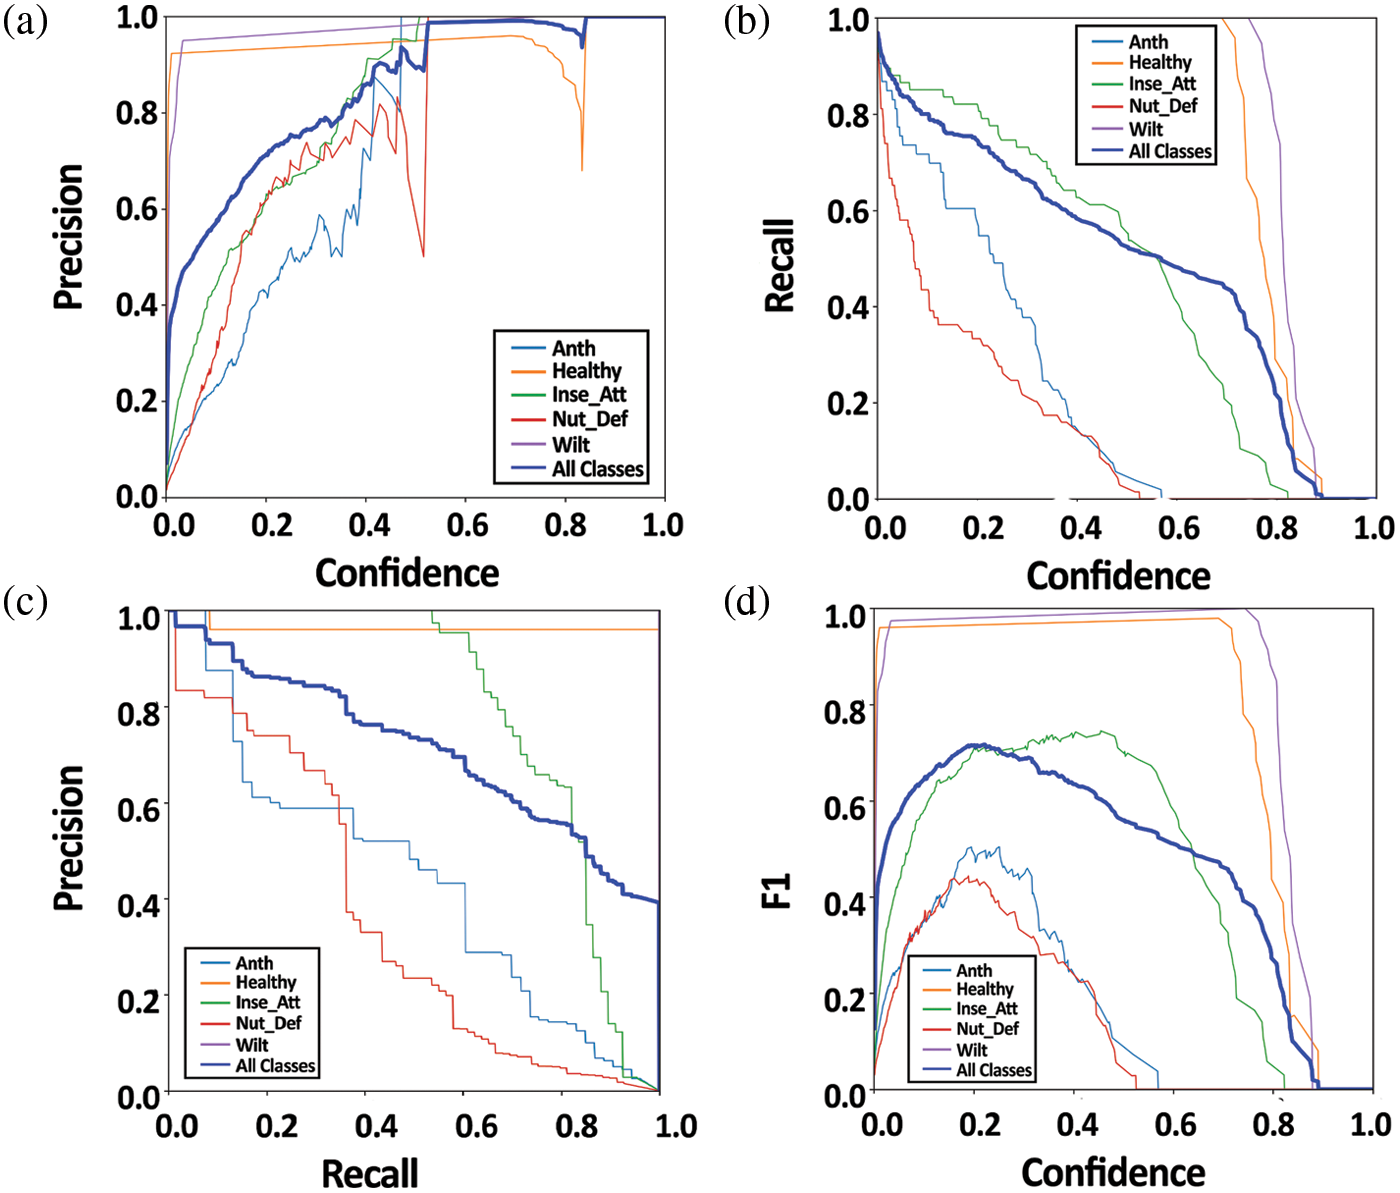
Figure 15: (a) Precision curve (P Curve) (b) Recall curve (R Curve) (c) Precision Recall curve (PR Curve) (d) F1 curve
The results showed that the healthy and wilt class expressed excellent precision, recall and mAP@0.5 (at > 93%); however, anthracnose disease had < 46% precision, recall and mAP@0.5, which was the lowest among all classes. On the other hand, the insect attack and nutrient deficiency class achieved more than 64% precision, recall and mAP@0.5. We suggest the following recommendations to improve the performance of the proposed guava multiple leaf diseases detection model:
1. The five classes in the GLDD used are significantly imbalanced. The infected class is highly underrepresented in the dataset. We can improve the performance of the proposed model by using the balanced dataset classes [30,31].
2. Increasing the dataset can improve the performance of the dataset. The deep learning methods require massive data samples for training; otherwise, overfitting occurs. Therefore, we can resolve the problem of overfitting by enhancing the dataset [30,31].
3. The complex background is another reason for misclassification. In the dataset, we used complex backgrounds, such as background colour, resembling leaf diseases, as shown in Fig. 16. For example, brown background misleads to the anthracnose, as shown in Figs. 16a–16c, and the disease light pink deceives the nutrient deficiency class, as depicted in Fig. 16f. We can improve the efficiency of the proposed method by using a transparent background or simple background and avoiding complex backgrounds.
4. Another way to enhance the efficiency of the proposed method is by eliminating the curly or folded leaves from the training. The curly or folded leaf can mislead the insect eaten class, as shown in Figs. 16d, 16e. We can enhance the proposed method’s efficiency by improving the curly or folded leaf training.
5. The small object sizes and annotation scheme are another reason for misclassification. In YOLOv5, only a rectangle is used to annotate the object. In guava leaf diseases, leaves are not in the proper shapes from the edges. And when we use a rectangle to annotate the object or disease area, the unnecessary information or area is also included, as shown in Figs. 16a–16f. This irrelevant inclusion ultimately misleads the classification. We can improve the efficiency of the proposed method to eliminate the unnecessary information that can mislead the classification during annotation [31].
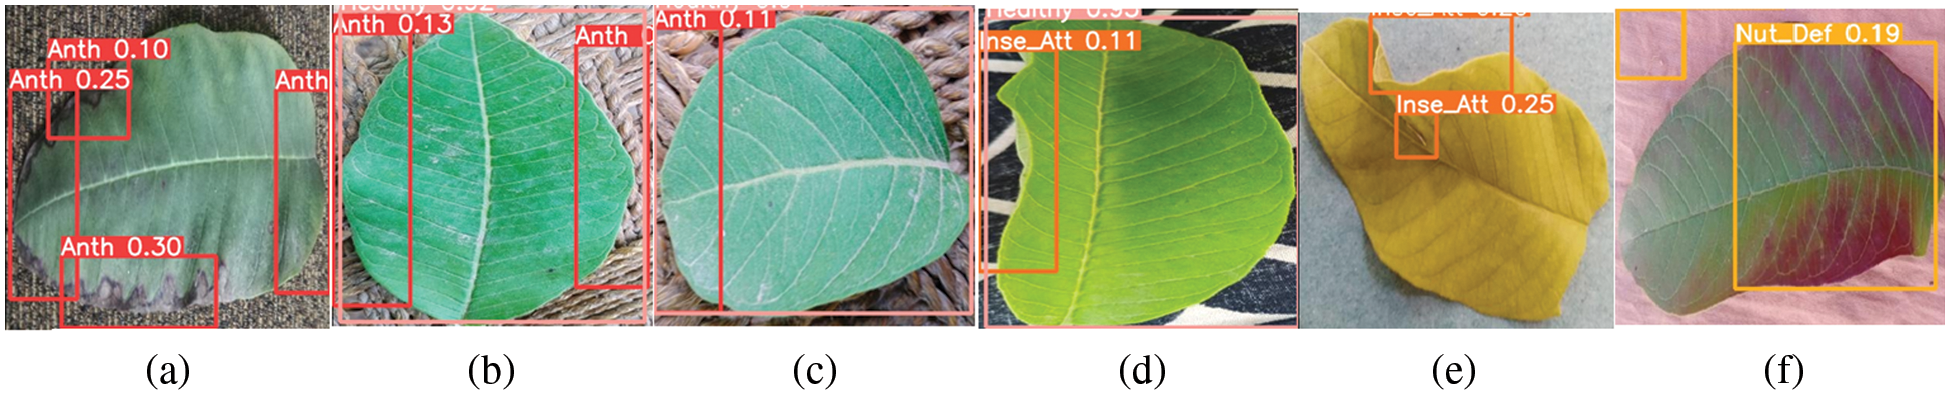
Figure 16: The proposed GMLDD model misclassification examples. Misclassification examples
4.4 Comparison of Proposed GMLDD Model with Other YOLO Variants
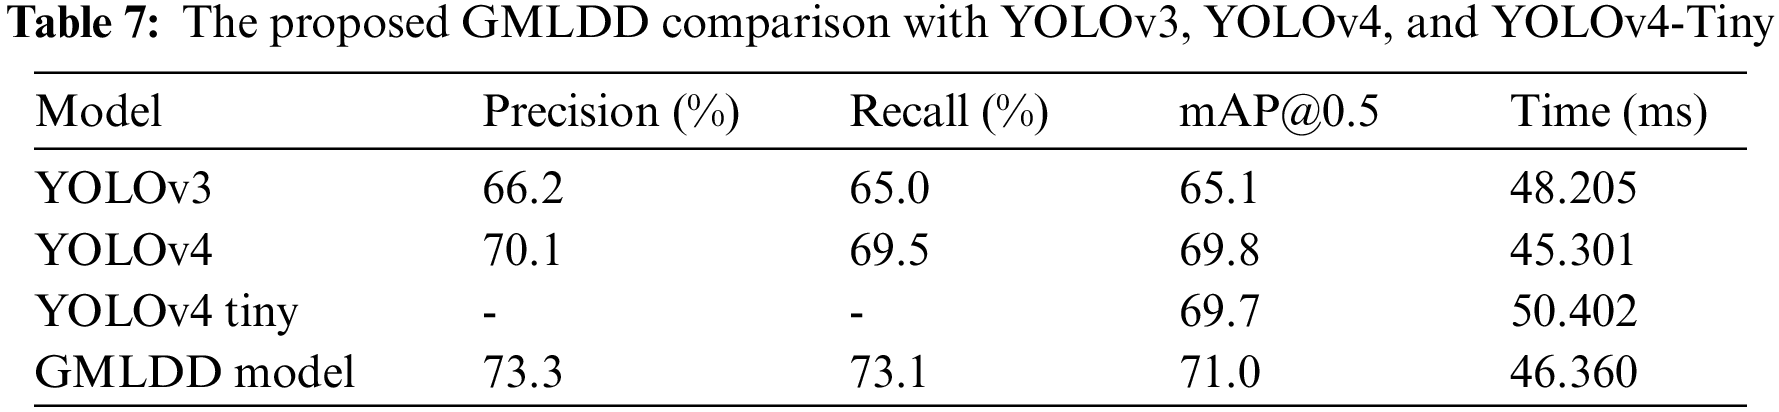
To our knowledge, no work exists on multiple guava leaf disease detection from a single leaf. Therefore, a direct comparison with the existing method is not possible. However, we compare the performance of the proposed technique with other YOLO variants on the GLDD dataset. The values of precision, recall, and average detection time were compared with YOLOv3 [47], YOLOv4 [48], and YOLOv4 Tiny [49] to compare the overall performances of the proposed detection model, as given in Tab. 7. Compared to the other models, the proposed model had the highest precision, recall, and mAP0.5 values of 73.3, 73.1, and 71.0. As a result, the suggested detection model performs better in detecting bounding boxes than the other three models. Furthermore, the average detection time of these three models was compared, which revealing that the YOLOv4 had the shortest detection time of 45.301 ms. The proposed model’s detection time was faster than the YOLOv3, and YOLOv4 Tiny models, which had a detection time of 46.360 ms. Despite this, it can detect high-resolution images in real-time with greater performance and speed than the other two existing models.
Real-time guava multiple leaf disease detection on a single leaf, guava infected patches and guava leaf segmentation were complex and challenging tasks. This research proposed a hybrid deep learning model to detect the multiple leaf diseases from a guava leaf and consisted of three models. The first model is GIP-MU-Net which segmented the infected region from the guava field. Then, the second GLSM model segmented the infected and healthy guava leaves. The last model is Guava Multiple Leaf Disease Detection (GMLDD), based on the YOLOv5 deep learning model. It detected and localized the multiple diseased regions from the infected area of the guava leaf. The performance of the deep learning models was evaluated on the self-acquired datasets: Guava Patches Dataset (GPD) and Guava Leaf Disease Dataset (GLDD). Both the datasets were developed by capturing the videos from the guava cultivation fields. Based on significant performance, we believed that the proposed multi-level deep learning model efficiently detected multiple diseases from a single instance, which helped the farmers increase the guava yield by detecting the guava disease early. It also helped to prevent the harsh effects of infectious diseases destroying the guava field and causing economic deprivation to the farmers. The proposed model was fully automated compared to the state-of-the-art existing leaf disease detection techniques. The plant leaves were manually captured and annotated to train the models. Moreover, the proposed model could be employed in real-time to detect plant leaf diseases. Moreover, the proposed model could be employed in real-time to detect plant leaf diseases. However, the proposed deep learning model is a prominent model for real-time detection of plant leaf diseases. Still, extensive development is required as research limitations of the environmental factors in various cultivation areas. The plant species represented different lesions in case of the same disease. The dataset was captured from a specific region and species of guava plants. These factors need to be addressed in the future to eliminate the effect of environmental changes, guava species, and disease appearance in different guava species.
Acknowledgement: The researchers would like to thank the Deanship of Scientific Research, Qassim University for funding the publication of this Project.
Funding Statement: This study was financially supported by the Deanship of Scientific Research, Qassim University, Saudi Arabia for funding the publication of this project.
Conflicts of Interest: The authors declare that they have no conflicts of interest to report regarding the present study.
References
1. M. T. S. Abirami, “Application of image processing in diagnosing guava leaf disease,” International Journal of Scientific Research and Management, vol. 5, no. 7, pp. 5927–5933, 2017. [Google Scholar]
2. Pakissan. Pakissan, 2020. [Online]. Available: https://pakissan.com/english/allabout/orchards/guava.shtml. [Google Scholar]
3. Tridge, Guava, 2019. [Online]. Available: https://www.tridge.com/intelligences/guava/production. [Google Scholar]
4. K. Golhani, S. K. Balasundram, G. Vadamalai and B. Pradhan, “A review of neural networks in plant disease detection using hyperspectral data,” Information Processing in Agriculture, vol. 5, no. 3, pp. 354–371, 2018. [Google Scholar]
5. A. G. Awan and G. Yaseen, “Global climate change and its impact on agriculture sector in Pakistan,” American Journal of Trade and Policy, vol. 4, no. 1, pp. 41–48, 2017. [Google Scholar]
6. Y. Sasaki, T. Okamoto, K. Imou and T. Torii, “Automatic diagnosis of plant disease-spectral reflectance of healthy and diseased leaves,” IFAC Proceedings Volumes, vol. 31, no. 5, pp. 145–150, 1998. [Google Scholar]
7. J. M. Henson and R. French, “The polymerase chain reaction and plant disease diagnosis,” Annual Review of Phytopathology, vol. 31, no. 1, pp. 81–109, 1993. [Google Scholar]
8. C. Koo, M. Malapi-Wight, H. S. Kim, O. S. Cifci, V. L. Vaughn-Diaz et al., “Development of a real-time microchip PCR system for portable plant disease diagnosis,” PloS One, vol. 8, no. 12, pp. e82704, 2013. [Google Scholar]
9. J. Ma, K. Du, F. Zheng, L. Zhang, Z. Gong et al., “A recognition method for cucumber diseases using leaf symptom images based on deep convolutional neural network,” Computers and Electronics in Agriculture, vol. 154, pp. 18–24, 2018. [Google Scholar]
10. K. Song, X. Sun and J. Ji, “Corn leaf disease recognition based on support vector machine method,” Transactions of the CSAE, vol. 23, no. 1, pp. 155–157, 2007. [Google Scholar]
11. S. W. Chen, S. S. Shivakumar, S. Dcunha, J. Das, E. Okon et al., “Counting apples and oranges with deep learning: A data-driven approach,” IEEE Robotics and Automation Letters, vol. 2, no. 2, pp. 781–788, 2017. [Google Scholar]
12. P. A. Dias, A. Tabb and H. Medeiros, “Multispecies fruit flower detection using a refined semantic segmentation network,” IEEE Robotics and Automation Letters, vol. 3, no. 4, pp. 3003–3010, 2018. [Google Scholar]
13. J. Ubbens, M. Cieslak, P. Prusinkiewicz and I. Stavness, “The use of plant models in deep learning: An application to leaf counting in rosette plants,” Plant Methods, vol. 14, no. 1, pp. 6, 2018. [Google Scholar]
14. J. Rashid, M. Ishfaq, G. Ali, M. R. Saeed, M. Hussain et al., “Skin cancer disease detection using transfer learning technique,” Applied Sciences, vol. 12, no. 11, pp. 5714, 2022. [Google Scholar]
15. M. Sohail, G. Ali, J. Rashid, I. Ahmad, S. H. Almotiri et al., “Racial identity-aware facial expression recognition using deep convolutional neural networks,” Applied Sciences, vol. 12, no. 1, pp. 88, 2022. [Google Scholar]
16. J. Rashid, I. Khan, G. Ali, S. H. Almotiri, M. A. AlGhamdi et al., “Multi-level deep learning model for potato leaf disease recognition,” Electronics, vol. 10, no. 17, pp. 2064, 2021. [Google Scholar]
17. H. Sun and R. Grishman, “Lexicalized dependency paths based supervised learning for relation extraction,” Intelligent Automation & Soft Computing, vol. 43, no. 3, pp. 861–870, 2022. [Google Scholar]
18. H. Sun and R. Grishman, “Employing lexicalized dependency paths for active learning of relation extraction,” Intelligent Automation & Soft Computing, vol. 34, no. 3, pp. 1415–1423, 2022. [Google Scholar]
19. M. Ji, L. Zhang and Q. Wu, “Automatic grape leaf diseases identification via united model based on multiple convolutional neural networks,” Information Processing in Agriculture, vol. 7, no. 3, pp. 418–426, 2020. [Google Scholar]
20. P. Jiang, Y. Chen, B. Liu, D. He and C. Liang, “Real-time detection of apple leaf diseases using deep learning approach based on improved convolutional neural networks,” IEEE Access, vol. 7, pp. 59 069–59 080, 2019. [Google Scholar]
21. Z. U. Rehman, M. A. Khan, F. Ahmed, R. Damaševičius, S. R. Naqvi et al., “Recognizing apple leaf diseases using a novel parallel real-time processing framework based on mask RCNN and transfer learning: An application for smart agriculture,” IET Image Processing, vol. 15, pp. 2157–2168, 2021. [Google Scholar]
22. D. Shah, V. Trivedi, V. Sheth, A. Shah and U. Chauhan, “Res TS: Residual deep interpretable architecture for plant disease detection,” Information Processing in Agriculture, vol. 9, no. 2, pp. 212–223, 2021. [Google Scholar]
23. N. Deepa and N. Nagarajan, “Kuan noise filter with hough transformation based reweighted linear program boost classification for plant leaf disease detection,” Journal of Ambient Intelligence and Humanized Computing, vol. 12, pp. 5979–5992, 2020. [Google Scholar]
24. A. F. Al Haque, R. Hafiz, M. A. Hakim and G. R. Islam, “A computer vision system for guava disease detection and recommend curative solution using deep learning approach,” in Proc. of 22nd Int. Conf. on Computer and Information Technology (ICCIT), Jijel, Algeria, pp. 1–6, 2019. [Google Scholar]
25. M. R. Howlader, U. Habiba, R. H. Faisal and M. M. Rahman, “Automatic recognition of guava leaf diseases using deep convolution neural network,” in Proc. of Int. Conf. on Electrical, Computer and Communication Engineering (ECCE), Cox’s Bazar, Bangladesh, pp. 1–5, 2019. [Google Scholar]
26. A. Almadhor, H. T. Rauf, M. I. U. Lali, R. Damaševičius, B. Alouffi et al., “AI-driven framework for recognition of guava plant diseases through machine learning from DSLR camera sensor based high resolution imagery,” Sensors, vol. 21, no. 11, pp. 3830, 2021. [Google Scholar]
27. P. Perumal, K. Sellamuthu, K. Vanitha and V. K. Manavalasundaram, “Guava leaf disease classification using support vector machine,” Turkish Journal of Computer and Mathematics Education (TURCOMAT), vol. 12, no. 7, pp. 1177–1183, 2021. [Google Scholar]
28. J. Gimenez-Gallego, J. D. Gonzalez-Teruel, M. Jimenez-Buendia, A. B. Toledo-Moreo, F. Soto-Valles et al., “Segmentation of multiple tree leaves pictures with natural backgrounds using deep learning for image-based agriculture applications,” Applied Sciences, vol. 10, no. 1, pp. 202, 2019. [Google Scholar]
29. K. Yang, W. Zhong and F. Li, “Leaf segmentation and classification with a complicated background using deep learning,” Agronomy, vol. 10, no. 11, pp. 1721, 2020. [Google Scholar]
30. M. Kasper-Eulaers, N. Hahn, S. Berger, T. Sebulonsen, Ø. Myrland et al., “Detecting heavy goods vehicles in rest areas in winter conditions using YOLOv5,” Algorithms, vol. 14, no. 4, pp. 114, 2021. [Google Scholar]
31. X. Wang, J. Wei, Y. Liu, J. Li, Z. Zhang et al., “Research on morphological detection of fr i and fr ii radio galaxies based on improved YOLOv5,” Universe, vol. 7, no. 7, pp. 211, 2021. [Google Scholar]
32. J. Yao, J. Qi, J. Zhang, H. Shao, J. Yang et al., “A real-time detection algorithm for kiwifruit defects based on YOLOv5,” Electronics, vol. 10, no. 14, pp. 1711, 2021. [Google Scholar]
33. A. M. Roy and J. Bhaduri, “A deep learning enabled multi-class plant disease detection model based on computer vision,” AI, vol. 2, no. 3, pp. 413–428, 2021. [Google Scholar]
34. C. -Y. Wang, I. -H. Yeh and H. -Y. M. Liao, “You only learn one representation: Unified network for multiple tasks,” ArXiv Preprint arXiv: 2105.04206, 2021. [Google Scholar]
35. Y. Zhang, X. Song, B. Bai, T. Xing, C. Liu et al., “2nd place solution for waymo open dataset challenge–real-time 2D object detection,” ArXiv Preprint arXiv: 2106.08713, 2021. [Google Scholar]
36. X. Lu, G. Cao, Z. Zhang, Y. Yang, L. Jiao et al., “A simple semi-supervised learning framework based on YOLO for object detection,” arXiv:2005.04757v2, 2020. [Google Scholar]
37. K. Wada, “Labelme: Image polygonal annotation with python,” 2016. [Online]. Available: https://github.com/wkentaro/labelme. [Google Scholar]
38. J. Rashid, I. Khan, G. Ali, S. U. Rehman, A. Shahid et al., “Guava patches dataset (GPD),” 2021. [Online]. Available: https://drive.google.com/drive/folders/1WCdZWn6NkgQvviZhe9EtXN1S4urj4ubX?usp=sharing. [Google Scholar]
39. J. Rashid, I. Khan, G. Ali, S. U. Rehman, A. Shahid et al., “Guava leaf diseases dataset (GLDD),” 2021. [Online]. Available: https://drive.google.com/drive/folders/1vpgYn54j034ELwwu_5NuvMd0fjwQhXOr?usp=sharing. [Google Scholar]
40. Roboflow. ( 2021) “Robflow. roboflow, Inc.,” 2021 [Online]. Available: https://app.roboflow.com/. [Google Scholar]
41. O. Ronneberger, P. Fischer and T. Brox, “U-Net: Convolutional networks for biomedical image segmentation,” in Medical Image Computing and Computer-Assisted Intervention--MICCAI 2015 18th Int. Conf., Munich, Germany, Springer, pp. 234–241, 2015. [Google Scholar]
42. M. Sandler, A. Howard, M. Zhu, A. Zhmoginov and L. -C. Chen, “Mobilenetv2: Inverted residuals and linear bottlenecks,” in Proc. of the Conf. on Computer Vision and Pattern Recognition, Salt Lake City Utah, USA, pp. 4510–4520, 2018. [Google Scholar]
43. Z. Tian, C. Shen, H. Chen and T. He, “FCOS: Fully convolutional one-stage object detection,” in Proc. of the IEEE/CVF Int. Conf. on Computer Vision, Seoul, South Korea, pp. 9627–9636, 2019. [Google Scholar]
44. R. Laroca, E. Severo, L. A. Zanlorensi, L. S. Oliveira, G. R. Gonçalves et al., “A robust real-time automatic license plate recognition based on the YOLO detector,” in Proc. of Int. Joint Conf. on Neural Networks (IJCNN), Ri De Janeiro, Brazil, pp. 1–10, 2018. [Google Scholar]
45. N. Bodla, B. Singh, R. Chellappa and L. S. Davis, “Soft-NMS–improving object detection with one line of code,” in Proc. of the IEEE Int. Conf. on Computer Vision, Venice, Italy, pp. 5561–5569, 2017. [Google Scholar]
46. D. Sun, L. Liu, A. Zheng, B. Jiang and B. Luo, “Visual cognition inspired vehicle re-identification via correlative sparse ranking with multi-view deep features,” in Proc. of Int. Conf. on Brain Inspired Cognitive Systems, Xi’an, China, pp. 54–63, 2018. [Google Scholar]
47. J. Redmon and A. Farhadi, “YOLOv3: An incremental improvement,” ArXiv Preprint arXiv: 1804.02767, 2018. [Google Scholar]
48. A. Bochkovskiy, C. -Y. Wang and H. -Y. M. Liao, “YOLOv4: Optimal speed and accuracy of object detection,” ArXiv Preprint arXiv: 2004.10934, 2020. [Google Scholar]
49. S. Zhang, Y. Wu, C. Men and X. Li, “Tiny YOLO optimization oriented bus passenger object detection,” Chinese Journal of Electronics, vol. 29, no. 1, pp. 132–138, 2020. [Google Scholar]
Cite This Article
 Copyright © 2023 The Author(s). Published by Tech Science Press.
This work is licensed under a Creative Commons Attribution 4.0 International License , which permits unrestricted use, distribution, and reproduction in any medium, provided the original work is properly cited.
 Downloads
 Citation Tools