
 Submit a Paper
 Propose a Special lssue
 Open Access
ARTICLE
A Healthcare System for COVID19 Classification Using Multi-Type Classical Features Selection
1 Department of Computer Science, HITEC University, Taxila, Pakistan
2 Computer Sciences Department, College of Computer and Information Sciences, Princess Nourah Bint Abdulrahman University (PNU), P.O. Box 84428, Riyadh, 11671, Saudi Arabia
3 College of Computer Engineering and Sciences, Prince Sattam bin Abdulaziz University, Al-Kharj, Saudi Arabia
4 Department of ICT Convergence, Soonchunhyang University, Asan, 31538, Korea
* Corresponding Author: Byeong-Gwon Kang. Email:
Computers, Materials & Continua 2023, 74(1), 1393-1412. https://doi.org/10.32604/cmc.2023.032064
Received 05 May 2022; Accepted 24 June 2022; Issue published 22 September 2022
 View Full Text
 Download PDF
Abstract
The coronavirus (COVID19), also known as the novel coronavirus, first appeared in December 2019 in Wuhan, China. After that, it quickly spread throughout the world and became a disease. It has significantly impacted our everyday lives, the national and international economies, and public health. However, early diagnosis is critical for prompt treatment and reducing trauma in the healthcare system. Clinical radiologists primarily use chest X-rays, and computerized tomography (CT) scans to test for pneumonia infection. We used Chest CT scans to predict COVID19 pneumonia and healthy scans in this study. We proposed a joint framework for prediction based on classical feature fusion and PSO-based optimization. We begin by extracting standard features such as discrete wavelet transforms (DWT), discrete cosine transforms (DCT), and dominant rotated local binary patterns (DRLBP). In addition, we extracted Shanon Entropy and Kurtosis features. In the following step, a Max-Covariance-based maximization approach for feature fusion is proposed. The fused features are optimized in the preliminary phase using Particle Swarm Optimization (PSO) and the ELM fitness function. For final prediction, PSO is used to obtain robust features, which are then implanted in a Support Vector Data Description (SVDD) classifier. The experiment is carried out using available COVID19 Chest CT Scans and scans from healthy patients. These images are from the Radiopaedia website. For the proposed scheme, the fusion and selection process accuracy is 88.6% and 93.1%, respectively. A detailed analysis is conducted, which supports the proposed system efficiency.Keywords
The research on coronavirus is going on from the last two decade [1], however it got much intention by the researchers of Science & Engineering domain in general and Medical Sciences in particular after its spread in Wuhan city, Hubei Province in mainland China [2]. Angiotensin-converting enzyme 2 (ACE2) is a receptor for SARS-CoV, the novel coronavirus that shows the random symptoms like fever, pain, nasal congestion, running nose and acute respiratory syndrome that in some serious situations leads towards death. The major human coronavirus category is SARS-CoV and the novel coronavirus SARS-CoV−2 that causes coronavirus disease in 2019 [3]. Once it has been declared an epidemic, the health sectors of even first world countries were not equipped with necessary medical instruments required to cope with the influx of patients in any specified area [4]. To date, the confirm corona virus cases are 4,253,802, worldwide. The total deaths are 287,250 and United State (USA) is a highly affected with this virus. The need of computer technology arises that provide the medical specialist an intelligent input about the incoming patient so the resources of the hospitals can be intelligently utilized.
Keeping in view the great success of artificial intelligence methods in medical imagery a number of scientists undergoes exploitation to these tools in recent Covid-19 situation. In this regard the most recent literature survey is presented. A predictive performance deep learning models based on neural network has been exploited to distinguished Covid-19 from community acquired pneumonia on chest [5] by extracting the visual features from volumetric chest CT exams. The real time multi-step forecasting of Covid-19 to estimate its spread and its life span across the china is proposed in [6] to help public health planning and policymaking. Identification of Covid-19 cases quickly to reduce spread in susceptible population a machine learning based method is proposed [7]. The applicability of AI methods for detecting infected people using chest radiography images is an alternate quick method of accurate screening proposed in [8] using a deep convolution neural network, although the method required large dataset for better accuracy and reliability of the method. However, currently researchers facing the problem of the availability of Chest CT Scans. In this view, we believe that the employing of classical features like texture and local points are more effective to deal with less number of images. Therefore, we collected 16 patients data which publicly available. The data consists of both normal and confirmed COVID19 Pneumonia CT Scans. A few sample images are shown in Fig. 1.
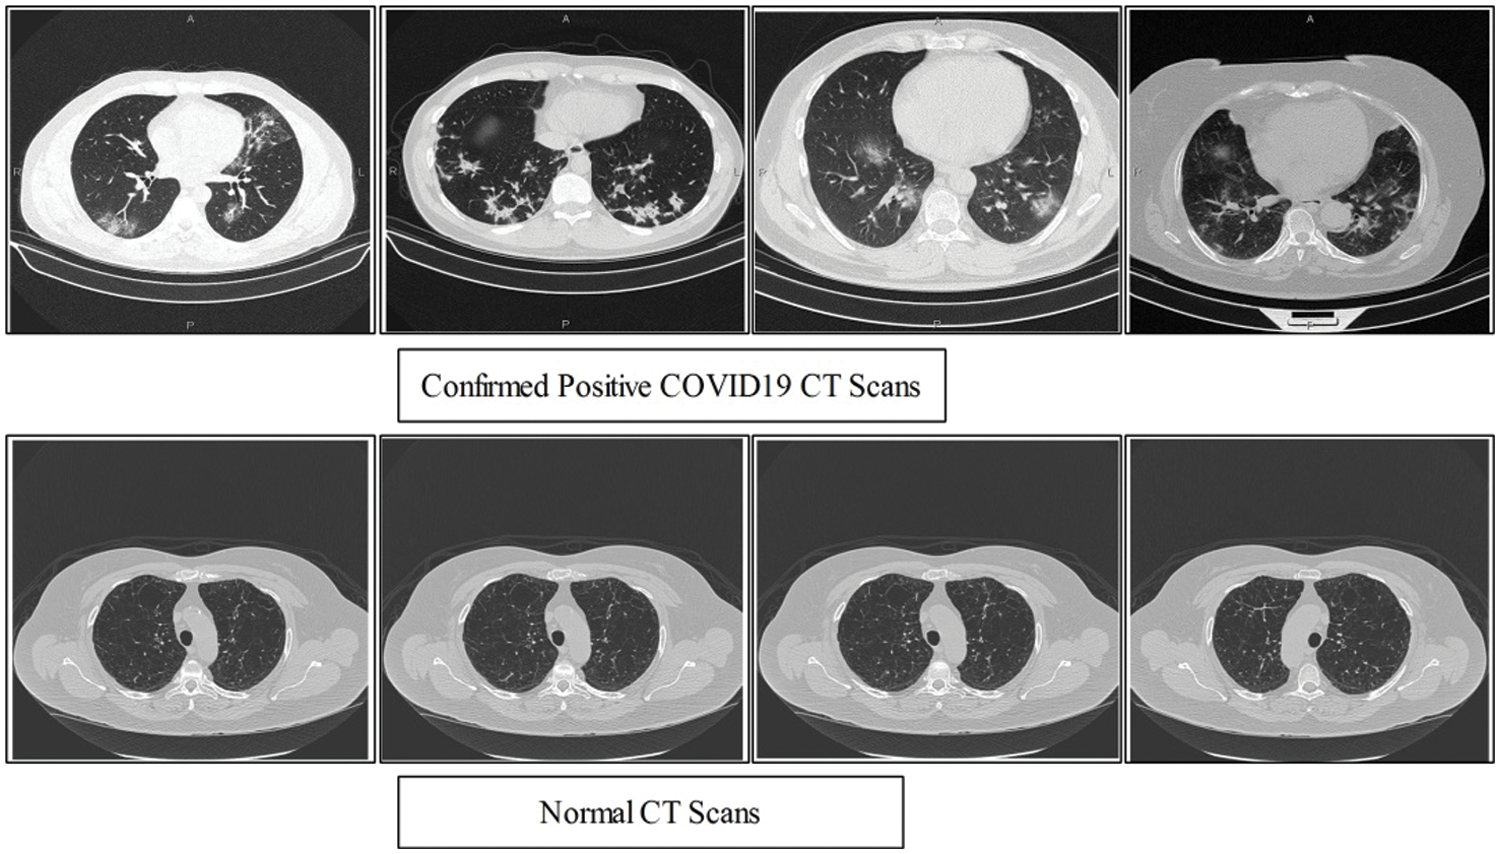
Figure 1: Sample Scans of healthy and Positive COVID19
This motivates the authors to study some alternate technology based mechanism that can classify the COVID-19 infected people in the categories of only infected, mild and savior-infected patients that need immediate intention by the medical specialists [9]. A stack of the dataset obtained from Chest CT Scan for various patients motivate the authors to incorporate method based of artificial intelligence to perform classification and predictions with a high level of accuracy. As AI inspired methods are a powerful tool so as the increase in dataset from private and public hospital in future would even strengthen the study. Farooq et al. [10] presented a convolutional neural network (CNN) based method for discriminating COVID19 patients based CT scans. They used publically available data for fine tuning of pre-trained ResNet-50 CNN architecture. For training a model, they used different input sizes like
The above techniques are summarizes in this text. These studies mostly based on deep learning, features fusion, and reduction. However, it is noticed that the deep learning models required a huge amount of data for training; however, currently sufficient data is not available. Therefore, it is required a data augmentation which is not a perfect approach and not assurance of better performance. The second step which is followed by above researchers is fusion of features. However, the fusion of features also added little redundant information which is resolved through selection of robust features or reduction techniques. The reduction techniques are not provides better results because it is high chances that few important features are discarded but in the selection process only those features are selected whose meet the defined criteria. In this work, we focused on classical features that are fused using proposed Max-Correlation maximization approach. Later, features are optimized using PSO along with extreme learning machine (ELM) fitness function.
In this work, we proposed a new method for prediction of COVID19 from Chest CT scans based on the fusion of multi-type features and particle swarm optimization–extreme learning machine (PSO-ELM) based features optimization. The proposed method is shown in Fig. 2. In this Figure, it is shown that proposed method consists of four principle steps-multiple feature extraction using classical techniques(i.e., DCT, DWT, and DRLBP), Max-Covariance Maximization approach for fusion of all these features, optimization of features using PSO along ELM fitness function, and finally optimized features embed in SVDD classifier for final classification.
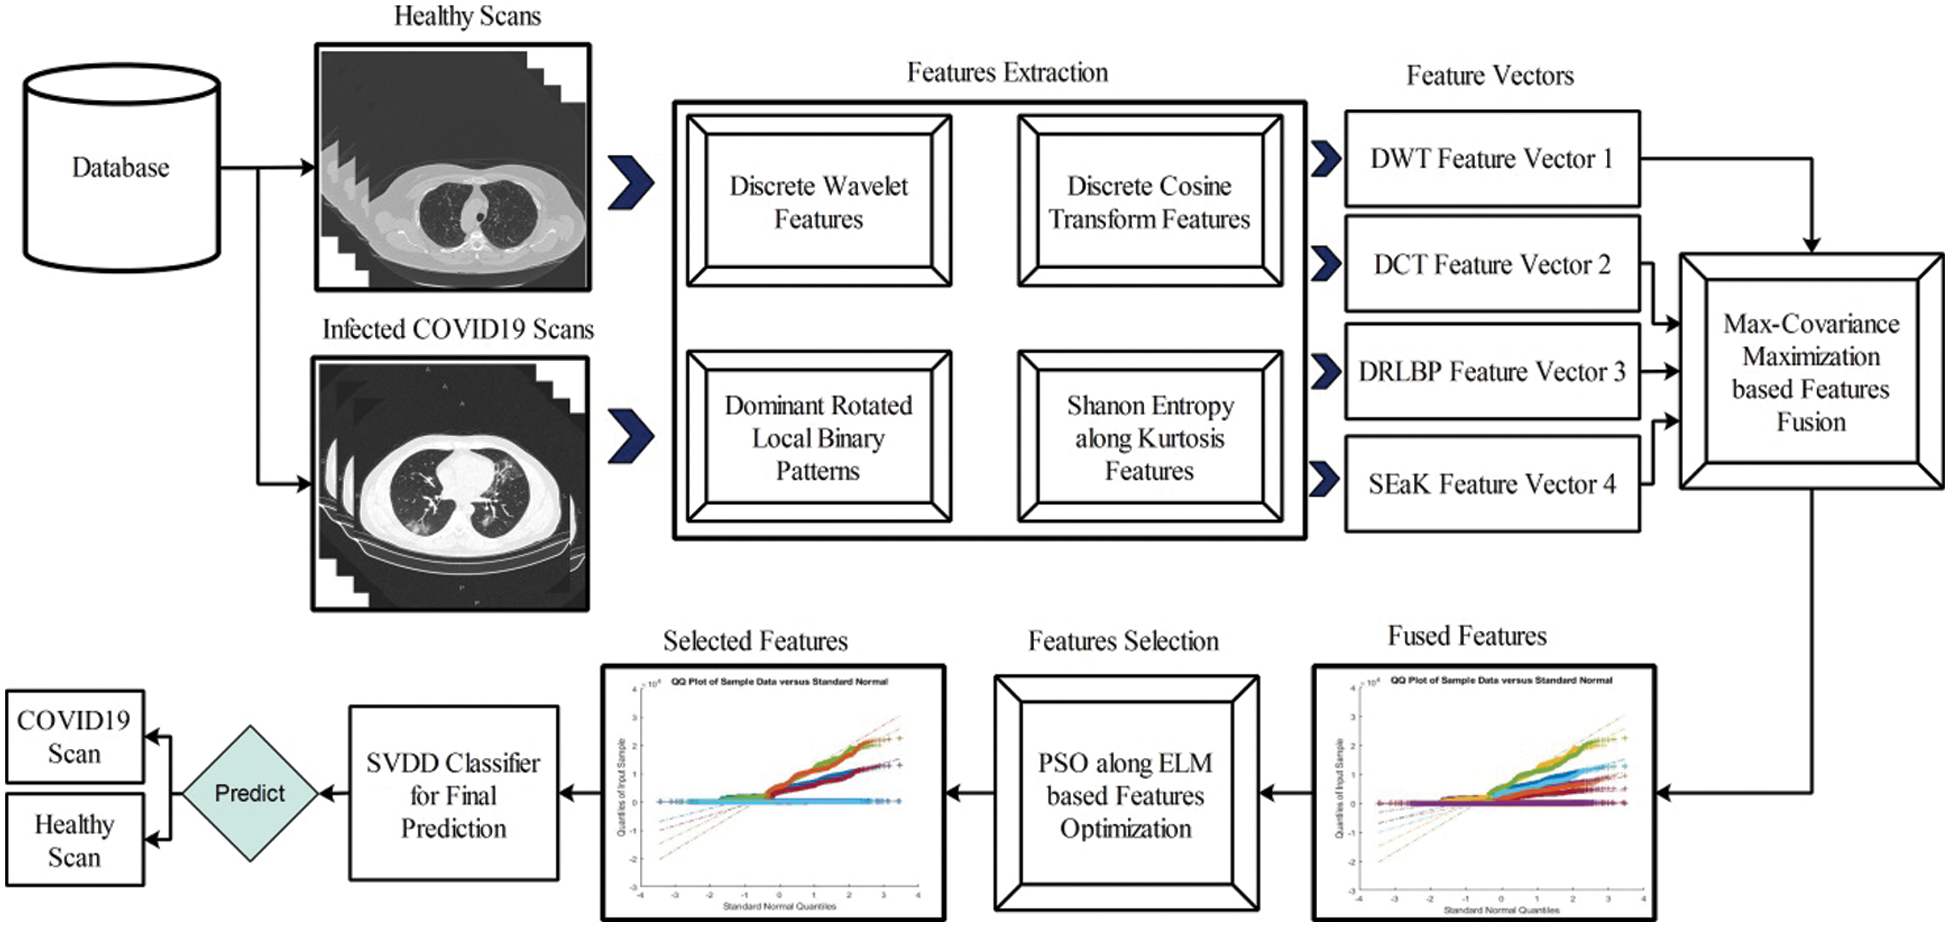
Figure 2: Proposed multi-type features fusion and optimization using PSO-ELM for prediction of COVID19 patients using CT Scans
A total of 7000 images are collected from Radiopaedia [19] which includes 4000 COVID19 positive CT scans and rest of them are healthy. From this website, 58 patients CT scans are available for research purpose. The confirmed COVID19 positive cases are tested by RT-PCR testing kit. The confirmed cases are also includes the travel history of patients. From the total CT images, we used 2000 COVID19 Positive and 1500 healthy scans for training the classifier using proposed method and rest of them for testing. A few sample images are shown in Fig. 1. However, from these scans, it is not easy to get 100% accuracy due to complex texture problems. Also, the most of the region in the image is healthy, so the prediction of COVID19 and healthy scans using machine learning is depends on the nature of extracted features.
In this modern era, demand of real time solutions has focused the research community to develop highly efficient and accurate algorithms. Extraction of features from image dataset for the purpose of classification plays a vital role in the development of such systems. These features must be highly uncorrelated and have significant variations. Many feature extraction techniques are found in the literature and their significance has been proven in solving many problems [20]. However, it has been observed that features performing better in one domain may not be equally effective in other domains. It leads us to use the combination of better performing features. In this manuscript we have used Discrete Wavelet Transform (DWT), Discrete Cosine Transforms (DCT), Dominant Rotated Local binary Pattern (DRLBP) and Shannon Entropy along Kurtosis features. Significance, usability and detail of each of these feature extraction techniques have been discussed in the following subsections.
2.2.1 Discrete Wavelet Transform (DWT)
Wavelets have been effectively used for extraction of features from image dataset for more than 30 years. It has the property of representing image at multi-resolutions without loss of information. Moreover, it captures local information present in spatial domain and represents it in frequency domain. DWT transforms the input image into four sub-bands at first level of decomposition [21]. The next-level decomposition is done using the same way as presented in [21]. Other sub-bands can also be used for decomposition but they possess different properties as HH sub-bands are insensitive to illumination variations. We have used approximation sub-band as they carry much information.
Consider,
Here,
Detailed of the scaled and transformed basis functions are calculated using the following formulation:
where,
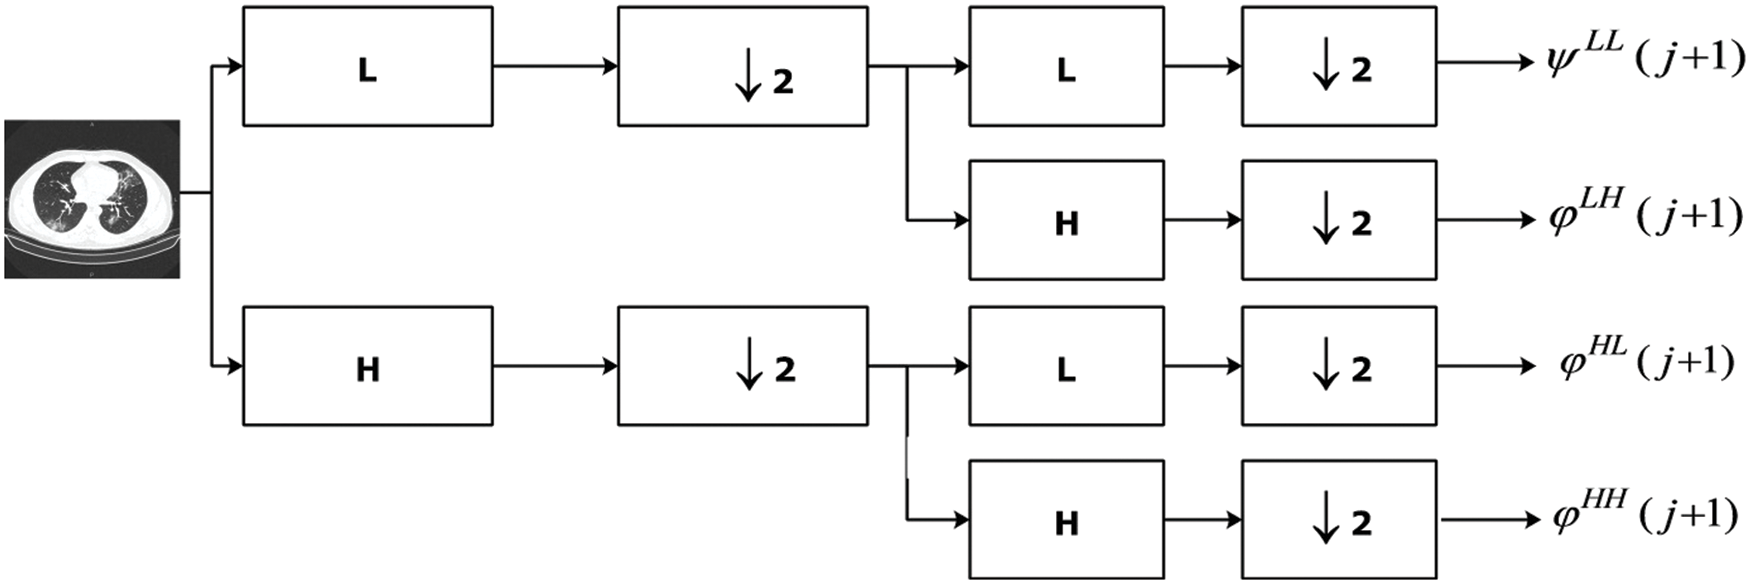
Figure 3: Computation of DWT features from Chest CT image
2.2.2 Discrete Cosine Transform (DCT)
DCT is one of the old and most widely used techniques for extraction of features [22]. It has high information packing capability and thus is used for compression of images. This property enables us to extract significant information from images. Image data after applying DCT is transformed into frequency domain where data with high frequency and low frequency can be separated. Low frequency features have high variation and contain useful information suitable for classification problems. DCT is computed of an image
As a output, a resultant vector of dimension
2.2.3 Dominant Rotated Local Binary Pattern (DRLBP)
Local Binary Pattern (LBP) has been used as an efficient feature descriptor by many researchers working in the field of computer vision [23]. It captures local information but suffers degradation in case of rotation of image dataset. Variants of LBP descriptor have also been proposed but rotation invariant feature descriptors lack local orientation information and results in deterioration in accuracy because of less of discriminative features. Dominant Rotated Local Binary Pattern (DRLBP) proposed by Mehta et al. [24] preserves local information along with rotation invariance. This technique not only captures local distribution of pattern but also holds information regarding types of patterns. These characteristics make it a more powerful descriptor. The DRLBP computes the feature in a local circular region by taking the difference of the central pixel with respect to its neighbors as presented in equation below:
Here
2.2.4 Shannon Entropy Along Kurtosis Features
The statistical features based on Shannon Entropy along Kurtosis are described in this section with detailed mathematical analysis. In the initial phase, we are calculating the entropy features of each image in the form of row and column pixel. As we have image
where,
where,
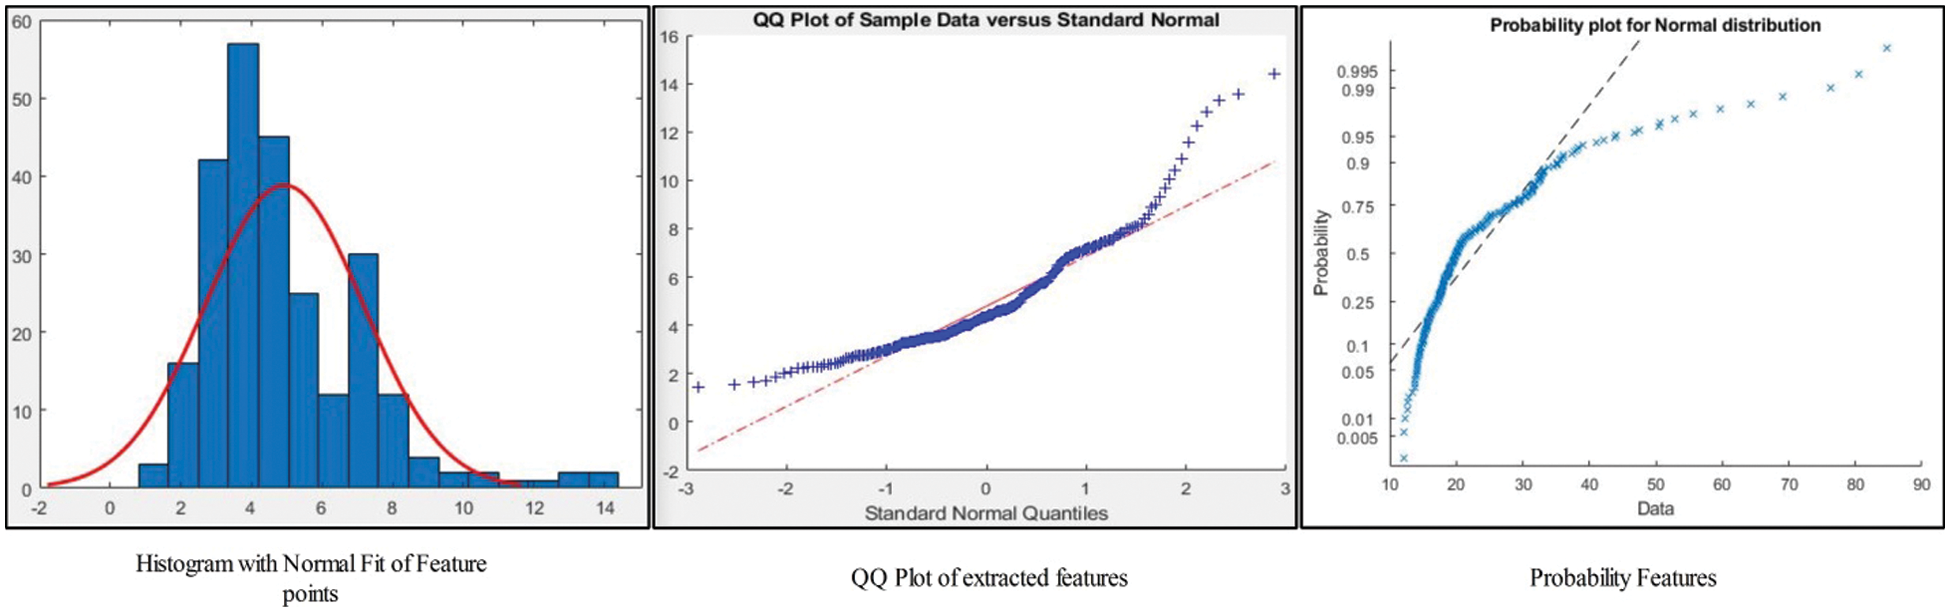
Figure 4: Representation of Entropy along Kurtosis features
2.3 Maximum Covariance Based Features Fusion
In the last few years, features fusion shows a huge performance in the area of medical imaging [25]. The main purpose of features fusion is to get the important information of one problem from several places to get more detailed information [26,27]. Many fusion techniques are presented in the literature and most of them are used in medical imaging [28,29]. In this work, we implemented a Maximum Covariance based technique for features fusion. This technique is working in parallel process. Initially, make the equal length of each vector based on their mean padding. After that, calculate the Maximum Covariance among pair of features. The positive maximum covariance value based features are shifted in a fused vector. Mathematically, this process is formulated as follows:
As we have four feature vectors names-DWT, DCT, DRLBP, and Shanon Entropy along Kurtosis, denoted by
Through MCA, perform the optimal feature patterns
where,
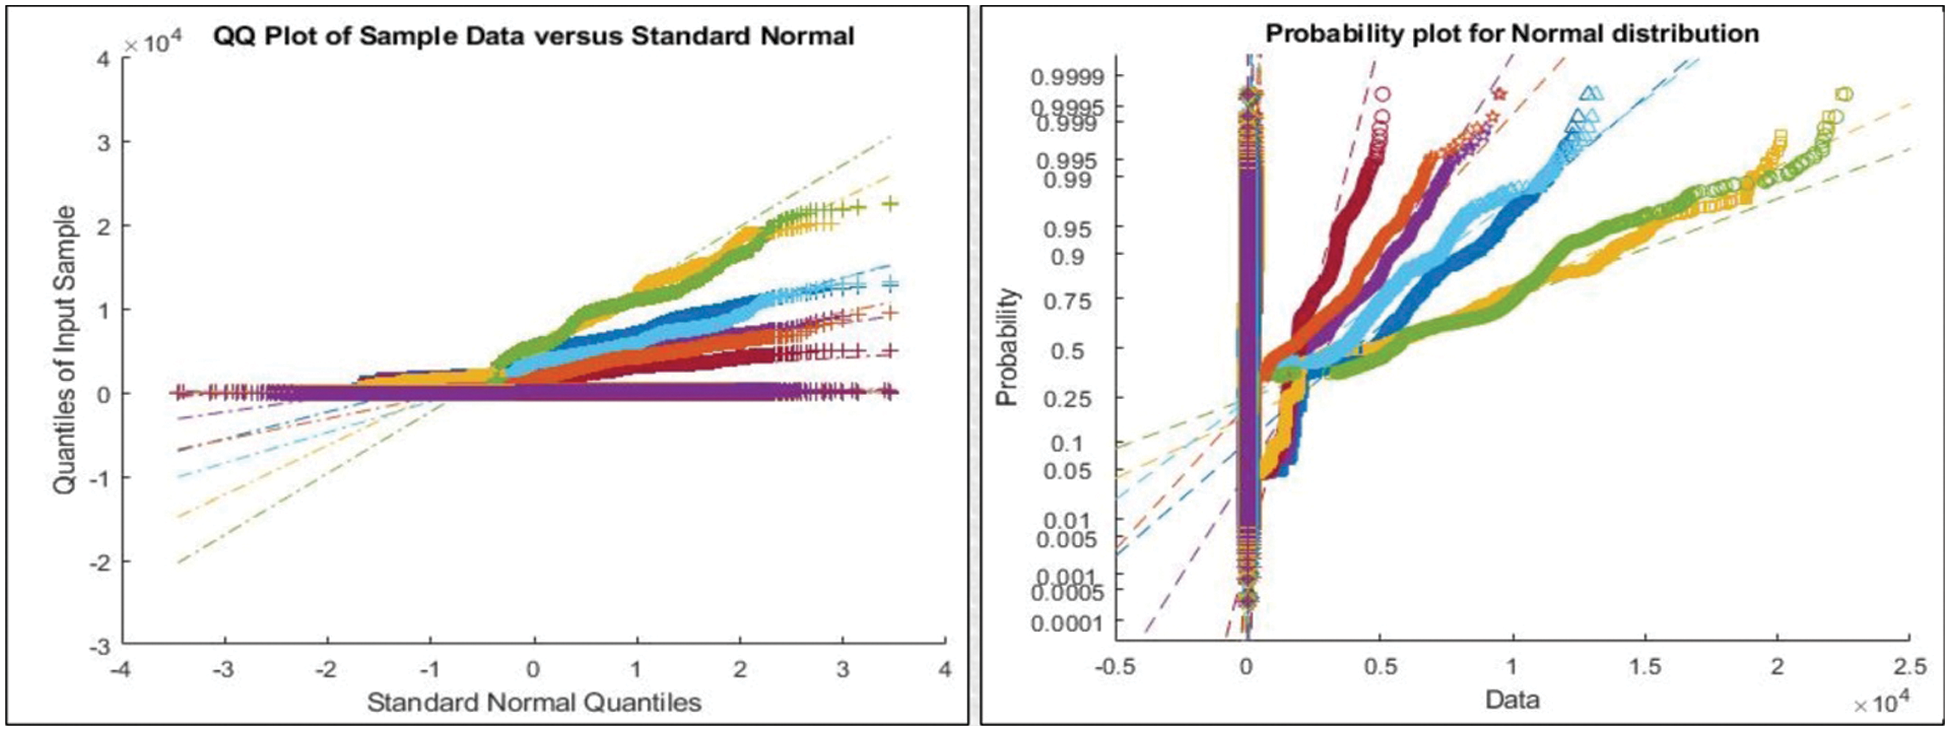
Figure 5: Representation of features after Maximum Covariance based Fusion
2.4 PSO Based Feature Optimization
PSO is an efficient and one of the most widely used optimization problem solving technique [30]. It was proposed and developed by James Kennedy and Russell Eberhart in 1995. Like GA, it is a population-based algorithm developed using the concept of evolutionary theory inspired by social behavior of bird flocking. Individuals in the population are called particles combined to form a swarm. Each particle in the swarm is identified by its position and velocity in a multi-dimensional search space. All the particles moves to discover their best position in the search space by keeping record of their previous best positions achieved and try to continue improvement in finding the global best position. Global best position is governed by fitness function. PSO tries to optimize the fitness function until the stopping criteria is met. PSO starts with the initialization of random population of n-individuals known as particles. In this work, we have fused feature vector of dimension
Here, value of
Here w is weight inertia parameter and is used to control the impact of previous velocity in the new direction. It creates a balance between exploration and exploitation. Small value of w decelerates the particle, whereas large values adds diversity and causes exploration to occur.
where,
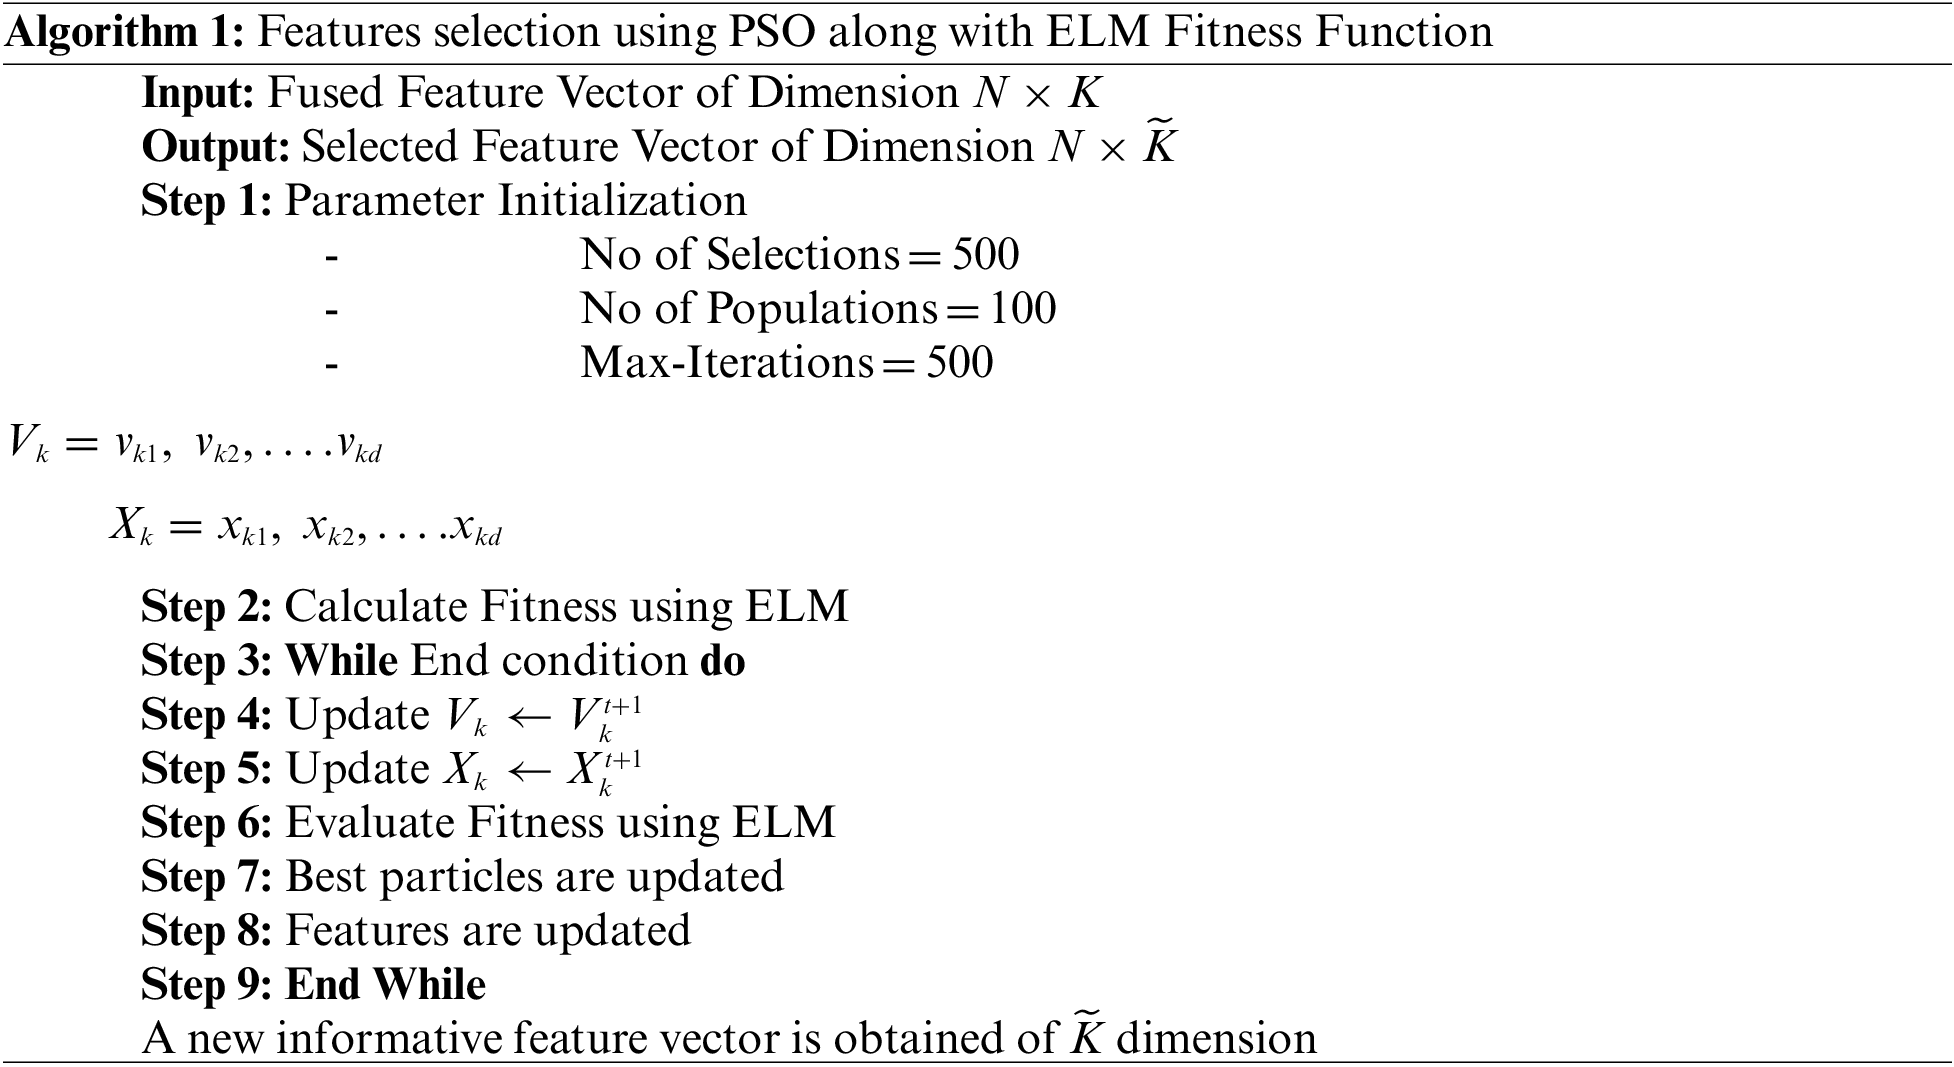
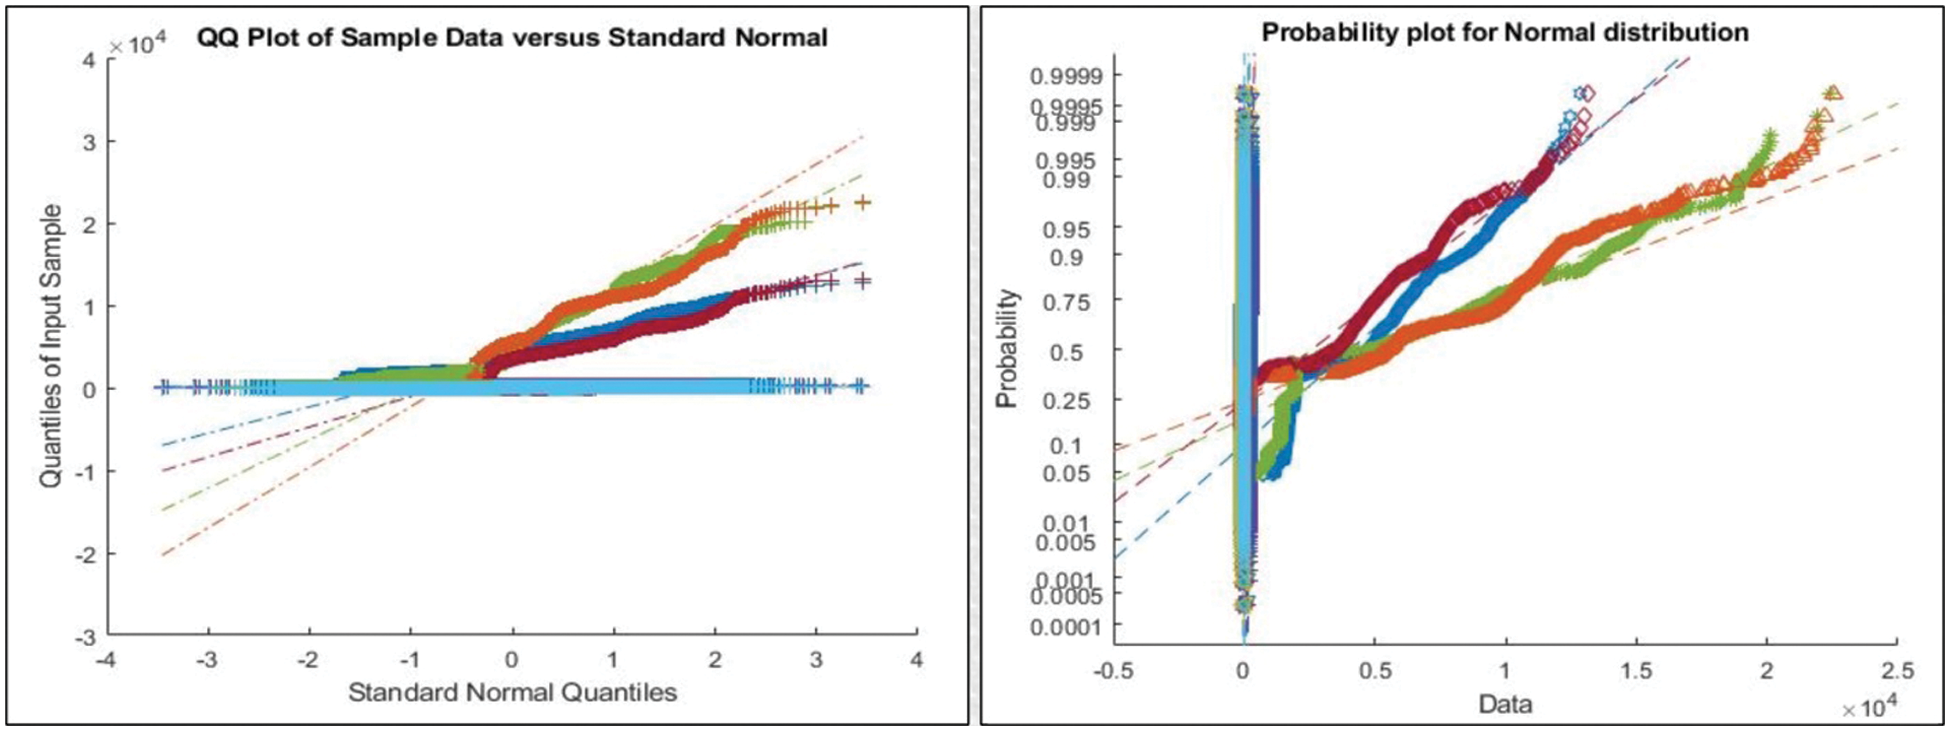
Figure 6: Representation of features after applying PSO for feature selection
The detailed experimental results are presented in this section with detailed quantitative measures and graphical plots. For detailed analysis of proposed results, two steps are followed-fusion of features and most discriminant selected features. The totals of 40 patients Chest CT Scans are utilized to evaluate the proposed method. Several performance measures are considers like sensitivity rate, specificity rate, precision of COVID samples, F1-Score, AUC, error rate in terms of FNR, and Accuracy. These measures are calculated for only testing data. As in this article, we consider the 50% images for training the proposed scheme and rest of them for testing. A detailed training process proposed method as well as testing process is shown in Fig. 7. In this figure, it is shown that the fused features are optimized through PSO and trained SVDD model. After that, testing step is performed and same features are extracted and fused. Later, PSO is applied and optimize features that are passed in trained model. The next step is most important called features matching and in the output, a predicted labeled output is attained. The proposed method is implemented in MATLAB2020b using Personal Desktop Computer of 16GB RAM, 1 T Hard, 256 SSD, and 8 GB of Graphics Card.
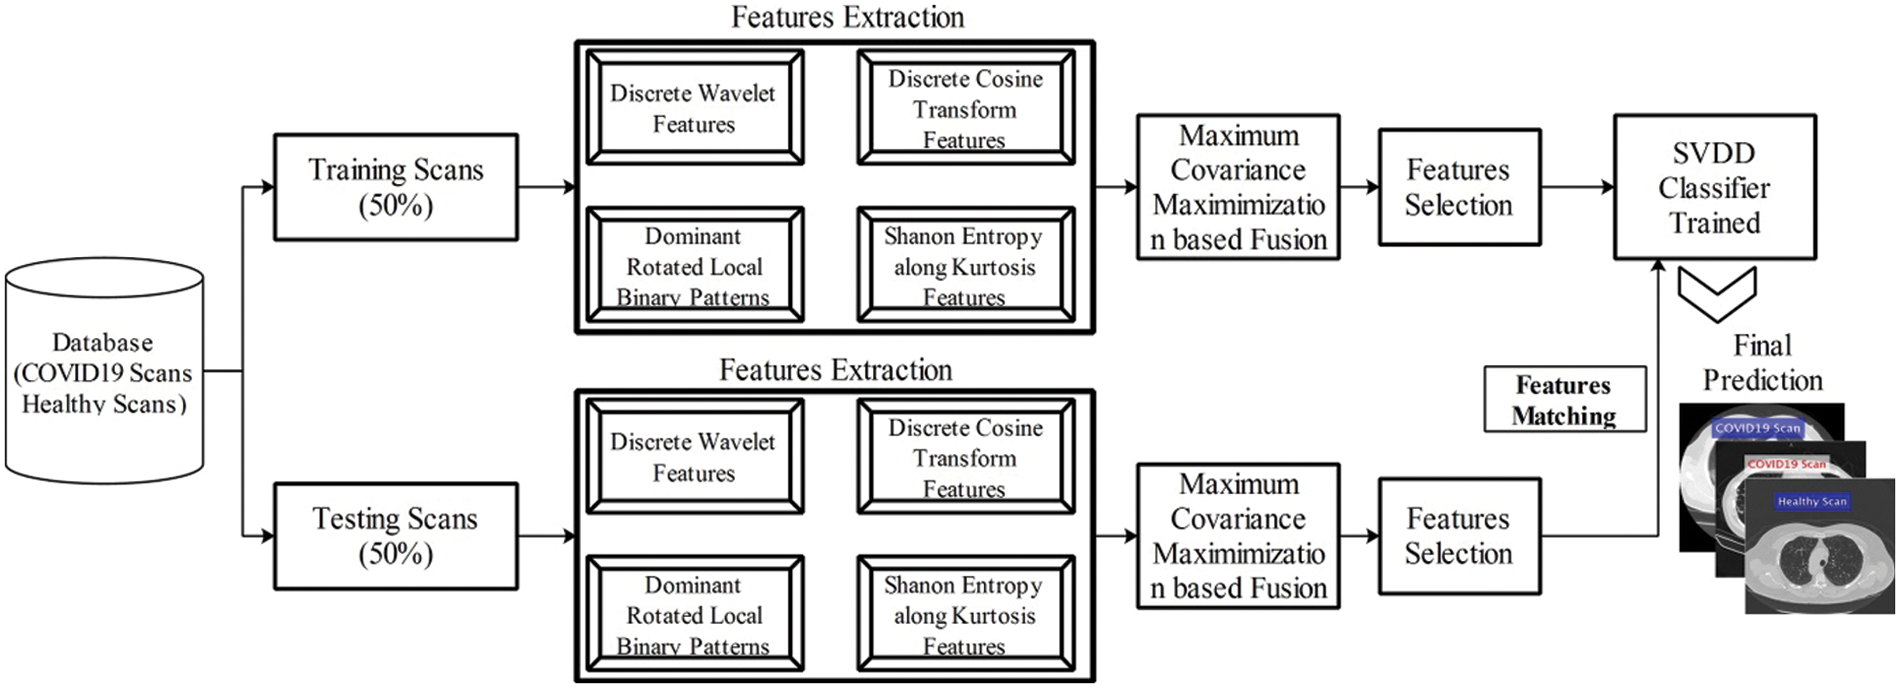
Figure 7: Training and testing process of proposed system
3.1 Quantitative Results of Features Fusion Step
This section summarizes the proposed features fusion results. Before discussion of the efficiency of fusion step, we talk about separate features efficiency. We embed original features in PSO and computed accuracy on based classifier. On the base classifier, the computed accuracies are 76.4%, 72.9%, 68.3%, and 76.77% for DWT, DCT, DRLBP, and Entropy-along-Kurtosis. However, tis accuracy is not enough; therefore, we implemented a fusion approach based on maximum covariance. The results of this process are given in Tab. 1. In this table, it is shown that SVDD is employing as a base classifier and other classifiers are used for further analysis of proposed method. The maximum reported accuracy is 88.6%, whereas the other calculated measures are sensitivity (88.5%), specificity (91.0%), precision (88.5%), F1-Score (89.73%), area under the curve (AUC) is 0.99, and 11.5% FN rate, respectively. Fig. 8 confirms the accuracy of proposed method. In this figure, it is illustrated that COVID19 scans are 86% correctly predicted, whereas healthy scans are 91% appropriately predicted. The error rate of each class is 14% and 9%. Also, the receiver operating characteristic (ROC) plots are also added and illustrated in Fig. 9. From this figure, we can verify the AUC of proposed method using fusion approach. These measures are also calculated on other selected classifiers like Fine Tree, linear discriminant analysis (LDA), Gaussian naïve bayes (GNB), kernel naïve bayes (KNB), linear support vector machine (LSVM), cubic SVM (CSVM), fine K-nearest neighbor (FKNN), and Ensemble tree (E-Tree), where the attained accuracies on each of them are 86.7%, 88.3%, 88.5%, 81.1%, 87.7%, 87.2%, 86.8%, and 86.2%, respectively. The sensitivity and specificity rates of these classifiers are (86.5%, 84.0%), (88.5%, 90%), (88.55%, 90.0%), (81.0%, 67.0%), (87.5%, 90%), (87.0%, 88%), (87%, 79%), and (86.0%, 90%), respectively. The F1 score, false negative rate (FNR), AUC, and precision rate are plotted in Fig. 10. From this figure, it is shown that the efficiency of KNB is low as compared to other classifiers. Moreover, it is also shown that the proposed fusion process gives tremendous accuracy as compared to single feature vector.
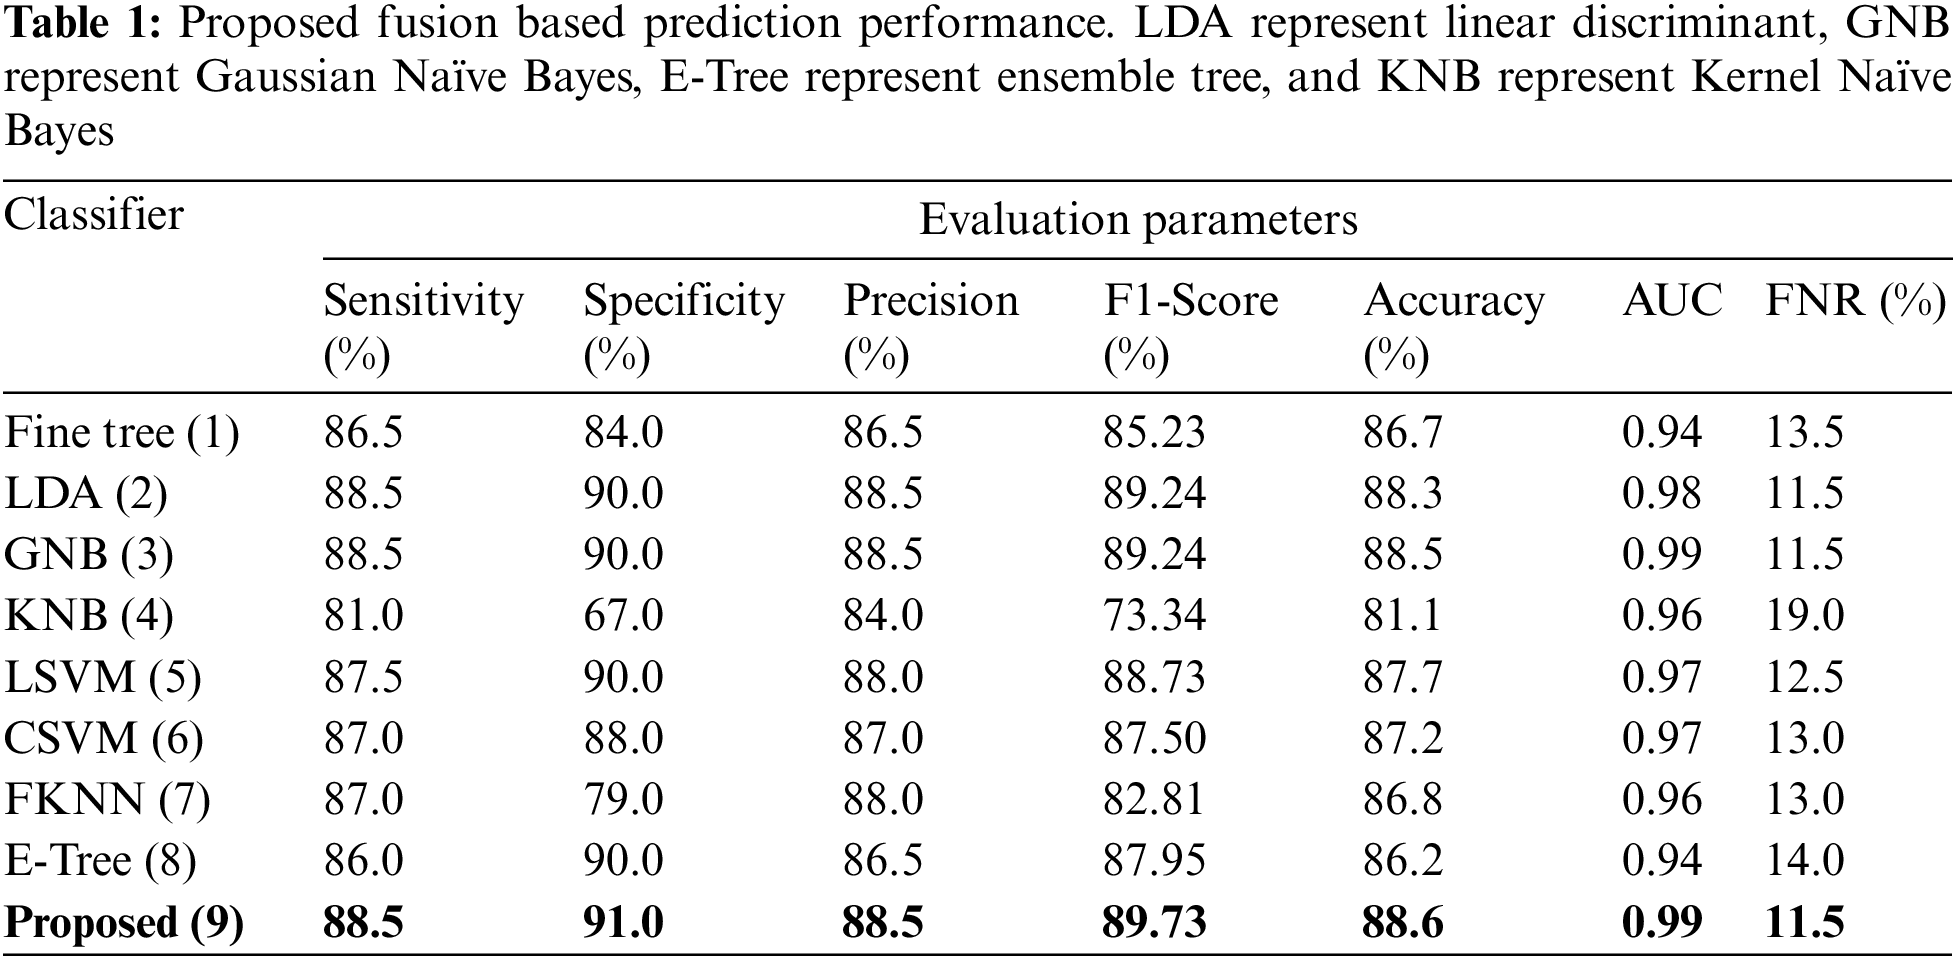

Figure 8: Confusion matrix of proposed features fusion step
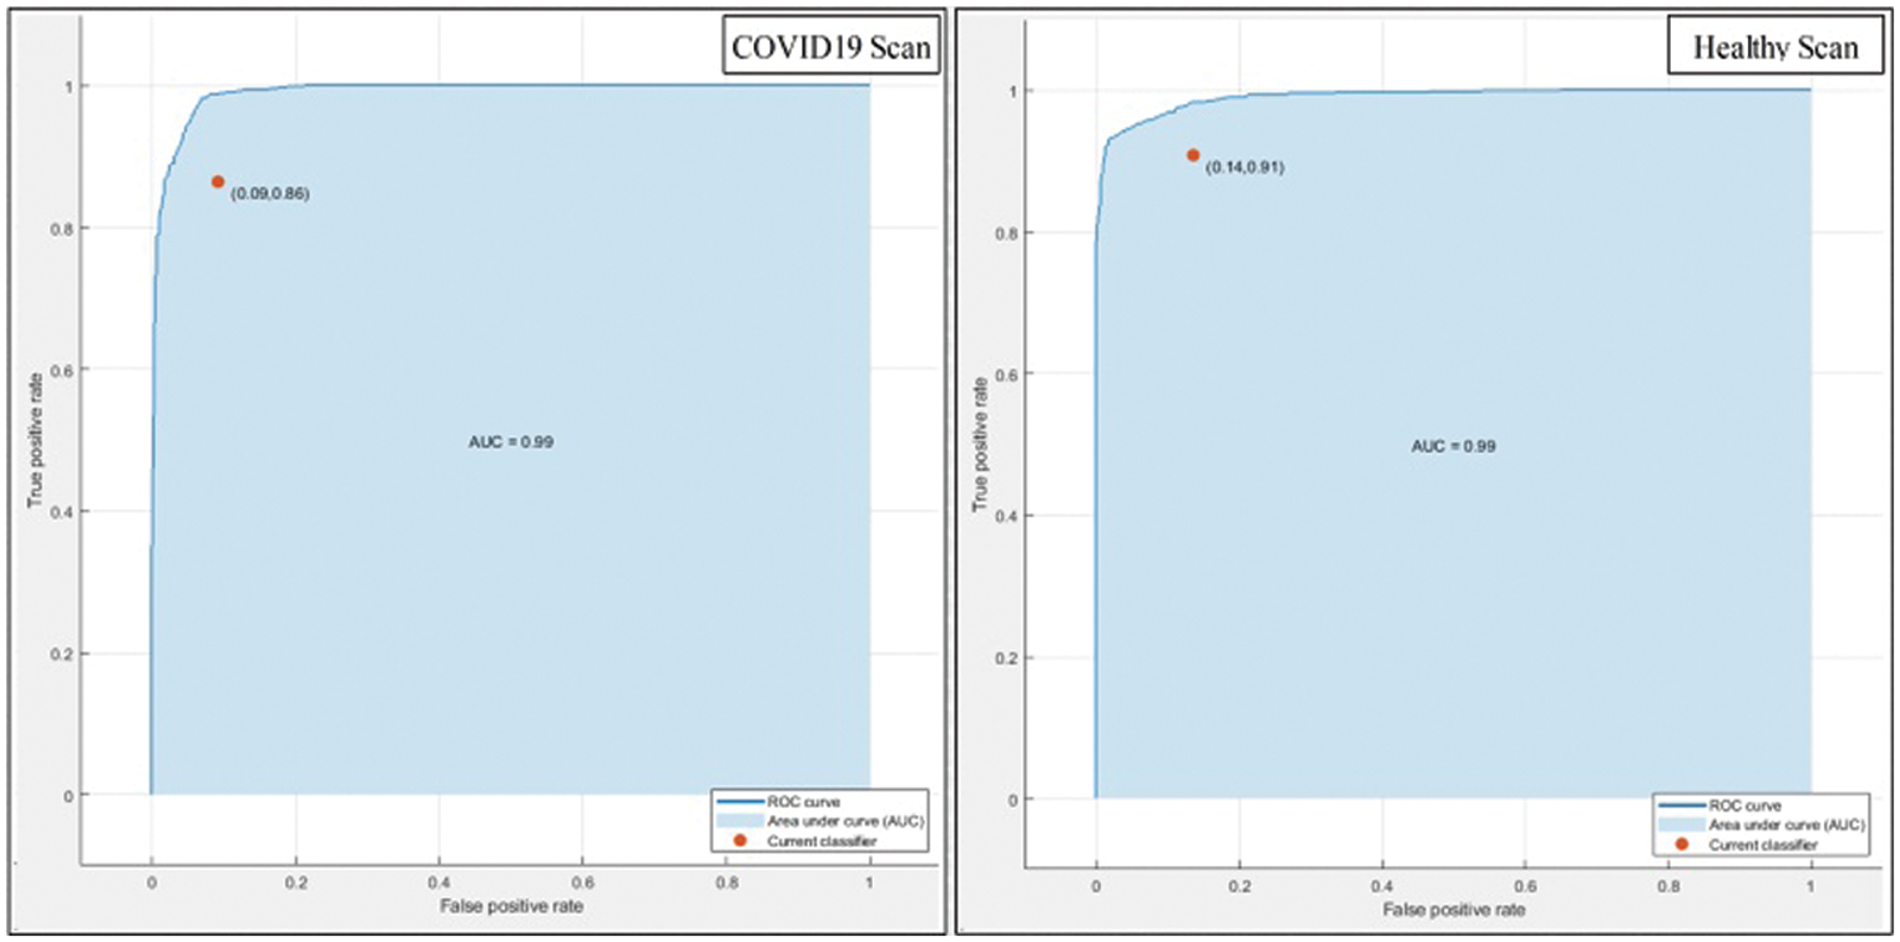
Figure 9: ROC plots of proposed method after fusion of multiple features
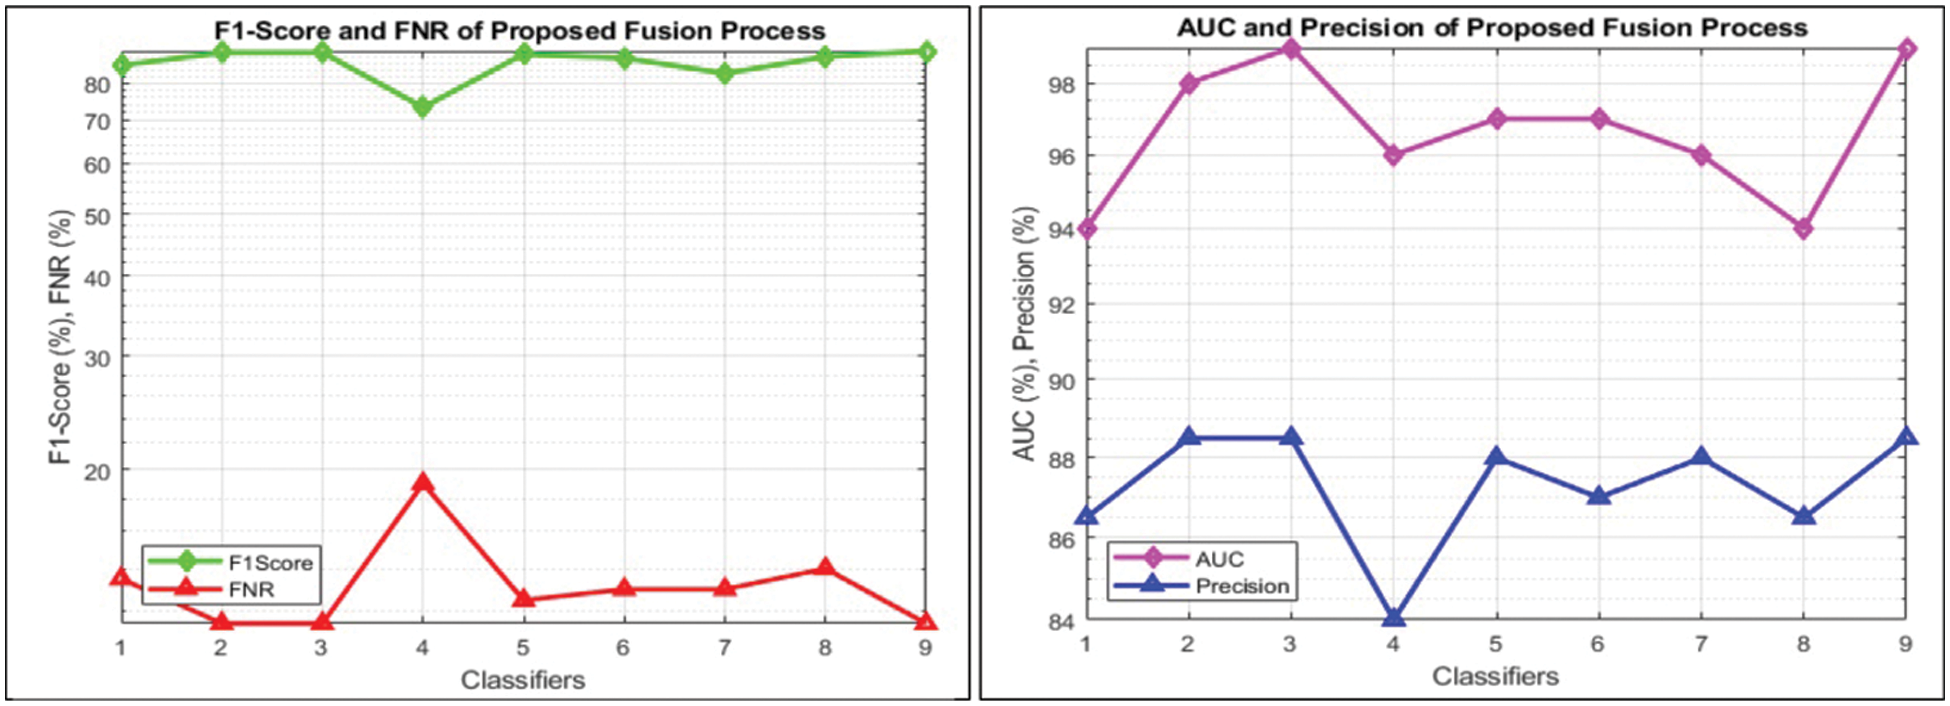
Figure 10: Visual representation of calculated performance measures for all classifiers
3.2 Quantitative Results of Features Selection
This section summarizes the results of proposed features selection using Improved PSO algorithm. Tab. 2 reviews the quantitative results. The highest accuracy after employing this step is 93.1% which is increased 4.6% as compared to fusion steps. The sensitivity and specificity of proposed method are 93.2% and 92% which are verified through Fig. 11, in terms of confusion matrix. In this figure, it is shown that the correctly predicted COVID19 scans are 94% and healthy scans 92%. However, the error rate is 6% and 8%. If we compared this figure with Fig. 8, then it is perceived that the prediction rate of the selection step is increased as compared to fusion step. ROC plots are also illustrated in Fig. 12, which supports the attained AUC. The comparison of proposed accuracy is conducted with few other classification techniques like Fine Tree, LDA, GNB, and name a few more and achieved accuracies of 92%, 92.1%, 92.8%, 92.6%, 92.9%, 91.8%, 90.8%, and 92.3%, respectively. Also, the calculated values of other measures like sensitivity and specificity are (92%, 90%), (92%, 90%), (92.55%, 88%), (92.4%, 96%), (93%, 95%), (92%, 91%), (91%, 89%), and (92.5%, 90%), respectively. These values are calculated for top-to-bottom classifiers except SVDD (proposed). Moreover, F1-score, FNR, precision, and error rates are plotted in Fig. 13, that supports the authenticity of features selection performance. If we compared these measures with Tab. 1 and Figs. 11‐13 then it can be show that the performance of selection method is improved for all classifiers. From results, we can easily say that the performance of an automated system is always based on the quality of features. If features are relevant to the problem, then results are improved, otherwise degrades.
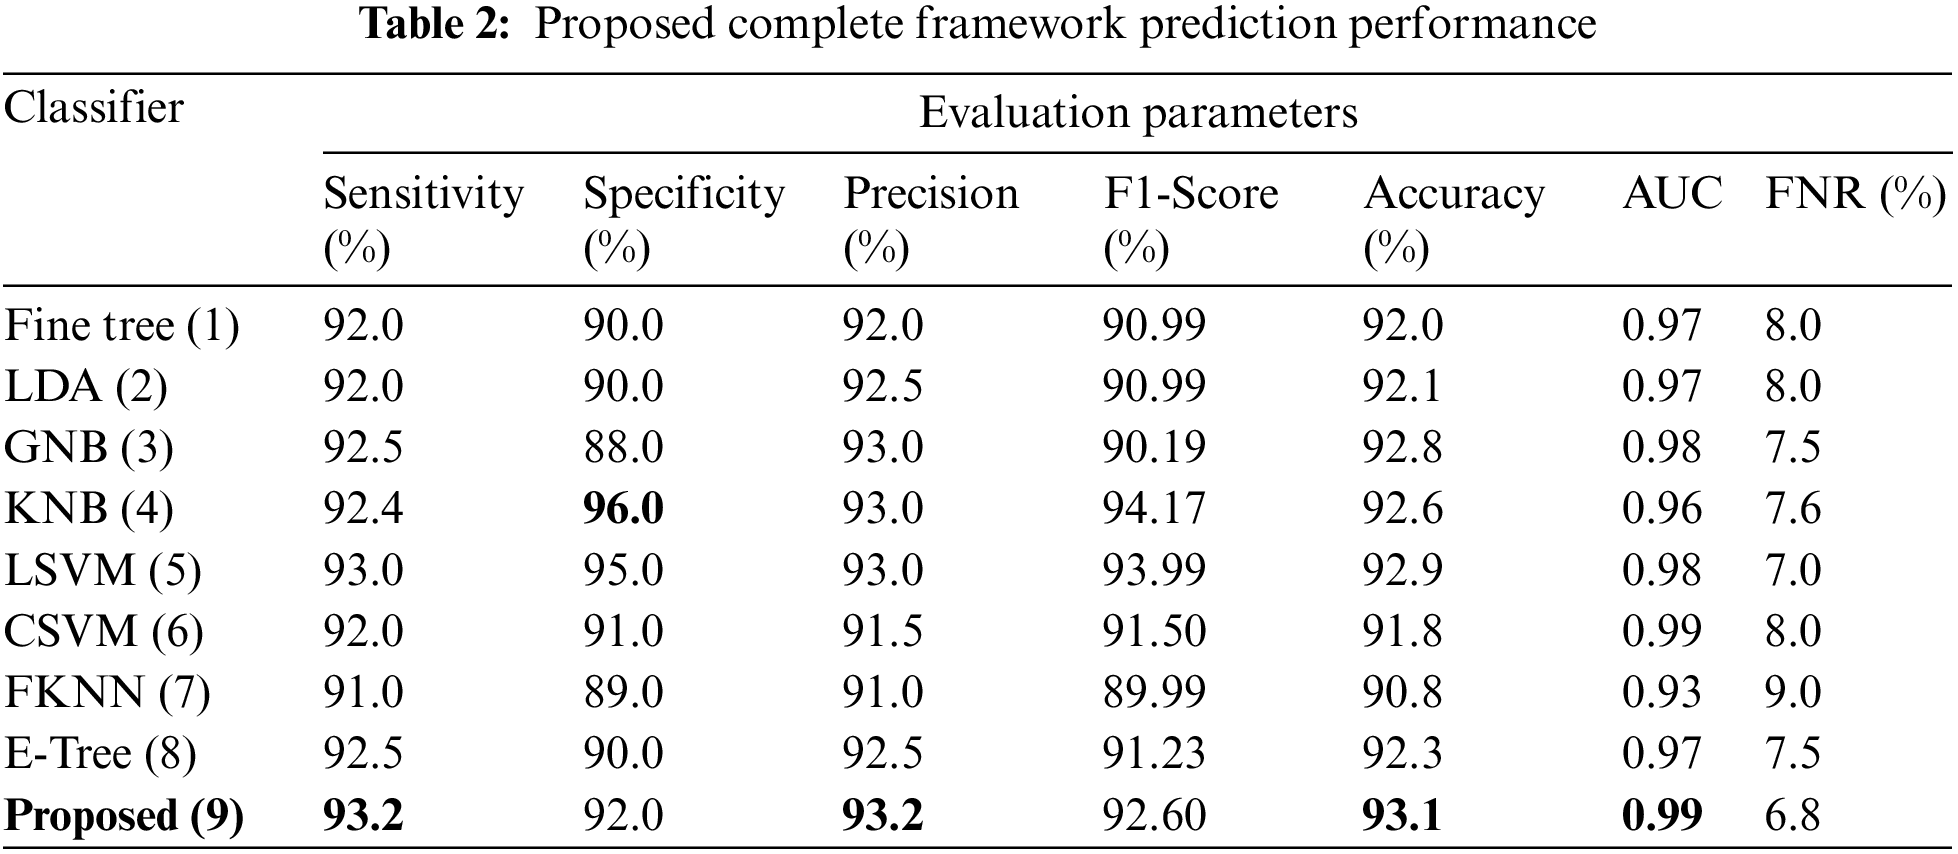
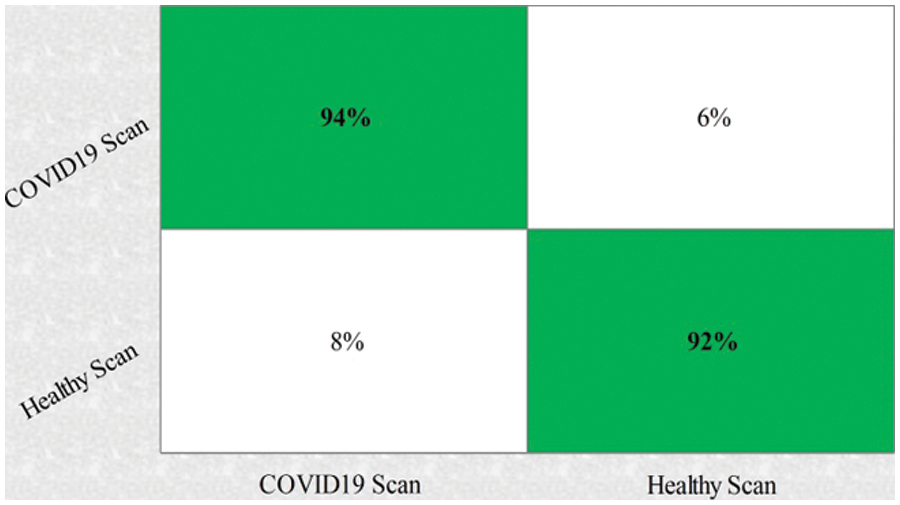
Figure 11: Confusion matrix of SVDD using proposed framework
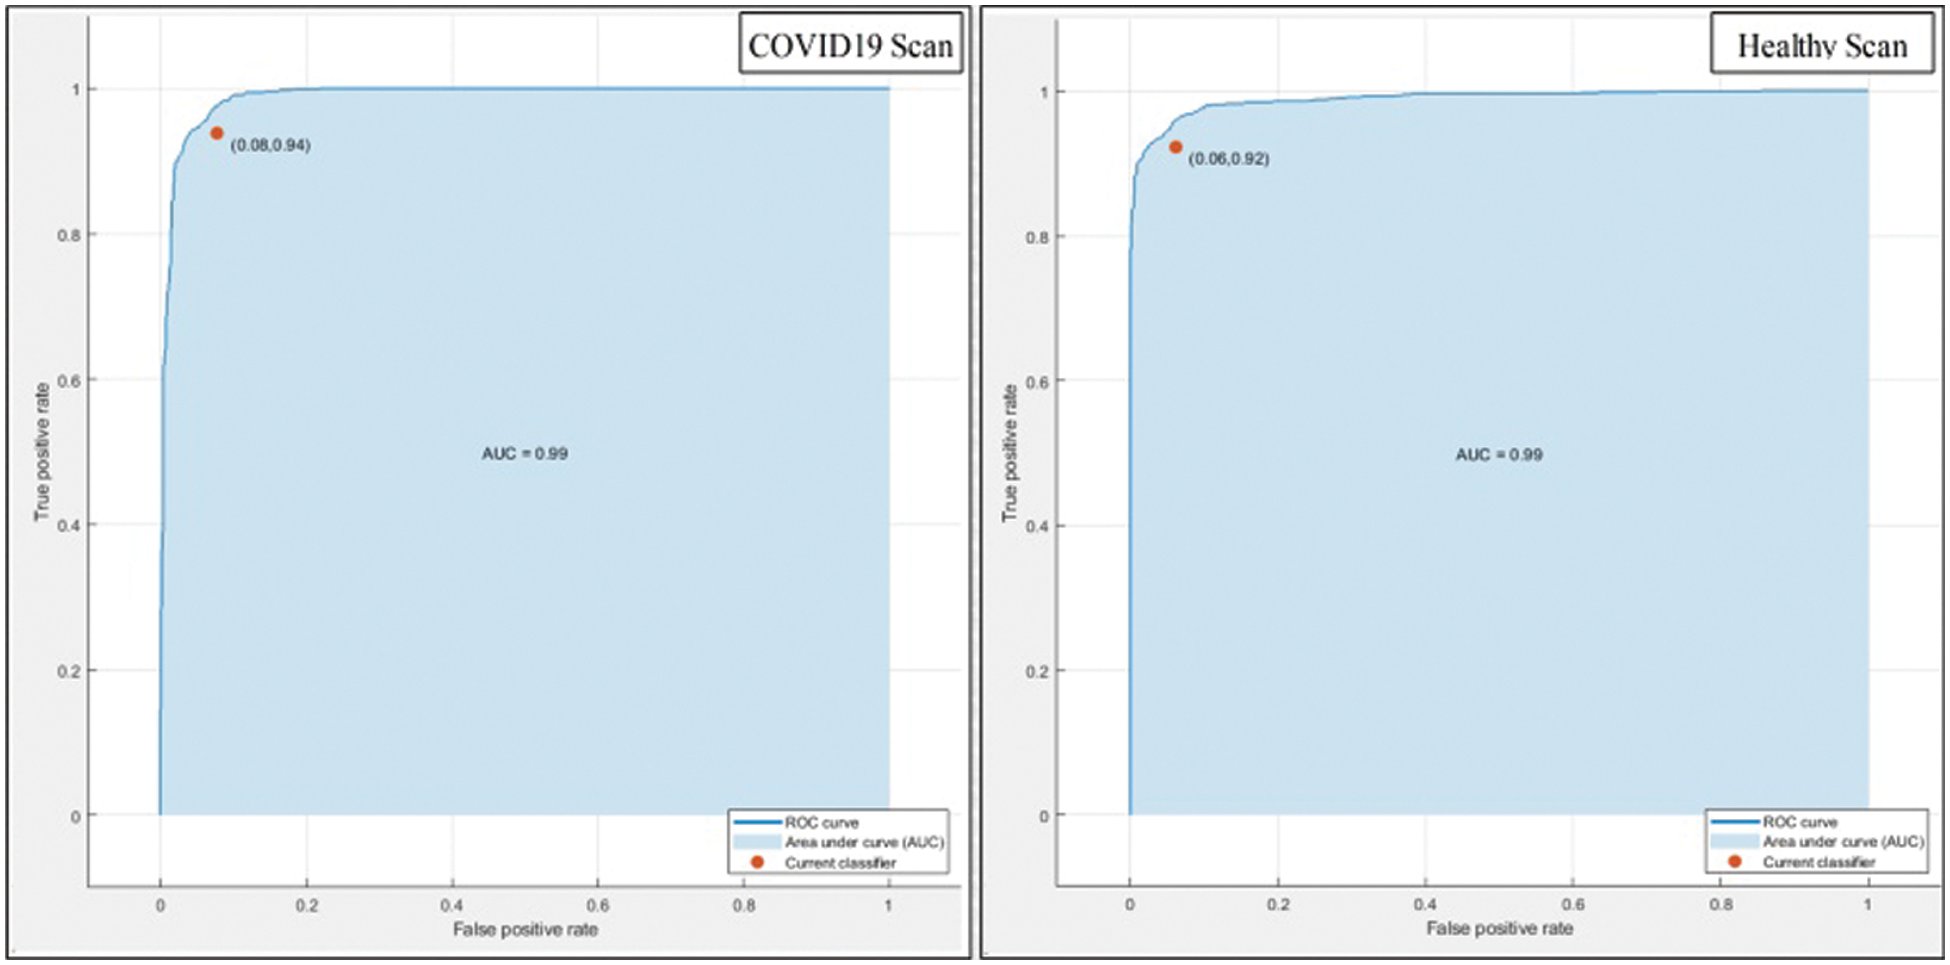
Figure 12: ROC plots of proposed method after features selection
This section presented the detailed discussion of presented method in terms of calculated performance metrics and visual plots. As described in the introduction section that we are dealing with Chest CT scans for prediction of COVID19 positive and healthy images. These sample scans are showing in Fig. 1. The main problem is classifying these scans using computer vision. For this purpose, we proposed a, integrated model based on multiple features fusion and improved PSO based selection. Fig. 2 shows the main architecture diagram. In this figure, it is showing that multiple features are extracted and fused in one matrix using Maximum Covariance approach. The fusion process improves the image information for correct prediction; however, it is chance to add many irrelevant features as visual representation is showing in Fig. 5. The quantitative results are presented in Tab. 1, which shows the maximum accuracy is 88.6%. Figs. 8, 9 and 10 also support the proposed accuracy. Later, improved PSO is applied on fused feature matric and selects the most informative features. Visually, these features are showing in Fig. 6. From this figure, it is shown that the number of features is minimized after applying improved PSO. Tab. 2 shows the quantitative results of results of proposed selection method with the accuracy of 93.1%. Also, Figs. 11, 12 and 13 support this accuracy. This accuracy is improved as compared to fusion step. For comparison, we compute the accuracy of each feature type separately and then compare with fusion and selection process. Fig. 14 shows the feature based comparison. In this figure, it is observed that the accuracy of original extracted features like DWT, DCT, DRLBP, and Shanon entropy along Kurtosis (SEaK) is 79.8%, 83.2%, 80.6%, and 82.1%, respectively. However, after the fusion process, 6% accuracy is increases. Further, the selection process, also improves the features which effect show in the accuracy. This last step, selects only informative features that improves the accuracy of correct prediction. A few predicted results by presented system are shows in Fig. 15. These results are obtained in the testing process. Overall, proposed system give significant performance for prediction of COVID19 scans.
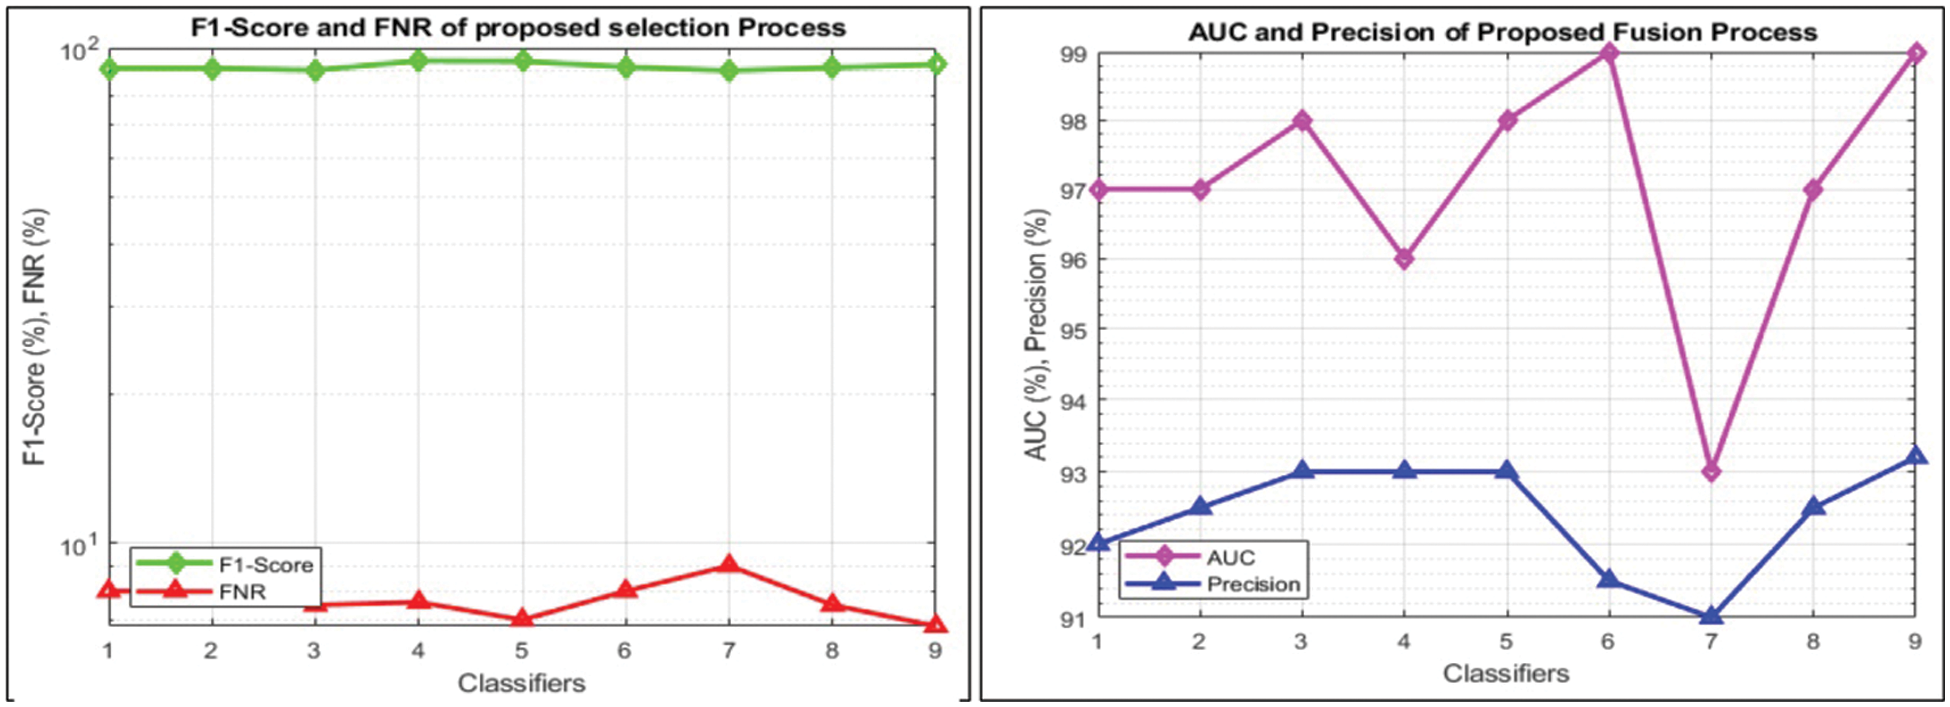
Figure 13: Visual representation of calculated performance measures after features selection for all classifiers
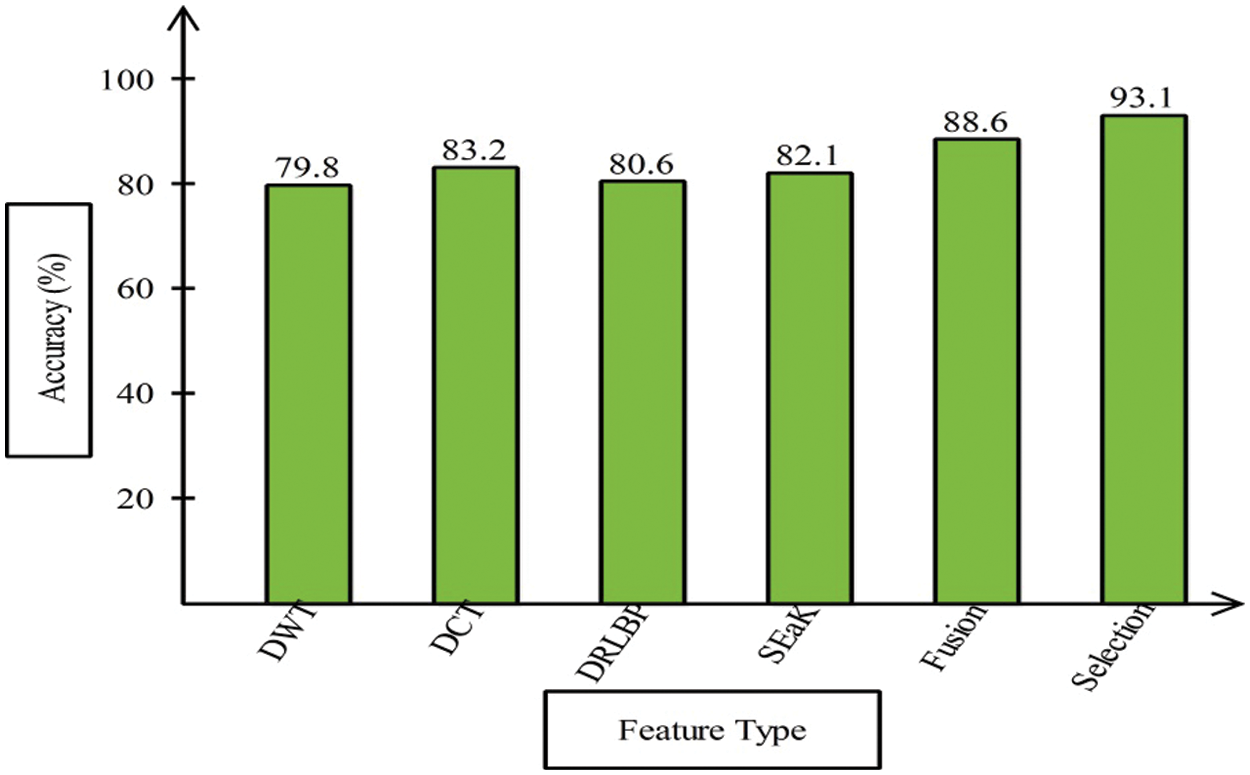
Figure 14: Features based comparison
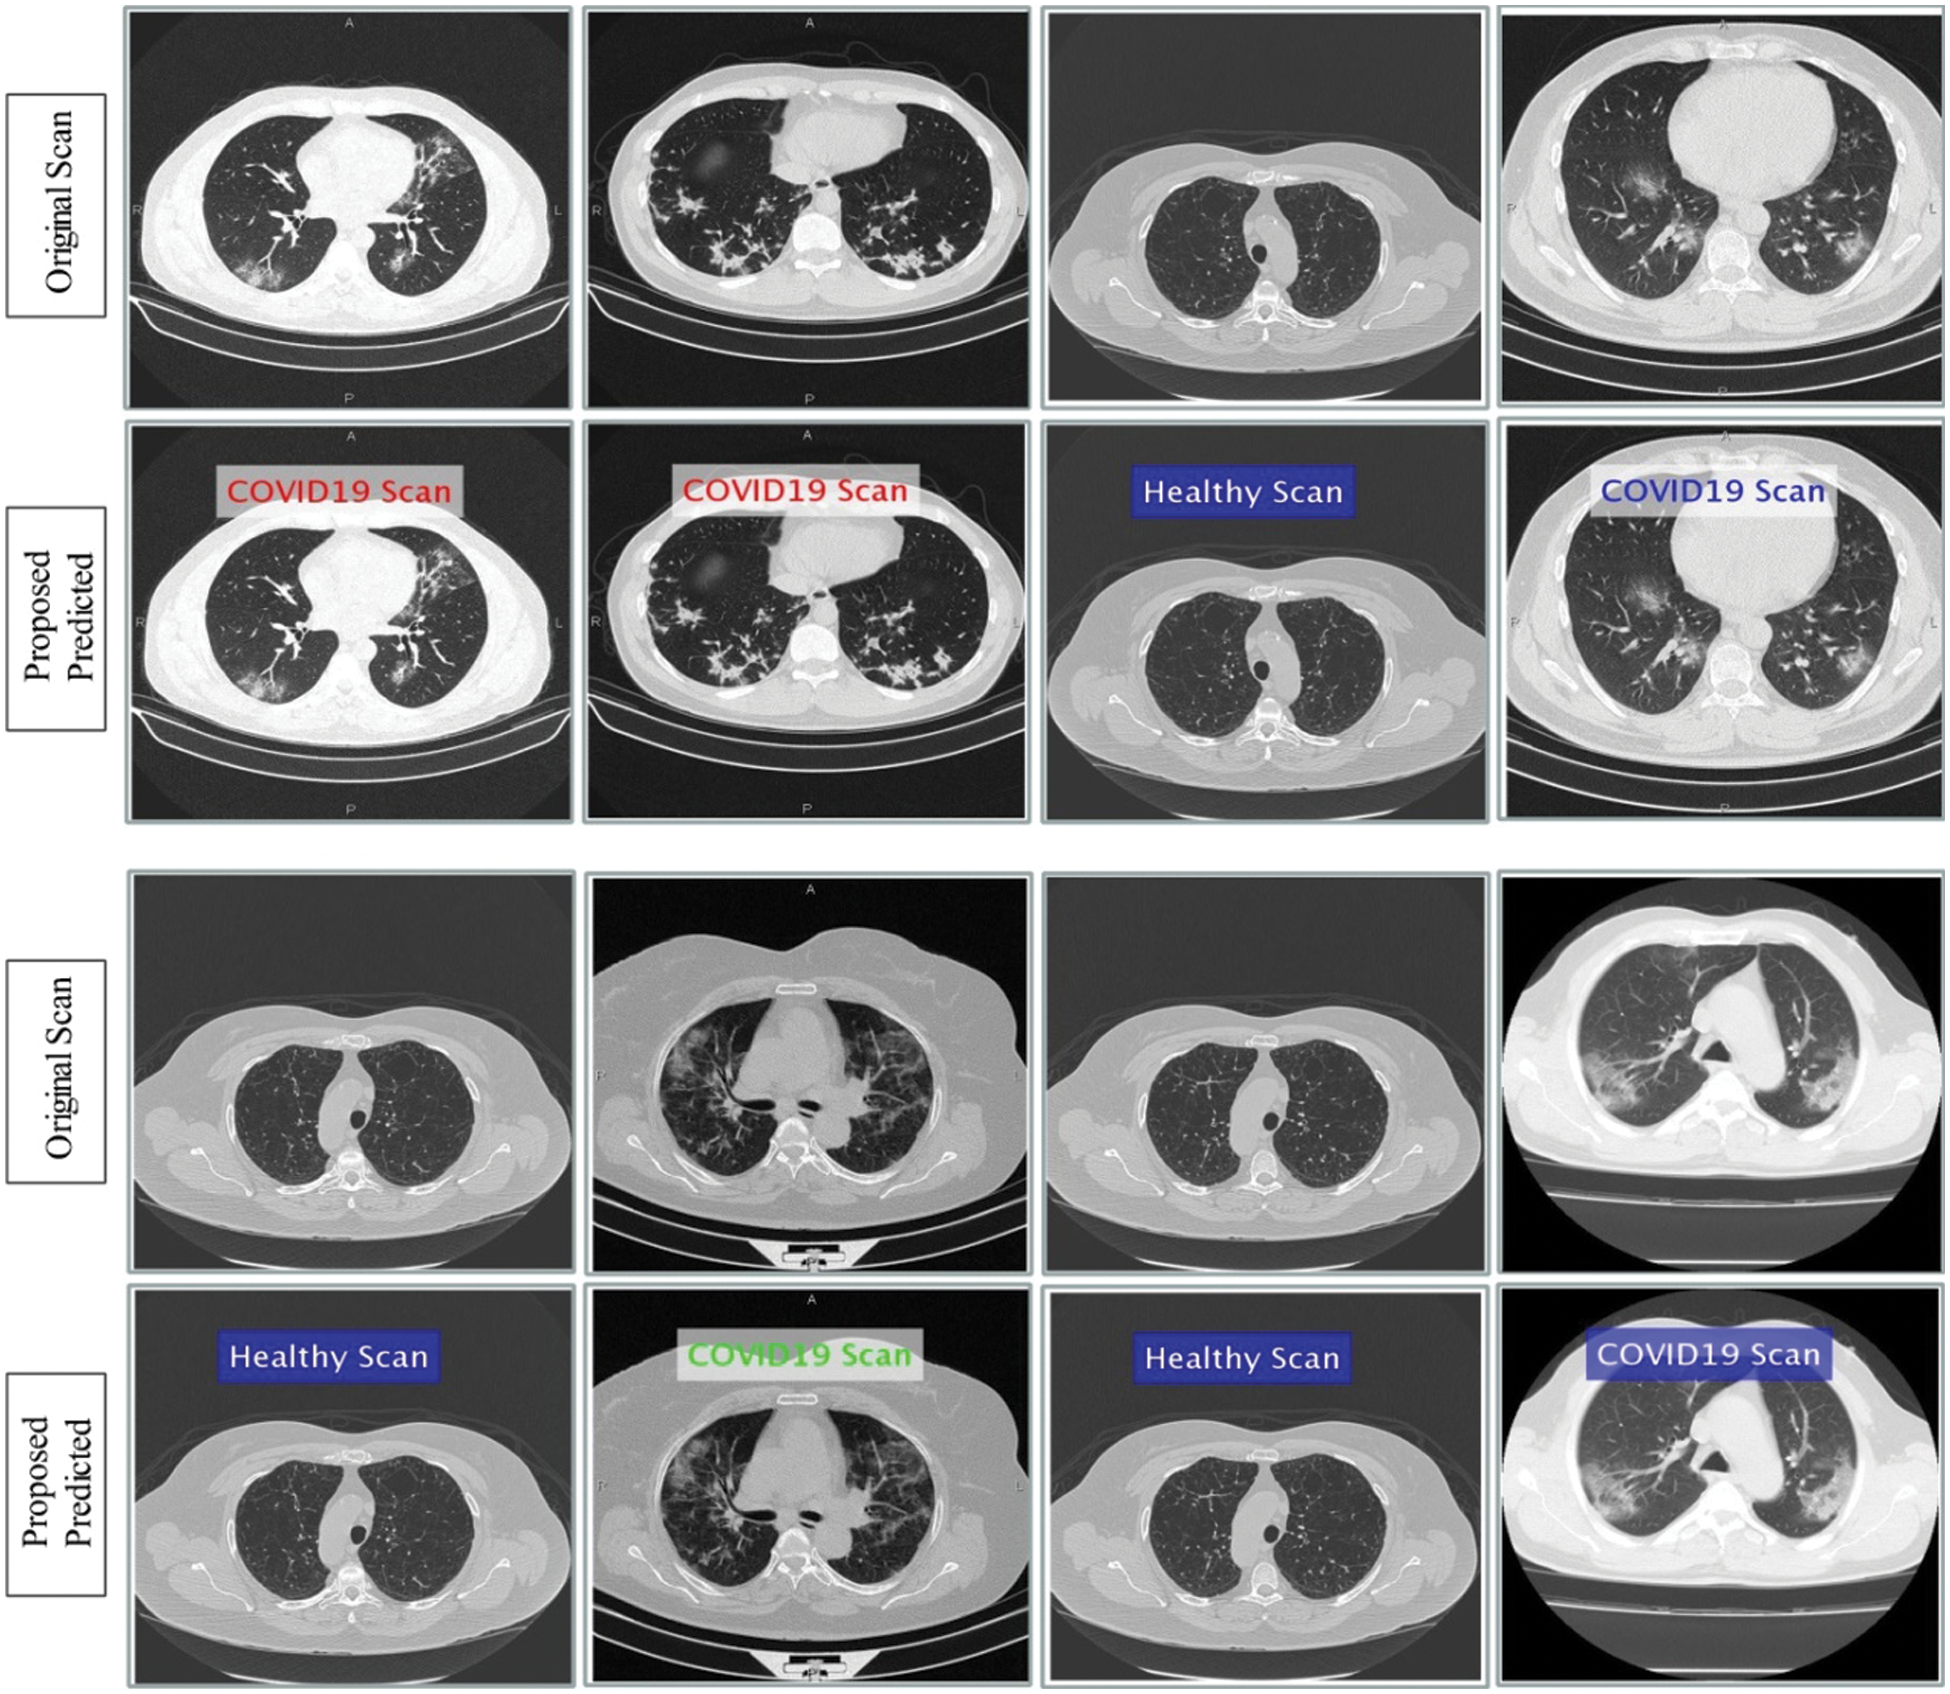
Figure 15: Prediction of COVId19 positive and healthy Chest CT Scans using proposed method
Using CT images, this paper presents an automated method for predicting COVID19 Positive and Healthy Scan. The steps are as follows: database preparation, multiple feature extraction, feature fusion, selection of most informative features, and prediction. Four types of features are computed along Kurtosis such as DWT, DCT, DRLBP, and Shanon entropy (SEaK). Because these features alone did not provide enough accuracy, we fused them all together using the Maximum Covariance method. The fused feature matrix boosts prediction accuracy. However, it includes several redundant and inappropriate features. For this purpose, an improved PSO algorithm is used, yielding a unique feature vector. Finally, the SVDD classifier is used to make the final prediction. The outcome demonstrates the improved accuracy of the presented method. Based on the results, we conclude that the fusion process is important to increase the information against one image for correct prediction but it is not guaranteed that all features are important. Moreover, it is also concluded that the selection process improves the feature representation and prediction accuracy. In the future, most recent optimization techniques shall opt for better accuracy and minimum computational time [33–36].
Funding Statement: This research was supported by Korea Institute for Advancement of Technology(KIAT) grant funded by the Korea Government(MOTIE) (P0012724, The Competency Development Program for Industry Specialist) and the Soonchunhyang University Research Fund.
Conflicts of Interest: The authors declare that they have no conflicts of interest to report regarding the present study.
References
1. B. Yount, K. M. Curtis, E. A. Fritz, L. E. Hensley and P. B. Jahrling, “Reverse genetics with a full-length infectious cDNA of severe acute respiratory syndrome coronavirus,” Proceedings of the National Academy of Sciences, vol. 100, no. 5, pp. 12995–13000, 2003. [Google Scholar]
2. S. Zhao, Q. Lin, J. Ran, S. S. Musa and G. Yang, “Preliminary estimation of the basic reproduction number of novel coronavirus (2019-nCoV) in China, from 2019 to 2020: A data-driven analysis in the early phase of the outbreak,” International Journal of Infectious Diseases, vol. 92, no. 3, pp. 214–217, 2020. [Google Scholar]
3. A. Vabret, J. Dina, S. Gouarin, J. Petitjean and F. Freymuth, “Detection of the new human coronavirus HKU1: A report of 6 cases,” Clinical Infectious Diseases, vol. 42, no. 11, pp. 634–639, 2006. [Google Scholar]
4. W. Gao, P. Veeresha, H. M. Baskonus, D. Prakasha and P. Kumar, “A new study of unreported cases of 2019-nCOV epidemic outbreaks,” Chaos, Solitons & Fractals, vol. 138, no. 31, pp. 10–29, 2020. [Google Scholar]
5. W. Shui-Hua, V. Govindaraj, S. L. Fernandes, Z. Zhu and Z. Yu-Dong, “Deep rank-based average pooling network for COVID-19 recognition,” Computers, Materials & Continua, vol. 70, no. 2, pp. 2797–2813, 2022. [Google Scholar]
6. R. Vaishya, M. Javaid, I. H. Khan and A. Haleem, “Artificial intelligence (AI) applications for COVID-19 pandemic,” Diabetes & Metabolic Syndrome: Clinical Research & Reviews, vol. 14, no. 1, pp. 337–339, 2020. [Google Scholar]
7. Z. Malki, E. S. Atlam, A. Ewis, G. Dagnew and O. A. Ghoneim, “The COVID-19 pandemic: Prediction study based on machine learning models,” Environmental Science and Pollution Research, vol. 28, no. 4, pp. 40496–40506, 2021. [Google Scholar]
8. E. S. Atlam, A. Ewis, M. Abd El-Raouf, O. Ghoneim and I. Gad, “A new approach in identifying the psychological impact of COVID-19 on university student’s academic performance,” Alexandria Engineering Journal, vol. 61, no. 21, pp. 5223–5233, 2022. [Google Scholar]
9. M. Alhaisoni, U. Tariq, N. Hussain, A. Majid and R. Damaševičius, “COVID-19 case recognition from chest CT images by deep learning, entropy-controlled firefly optimization, and parallel feature fusion,” Sensors, vol. 21, no. 11, pp. 7286, 2021. [Google Scholar]
10. M. Farooq and A. Hafeez, “Covid-resnet: A deep learning framework for screening of covid19 from radiographs,” Sensors, vol. 21, no. 7, pp. 14–39, 2020. [Google Scholar]
11. P. Afshar, S. Heidarian, F. Naderkhani, A. Oikonomou and K. N. Plataniotis, “Covid-caps: A capsule network-based framework for identification of covid-19 cases from x-ray images,” Applied Sciences, vol. 19, no. 5, pp. 1–9, 2020. [Google Scholar]
12. R. M. Pereira, D. Bertolini, L. O. Teixeira, C. N. Silla Jr and Y. M. Costa, “COVID-19 identification in chest X-ray images on flat and hierarchical classification scenarios,” Computer Methods and Programs in Biomedicine, vol. 7, no. 3, pp. 10–32, 2020. [Google Scholar]
13. T. Ozturk, M. Talo, E. A. Yildirim, U. B. Baloglu and U. R. Acharya, “Automated detection of COVID-19 cases using deep neural networks with X-ray images,” Computers in Biology and Medicine, vol. 31, no. 3, pp. 37–52, 2020. [Google Scholar]
14. A. Amyar, R. Modzelewski and S. Ruan, “Multi-task deep learning based CT imaging analysis for COVID-19: Classification and segmentation,” MedRxiv, vol. 3, no. 1, pp. 1–14, 2020. [Google Scholar]
15. E. Luz, P. L. Silva, R. Silva and G. Moreira, “Towards an efficient deep learning model for COVID-19 patterns detection in x-ray images,” ArXiv Preprint, vol. 17, no. 6, pp. 1–17, 2020. [Google Scholar]
16. M. Rahimzadeh and A. Attar, “A new modified deep convolutional neural network for detecting COVID-19 from x-ray images,” ArXiv Preprint, vol. 15, no. 2, pp. 1–12, 2020. [Google Scholar]
17. S. H. Kassani, P. H. Kassasni, M. J. Wesolowski and K. A. Schneider, “Automatic detection of coronavirus disease (COVID-19) in x-ray and CT images: A machine learning-based approach,” ArXiv Preprint, vol. 12, no. 5, pp. 1–10, 2020. [Google Scholar]
18. H. H. Syed, U. Tariq, A. Armghan, F. Alenezi and J. A. Khan, “A rapid artificial intelligence-based computer-aided diagnosis system for COVID-19 classification from CT images,” Behavioural Neurology, vol. 21, no. 4, pp. 1–21, 2021. [Google Scholar]
19. D. Lyn, “COVID-19 data by world health organization (WHO),” Radiopaedia, vol. 1, no. 1, pp. 1–1, 2020. [Google Scholar]
20. J. Liu, J. Li, K. Zhang and U. A. Bhatti, “Zero-watermarking algorithm for medical images based on dual-tree complex wavelet transform and discrete cosine transform,” Journal of Medical Imaging and Health Informatics, vol. 9, no. 3, pp. 188–194, 2019. [Google Scholar]
21. Z. He, W. Lu, W. Sun and J. Huang, “Digital image splicing detection based on markov features in DCT and DWT domain,” Pattern Recognition, vol. 45, no. 13, pp. 4292–4299, 2012. [Google Scholar]
22. Q. Dai, J. Li, U. A. Bhatti and J. Liu, “SWT-DCT-based robust watermarking for medical image,” Innovation in Medicine and Healthcare Systems, and Multimedia, vol. 4, no. 1, pp. 93–103, 2019. [Google Scholar]
23. B. Zhang, Y. Gao, S. Zhao and J. Liu, “Local derivative pattern versus local binary pattern: Face recognition with high-order local pattern descriptor,” IEEE Transactions on Image Processing, vol. 19, no. 2, pp. 533–544, 2009. [Google Scholar]
24. R. Mehta and K. Egiazarian, “Dominant rotated local binary patterns (DRLBP) for texture classification,” Pattern Recognition Letters, vol. 71, no. 23, pp. 16–22, 2016. [Google Scholar]
25. A. Rehman, Z. Mehmood, T. Saba, M. Sardaraz and M. Rashid, “Microscopic melanoma detection and classification: A framework of pixel-based fusion and multilevel features reduction,” Microscopy Research and Technique, vol. 11, no. 7, pp. 1–18, 2020. [Google Scholar]
26. A. Majid, M. Yasmin, A. Rehman, A. Yousafzai and U. Tariq, “Classification of stomach infections: A paradigm of convolutional neural network along with classical features fusion and selection,” Microscopy Research and Technique, vol. 83, no. 17, pp. 562–576, 2020. [Google Scholar]
27. S. Rubab, A. Kashif, M. I. Sharif, N. Muhammad and J. H. Shah, “Lungs cancer classification from CT images: An integrated design of contrast based classical features fusion and selection,” Pattern Recognition Letters, vol. 129, no. 27, pp. 77–85, 2020. [Google Scholar]
28. T. Saba, A. Rehman and S. L. Marie-Sainte, “Region extraction and classification of skin cancer: A heterogeneous framework of deep CNN features fusion and reduction,” Journal of Medical Systems, vol. 43, no. 2, pp. 28–43, 2019. [Google Scholar]
29. S. A. Khan, M. Nazir, T. Saba and K. Javed, “Lungs nodule detection framework from computed tomography images using support vector machine,” Microscopy Research and Technique, vol. 82, no. 21, pp. 1256–1266, 2019. [Google Scholar]
30. L. M. Abualigah, A. T. Khader and E. S. Hanandeh, “A new feature selection method to improve the document clustering using particle swarm optimization algorithm,” Journal of Computational Science, vol. 25, no. 3, pp. 456–466, 2018. [Google Scholar]
31. G. B. Huang, Q. Y. Zhu and C. K. Siew, “Extreme learning machine: Theory and applications,” Neurocomputing, vol. 70, no. 18, pp. 489–501, 2006. [Google Scholar]
32. D. M. Tax and R. P. Duin, “Support vector data description,” Machine Learning, vol. 54, no. 21, pp. 45–66, 2004. [Google Scholar]
33. Y. D. Zhang, Z. Zhu and S. H. Wang, “Pseudo zernike moment and deep stacked sparse autoencoder for COVID-19 diagnosis,” Computers, Materials & Continua, vol. 70, no. 2, pp. 3145–3162, 2021. [Google Scholar]
34. K. Muhammad, M. Sharif, T. Akram and S. Kadry, “Intelligent fusion-assisted skin lesion localization and classification for smart healthcare,” Neural Computing and Applications, vol. 2, no. 1, pp. 1–16, 2021. [Google Scholar]
35. K. Muhammad, S. H. Wang, S. Alsubai, A. Binbusayyis and A. Alqahtani, “Gastrointestinal diseases recognition: A framework of deep neural network and improved moth-crow optimization with DCCA fusion,” Human Centric Computing, vol. 1, no. 1, pp. 1–15, 2022. [Google Scholar]
36. M. Nawaz, T. Nazir, M. Masood, F. Ali and U. Tariq, “Melanoma segmentation: A framework of improved densenet77 and UNET convolutional neural network,” International Journal of Imaging Systems and Technology, vol. 2, no. 1, pp. 1–21, 2022. [Google Scholar]
Cite This Article
 Copyright © 2023 The Author(s). Published by Tech Science Press.
This work is licensed under a Creative Commons Attribution 4.0 International License , which permits unrestricted use, distribution, and reproduction in any medium, provided the original work is properly cited.
 Downloads
 Citation Tools