
 Submit a Paper
 Propose a Special lssue
 Open Access
ARTICLE
Feature Extraction and Classification of Photovoltaic Panels Based on Convolutional Neural Network
1 Department of Computational Intelligence, SRM Institute of Science and Technology, Chengalpattu, 603203, India
2 Department of Electrical Engineering, SRM Institute of Science and Technology, Chengalpattu, 603203, India
* Corresponding Author: S. Prabhakaran. Email:
Computers, Materials & Continua 2023, 74(1), 1437-1455. https://doi.org/10.32604/cmc.2023.032300
Received 13 May 2022; Accepted 15 June 2022; Issue published 22 September 2022
 View Full Text
 Download PDF
Abstract
Photovoltaic (PV) boards are a perfect way to create eco-friendly power from daylight. The defects in the PV panels are caused by various conditions; such defective PV panels need continuous monitoring. The recent development of PV panel monitoring systems provides a modest and viable approach to monitoring and managing the condition of the PV plants. In general, conventional procedures are used to identify the faulty modules earlier and to avoid declines in power generation. The existing deep learning architectures provide the required output to predict the faulty PV panels with less accuracy and a more time-consuming process. To increase the accuracy and to reduce the processing time, a new Convolutional Neural Network (CNN) architecture is required. Hence, in the present work, a new Real-time Multi Variant Deep learning Model (RMVDM) architecture is proposed, and it extracts the image features and classifies the defects in PV panels quickly with high accuracy. The defects that arise in the PV panels are identified by the CNN based RMVDM using RGB images. The biggest difference between CNN and its predecessors is that CNN automatically extracts the image features without any help from a person. The technique is quantitatively assessed and compared with existing faulty PV board identification approaches on the large real-time dataset. The results show that 98% of the accuracy and recall values in the fault detection and classification process.Keywords
Consumption of electricity is increasing day by day due to population growth and industrial growth. In this case, the world needs a cost-effective and sustainable energy source. Solar energy and other renewable energy resources are to be used to solve the energy crisis [1]. As indicated by the information announced by Solar Power Europe, solar plants are turning out to be increasingly popular every year. Without a doubt, the world’s solar energy production, which is expected to go from 99 GW in 2017 to 157 GW in 2022, will depend on PV plants [2]. In such a massive development of the PV market, there is an essential need to increase the quality of the monitoring frameworks to recognize issues and to guarantee that the energy is created with the most extreme productivity. A good monitoring method is to find out the defects as soon as possible, and at the same time, it should prevent energy loss when compared to that of other conventional approaches. An investigation was conduct by a defect detection system to examine the common factors of PV panel failures and also efficiency loss. Moderate crystal defects in multi-crystalline solar cells and striation rings in monocrystalline solar cells are examples of manufacturing defects [3]. These defects could be the reason for the inability of PV panels to function as well as possible. Tab. 1. depicts the types of PV panel defects and their severity. Fig. 1 shows the variation of cumulative solar installations over countries.
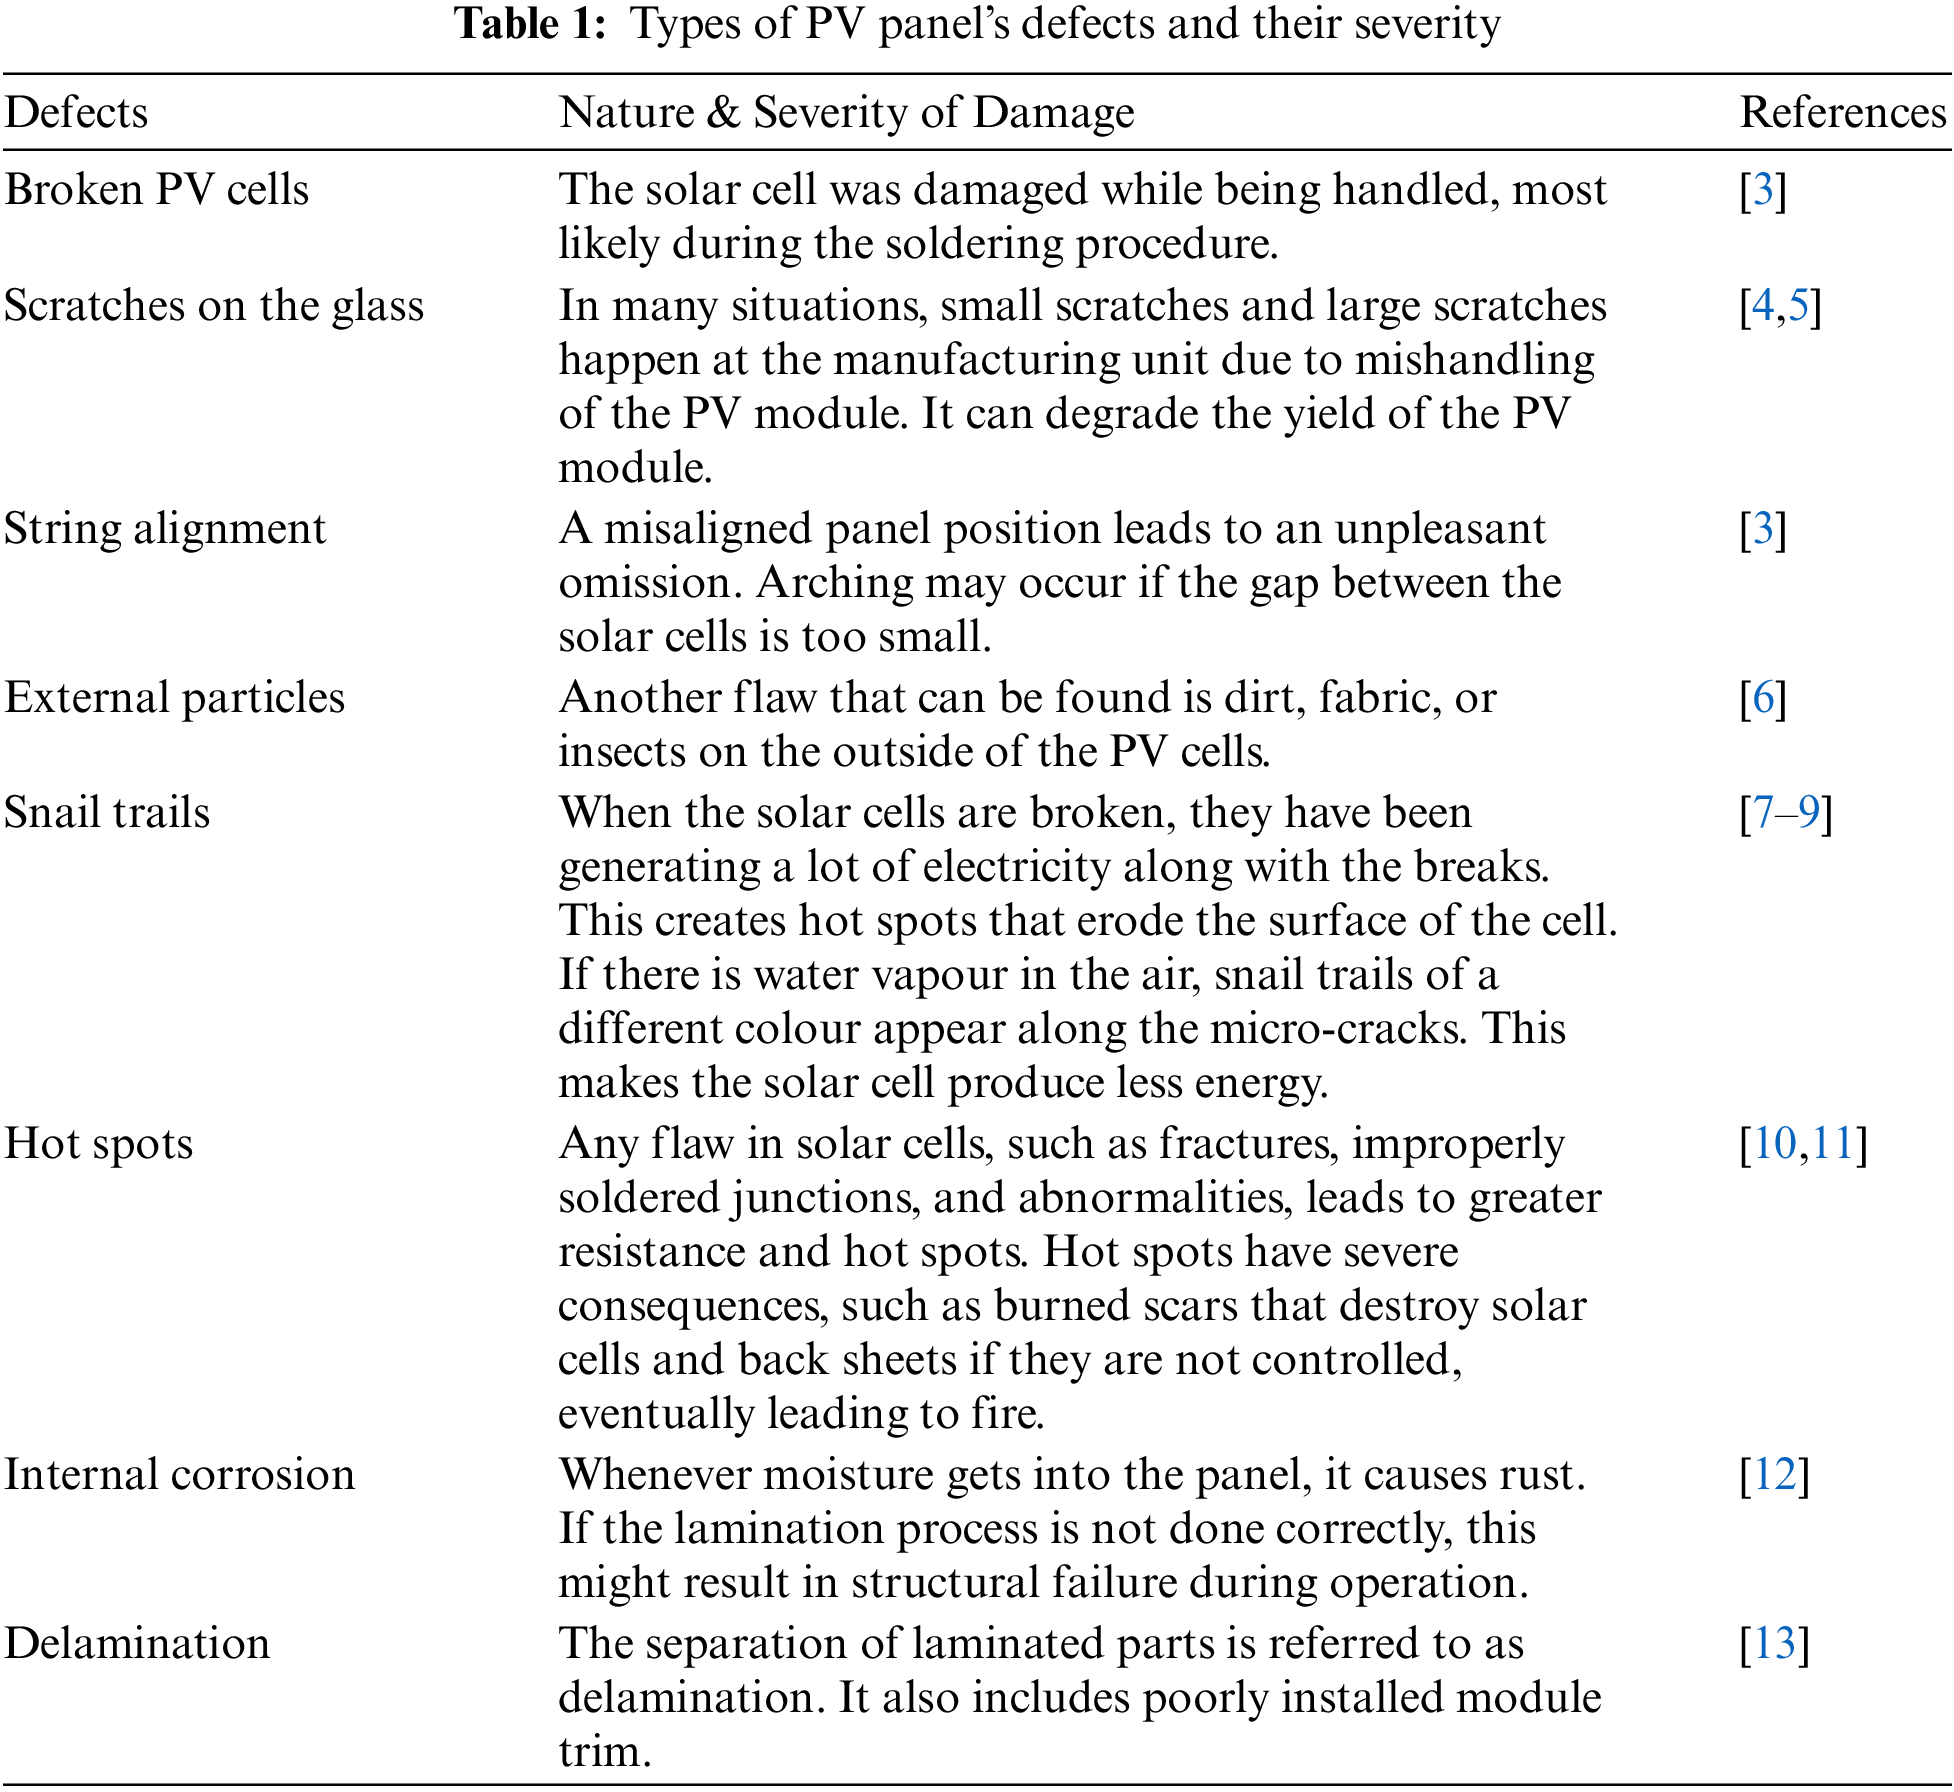
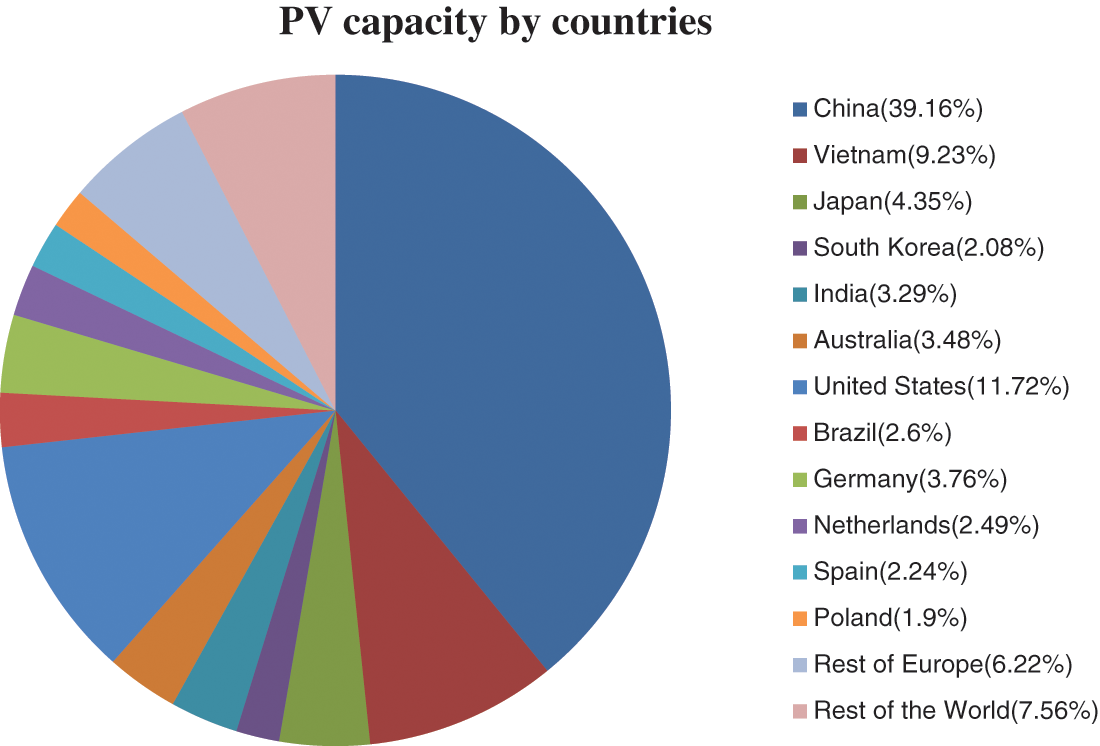
Figure 1: PV capacity by countries in 2020 [2]
An image mosaicing technique is used to localize the PV panel’s defects based on color information. A harris corner and a hough transform detector are used to stitch the group of images together to form a larger mosaic image. That the faults are evaluated by the mosaicing technique, but it didn’t reveal any numerical results. It is used with the thermal camera, which is mounted on an Unmanned Aerial Vehicle (UAV) for inspection using the aerial thermal visual photography technique [14]. The image processing algorithm classifies the PV panel defects and healthy modules [15]. The image binarization based laplace operator technique is used to identify and classify the defects in PV panels. The binarization technique provides an adequate solution to localize the PV panel defects by performing monitoring, diagnosis, and data processing. To build an image processing algorithm, the PV panels are examined by using the thermography technique [16]. This necessitates correlating the images from the two cameras, like an RGB camera and a thermal camera, and establishing a color threshold. The threshold is used to segment the PV modules, with the threshold being determined by the median value of 124. Such an approach assumes that the temperature is lower near the panel’s edges. This assumption is valid whenever the panels are adequately separated, but it fails if the panels are frequently near and the connections become heated on a routine basis. This approach is tested in a real-time solar power plant with different kinds of sensors [6,7]. Temperature defects such as hot spots and other defects are identified by capturing the individual PV modules through infrared (IR) images and RGB images. Then quantitative mathematical methods are applied to identify the defective panels [9,10,17]. The PV modules are identified using a layout coordinate with conditions based on the fusion of computer vision algorithms, such as U-Blox NEO-M8 N, and RTK Global Navigation Satellite System (GNSS) [11].
One of the most promising approaches developed to overcome manual inspection is CNN [4]. CNN has been used to identify a large number of images associated with solar plants and then to determine the presence and location of defects [5]. Of this kind, defects appear as bright spots in an RGB image. The major benefits of CNN are that it is cost-effective and carries large datasets. Detection of a hotspot in PV panels gives more efficiency for solar plant monitoring and quality assurance [5,14,18]. Detection is the first fundamental step in the fault identification of the PV panel. The majority of research work in PV fault detection systems is done by CNN Densenet architecture using RGB images. The CNN Densenet architecture is enough to provide reliable output in the mathematical form and handle the PV panels in real-world situations. The main advantage of CNN techniques is that they do not require any plant-specific configuration and have been used in a plug-and-play approach. Since the geographic values are gathered by GPS sensors, those values are insufficiently accurate. The future improvement of the present research work is to get more accurate geo-localization values to increase the effectiveness of PV inspections [13]. Moreover, some different characteristics such as complexity, accuracy, and scalability are attractive. Hence, an attempt has been made to explore a new detection approach to detect faulty PV panels that is reliable enough to work successfully in a real-world environment daily [19].
Another way to identify the faults in PV panels is based on artificial neural networks. The performance of PV modules is evaluated by attributes such as temperature, current (I), voltage (V), and evoltage (IeV). To classify the various faults, a Field Programmable Gate Array was used [20]. Machine learning methods like random forest classifiers combined with infrared thermography, electroluminescence systems, and scale-invariant feature transform descriptors produce better results in the fault identification system [21–23]. Conventional CNN methods like VGG-16, ResNet-50 and MobileNet models provide better accuracies in PV panel defect classification [23,24].
The PV panel faults are identified electrically too. The fuzzy logic control is used to monitor, identify, and detect the various PV faults based on three values such as open-circuit voltage, current, and voltage [25]. To identify the PV panel defects, the UAV has been used. Thermal cameras and IR cameras are mounted in a UAV system to capture images of the PV module. Later, it is processed by neural networks like CNN and DCNN [26–28]. The dirty thermal images were identified by thermographic non-destructive tests and classified by CNN [29]. This aerial infrared thermography is a fast, cheap, non-destructive, and no-downtime way to keep an eye on large PV power plants and help find problems [30]. Wavelet transform, feature selection, and ANN techniques were used to identify and classify the PV defects. On the other hand, image processing techniques like discrete fourier transform are used to examine the PV binary images in a two-dimensional spectrum to identify the defects in PV panels [22].
Both traditional image processing approaches and deep learning techniques have their pros and cons. Classic image processing algorithms are well-known, easy to understand, and optimized for performance and power efficiency. Traditional image processing algorithms are hard to come up with when there are a lot of classes to sort into or when the image isn’t very clear. Disadvantages of ANN approaches include usually hardware dependence, difficulty of conveying the issue to the network, duration of the network is uncertain. Signal processing chips are costly and it requires higher bandwidth to transmit the data to the network and skilled engineers can only work on the Signal processing devices. Deep learning, on the other hand, is more accurate and flexible, but it uses a lot of computing resources. They are especially useful for the fast implementation of high-performance systems. You don’t have to define the features and do feature engineering anymore. RMVDM was trained on GPUs. Models were trained quickly. Its 8-layer design ensures it can extract characteristics better than previous approaches. This implies little feature loss. It cancels negative gradient summation output, not the dataset. Since not all perceptrons are active, model training speed improves.
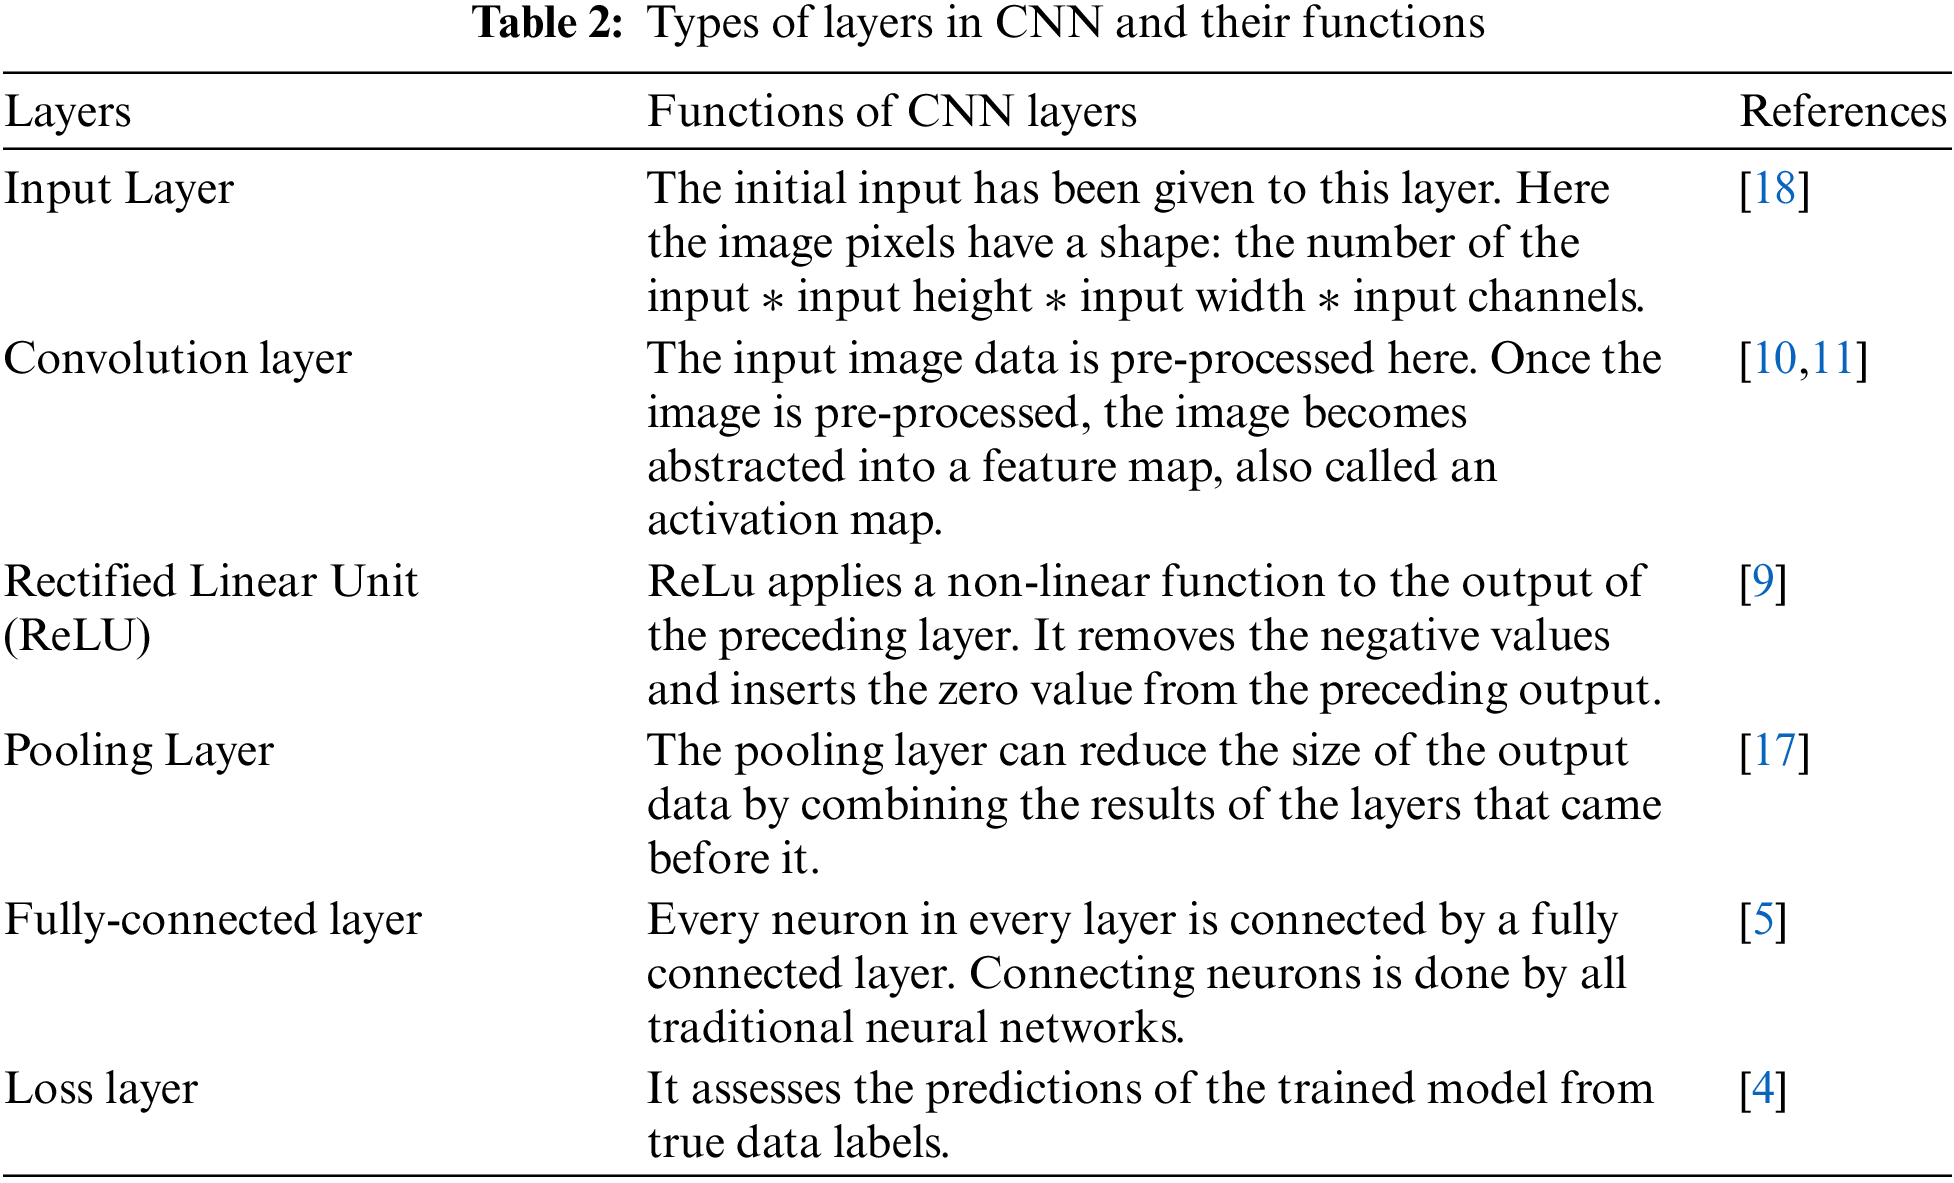
The CNN-based RMVDM defect detection and classification method is one of the best classification techniques, which is used to identify the defects in the PV module and provide exact electricity generation volumes under various conditions. Deep learning techniques consist of multiple layers to learn data. These deep learning techniques are used in speech recognition, text recognition, object recognition, object detection, object classification, pattern recognition, and many other applications to solve more complex problems. It is described as a class of machine learning algorithms that have multiple layers to perform artificial intelligence tasks. These deep learning methods are capable of learning from non-identical data without any predefined programmes [8]. The objective of the present work is for the deep learning technique to be used to identify the defects in PV panels. When compared to existing conventional neural network methods, CNN uses some parameters to learn them. The fundamental architecture of CNN is described in Tab. 2.
In the present study, the CNN-based RMVDM framework is a technique for detecting PV panel defects that is built on a contemporary identification framework. RMVDM is a fast network that uses Deep Convolutional Neural Networks (DCNN) to conduct object detection and object classification at the same time. The RMVDM object recognition framework recognizes PV panel defects from RGB photos. It has been demonstrated to be a flexible and successful approach, with good detection accuracy and minimal computation cost; for example, it runs continuously on usually accessible GPUs. Therefore, the present work strongly recommends quantitative analysis outcomes based on an RGB image collected from real-world solar power plants. The suggested solution meets all three of the needed characteristics: accurate, quick, and capable of being executed in real-time. Finally, it is concluded that no plant-specific configuration is required for CNN.
The key benefit of employing RMVDM is that a single pass-through network provides all the information needed to discover the suspicious objects in an image without further costly processes. Conventional systems, on the other hand, require two different steps: first, they identify numerous proposal regions where an item is most likely to be discovered; and second, they categorize each region to validate or dismiss the proposal. Because running a classifier on multiple areas increases the computational cost but, the RMVDM design is simpler, yet faster and has more accuracy. The RMVDM framework was initially created to address the challenge of generic object identification, to automatically recognize and classify diverse kinds of objects. It simplifies the challenge and allows the design to be trained with much less data. RMVDM works as follows: Feature Extraction and Classification.
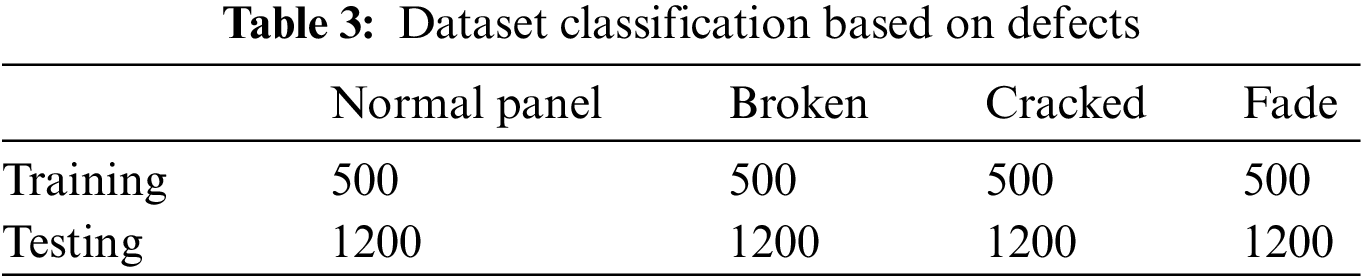
The collections of several PV plant image datasets are captured by a high-resolution RGB camera. The dataset comprises 6 different categories and a total of 1200 images. The PV images are taken from different lighting conditions, various altitudes, and 4 different kinds of paths (East, West, North, and South). Besides, the PV boards have a place with various PV plants and with different sizes, shapes, alignment, and colors; it is found that the dataset has enough variants to reflect many of the difficult scenarios encountered in popular applications involving the autonomous DCNN evaluation of PV installations. A deep learning technique trained and evaluated on this dataset is predicted to be resistant to changes in direction, panel makers, plant dispositions, and weather conditions and illuminations. The real-time PV images are depicted in Fig. 2. Images 1 to 40 from each category are utilized for testing, and others are utilized for training, with around 50 PV boards. The dataset classification based on training data and testing data is mentioned in Tab. 3.
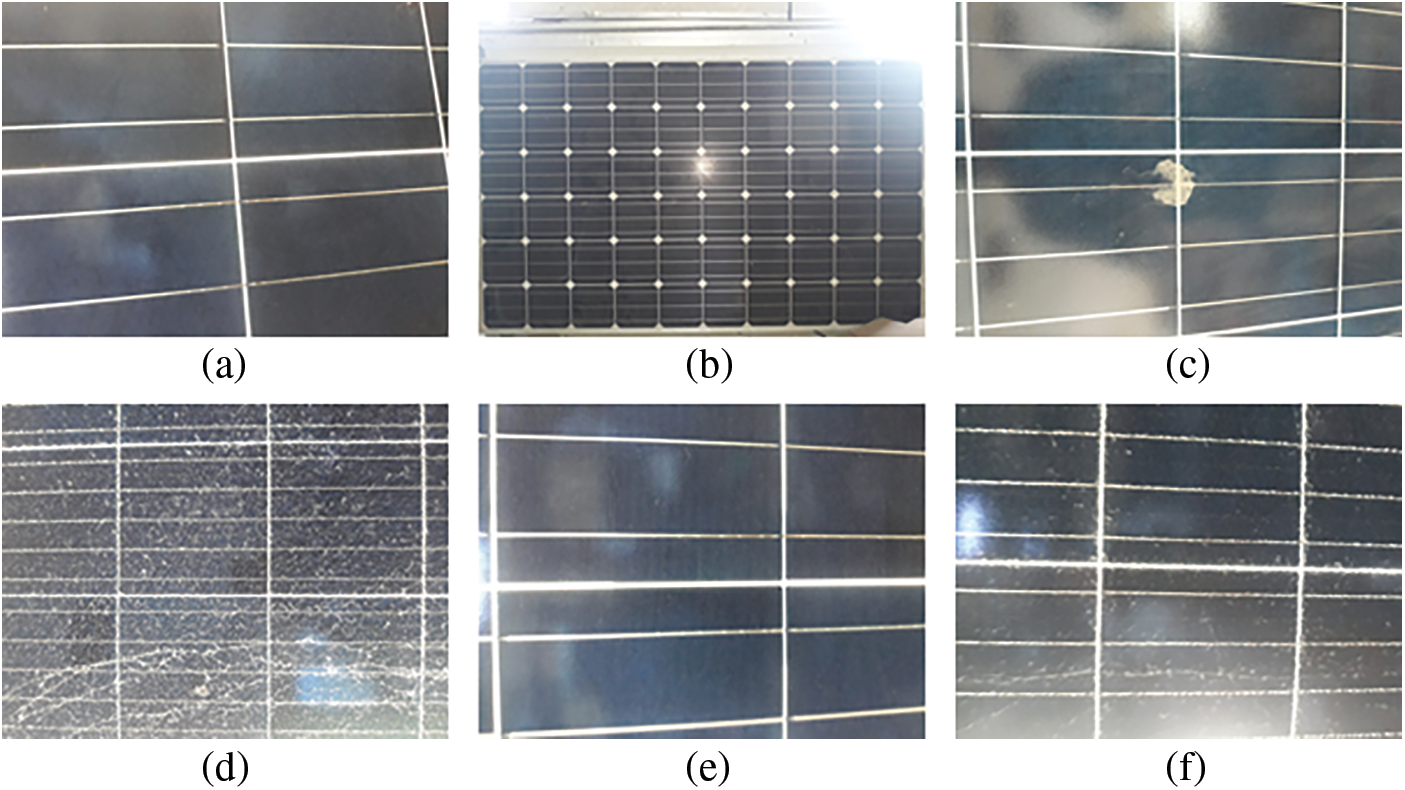
Figure 2: Defective PV panels–(a) normal, (b) dust, (c) bird drop, (d) broken, (e) fade, (f) crack
The RMVDM feature extraction network has already been trained. A convolution operator, which is useful for solving complex operations, is used to get the name of these kinds of networks. The main benefit of RMVDM is that it automatically extracts features, which is the case. First, the specified input data is sent to a network for extracting features. Then, the extracted features are sent to a network for classifiers. The simplest and quickest method to extract the image features in CNN-based RMVDM is feature extraction, which has been trained on the CNN-based RMVDM architecture to extract the various features of PV images. Features of the PV images are such as color, texture, shape, position, edges, and regions. Generally, the RMVDM model has fixed input and output sizes. In this present work, the dataset image size is 3096*4128. So, all the PV images are resized to 227*227. Load Data: Upload the resized PV images into the image datastore (imds). Now the imds file is created and it contains the location of the images. PV images are labelled with respective names based on the image folder. The dataset will be split into a training dataset and a test dataset. 70% of PV images were used to train the network. 30% of PV images were used to test the network. The mean value of the training dataset and test dataset was 0.7 and 0.3, respectively. Now, the RMVDM model has been loaded with feature extraction. The RMVDM architecture has a total of 25 layers. The first 23 layers will be used for feature extraction; the 24th and 25th layers will be used for classification. It is now using the CNN-based model for feature extraction. It requires only a single pass-through network for passing the data. Now, the FeatureTrain and FeaturesTest files will be generated. Now, all image features have been extracted, and the features will be represented as numerical values. The neural network majorly consists of two layers for feature extraction, such as the convolution layer and the pooling layer.
1) Convolutional layer-The convolutional layer is made up of a group of digital filters that work together to perform the convolution operation on the data that comes in.
2) Pooling layer-The pooling layer is used to cut down on the number of dimensions and decide what the threshold is.
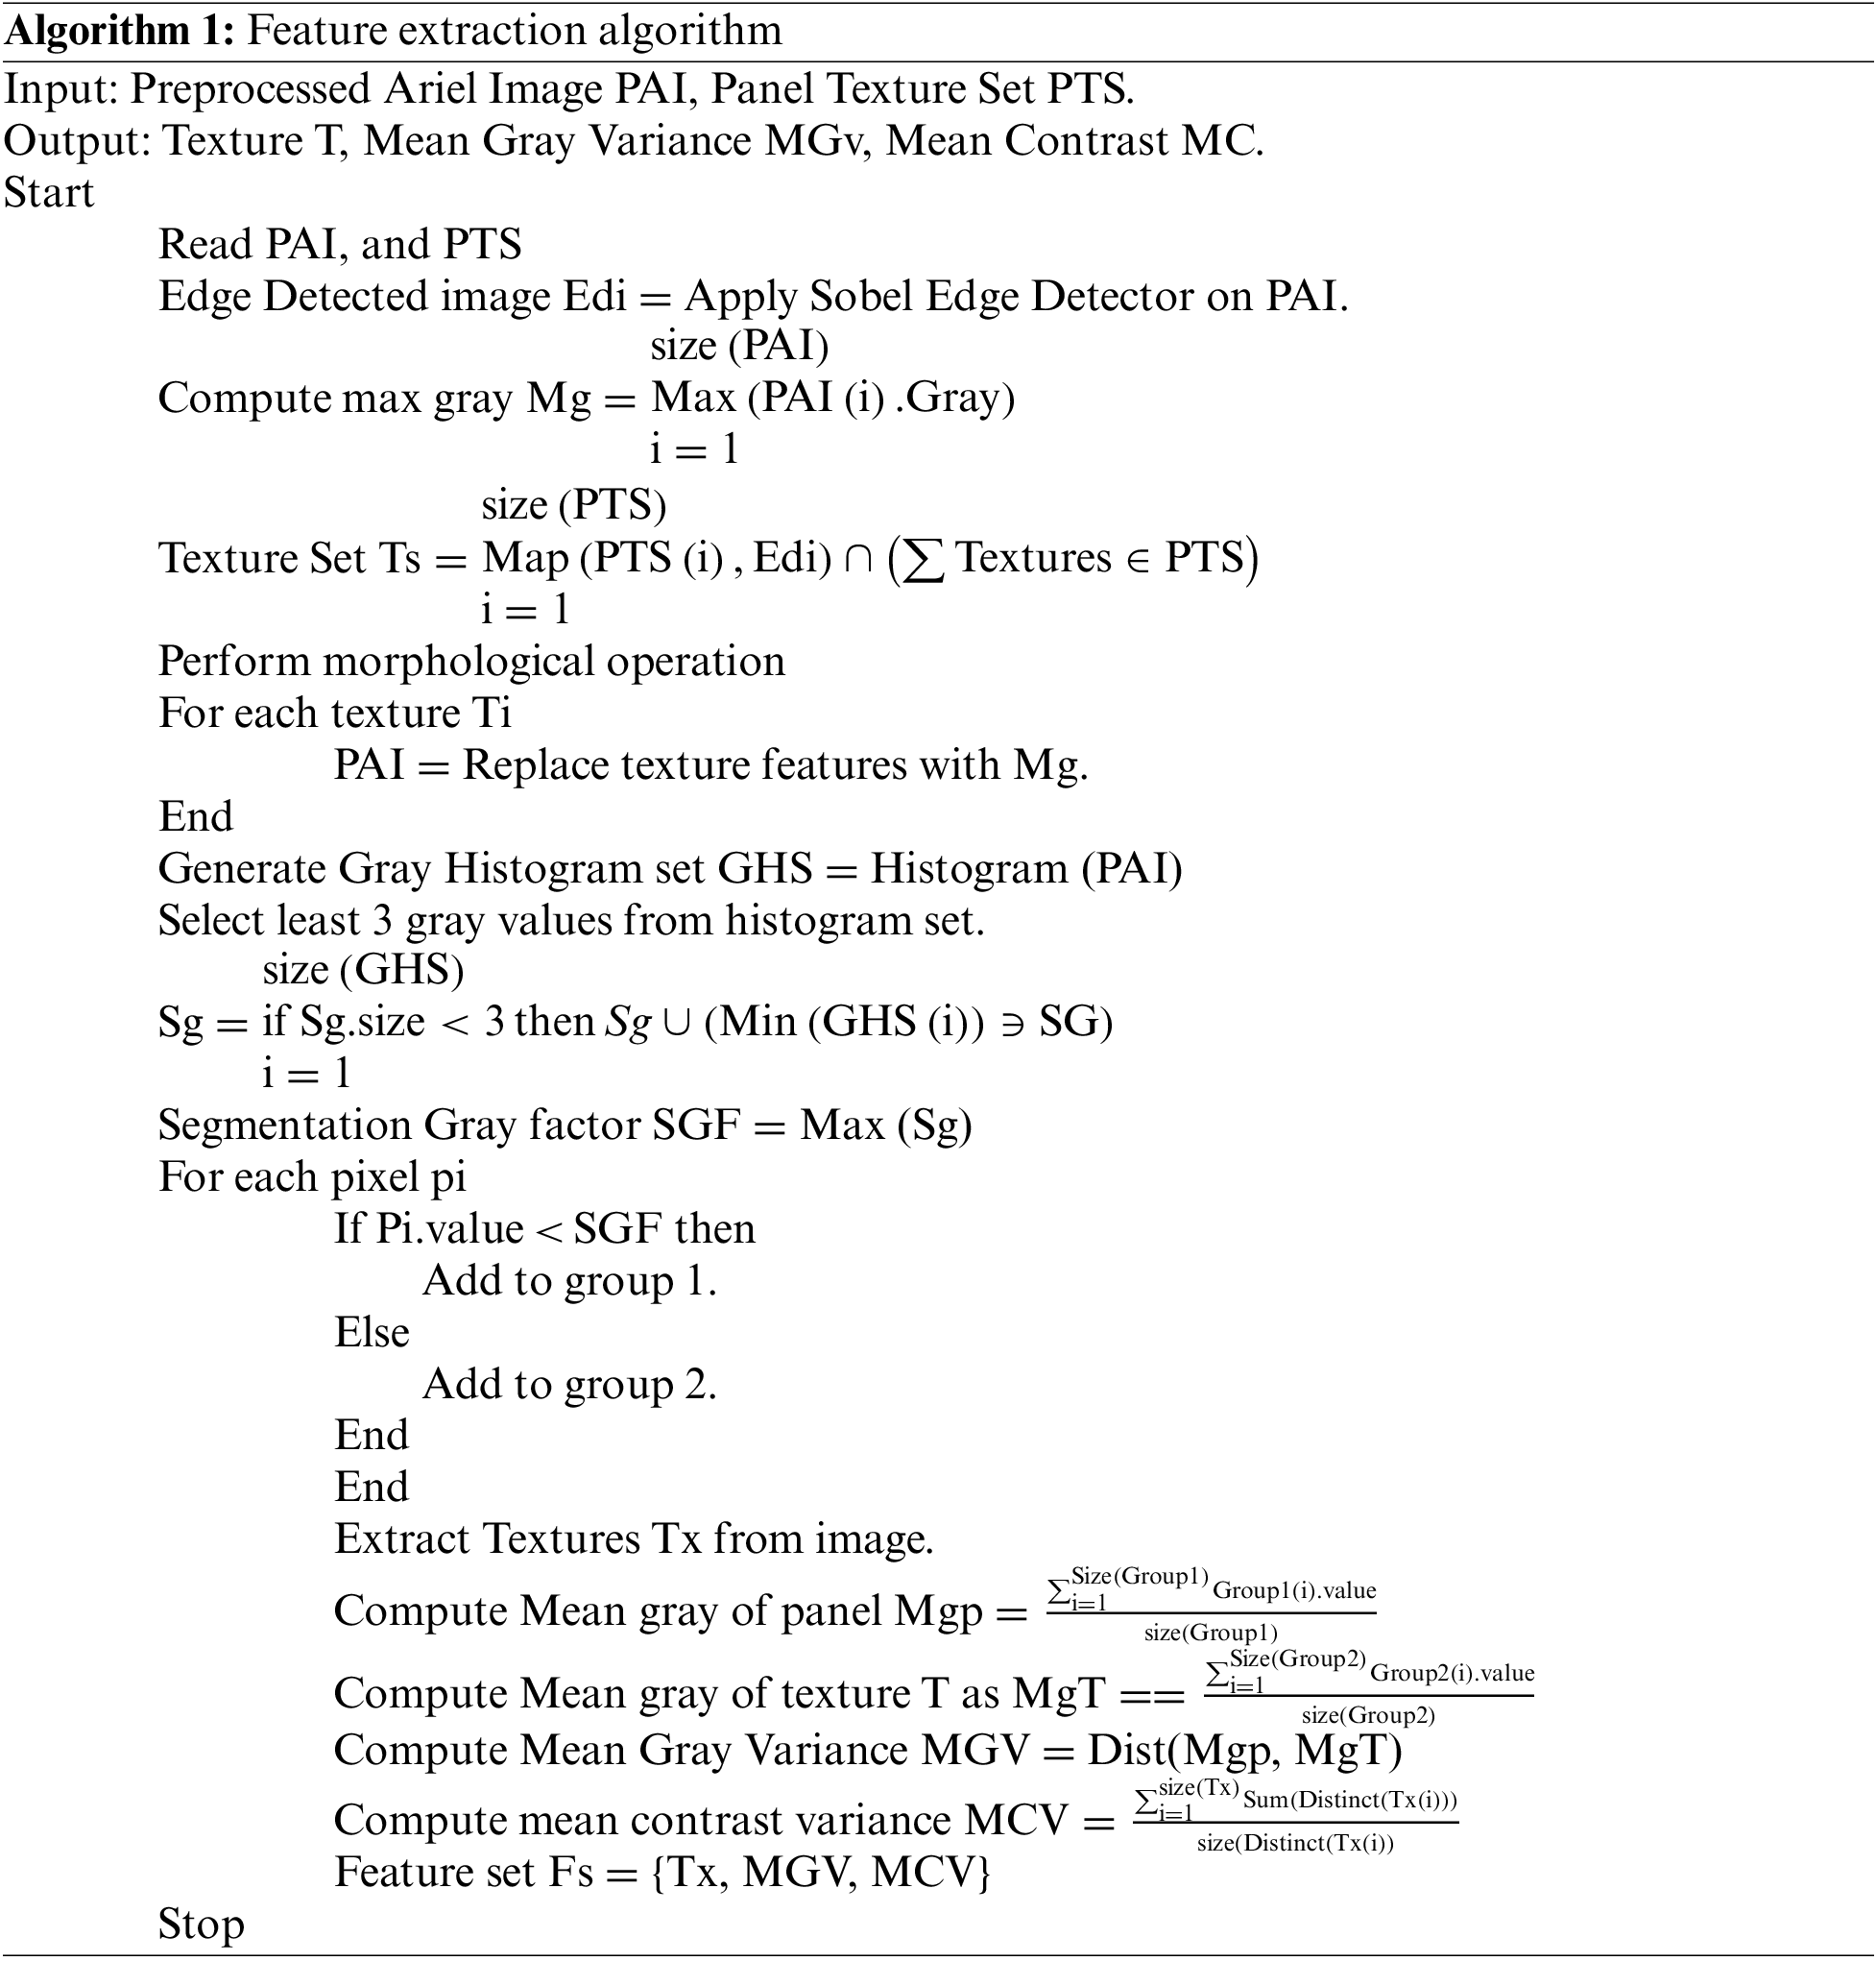
The architecture of feature extraction is depicted in Fig. 3. The pseudo-code of Feature Extraction is shown in Algorithm 1.
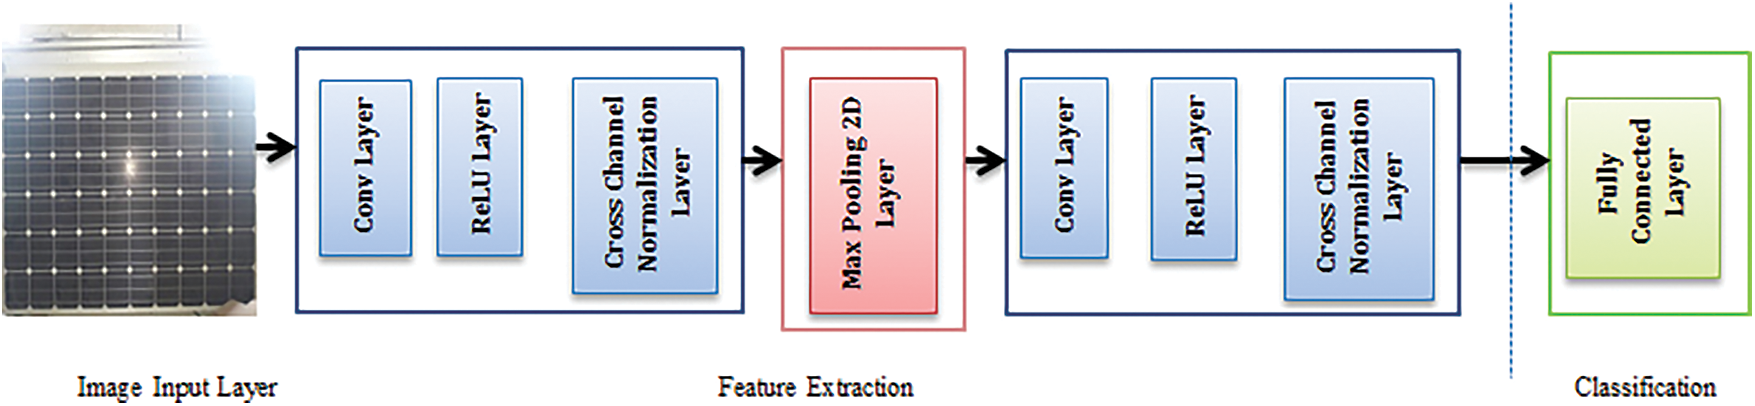
Figure 3: Architecture of proposed feature extraction
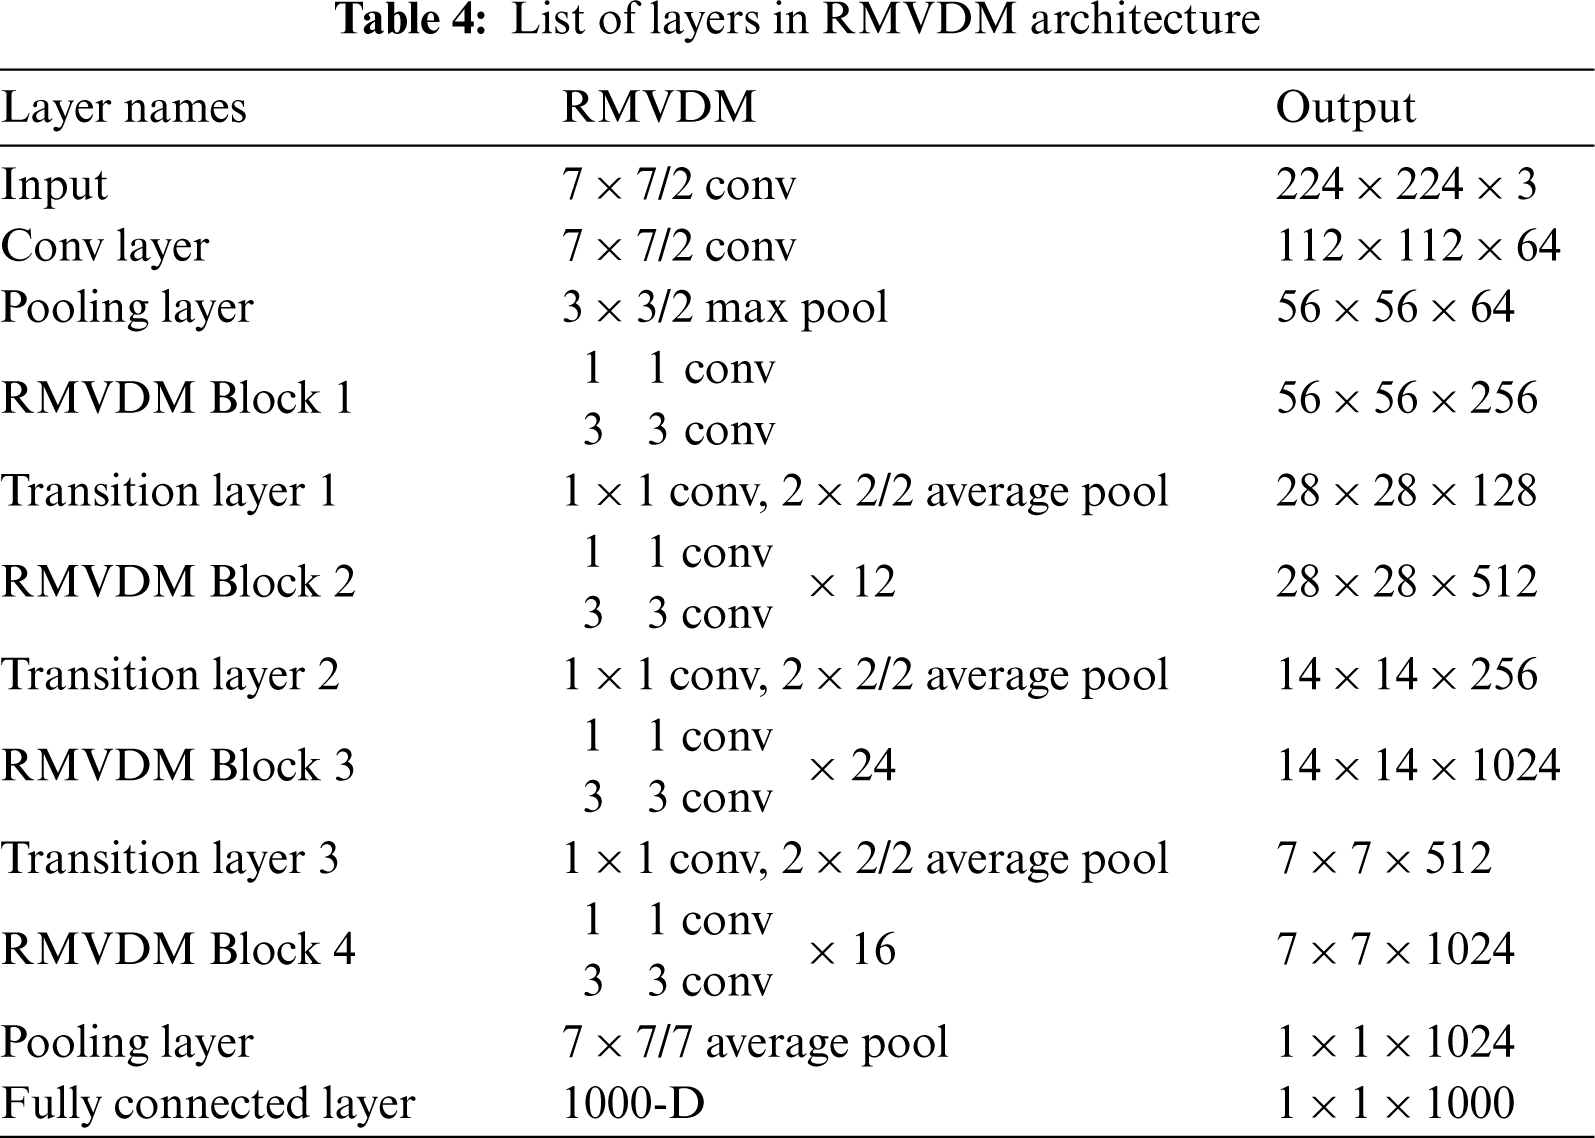
In single-phase recognition architecture, the entire PV image is used as input for the first layer. The network then creates a set of coordinates, each with a level of confidence. It has been tried in different kinds of deep learning settings. The RMVDM architecture consists of 201 layers. The RMVDM Blocks contain 116 layers, and the Conv Layer, Fully Connected Layer, and Transition Layers each contain 1 layer. The complete RMVDM layer details are shown in the Tab. 4.
The RMVDM architecture splits the input PV images into a matrix format. Each row of the matrix forecasts B bounding boxes as well as the confidence in that detection. The loss function is intended to train each cell to identify only items that are centered in that cell. This loss function, better known as categorical loss, is the difference between the original values and predicted values.
where,
L-Loss function
Sj-True value
Syi-Predicted value
To further develop the presentation when managing tiny objects, RMVDM utilizes a skip connection to exploit the fine-grained highlights when genuine discoveries are anticipated in the last layers.
This gives,
where,
F(x)-Skip connection function
H(x)-Initial mapping
x-Identity
Finally, Batch Normalization is used, and the backbone network design is updated by replacing every pixel value in channel C with the following rule:
where,
It is quite significant that the RMVDM network is completely convolutional and is prepared with various sizes of images; this permits the locator to be utilized for different purposes. The subsequent precision is essentially improved, with seemingly minor impacts on the deduction time. The pseudo-code of RMVDM architecture is shown in Algorithm 2.

In this present work, a quantitative evaluation of the suggested technique in this section is presented. Also, it portrays the dataset utilized in our experimentation. Therefore, we present the work metrics used to evaluate the approaches’ performance as well as the experimental procedure utilized for the evaluation, with the accompanying equations:
where,
TP-True Positive
FP-False Positive
FN-False Negative
TN-True Negative
The common architecture of RMVDM is depicted in Fig. 4.
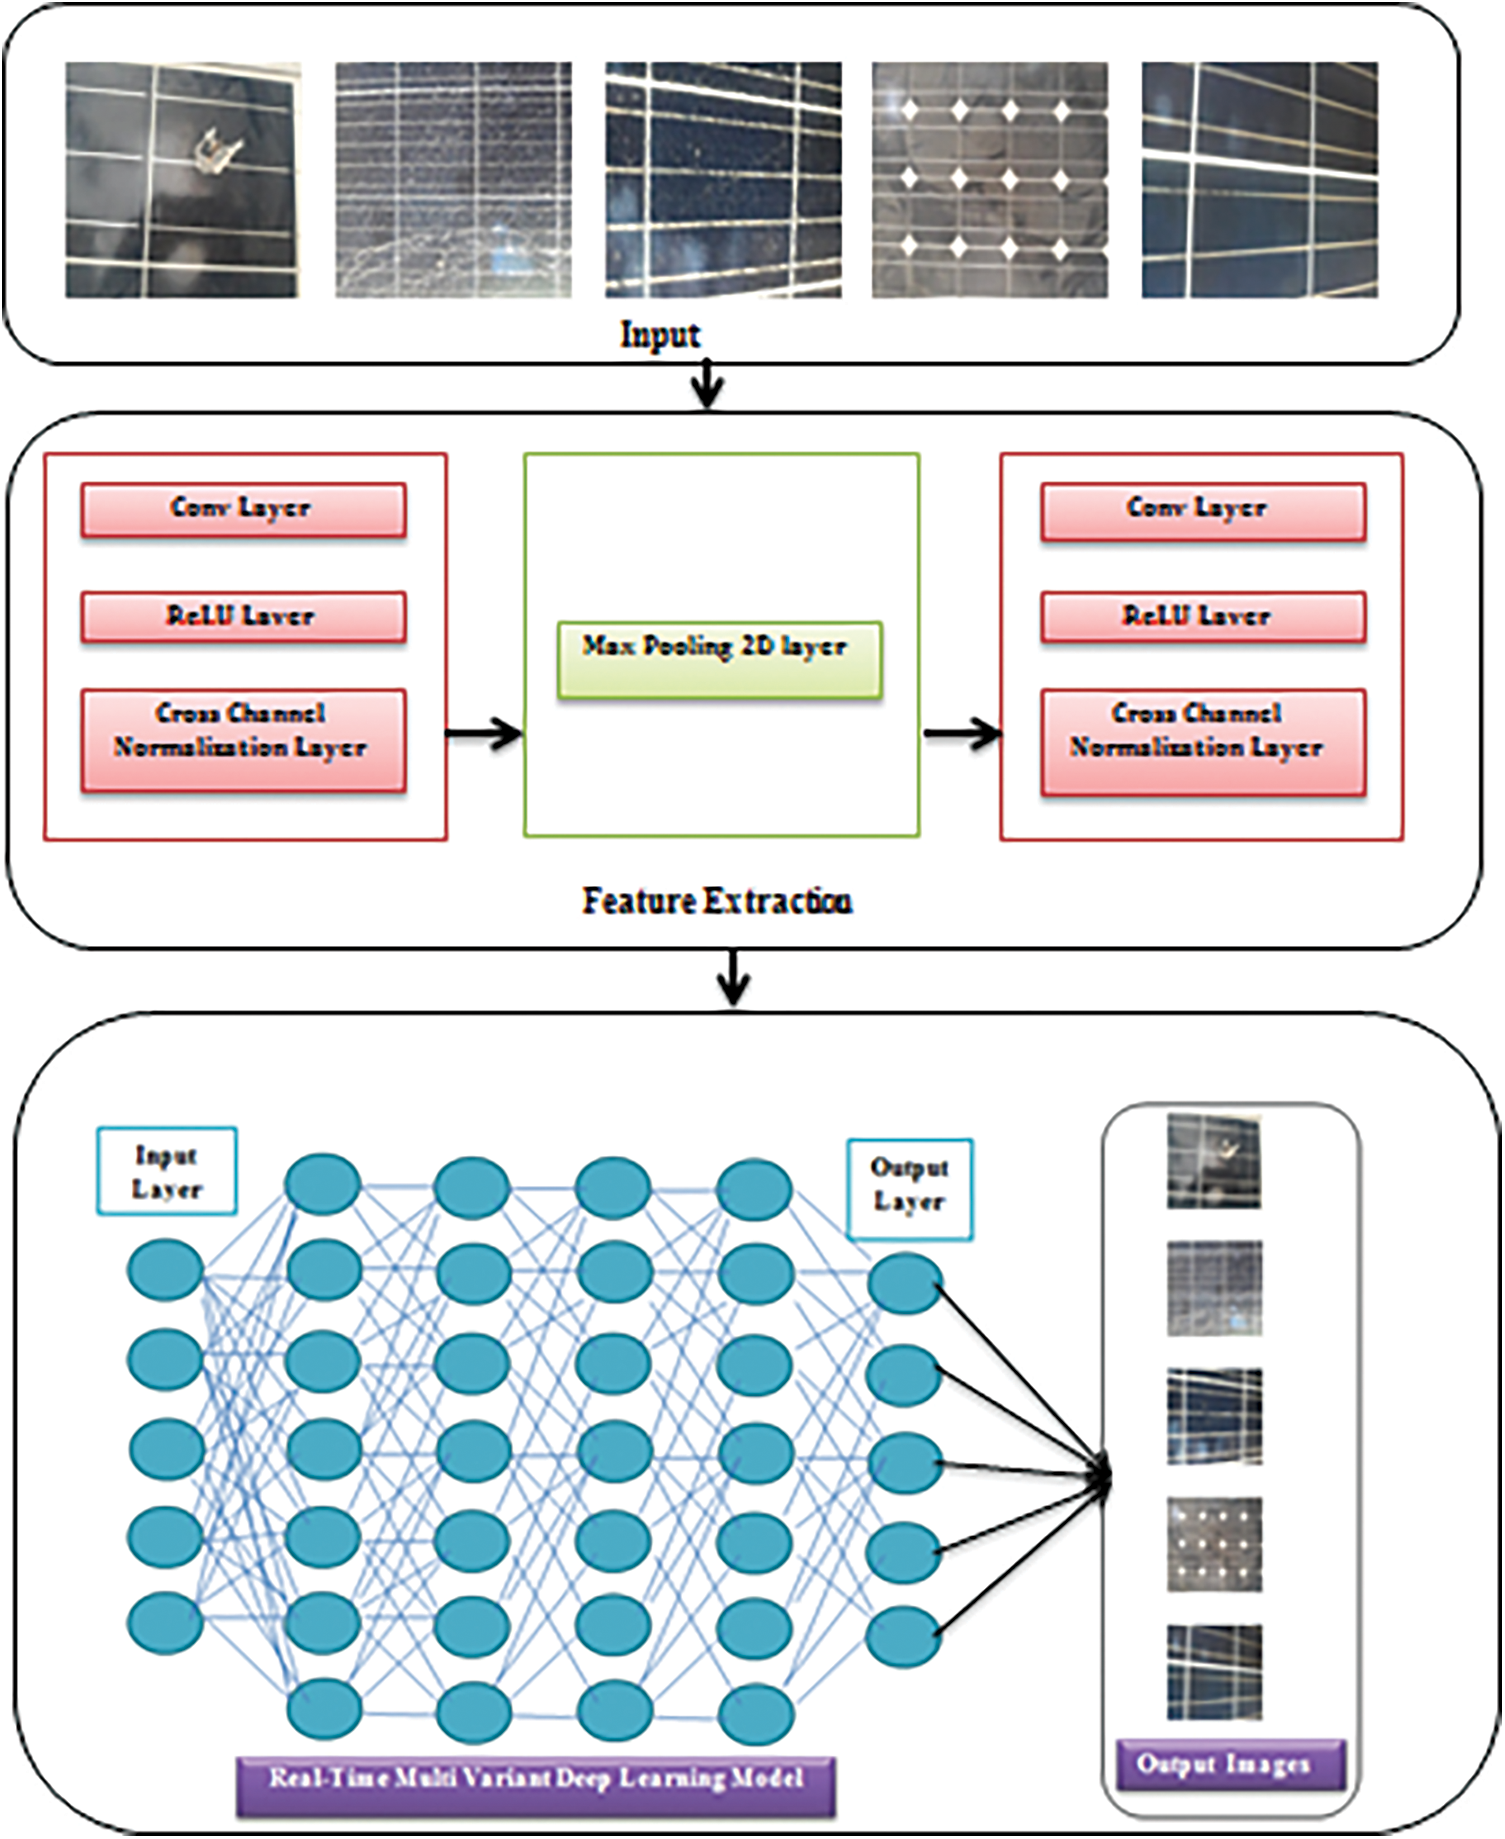
Figure 4: Workflow of RMVDM architecture
CNN based fault detection model’s results as well as performance of the proposed RMVDM fault diagnosis method are presented in this section. Techniques such as the one proposed here require a reference solar cell and camera for the module’s temperature, defect’s position and defect’s size. Analyzed results are stored in an electronic database before being transferred to an operating system on a personal computer, where the diagnostic procedure is performed.
Compared to the other conventional techniques, RMVDM results in the two primary environments, such as parameter-free configuration and fine-tuned configuration. The test images are not utilized to optimize the parameters in the event of parameter-free experimentation. This parameter-free experiment is to replicate a situation in which the person does not need to do any sort of setting on the given circumstance. In the parameter-tuned configuration, 30% of train images are utilized to fine-tune the network; the remaining 70% of images are utilized as validation data. A minor configuration in the RMVDM model boosted the overall network efficiency. Although parameter-tuning is available on the present CNN model. It is indicated that fine-tuning enables the correction of the numerous false negatives that occurred.
Fig. 5 shows the results of training accuracy and validation accuracy of the normal PV image dataset and Fig. 6 shows the results of training loss and validation loss of the normal PV image dataset.
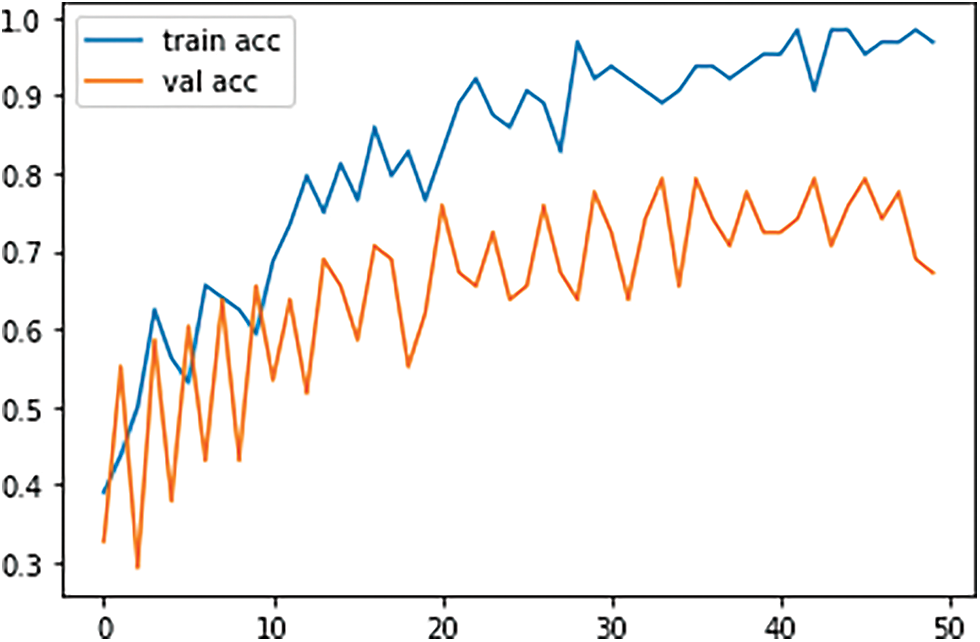
Figure 5: Train acc and val acc

Figure 6: Train loss and val loss
Fig. 7 shows the results of training accuracy and validation accuracy of the broken PV image dataset and Fig. 8 shows the results of training loss and validation loss of the broken PV image dataset.
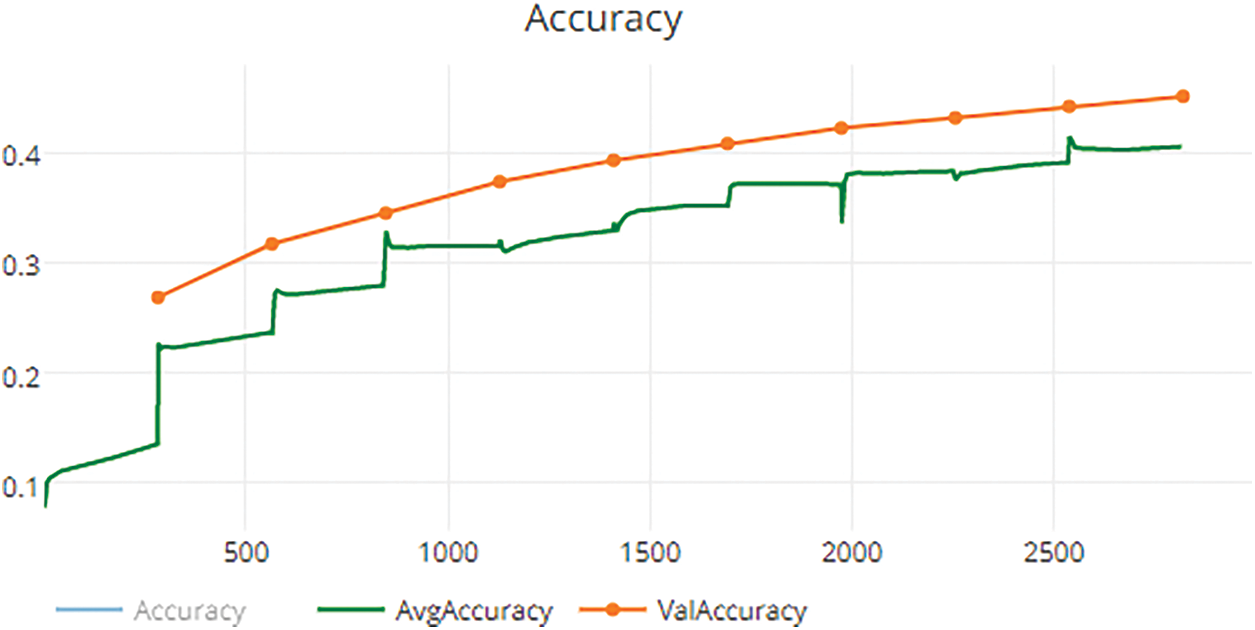
Figure 7: Train acc and val acc
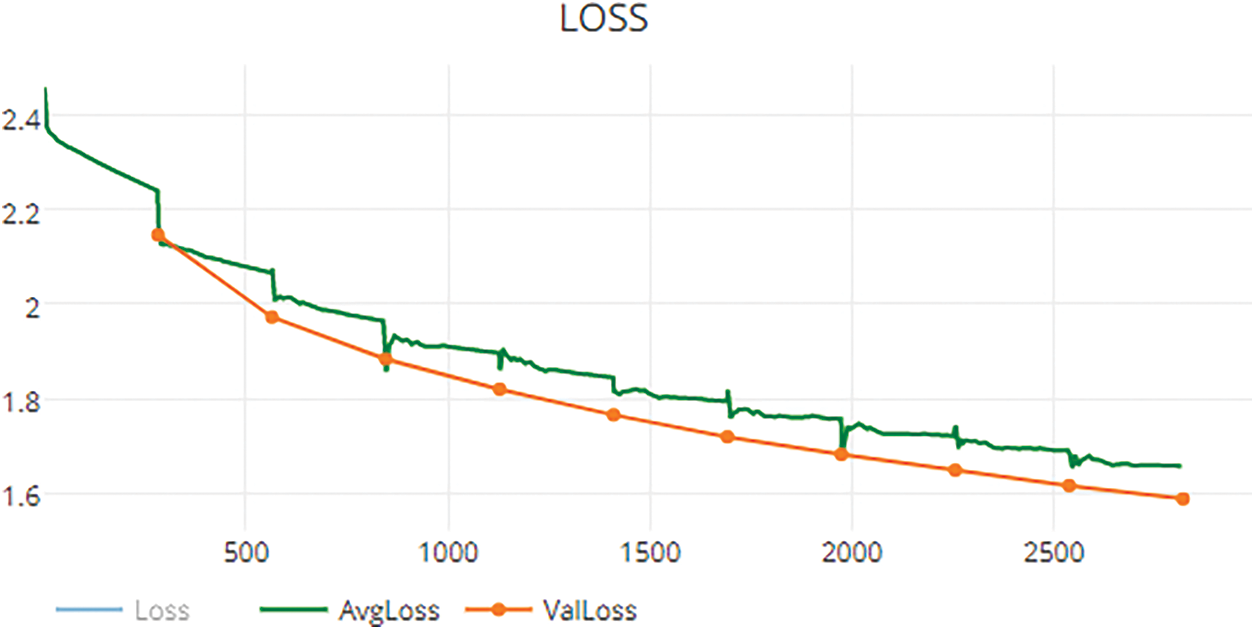
Figure 8: Train loss and val loss
Fig. 9 shows the results of training accuracy and validation accuracy of the crack PV image dataset, and Fig. 10 shows the results of training loss and validation loss of the crack PV image dataset.

Figure 9: Train acc and val acc
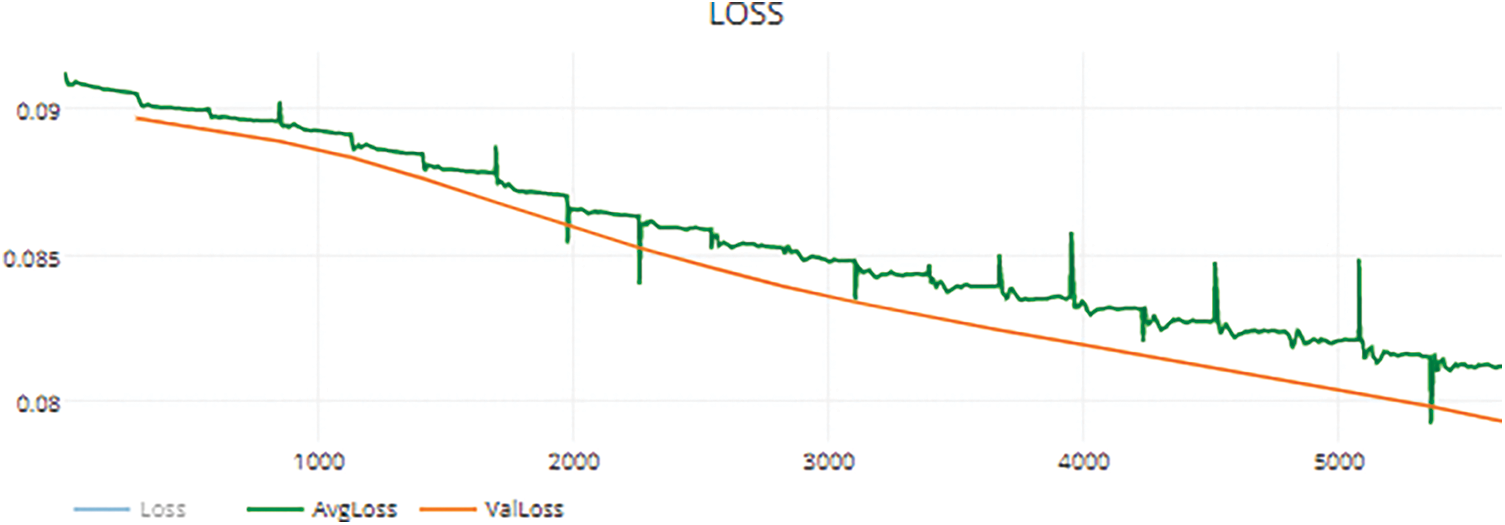
Figure 10: Train loss and val loss
Fig. 11 shows the results of training accuracy and validation accuracy of the fade PV image dataset, and Fig. 12 shows the results of training loss and validation loss of the fade PV image dataset.
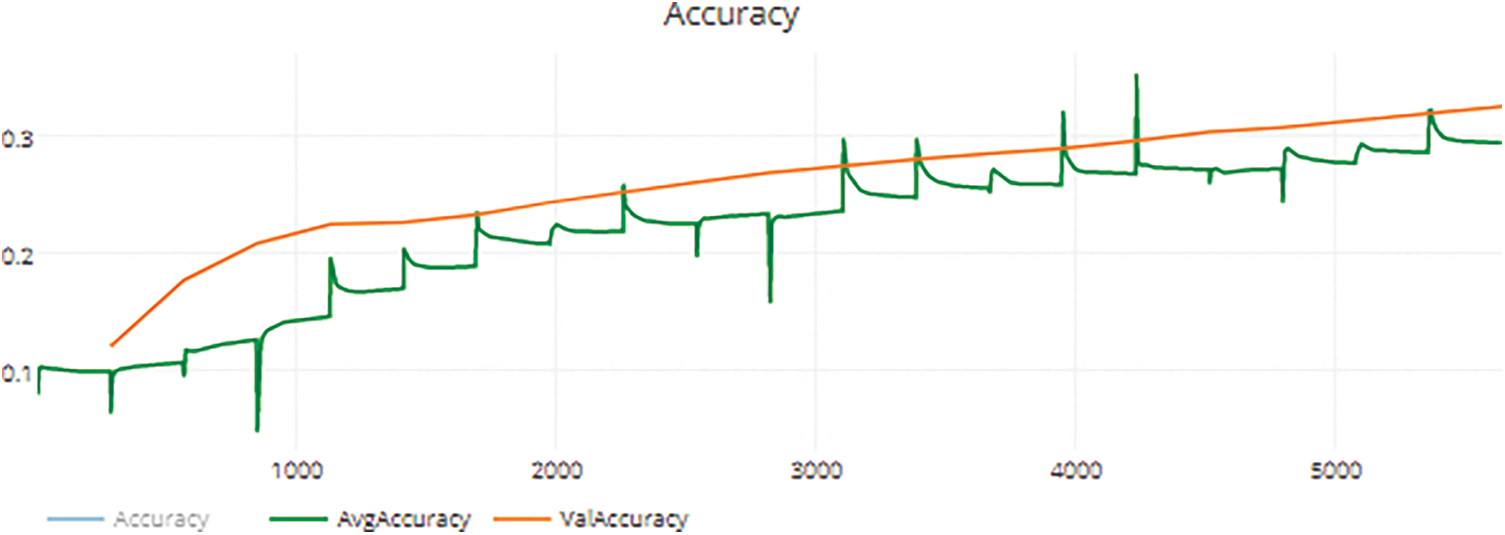
Figure 11: Train acc and val acc
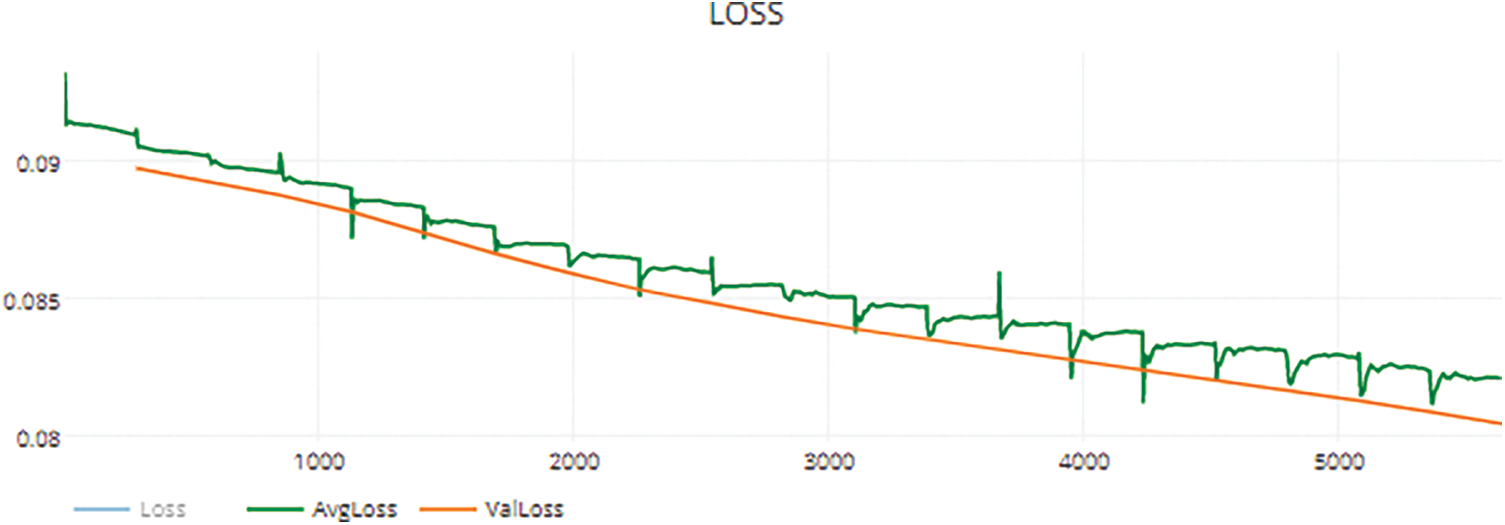
Figure 12: Train loss and val loss
Figs. 13–16 shows the time complexity of PV image dataset, feature extraction, classification and RMVDM respectively.
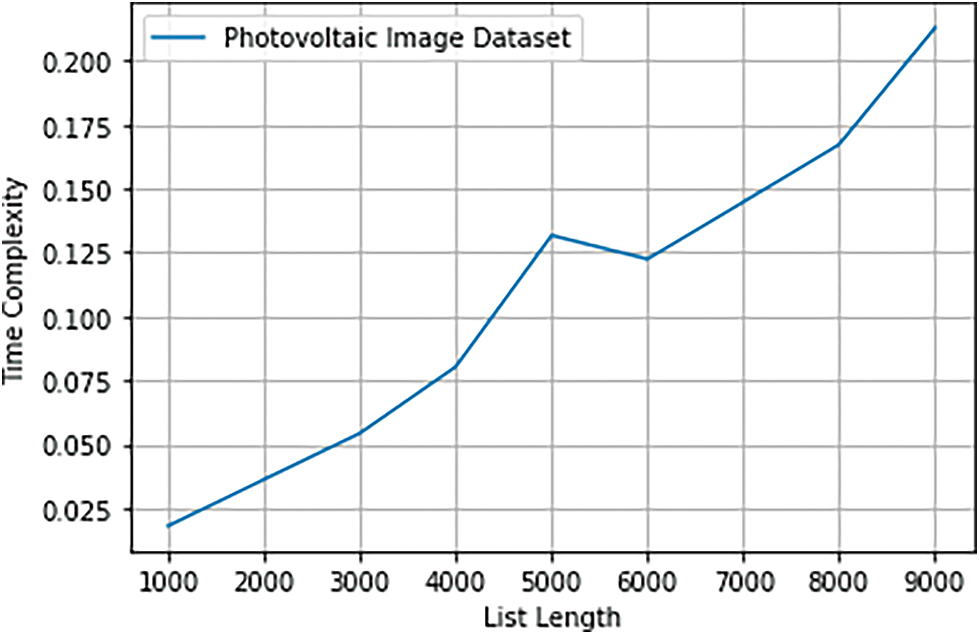
Figure 13: PV dataset time complexity

Figure 14: Feature extraction time complexity

Figure 15: Classification time complexity
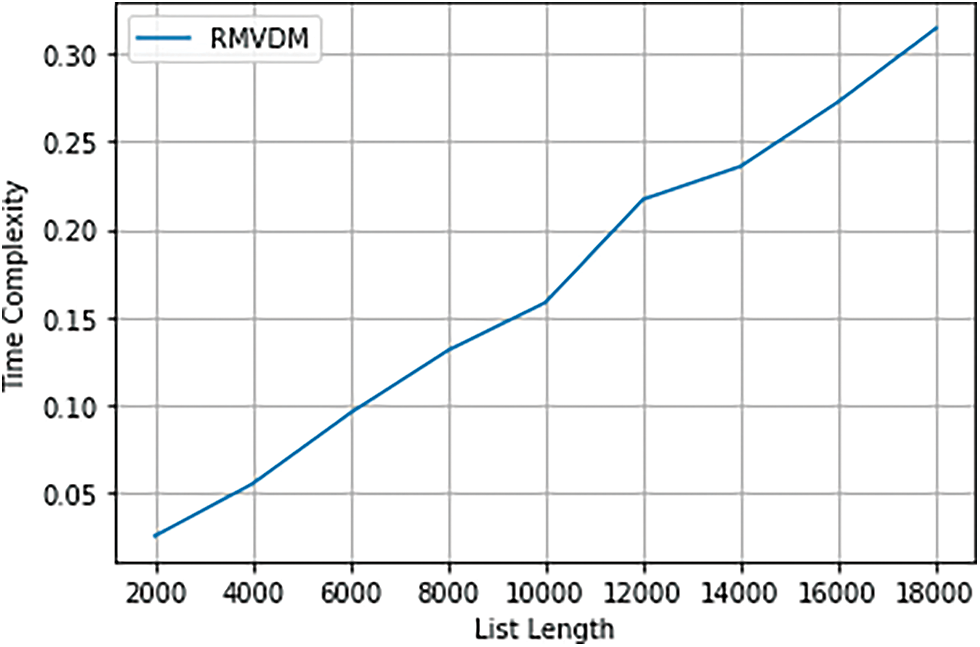
Figure 16: RMVDM time complexity
Using the different PV panel image datasets for training and validation also provides outstanding outcomes. The RMVDM technique needs parameter modification at each phase to adapt to the different PV panel images. One of the primary benefits of the RMVDM technique is that the installation operation is not time-consuming and this solution is perfectly suitable for usage in industrial products. Monitoring is the recurring process to identify the PV panel’s actual progress. In some cases, the same PV panel may be shown in more than one frame, making it possible for the detecting system to miss it.
The algorithm’s worst-case time complexity is represented by the function
With varied numbers of images in each class, the performance of different techniques in defect detection and classification is assessed in Tab. 5 and depicted in Fig. 17. In all situations, the suggested RMVDM model showed greater classification accuracy in the ratios of 91%, 93%, and 98%. The suggested method outperforms existing methods in terms of detection accuracy.
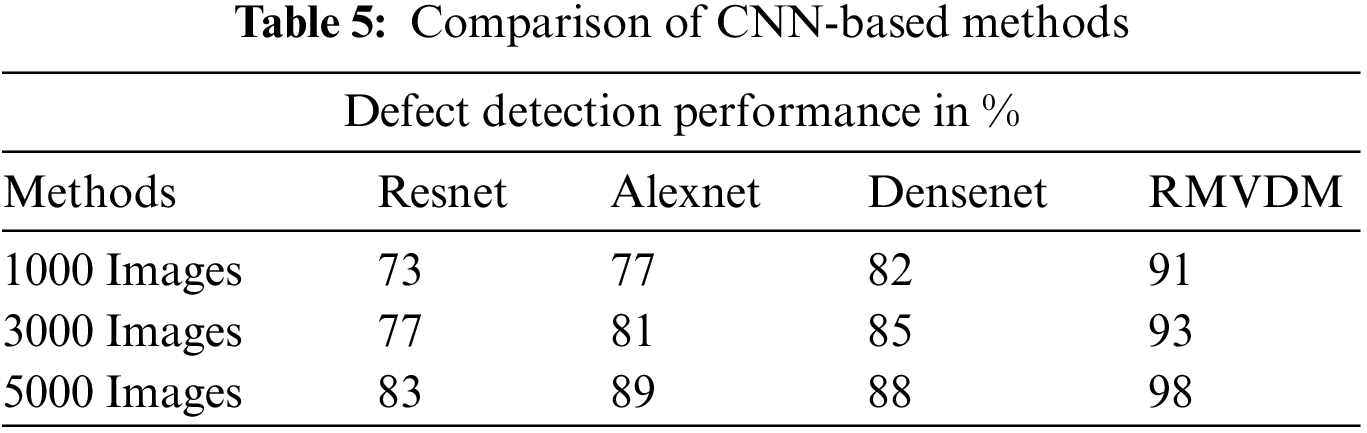
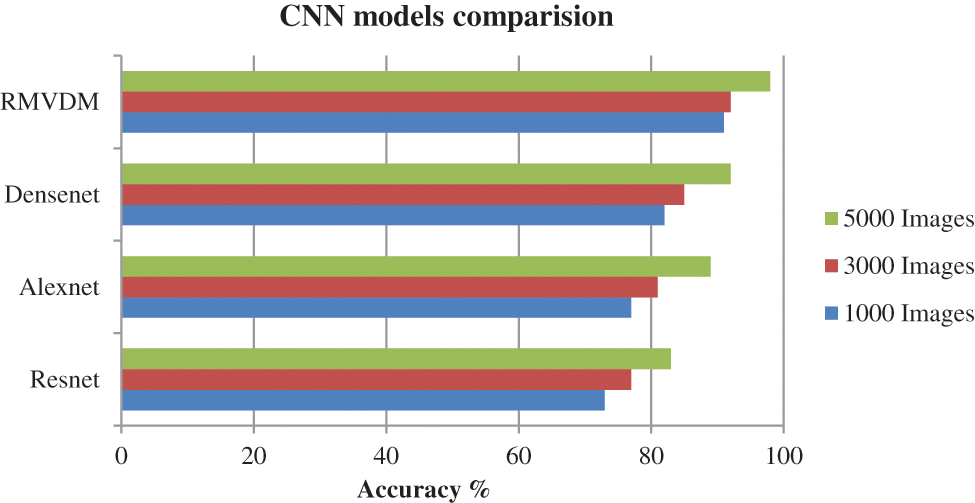
Figure 17: Analysis of defect detection accuracy
The outcomes of the RMVDM architecture with different settings are shown in Tab. 6. It has been changed to certain parameter values to get the best results.
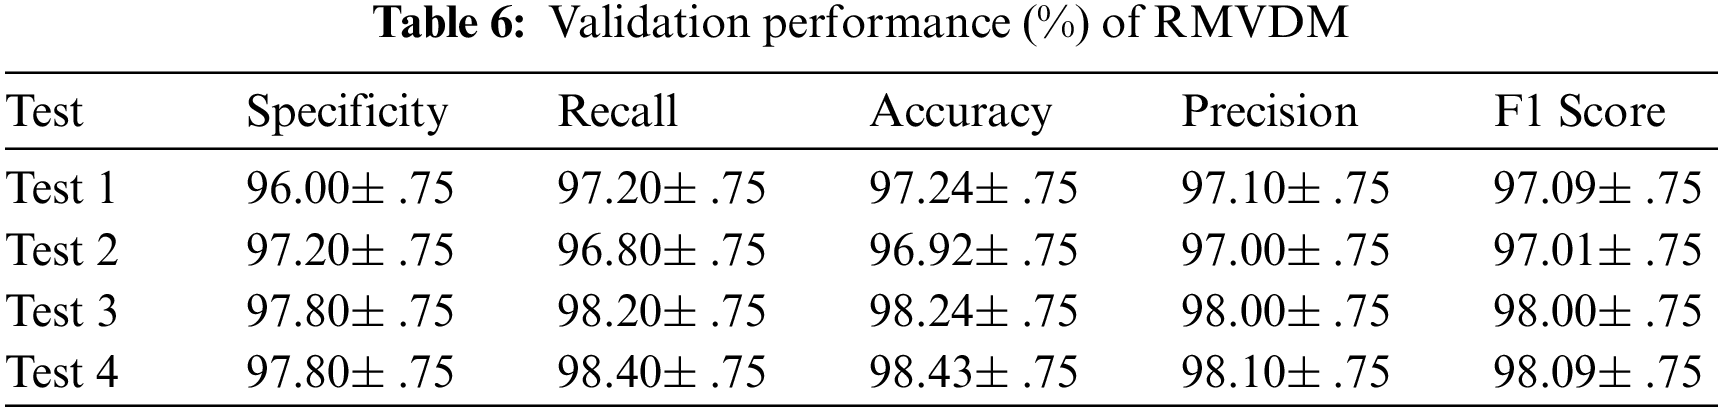
In this present work, the proposed methodology will give high accuracy for every type of defect. Here we used the PV images of broken, crack, fade, and normal to measure the accuracy and loss values. The above graphs consist of two-axis (x, y). The x-axis represents epoch run and the y-axis represents accuracy values. The PV panel is appropriately located in the preceding and subsequent frames; therefore there is no true loss when compared to that of others. The above graphs and tables illustrate model accuracy, recall, F1 score, precision and specificity. The trained CNN has 98% accuracy, so the estimator has a low chance of classifying a negative sample as positive. An F-1 score of 98% suggests that recall and accuracy are almost similar to the network. By recall factor, CNN can locate all positive samples 98% of the time. A CNN with a 0.001 learning rate, 32 samples as batch size, and 100 epochs of training was the best classifier of anomalies in a PV module. Due to restricted training data, ten-fold cross-validation was utilised to train and evaluate the suggested model. When compared to neural networks, the RMVDM architecture has the deepest neural structure.
One of the significant improvements in the neural network architecture is the use of anchor boxes. We can train a CNN to categorize an image as well as to produce the bounding box with four coordinates. In RMVDM, each grid cell rightly guesses the anchor box’s coordinates for which it is responsible for defects. In that way, localization becomes a simple regression issue. As an example, we might use RMVDM model which has a number of convolutional, pooling, and other layers, and reuse the fully connected layer to build a bounding box. This localization technique enables the model to perform better.
A large PV dataset consists of 10,000 different PV images in different categories, which are captured from various places and under various lighting conditions. The existing CNN framework was developed to solve the challenges of identifying PV panel faults using RGB images. Compared with previous deep learning methods, the RMVDM method offers a distinct advantage. Furthermore, it doesn’t require a lengthy process. This proposed CNN based RMVDM method is most appropriate for usage in commercial applications. When tested on solar plant characteristics that the system has never encountered before, the RMVDM detector gets a 98% accuracy rating and gets a recall value of up to 97%. The outcome is somewhat better than that obtained with other techniques.
Acknowledgement: I would like to express my gratitude to my supervisor, Dr.R.Annie Uthra and also thank Dr.J.Preetha Roslyn, who guided me throughout this research.
Funding Statement: The authors received no specific funding for this study.
Conflicts of Interest: The authors declare that they have no conflicts of interest to report regarding the present study.
References
1. J. A. Dhanraj, A. Mostafaeipour, K. Velmurugan, K. Techato, P. K. Chaurasiya et al., “An effective evaluation on fault detection in solar panels,” Energies, vol. 14, no. 22, pp. 7770, 2021. [Google Scholar]
2. S. Djordjevic, D. Parlevliet and P. Jennings, “Detectable faults on recently installed solar modules in western Australia,” Renewable Energy, vol. 67, pp. 215–221, 2014. [Google Scholar]
3. S. Prabhakaran, R. A. Uthra and J. P. Roselyn, “Defect analysis of faulty regions in photovoltaic panels using deep learning method,” in Int. Conf. on Security, Privacy and Data Analytics (ISPDA), Surat, India, vol. 848, pp. 63–78, 2022. [Google Scholar]
4. A. Khan, A. Sohail, U. Zahoora and A. S. Qureshi, “A survey of the recent architectures of deep convolutional neural networks,” Artifcial Intelligence Review, vol. 53, no. 8, pp. 5455–5516, 2020. [Google Scholar]
5. C. L. Buerhop, D. Schlegel, M. Niess, C. Vodermayer, R. Weißmann et al., “Reliability of irimaging of pv-plants under operating conditions,” Solar Energy Materials and Solar Cells, vol. 107, pp. 154–164, 2012. [Google Scholar]
6. P. Guerriero and S. Daliento, “Automatic edge identification for accurate analysis of thermographic images of solar panels,” in 6th Int. Conf. on Clean Electrical Power (ICCEP), Santa Margherita Ligure, Italy, pp. 768–772, 2017. [Google Scholar]
7. P. Banda and L. Barnard, “A deep learning approach to photovoltaic cell defect classification,” South African Institute of Computer Scientists and Information Technologists (SAICSIT), Port Elizabeth, South Africa, pp. 215–21, 2018. [Google Scholar]
8. N. Tijtgat, W. V. Ranst, B. Volckaert, T. Goedeme and F. D. Turck, “Embedded real-time object detection for a UAV warning system,” in IEEE Int. Conf. on Computer Vision (ICCVW), Venice, Italy, pp. 2110–2118, 2017. [Google Scholar]
9. F. Grimaccia, S. Leva and A. Niccolai, “PV plant digital mapping for modules defects detection by unmanned aerial vehicles,” IET Renewable Power Generation, vol. 11, no. 10, pp. 1221–1228, 2017. [Google Scholar]
10. P. Addabbo, A. Angrisano, M. L. Bernardi, G. Gagliarde, A. Mennella et al., “A UAV infrared measurement approach for defect detection in photovoltaic plants,” in IEEE Int. Workshop on Metrology for AeroSpace (MetroAeroSpace), Padua, Italy, pp. 345–350, 2017. [Google Scholar]
11. V. Carletti, A. Greco, A. Saggese and M. Vento, “An intelligent flying system for automatic detection of faults in photovoltaic plants,” Journal of Ambient Intelligence and Humanized Computing, vol. 11, no. 5, pp. 2027–2040, 2019. [Google Scholar]
12. X. R. Zhang, J. Zhou, W. Sun and S. K. Jha, “A lightweight CNN based on transfer learning for COVID-19 diagnosis,” Computers, Materials & Continua, vol. 72, no. 1, pp. 1123–1137, 2022. [Google Scholar]
13. M. Aghaei, S. Leva and F. Grimaccia, “PV power plant inspection by image mosaicing techniques for IR realtime images,” in IEEE 43rd Photovoltaic Specialists Conf. (PVSC), Portland, OR, USA, pp. 3100–3105, 2016. [Google Scholar]
14. M. Aghaei, F. Grimaccia, C. A. Gonano and S. Leva, “Innovative automated control system for PV fields inspection and remote control,” IEEE Transactions on Industrial Electronics, vol. 62, no. 11, pp. 7287–7296, 2015. [Google Scholar]
15. S. Dotenco, M. Dalsass, L. Winkler, T. Würzner, C. Brabec et al., “Automatic detection and analysis of photovoltaic modules in aerial infrared imagery,” in Winter Conf. on Applications of Computer Vision (WACV), Lake Placid, NY, USA, pp. 1–9, 2016. [Google Scholar]
16. W. Sun, G. C. Zhang, X. R. Zhang, X. Zhang and N. N. Ge, “Fine-grained vehicle type classification using light weight convolutional neural network with feature optimization and joint learning strategy,” Multimedia Tools and Applications, vol. 80, no. 20, pp. 30803–30816, 2021. [Google Scholar]
17. M. Laurino, M. Piliougine and G. Spagnuolo, “Artificial neural network based photovoltaic module diagnosis by current–voltage curve classification,” Solar Energy, vol. 236, pp. 383–392, 2022. [Google Scholar]
18. W. Chine, A. Mellit, V. Lughi, A. Malek, G. Sulligoi et al., “A novel fault diagnosis technique for photovoltaic systems based on artificial neural networks, Renewable Energy, vol. 90, pp. 501–512, 2016. [Google Scholar]
19. R. H. F. Alves, G. A. D. Júnior, E. G. Marra and R. P. Lemos, “Automatic fault classification in photovoltaic modules using convolutional neural networks,” Renewable Energy, vol. 179, pp. 502–516, 2021. [Google Scholar]
20. M. Dhimish and V. Holmes, “Solar cells micro crack detection technique using state-of-the-art electroluminescence imaging,” Journal of Science: Advanced Materials and Devices, vol. 4, no. 4, pp. 499–508, 2019. [Google Scholar]
21. C. Dunderdale, W. Brettenny, C. Clohessy and E. E. V. Dyk, “Photovoltaic defect classification through thermal infrared imaging using a machine learning approach,” Progress in Photovoltaics: Research and Applications, vol. 28, no. 3, pp. 177–188, 2019. [Google Scholar]
22. S. A. Zaki, H. Zhu and J. Yao, “Fault detection and diagnosis of photovoltaic system using fuzzy logic control,” in 4th Int. Conf. on Sustainable and Renewable Energy Engineering (ICSRE), Beijing, China, vol. 107, pp. 02001, 2019. [Google Scholar]
23. A. H. Herraiz, A. P. Marugán and F. P. G. Márquez, “Photovoltaic plant condition monitoring using thermal images analysis by convolutional neural network-based structure,” Renewable Energy, vol. 153, pp. 334–348, 2020. [Google Scholar]
24. K. M. Lin, H. H. Lin and Y. T. Lin, “Development of a CNN-based hierarchical inspection system for detecting defects on electroluminescence images of single-crystal silicon photovoltaic modules,” Materials Today Communications, vol. 31, pp. 103796, 2022. [Google Scholar]
25. A. Padilla, C. Londoño, F. Jaramillo, I. Tovar, J. B. Cano et al., “Photovoltaic performance assess by correcting the I-V curves in outdoor tests,” Solar Energy, vol. 237, pp. 11–18, 2022. [Google Scholar]
26. G. Cipriani, A. D’Amico, S. Guarino, D. Manno, M. Traverso et al., “Convolutional neural network for dust and hotspot classification in PV modules,” Energies, vol. 13, no. 23, pp. 6357, 2020. [Google Scholar]
27. A. K. V. de Oliveira, M. Aghaei and R. Rüther, “Aerial infrared thermography for low-cost and fast fault detection in utility-scale PV power plants,” Solar Energy, vol. 211, pp. 712–724, 2020. [Google Scholar]
28. A. A. Jiménez, C. Q. G. Muñoz and F. P. G. Márquez, “Dirt and mud detection and diagnosis on a wind turbine blade employing guided waves and supervised learning classifiers,” Reliability Engineering & System Safety, vol. 184, pp. 2–12, 2019. [Google Scholar]
29. S. R. Madeti and S. N. Singh, “A comprehensive study on different types of faults and detection techniques for solar photovoltaic system,” Solar Energy, vol. 158, pp. 161–185, 2017. [Google Scholar]
30. Y. LeCun, Y. Bengio and G. Hinton, “Deep learning,” Nature, vol. 521, no. 7553, pp. 436–444, 2015. [Google Scholar]
Cite This Article
 Copyright © 2023 The Author(s). Published by Tech Science Press.
This work is licensed under a Creative Commons Attribution 4.0 International License , which permits unrestricted use, distribution, and reproduction in any medium, provided the original work is properly cited.
 Downloads
 Citation Tools