
 Submit a Paper
 Propose a Special lssue
 Open Access
ARTICLE
Epileptic Seizures Diagnosis Using Amalgamated Extremely Focused EEG Signals and Brain MRI
Department of Computer Science, King Saud University, Riyadh, 11543, Saudi Arabia
* Corresponding Author: Farah Mohammad. Email:
Computers, Materials & Continua 2023, 74(1), 623-639. https://doi.org/10.32604/cmc.2023.032552
Received 22 May 2022; Accepted 22 June 2022; Issue published 22 September 2022
 View Full Text
 Download PDF
Abstract
There exists various neurological disorder based diseases like tumor, sleep disorder, headache, dementia and Epilepsy. Among these, epilepsy is the most common neurological illness in humans, comparable to stroke. Epilepsy is a severe chronic neurological illness that can be discovered through analysis of the signals generated by brain neurons and brain Magnetic resonance imaging (MRI). Neurons are intricately coupled in order to communicate and generate signals from human organs. Due to the complex nature of electroencephalogram (EEG) signals and MRI’s the epileptic seizures detection and brain related problems diagnosis becomes a challenging task. Computer based techniques and machine learning models are continuously giving their contributions to diagnose all such diseases in a better way than the normal process of diagnosis. Their performance may sometime degrade due to missing information, selection of poor classification model and unavailability of quality data that are used to train the models for better prediction. This research work is an attempt to epileptic seizures detection by using a multi focus dataset based on EEG signals and brain MRI. The key steps of this work are: feature extraction having two different streams i.e., EEG using wavelet transformation along with SVD-Entropy, and MRI using convolutional neural network (CNN), after extracting features from both streams, feature fusion is applied to generate feature vector used by support vector machine (SVM) to diagnose the epileptic seizures. From the experimental evaluation and results comparison with the current state-of-the-art techniques, it has been concluded that the performance of the proposed scheme is better than the existing models.
Keywords
Epilepsy is a non-communicable disease and one of the most frequent neurological disorders in humans, typically characterized by abrupt attacks [1]. An early aberration in the electrical activity of the brain that affects a part or the entire body is a sudden seizure. Around 60 million people in the world suffer from epileptic seizures of various forms [2]. In some cases, these attacks might induce cognitive problems that can lead to the patient suffering from serious physical injuries. People with epileptic seizures may also experience emotional suffering as a result of their condition and the stigma associated with it. This is why it is important for doctors to be able to recognize and treat epileptic seizures as soon as possible [3].
There are around 50 new occurrences of epilepsy per 100,000 people each year, making it one of the most prevalent neurological disorders [4]. Epilepsy affects roughly 1% of the population, and about a third of those sufferers have refractory epilepsy [5]. There are about 0.5 new epilepsy cases per 1,000 people in the United Kingdom (UK) per year, which equates to about 1% of the population. Doctors in the acute care and emergency departments need to have a thorough understanding of seizures and seizure mimics [6].
If an epileptic seizure can be predicted early enough, medication can be administered to prevent it; this gives doctors plenty of time to prepare. A seizure has four stages: the preictal state, which occurs prior to the onset of the seizure, the ictal state, which occurs during the seizure and is followed by an attack, the postictal stage, which begins following an attack, and the interictal stage, which begins following the postictal stage of a first seizure and ends before the preictal stage of a subsequent seizure [6]. Fig. 1 depicts three alternative input states for each of the channels.
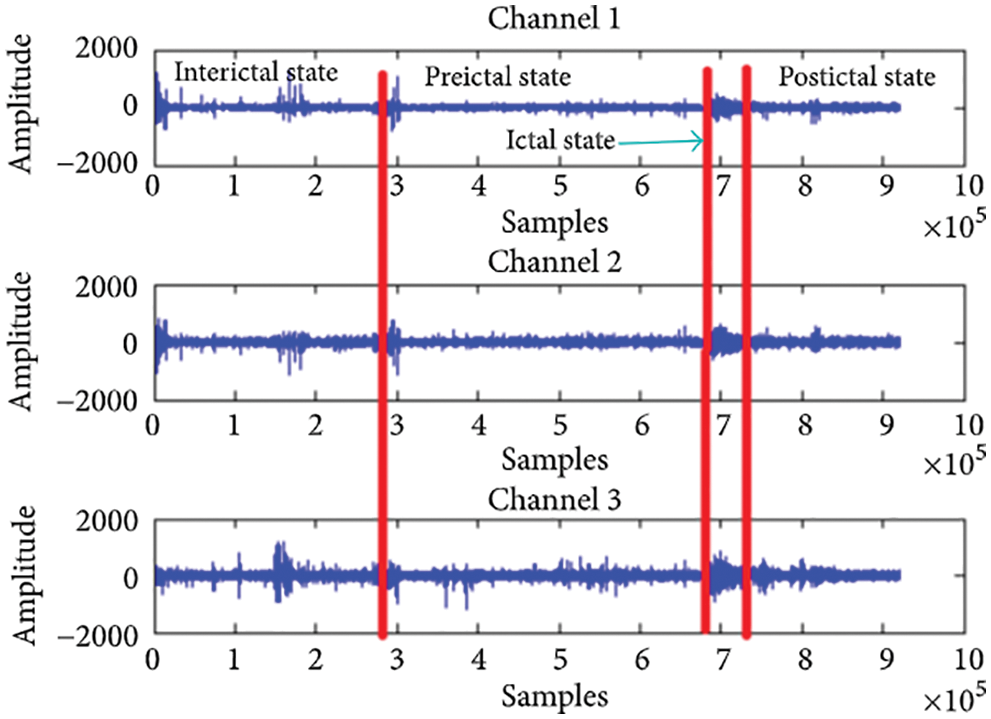
Figure 1: States of epileptic seizure adopted from [5]
Diagnosing seizures and epilepsy relies heavily on clinical history and physical examination, with laboratory testing serving as a supplemental tool [7]. Clinical back-ground, such as premonitory indications, as well as specifics of the seizure itself, including phenomenology, responsiveness, focal features and the postictal state, are important historical facts. Furthermore, detail investigation is engrossed on finding out if an epilepsy syndrome is present, which defines how extensive a diagnosis is, as well as determining therapy and prognosis [8]. EEG, positron emission tomography (PET), magnetoencephalography (MEG), single-photon emission computed tomography (SPECT), functional MRI (fMRI), and electrocorticography (ECoG) are the most important functional neuroimaging methods. When it comes to diagnosing epileptic seizures, studies show that EEG modalities are the most commonly used by doctors [9].
Electroencephalography (EEG) is frequently used because it is inexpensive, portable, and able to display distinct rhythms in the frequency range. Electroencephalograms (EEGs) are used to measure the bioelectric activity of the brain by measuring voltage fluctuations in the brain's neurons. To identify epileptic seizures, it must be documented for a long period of time. These signals are also captured in many channels, making the analysis more difficult. The main power source, electrode movement, and muscle tremor can all introduce distortions into EEG signals. It will be difficult for doctors to detect epileptic seizures based on EEG readings that are too loud. EEG modalities and other methods such as MRI paired with Artificial Intelligence (AI) approaches are being used to diagnose and forecast epileptic episodes [10]. Conventional machine learning and deep learning (DL) approaches have been used in the field of epileptic seizure diagnosis.
As compared to the standard diagnosis process of medical domain, computer-based programs and model also play a vital role in the detection of all such diseases with more accurate results in less time. Epileptic seizures may also be detected by a variety of computer and machine learning based methods that use a wide range of statistical, temporal and frequency-based methods [11]. In all such methods a step-by-step procedure has been adopted that may include the selection of key features and classification in standard machine learning techniques. Moreover, data mining techniques and signal processing expertise are also required to build a benchmark model that work effectively even with sparse amounts of data. The traditional ma-chine learning algorithms may not perform as effectively as they formerly did now that data is so readily available. Thus, the state-of-the-art deep learning (DL) approaches as a sub level method have been used. The methods require large amount of data required for training in DL models, which is unlike standard machine learning approaches. Other issue of feature overfitting may sometime occur in these models when there is a dearth of data due of their extensive feature spaces [12].
There always exists a gape in machine learning model that gives an absolutely re-liable approach for both preprocessing and feature extraction due to the advancement in the nature of dataset, new modification in the models and machine learning pro-grams. This work presents an effective and reliable machine learning model for the prediction of epileptic seizures from EEG signal and brain MRI. The key steps of the proposed model are feature extraction, feature fusion and final classification.
The following are the main contributions of the paper:
• Because of the novelty of the proposed work and very less availability of the required datasets, a new dataset of 5,544 amalgamated images of brain MRI with EEG for classification of seizures and normal diagnosis have been created. The dataset is further divided by using train test split strategy of 80–20, in which 80% are train images and 20% is the test images.
• This research work provides an efficient multi domain based model for seizure detection that is considered to be the better model for seizure detection rather than traditional uni-model methods such as decision tree and association rule mining that relies on EEG only.
• The experimental evaluation of the proposed model has been carried out by using sensitivity, specificity, ROC curve and cross validation. It has been concluded that the proposed model produces better detection than current state-of-the-art techniques.
The rest of the paper is laid out as follows: Section 2 focuses on Materials and Methods, in which proposed technique is explained in detail. Section 3 provides the results in which, experimental data are summarized and compared. Conclusion and future work are discussed in Section 4.
In this section, the proposed epileptic seizure detection technique from an EEG and brain MRI images has been presented. Initially, the description of the main dataset has been outlined, while later on, the feature extraction process based on Singular Value Decomposition (SVD) Entropy from EEG signals and CNN for MRI-Images have been discussed. A standard machine learning model that solely considers images as input might often fail to give improved results when they are blurry or of poor quality. The proposed approach fixes this problem by introducing a hybrid feature extraction method from EEG and MRI image to increase the accuracy of model. The brief description of the proposed model has been provided in below sub section.
In this study, a new dataset based on several web sources of EEG and brain MRI reports of different hospitalized patients has been collected for the experiments. Some of epileptic seizure detection images and EEG signals were also collected from GitHub and Kaggle repositories. However, majority of seizure images were collected from miscellaneous laboratories on public request. The distribution of dataset has been shown in Tab. 1. The images datasets are divided into MRI-I, MRI-II and MRI-III respectively, that contains total 6,896 images in which 3,480 images with a confirmed cases and 3,416 images of normal patients. The images have resized to 260 × 260 resolution.

As far as the EEG signals dataset are concerned, the first dataset EEG-I consists of five subsets EEG-A, EEG-B, EEG-C, EEG-D and EEG-E having exactly 100 pieces of single chancel EEG signal. The length of each signal is recorded as 23.6 s. In the distribution, the EEG-A and EEG-B set were recorded from the scalp skin of five healthy volunteers using the 10–20 standard electrode placement approach. Furthermore, EEG-A is based on volunteer awake with their eyes open and EEG-B is awake with their eye closed respectively. The sets EEG-C, EEG-D and EEG-E is collected from patient’s archive before their surgery. The EEG-II dataset is an open source and publically available on Bonn Barcelona database in the form off 500 single channel signals. This dataset is also of five classes to stream with the previous dataset. While the EEG-III dataset is a manually annotated, labeled and preprocessed data with a particular epileptic seizures and normal EEG signals. This channel distribution of this dataset is also unified with the previous data set to make the process smooth. The labeled of the dataset is marked as 0 (Normal Data) and 1 (Seizures) each of the class having 3905 and 3022 sample respectively.
2.2 Preliminary Pre-processing
In this phase, EEG signals and MRI images have been preprocessed before feature extraction. It is observed that the power line and Electromyography (EMG) generated noises frequently interfere with EEG signals that have significant impact on clinical diagnosis and must be eliminated in order to provide a clearer picture. Therefore, Interferences Reduction Algorithm (IRA) [13] has been applied to preprocessed the dataset. Additionally, the MRI images were filtered to remove noise and then resized to 260 × 260 pixels for better viewing. The epileptic seizure cases for each image in the collection were labeled using a Numpy array. In this work, zero labels stand for epileptic seizure images. Later on the data was merged by concatenate method and at the end, it was randomly shuffled.
The feature extraction process has been carried out in two different dimensions. In the EEG dataset, each individual dataset is stored in two different matrices (Normal and Seizure) containing the sample signals and loaded into Google-Colab [14]. Further on, both matrices are passed to wavelet filter that decompose the signals. Although, there exist numerous methods for signals feature extraction such as Fast Fourier Transformation [15] Eigenvectors and Time-Frequency Distributions [16]. However, wavelet transformation (WT) is considered to be the most optimal method due to its key role in diagnostic field and its noncomplex compression of data points in biomedical signals. In this process, the EEG signals are represented as building block usually called as wavelet. A customized wavelet functions known as shift and stretching on a particular time axis has been applied to raise the obtained wavelet from the mother wavelet. There are two categories of wavelet that are continued and discrete.
The Continuous Wavelet Transform (CWT) can be expressed as:
where x(t) is the EEG signals, a and b are the dilation and translation factors
where,
Alternatively, discrete wavelet transformation (DWT) has also been considered when there exists a need for multi-scale feature extraction in which each scale represents a particular thickness of EEG data. The DWT can be expressed as:
During the decomposition process through WT process, each EEG signal is decomposed into sub bands that are further visualized as shown in Fig. 2. In the very next phase, SVD Entropy has been applied to measure the dimensionality of data [17]. In this work, SVD Entropy is act as an indicator of the number of eigenvector that are essential for providing descriptions of the particular EEG signal.
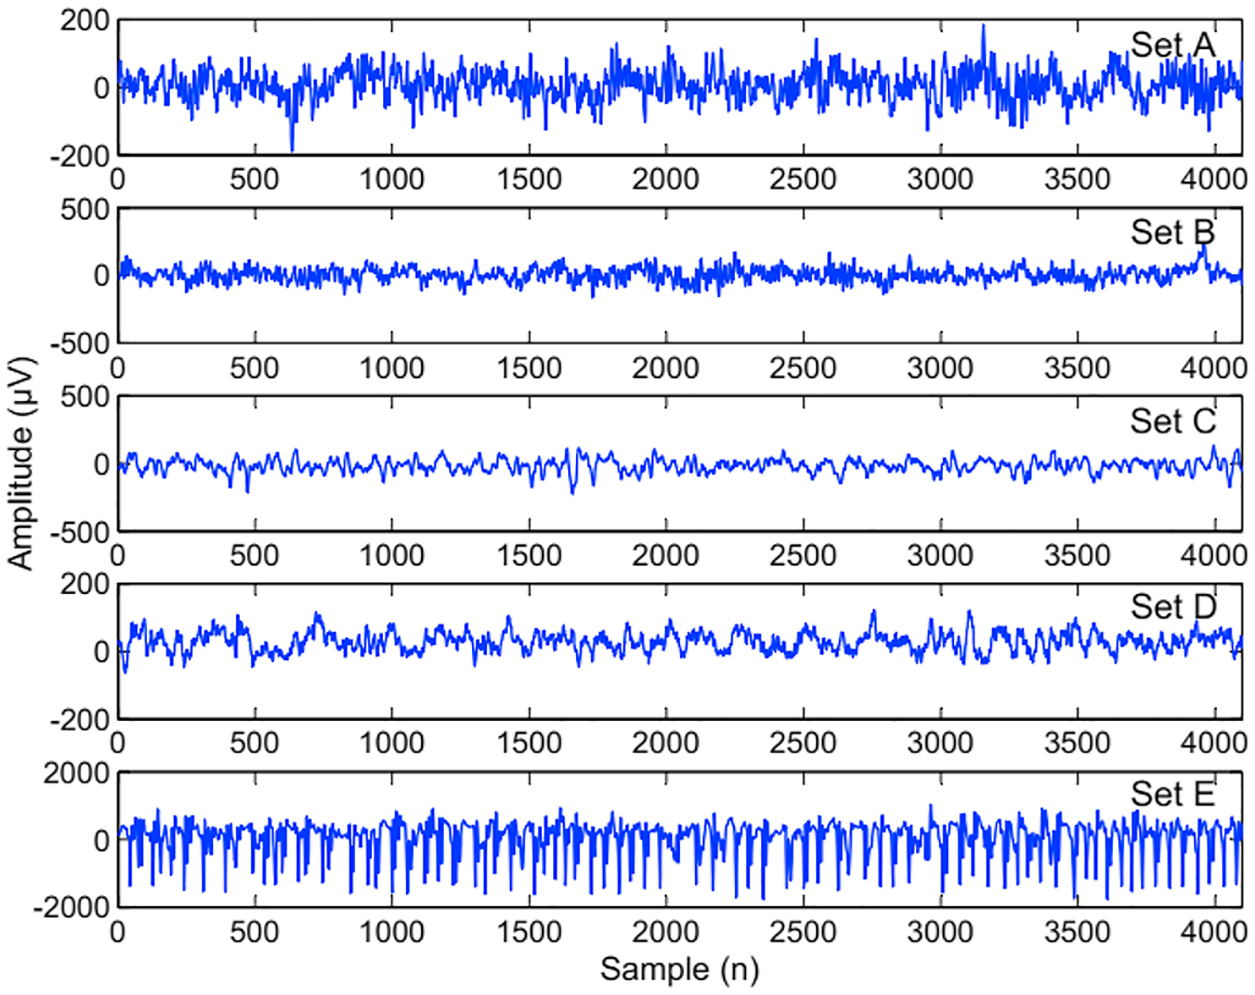
Figure 2: EEG band visualized shape of ellipse signals
The SVD Entropy of a signal Si is defined as:
where K is number of singular value of the embedded matrix (EM) and
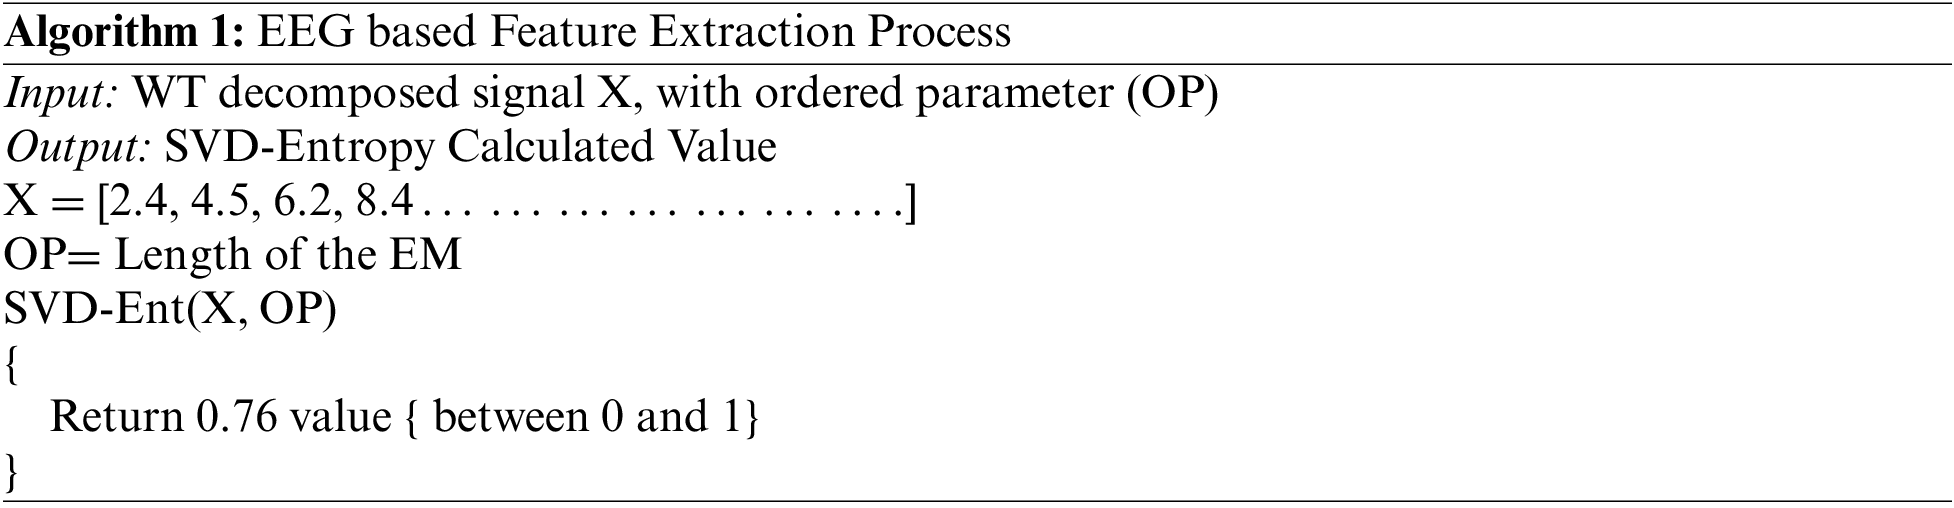
The resultant matrixes of are shown in Fig. 3. Algorithm 1 provides the working of this phase where initially WT based decomposed signals is given as an input.
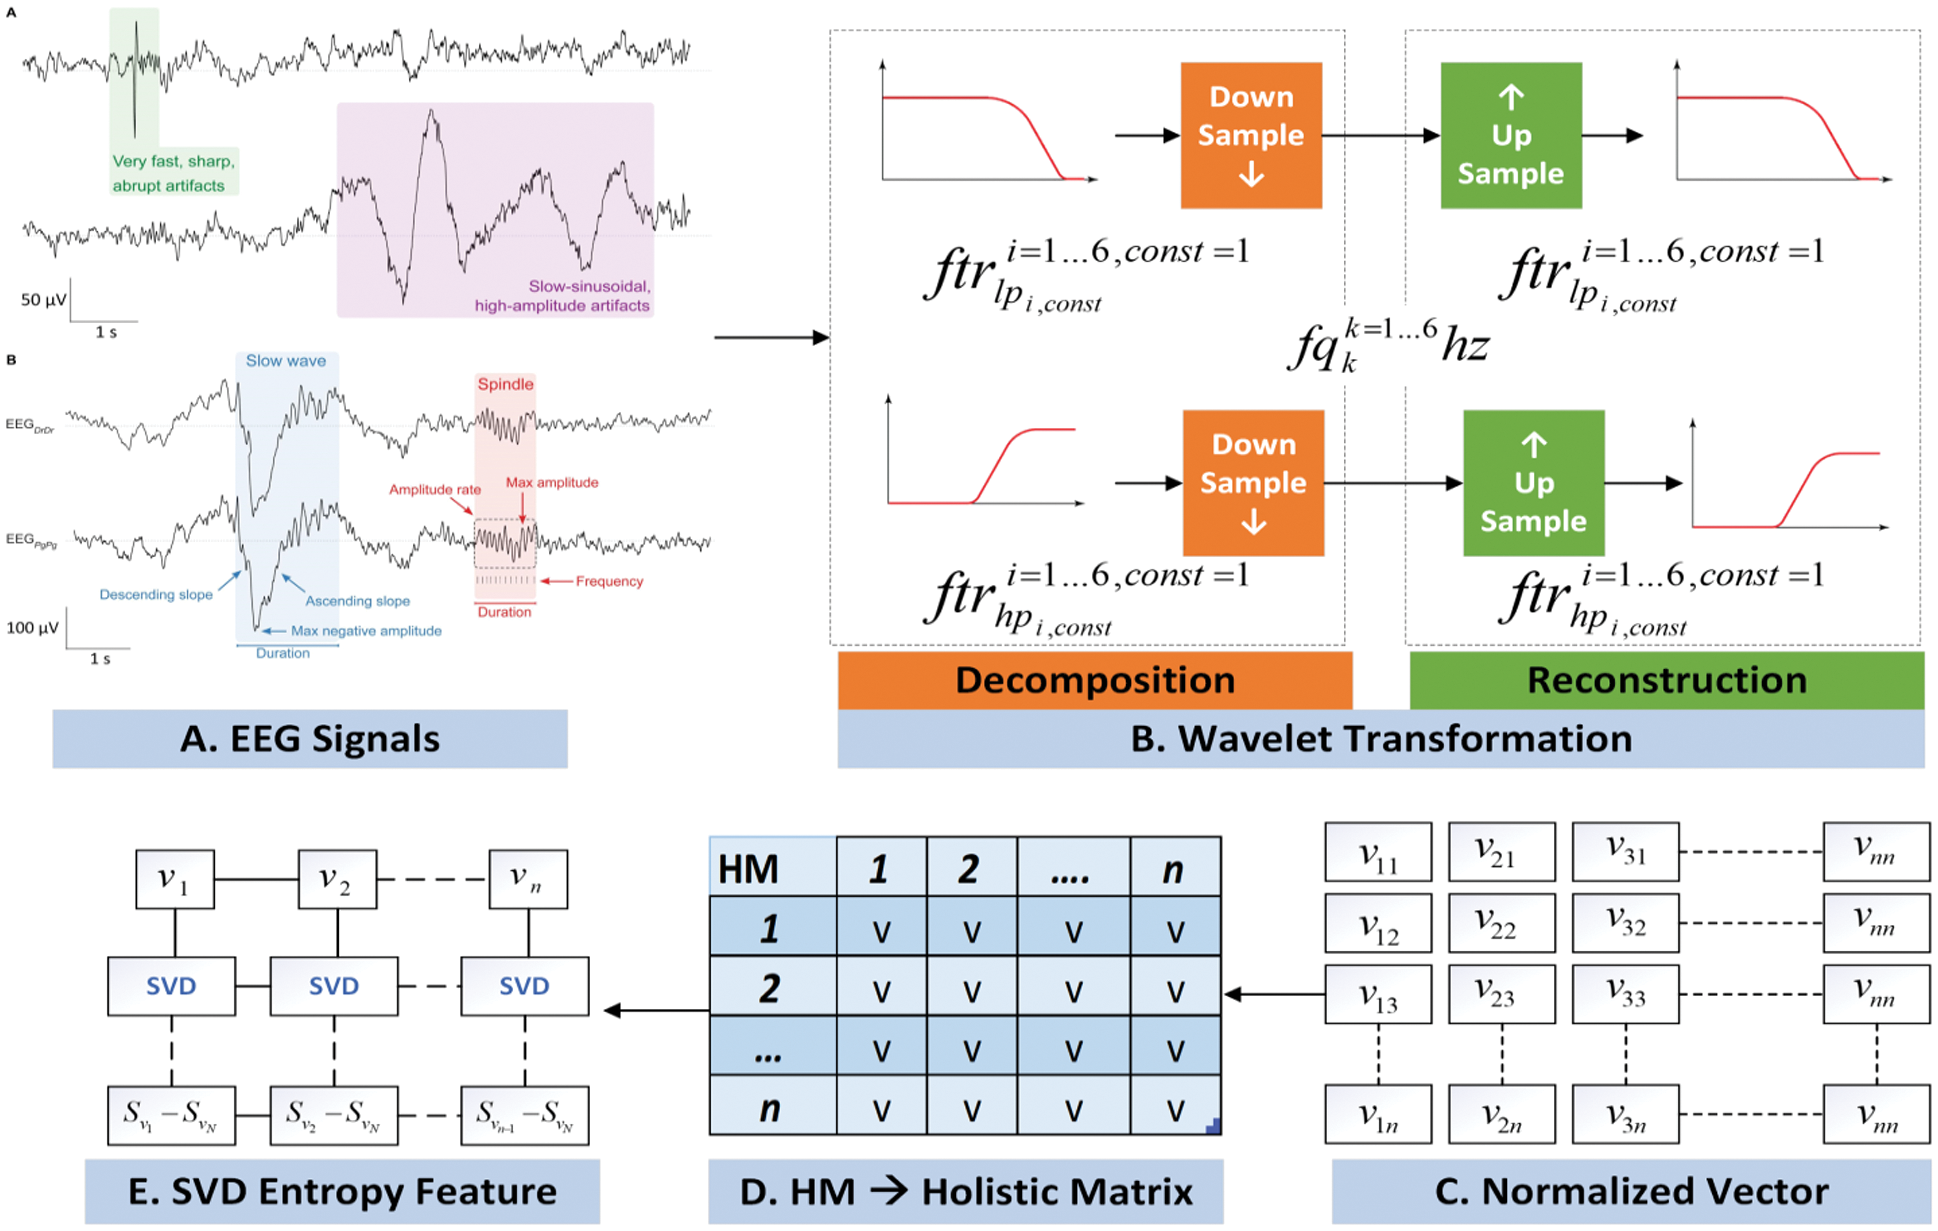
Figure 3: EEG features extraction process
In another stream of the proposed architecture the MRI images data has been filtered and further processed for feature extraction. In order to reduce the complexity of the proposed work a CNN based features extraction strategy has been adopted [18]. The fundamental advantage of CNN over its predecessors is that it discovers essential features without the need for human intervention [19,20]. In this work, the MRI images are resized into a fix size of (32 × 32). The CNN model in the first stage is able to extract the features of the input image at the time of the query by having multiple convolution layers and pooling layers that are built with a different set of filter sizes. The pooling layer will evaluate the most important data while ignoring irrelevant data section. This technique is known as subsampling, and it aims to lower the size of the data map without sacrificing importing data. The convolution layer extracts the features of an input image while learning image features to preserve the relationship between pixels. The most optimal features can be discovered by increasing the number of filters in the convolution layer, but this may increase the cost of training time [21].
With the subsampling-based operation, the pooling layer retains the most valuable information and reduces the parameter set. Finally, the fully connected layer defined a vector matrix that is further processed for next phase.
After the formation of two different types of features vectors, the obtained features are coupled by applying feature fusion strategy. This process facilitates the classification of by increasing fault tolerance. In the fusion process, both types of features are set into a same network that is further mapped into a single dimensional feature vector. The feature vector process is a formation of FV1 (EEG feature set) and FV2 (Image based features) with equal dimensional. The final fusion feature vector (FFV) is formed by using Eq. (7).
whereas, W1 and W2 are the fusion weight that are computed during the training process. After the fusion layer, two fully connected layers are used to classify the in-put signals. There are hundreds of neurons in the first and in the last fully connected layer corresponds to the categories of classification tasks. Softmax is used to convert the vector of the final fully linked layer into a probability distribution form. [22].
After the formation of the feature set, the classification phase is initiated as shown in Fig. 4. There is a plethora of classification algorithms available, of which the Support Vector Machine (SVM) is a state-of-the-art technique that is the most widely used for classification, and it has been shown to achieve higher accuracy and computational efficiency than some other traditional classification approaches [23]. A no longer increases classification performance; instead, the classification starts with more discriminative features and gradually adds fewer discriminative features as input to the SVM classifier as the classification progresses. When compared to conventional classifiers, SVM are capable of dealing with extremely huge feature spaces and exhibiting good generalization capabilities. It is also important to limit the risk of structural misclassification while training an SVM classifier, whereas classical classifiers are often trained to decrease the risk of empirical misclassification (as opposed to structural misclassification).
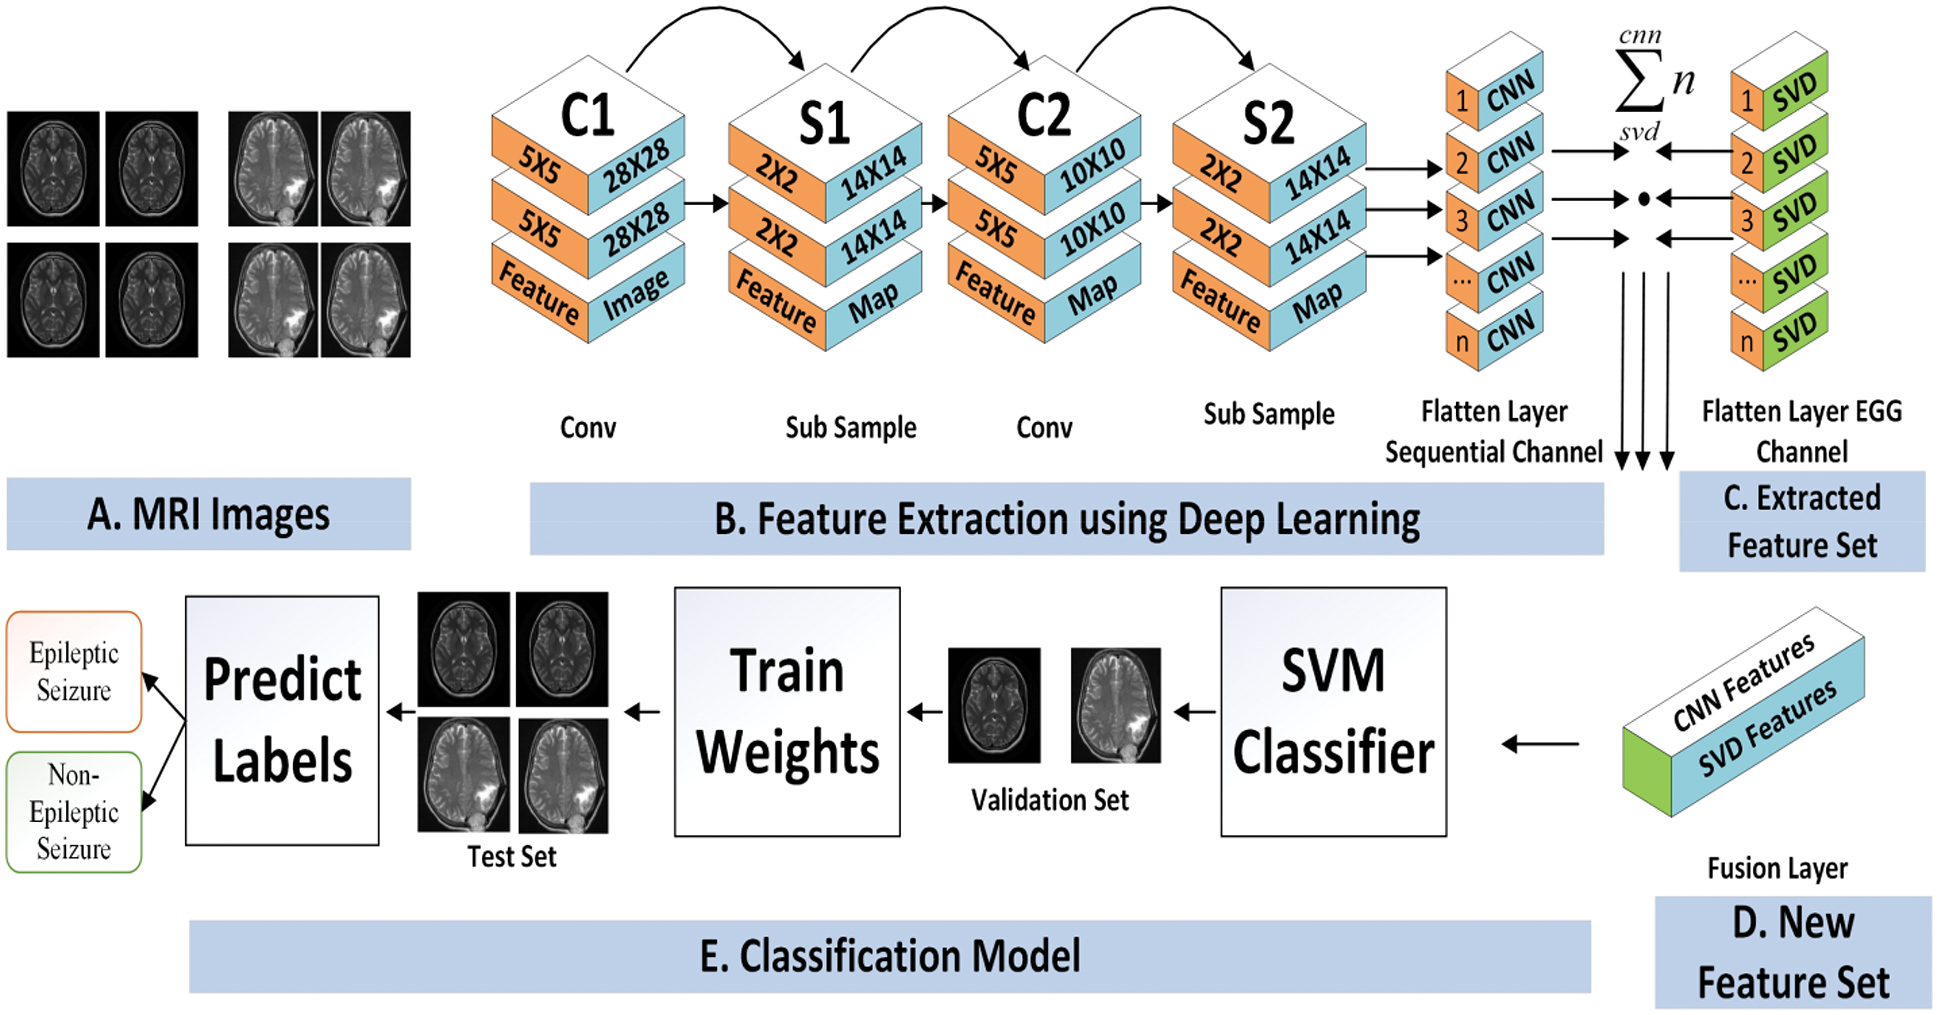
Figure 4: CNN based feature extraction and seizures prediction
SVM is based on a linear separable optimum classification hyperplane, whose essential is to identify the support vector required to generate the ideal classification hyperplane in the training sample [24]. This is due to the solution of a quadratic optimization problem in mathematics, which can be traced back to this period [25]. First, SVM maps input data into a high-dimensional vector space using an algorithm called a nonlinear transformation. Next, it builds an optimal classification hyperplane in the feature space to develop a linear classification. Finally, it maps the data back to the original space and turns it into an impute space classification using a nonlinear transformation.
Assume {Ti, Vi} ∀Ni = 1 be a training dataset, where T is the input sample, and V is the label of classes (Seizures and Normal). Then the hyperplane is defined as
where t is a point representation on hyperplane, w is the orientation and d represents distance from the origin to hyperplane. A quadratic optimization problem in mathematics can be implicated for the phenomenon. Nonlinear classification in the imputation space is achieved by first mapping the input data into a high-dimensional vector space via a nonlinear transformation, followed by the construction of the optimal classification hyperplane in the feature space to build the linear classification.
As sample of linear separable is:
In Eq. (9), n is the dimension of space sample, yi is the category of sample and l is the total number of training sample
The linear discriminant function in the dimension 0.225 + space
Cite This Article
 Copyright © 2023 The Author(s). Published by Tech Science Press.
This work is licensed under a Creative Commons Attribution 4.0 International License , which permits unrestricted use, distribution, and reproduction in any medium, provided the original work is properly cited.
 Downloads
 Citation Tools