
 Submit a Paper
 Propose a Special lssue
 Open Access
ARTICLE
Value-Based Test Case Prioritization for Regression Testing Using Genetic Algorithms
Department of Software Engineering, Bahria University, Islamabad, Capital, Pakistan
* Corresponding Author: Tamim Ahmed Khan. Email:
Computers, Materials & Continua 2023, 74(1), 2211-2238. https://doi.org/10.32604/cmc.2023.032664
Received 25 May 2022; Accepted 12 July 2022; Issue published 22 September 2022
 View Full Text
 Download PDF
Abstract
Test Case Prioritization (TCP) techniques perform better than other regression test optimization techniques including Test Suite Reduction (TSR) and Test Case Selection (TCS). Many TCP techniques are available, and their performance is usually measured through a metric Average Percentage of Fault Detection (APFD). This metric is value-neutral because it only works well when all test cases have the same cost, and all faults have the same severity. Using APFD for performance evaluation of test case orders where test cases cost or faults severity varies is prone to produce false results. Therefore, using the right metric for performance evaluation of TCP techniques is very important to get reliable and correct results. In this paper, two value-based TCP techniques have been introduced using Genetic Algorithm (GA) including Value-Cognizant Fault Detection-Based TCP (VCFDB-TCP) and Value-Cognizant Requirements Coverage-Based TCP (VCRCB-TCP). Two novel value-based performance evaluation metrics are also introduced for value-based TCP including Average Percentage of Fault Detection per value (APFDv) and Average Percentage of Requirements Coverage per value (APRCv). Two case studies are performed to validate proposed techniques and performance evaluation metrics. The proposed GA-based techniques outperformed the existing state-of-the-art TCP techniques including Original Order (OO), Reverse Order (REV-O), Random Order (RO), and Greedy algorithm.Keywords
There are limited time and costs available for regression testing. There is a chance to stop, or halt testing earlier due to these resource constraints and leave it incomplete. Incomplete regression testing is always a threat to the application, and it can harm business operations. The intelligent utilization of testing resources and smart execution of test cases is key to testing success. There are three types of regression optimization techniques including TCS, TSR, and TCP. TCS is widely applied in the industry, but it is not risk-free because it is based on selection. Similarly, TSR cannot guarantee that only unrelated test cases are eliminated from the test suite. On the other hand, TCP does not reduce or remove test cases from the test suite. That is why it is more secure, reliable, and popular in practice and a lot of research work is being done in this field.
TCP is one of the ways for optimized regression testing [1]. Gregg Rothermel et al. defined the TCP problem as follows [2]. Suppose T is a test suite, PT is a set of permutations of T, and f is a function from PT to real numbers, f: PT→R. Prioritization Goal: To find a
The core objectives of TCP include early fault detection, quick product maturity, efficient utilization of testing resources, and an increased APFD rate. There are several TCP techniques available to achieve these objectives. Some of the categories of TCP techniques include risk-based [3], history-based, coverage-based, fault-based, search-based, and requirements-based [4]. Search-based TCP techniques help in finding the best test case order by searching in the global search space. Search-based techniques include greedy algorithm, genetic algorithm, additional greedy, hill climbing, etc. The search-based TCP techniques may produce suboptimal results because they may construct results that denote only local minima in the global search space [5].
Most of the existing TCP techniques are designed in a value-neutral fashion. The performance evaluation of these techniques is also done in a value-neutral fashion. The metric commonly used for their performance evaluation is the APFD and it is based on the assumption that all faults have the same severity and all test cases have the same cost [6]. This assumption rarely holds in practice. The existing TCP techniques are based on traditional coverage metrics like statement coverage, function coverage, method coverage, and branch coverage. Recent studies are evident that 100% coverage does not mean 100% bug detection [7]. All software requirements and code segments are not of equal worth because they have different values. Therefore, the traditional coverage metrics are not the best adequacy criterion for TCP. Similarly, there is a notion that all faults are of equal severity [8]. The traditional APFD metric is completely based on this notion. The existing TCP approaches have been dominantly validated through APFD without considering the severity and criticality of the faults. The APFD rate is not an appropriate criterion for the performance evaluation of TCP techniques where test cases vary in terms of cost and faults vary in terms of severity. A cost-cognizant metric APFDc is available for fault-severity detection based on TCP [6]. But as per the best of the authors’ knowledge, there is no value-cognizant metric available for coverage-based TCP. Due to these limitations, TCP techniques and their performance evaluation metrics are likely to produce unsatisfactory and unreliable results. Therefore, a mechanism is required to overcome these limitations by taking value considerations into account.
To address these limitations, two value cognizant TCP approaches are proposed here including Value-Cognizant Faults Detection-Based Test Case Prioritization (VCFDB-TCP) and Value-Cognizant Requirements Coverage-Based Test Case Prioritization (VCRCB-TCP). The case study method is adopted as a research methodology. The proposed techniques are searched based and implemented using GA. These are different from other GA-based techniques because they are based on business value. Their objective function is to improve fault detection in terms of business value and to improve requirement coverage in terms of business value. For performance evaluation of the proposed techniques two value cognizant metrics are proposed in this paper including Average Percentage of Fault Detection per Value (APFDv), and Average Percentage of Requirements Coverage per Value (APRCv). The proposed techniques have been evaluated through two case studies by using the dataset of multiple versions of different health care applications developed using .Net technologies. These are developed by a US-based software company to support care management of Accountable Care Organization (ACO)-based population. We used this company’s original dataset because they are managing the business value of requirements and bug severity and test cases. They have a traceability matrix of test cases vs. bugs and test cases vs. requirements. There is no public dataset available with a business value-based test case vs. bugs coverage matrix and test cases vs. requirements coverage matrix. The proposed techniques are evaluated by using the proposed metrics APFDv and APRCv. The results are compared with the state-of-the-art TCP techniques. The proposed techniques produced better results than other techniques. The rest of the paper is organized as follows. Section 2 gives an overview of the related work and Section 3 presents proposed value-based TCP techniques and evaluation metrics. The evaluation and results of the case studies are presented in Section 4. Threats to validity are presented in Section 5 and the conclusion and future work are given in Section 6.
In this section, the existing TCP techniques have been summarized. An algorithm is proposed for automatic prioritization of test cases based on output diversity as a representation of fault revealing probability and test coverage information [9]. In this technique, a dynamic prioritization based on the greedy algorithm is taken because test coverage information was already there and the size of the test suite to be prioritized was small containing around 500 test cases. A TCP technique is proposed using the Firefly Algorithm with a fitness function using a similarity distance model [10]. This technique outperformed Particle Swarm Optimization (PSO), Local Beam Search (LBS), Greedy algorithm, and Genetic Algorithm (GA). A supportive tool sOrTES is introduced to measure independence and ranking of integration test cases based on execution time and requirements coverage [11]. An approach for ordering JUnit test cases is proposed by using optimization heuristics including the Genetic Algorithm (GA), Simulated Annealing (SA), Ant Colony Optimization (ACO), and Multi-Objective Genetic Algorithm (MOGA) [12]. Ant Colony Optimization (ACO) based techniques are used to solve coverage-based TCP problems and are better than Genetic Algorithm based techniques [13].
A dissimilarity clustering-based TCP technique has been proposed using historical data and is reported to be better than random and similarity-based techniques, therefore this adequacy criterion for test prioritization can be risky [14]. A structural coverage-based TCP technique has been proposed as an optimal process including branch coverage, decision coverage, or statement coverage [15]. An epistasis-based Ant colony optimization algorithm is proposed for TCP [16]. It provides better results than traditional ACO-based techniques and NSGA-II algorithms in terms of APSC, and execution time. A tie-breaking coverage-based prioritization technique is proposed using lexicographical ordering through a Greedy Algorithm [17]. Alessandro Marchetto et al. [18], has proposed a multi-objective TCP technique that uncovers both technical and business faults early. The proposed technique is a metric-based approach implemented through NSGA II and is evident to improve both fault detection and execution time. It considers code coverage, requirements coverage, and execution time. A dissimilarity-based TCP technique has been proposed by using historical failure data analysis [19]. It generates clusters of similar test cases and prioritizes the test cases based on dissimilarity. The proposed technique has been validated with random ordering, untreated ordering, and similarity order. It provided better APFD values than other comparison techniques. A TCP technique has been proposed for JUnit test cases without having coverage information [20]. It is based on static call graphs to estimate the code coverage ability of JUnit test cases. The prioritization of test cases is then made based on estimated code coverage instead of real code coverage information. The performance of this technique is then evaluated and compared with untreated, random, and dynamic coverage-based techniques. It is found that the proposed technique is better than random, and untreated prioritization but almost near to dynamic TCP in terms of APFD. A prioritization approach (MR-TCP) has been proposed based on method-level risk computation [3]. The risk value of test cases is calculated based on risk values of correlating methods within a system under test. Then test cases are prioritized based on associated risk values. The reported empirical evaluation shows that MR-TCP produced good results in terms of APFD in comparison with original order (OO-TCP), random order (RO-TCP), and reverse order (REO-TCP), ANN approach (ANN-TCP), and total method coverage approach (TMC-TCP). A hybrid criteria TCP technique is proposed for a higher average fault detection rate [21]. An adaptive randomized TCP technique has been proposed in [22]. This technique is input-based and was validated through experience, and it showed that it provides higher APFD than the other code coverage-based techniques including greedy, GA, and ART. This technique is more efficient than greedy and genetic but less efficient than ART.
A FAST family of prioritization techniques has been described in [23]. The FAST techniques handle huge size test suites by utilizing Big Data techniques to achieve scalability in TCP to meet current industrial demands. The coverage-based technique usually does not consider non-code-based software artifacts like configuration files [24]. An empirical study was performed in [25], which is a clustering approach that combines fault prediction for TCP. This claims an improvement in the effectiveness of TCP. A Total coverage-based TCP approach using a modified genetic algorithm has been proposed in [26]. This approach targets to improve condition coverage and execution time. A similarity-based risk-driven TCP in combination with fault prediction has been proposed in [27]. In this approach, the risk of a test case increases if it is similar to a failing test case. It is better than the conventional risk measure where the risk of a test case rises if it is the very same test case, that failed in the past. A history-based TCP approach has been proposed in [28] by using TITAN technology. The objective of this approach was to maximize fault detection and test coverage. A machine learning-based TCP technique has been proposed for black-box testing [29]. This technique showed that the natural language description of test cases plays a very important role in TCP. Due to this feature APFD value can be increased for all machine learning algorithms. An optimized test prioritization technique has been proposed by using an ant colony optimization (ACO) algorithm [30]. The objective of this technique is to increase the fault detection rate and reduce regression testing costs and time. For active learning of relationship extraction, lexical dependency paths have been employed [31,32].
A bat-inspired algorithm BITCP is proposed for TCP providing a good complexity percentage of fault detection correlation [33]. The cost of individual test cases is considered for prioritizing the test cases. A multi-perspective technique for TCP is proposed for a time constraint environment. It considers the technical perspective, business perspective, and performance perspective. The objective of this technique is faster fault detection with maximum test case execution with higher failure frequency and cross-functional coverage [34]. A quality-aware TCP (QTEP) technique is proposed considering the likely dispersal of the faults in the code [35]. Test cases are prioritized based on the fault proneness of the source code. The test cases covering fault-prone source code are awarded high priority. A technique is proposed for the prioritization of the combinatorial tests set by using data flow techniques [36]. It provides a higher fault detection rate than unordered test cases. The similarity of test cases, tuples covered, and length of test cases are considered for combinatorial testing. A value-based PSO algorithm is proposed for TCP that is claimed to be more robust and efficient than random prioritization [37]. The value-based cost-cognizant TCP techniques deal with the severity of faults and the cost of test cases in the prioritization process [38]. The value-based TCP takes the challenge of integrating value consideration into the prioritization process. The value orientation in TCP ensures that prioritization satisfies its value objectives. In practice, 80% of the value exists in a 20% portion of the software [39,40]. This fact supports the need for value-orientation in software testing. But a limited number of value-based cost-cognizant TCP techniques are available in the literature. Systematic literature is performed that reveals that value-orientation is vital in the TCP process to achieve its intended goals and there is great potential in this research domain [41]. Using the right metric for performance evaluation of TCP is very imperative to get reliable and correct results. Different metrics have been developed to measure the performance of different permutations of test cases in a test case suite. APFD is a standard metric used for performance evaluation of TCP techniques and was introduced by Sebastian Elbaum et al. in 2000 [42]. It is the most popular metric and is dominantly used by researchers who worked to solve the TCP problem. APFD is presented by Eq. (1).
In this formula, m is the total number of faults detected and n is the total number of test cases, and TFi is the order of the first test case that reveals fault Fi. This is a value-neutral metric based on the assumption that all faults have the same severity, and that all test cases have the same cost [24]. This assumption rarely holds in practice. This metric is very likely to produce unsatisfactory results in cases where the severity of faults and cost of test cases vary. APFDc metric was proposed to overcome the shortcomings of the APFD metric [6]. APFDc considers varying test cases cost and fault severity. This new cost-cognizant metric was proposed in a value-based fashion. It accounts for units of faults’ severity exposed by units of test cases’ cost. APFDc is presented in Eq. (2).
In Eq. (2), fi is the severity of fault i, ti is the cost of test case i, and TFi is the order of the first test case that detects fault i. APFDc is also widely used as a performance evaluation metric for TCP techniques. Two cost-cognizant prioritization techniques have been discussed including additional statement coverage prioritization (st-addtl) and additional function coverage prioritization (fn-addtl) in [6]. In st-addtl, the author estimated the criticality of the statement by the severity of faults that occurred in that statement. Similarly, the criticality of function is estimated by the severity of faults that occurred in that function. Test cases are then prioritized on the “statement criticality ratio cost of test case” for st-addtl prioritization. Similarly, test cases are prioritized on the “function criticality ratio cost of the test case” for fn-addtl prioritization. Estimating the criticality of statements, and functions through the severity of their associated faults is not an appropriate method used in prioritization. We believe that the term “value” is more appropriate instead of criticality. The value of statements and the value of functions should be estimated through the business value of the requirement with which they are associated instead of estimated through fault severities.
3 Proposed Value-Based TCP Technique
The proposed technique has two variants. The first variant is VCFDB-TCP shown in Fig. 1 and its performance evaluation metric is represented by Eq. (4). The second variant is VCRCB-TCP shown in Fig. 2 and its performance evaluation metric APRCv is represented by Eq. (6). Two case studies are performed to validate the proposed techniques. Case study 1 is applied to VCFDB-TCP and the results are presented in the “evaluation and results” section. Case study 2 is applied to VCRCB-TCP and the results are presented in the “evaluation and results” section.

Figure 1: Overview of Value-based TCP

Figure 2: Cost vs. severity
3.1 Value-Cognizant Fault Detection-Based TCP (VCFDB-TCP)
The purposed technique assumes that regression test cases are already there along with their execution history and bugs association. A traceability matrix of test cases vs. bugs is designed based on the execution history of test cases available in DevOps. In this technique, test cases are prioritized based on their value of Severity Detection Score (SDS). The measure “SDS” for a test case is the fault severity detection per execution time of a test case. The proposed VCFDB-TCP is depicted in Fig. 1. The formula for severity detection score can be represented by Eq. (3).
For a test case, the Severity Detection Score (SDS) is the sum of the severity of faults detected that are not already detected by any other test case. For the test cases presented in Tab. 1, the measure SDS is presented in Tab. 2.


According to SDS in Tab. 2, A, C, B is the best order of execution. Tab. 3 is showing the performance results of different orders of test cases in the test case suite evaluated in terms of APFDv. The value of APFDv is calculated by using the formula given in Eq. (4). In this paper, a new metric Average Percentage of Fault Detection Per Value (APFDv) is proposed.

This metric provides the measure of average percentage detection of fault severity ratio test case execution time for a given order of test cases in a test suite. For test case execution the term test case cost is used. The metric formula is given in Eq. (4).
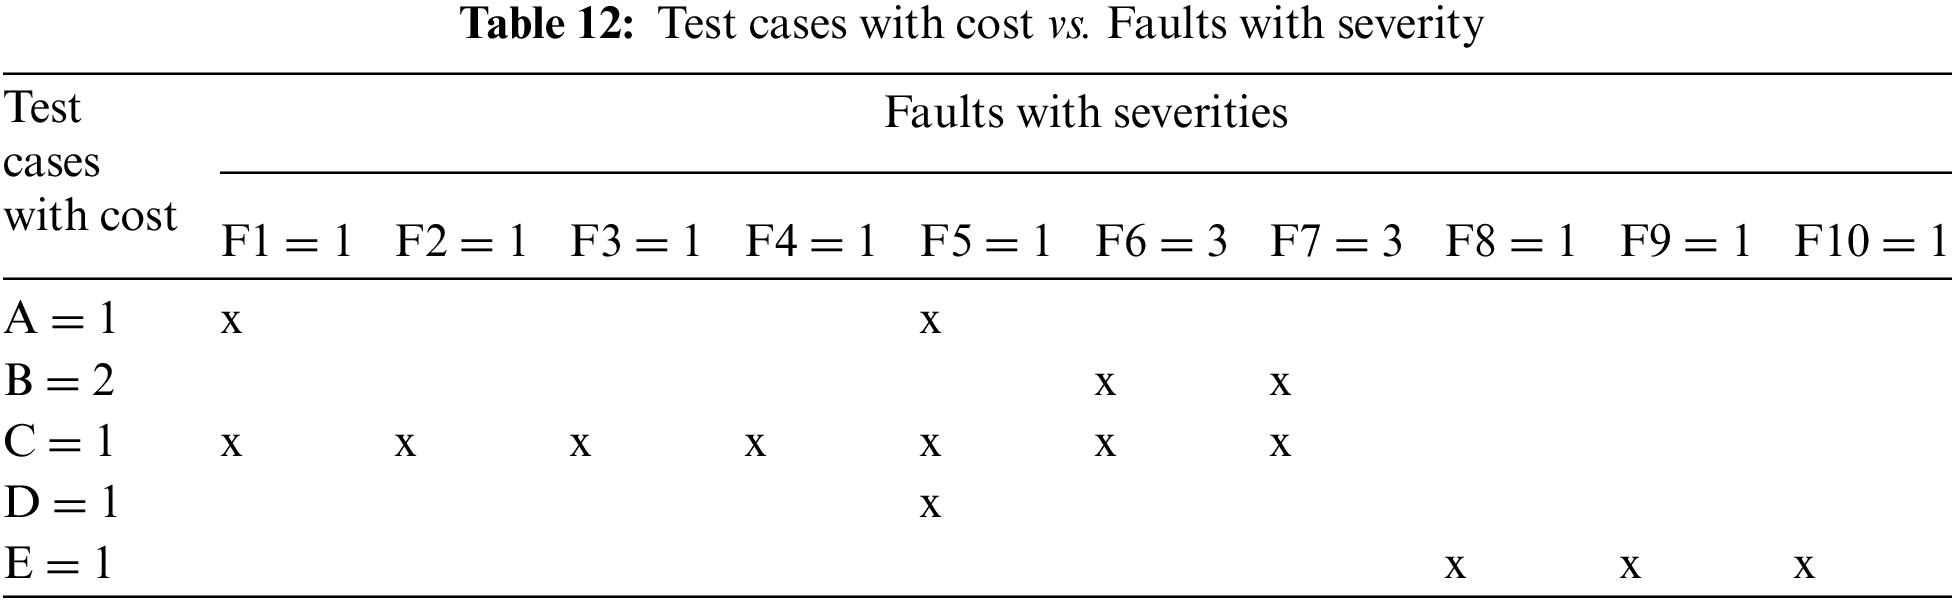
In this equation, TFi is the order of the first test case that detects fault Fi, Si is the severity of fault Fi, and Ci is the cost of the test case. This formula is derived from the native formula of APFD proposed by Sebastian Elbaum et al. in 2000 [42]. The metric APFDv accommodates varying test case costs and fault severity. It is also applicable when test case cost and fault severities are the same. The metric APFDv is supposed to evaluate the performance of different prioritization orders. It is not supposed to estimate fault severities and test case costs. It works when fault severities and test case costs are already known. If severity and cost values are not known, it still works by considering that each test case has a cost 1 and each fault has a severity of 1. It deals with cost and severity as equal units. To understand the working of the proposed metric, consider the example given in Tab. 4 containing test cases with cost vs. faults with a severity which is depicted in Fig. 2. We calculate the APFDv value for the orders T5, T2, T1, T4, T3.

The graph in Fig. 2 shows that 72% of tests detected 100% severity. In percentage, the resultant value of APFDv is 86.00%. The minimum value of APFDv can be 0 and the maximum can be 100. Now we consider four different cases to understand the working of the proposed metric. Tab. 5 shows Case 1 where all test cases have the same and all faults have severity. Tab. 6 shows Case 2 where all test cases have the same cost, but fault severity varies. Tab. 7 presents Case 3 where all faults have the same severity, but test case cost varies. Tab. 8 presents Case 4, where both test cases’ cost and fault severities vary.


In Case 1, the value of APFDv is equal for both the orders T1, T2, T3 and T2, T1, T3. The exchange of T1 and T2 order does not affect the result because they both detect 1 fault each. In Case 2, the value of APFDv for the order T2, T1, T3 is higher than that of the order T1, T2, T3 because the detection per cost of faults severities of T2 is higher than T1. The APFDv metric distinguished the order T2, T1, T3 from T1, T2, T3 and demonstrated better results for it.
In Case 3 presented in Tab. 7, the value of APFDv for the order T1, T2, T3 is higher than that of order T2, T1, T3 because the detection per cost of faults severities of T1 is higher than T2. The APFDv metric distinguished the order T1, T2, T3 from T2, T1, T3 and demonstrated better results for it. In Case 4 presented in Tab. 8, the value of APFDv for the order T1, T2, T3 is higher than that of order T3, T2, T1 because the detection per cost of faults severities of T1 is higher than T3. The APFDv metric distinguished the order T1, T2, T3 from T3, T2, T1 and demonstrated better results for it.
GA is used for VCFDB-TCP. GA is a search technique used to find approximate or true solutions for search-based problems. In this paper, we consider the APFDv metric as a suitable fitness function to guide value-based TCP. We used GA for the proposed technique because it is widely used to solve optimization problems. Value-based regression test prioritization is also an optimization problem. GA works on a search space and begins with a random population of permutations. It is based on natural genetics and provides better results. It is highly parallelizable as compared to other search-based algorithms [43].

We followed the order crossover of genes within a chromosome and this style was adopted by Antoniol et al. [44] An order crossover is performed to generate a new chromosome. An order crossover is performed at the middle position. The first half of genes are shifted to the second half and the second half of genes are shifted to the first half. Swap mutation is used as a mutation process. New test orders or permutations are generated by randomly swapping the position of two test cases.
3.2 Value-Cognizant Requirements Coverage-Based TCP (VCRCB-TCP)
The purposed technique assumes that regression test cases are already there along with their execution history and requirements association. A traceability matrix of test cases vs. requirements is designed based on the execution history of test cases available in DevOps. In this technique, test cases are prioritized based on their business value coverage. The measure of “Business value coverage” for a test case is the ratio of requirements for business value coverage per execution time of a test case. The value-cognizant requirements coverage-based TCP is depicted in Fig. 3.

Figure 3: Value-cognizant requirements coverage-based TCP
The formula for business value coverage can be represented by Eq. (5).
The requirements total business value coverage of a test case is the sum of the covered business value of requirements by the test case that is not already covered by any other test case. In Eq. (5), if the sum of business value covered is V, and the test case execution time is C then for the test cases presented in Tab. 9, the Business Value Coverage (BVC) is presented in Tab. 10.


The test case T1 covers R3 which has a business value of 4 and the execution time of T1 is 3. Dividing 4 by 3 results in 1.33 so the BVC of T1 is 1.33. The test case T2 covers R1 and R2 having business values 2 and 1, respectively. The total business value covered by T2 is 3 and its cost is 1 so its BVC is 3. The test case T3 covers R1 but it is already covered by T2 therefore BVC of T3 is 0. Now test cases can be prioritized by greatest to least business value coverage. According to coverage score criteria, T2, T1, T3 is the best order of execution. Tab. 11 is showing the performance results of different orders of test cases in the test case suite in terms of the Average Percentage of Requirements Coverage Per Value (APRCv). The value of APRCv is calculated by using the formula given in Eq. (6).

In this paper, we propose a new metric APRCv. It is a value cognizant metric that provides the measure of the average percentage of business value coverage of requirements per cost of test cases for a given order of test cases in a test suite. The metric formula is given in the following Eq. (6).
In Eq. (6), TRi is the order of the first test case that covers requirement i, Ri is the business value of requirement i, and Ci is the cost of a test case. The metric APRCv is supposed to evaluate the performance of different test case orders for the requirements coverage-based TCP technique. It assumes that the business value of requirements is already known. According to the test case set and requirements set presented in Tab. 9, the value of APRCv for the test case order T2, T1, T3 is 94.00% which is the best order.
Every testing technique, approach, and methodology is proposed to add value to the testing process. This is important to analyze and evaluate what value a new technique has added. To evaluate the effectiveness of the proposed techniques, the case study method is adopted. Two case studies are performed and are described in Sections 4.1 and 4.2. To compare the performance of the proposed VCFDB-TCP we took two already published example cases. We used the same dataset tables and our proposed technique. We compared the performance of the proposed technique with the existing value-based metrics APFDc and APFDv. APFDc is an existing cost-cognizant metric that incorporates varying test case costs and fault severity [6]. This was introduced to overcome the limitations of the APFD metric. APFDc is not derived from APFD and is a little bit complex. On the other hand, the metric APFDv proposed in this paper is as simple as APFD. APFDv is derived from the native evaluation metric APFD. From the performance point of view, APFDv is better than APFDc and it produces better results. For performance comparison of APFDv and APFDc, let us take two example cases.
Example Case 1: Example 1 shown in Tab. 12 is reported in [6]. It contains five test cases and ten faults. The authors assumed that test case B has cost 2 and all other test cases have cost 1. Similarly, faults F6 and F7 have a severity of 3 and all other faults have a severity of 1. Tab. 13 shows the comparison of results of APFDc and APFDv for the test case orders A, B, C, D, E, and B, A, C, D, E. It demonstrates that APFDv has better results than APFDc.

Example Case 2: Example 2 shown in Tab. 14 is reported in [45]. It contains five test cases and four faults. The test case cost and severity of faults are shown in Tab. 14. Tab. 15 shows the comparison of the results of APFDc and APFDv for the test case orders E, D, C, B, A, and A, B, C, D, E. It demonstrates that APFDv provides better results than APFDc.


Both Example Case 1 and Example Case 2 proved that the performance of the APFDv metric is better than the APFDc metric. Both example datasets are taken from already published papers. Hence APFDv is the right metric for performance evaluation of value-cognizant TCP techniques.
This section describes a case study conducted to evaluate the performance of VCFDB-TCP. The purpose is to answer the following abstract-level research question.
RQ1: What is the performance of VCFDB-TCP compared to the existing state-of-the-art TCP techniques in terms of APFDv?
As an object of our study, two software products are selected from the healthcare domain that is developed by a US-based Healthcare IT company. These are developed to support the Accountable Care Organizations (ACO) business. An ACO is an Accountable Care Organization that comprises a group of doctors, health care providers, and physicians who voluntarily join to manage high-quality coordinated care of Medicare patients attributed to them [46]. The dataset used for the case study is described in Tab. 16 which is related to two healthcare products to evaluate the performance of the proposed VCFDB-TCP technique in terms of specified performance goals. The dataset is collected from the Azure DevOps system in which the population care management projects are managed through the scrum model. Product development is managed through the scum model. Each release is comprised of a set of features. A feature can have many requirements. Test cases are designed against requirements. Bugs or faults are filed against the execution of test cases. Each fault is associated with a test case and each test case is associated with a requirement. A complete traceability matrix is developed through a fully automated process. Microsoft configuration management tools Azure DevOps, and Microsoft Test Manager (MTM) is used for the automated testing life cycle. The extracted dataset comprises test cases, faults, and fault detection information. The test cases also include their execution time or cost, and faults include their severities. Test case execution time is recorded by Microsoft Test Manager and fault severities are defined by test experts by using standard guidelines. The test cases and fault data are collected for the last three releases against Product A and Product B. Product A is a healthcare management system developed for care analytics. Its current version is V7, it has 87132 lines of code and was developed using .Net/MVC technologies. Product B is a healthcare-related application developed for the care management of patients. Its current version is V7, it has 97450 LOC and was developed using .Net/MVC technologies. The dataset specifications are given in Tab. 16.

To answer the established research question, fault detection capability is used as the testing criteria. This fault detection capability is taken in a value-based fashion where the severity of faults and test cases cost is considered. The fault detection capability of a test case is the ratio value of total severity detected and total cost consumed. We extracted the test cases vs. faults matrix along with test cases cost and severity of faults. Fault severity detection is the coverage criteria to be optimized.
The performance of the proposed technique is compared with four other state-of-the-art techniques including OO, REV-O, RO, and Greedy algorithm [3,5,47]. A greedy Algorithm is a search-based algorithm that is implemented to find the “next best” [5]. The element with the highest weight is selected first followed by the second highest, third highest, and so on. A greedy algorithm is used to solve TCP problems in many research papers [2,48].
The dominant metric for performance evaluation of TCP techniques is APFD but this is not applicable for value-based TCP where test cases execution time, the severity of faults, or business value of elements may vary. There are two value-based cost-cognizant APFDc and APFDv for performance evaluation of our proposed value-based TCP technique. Example case 1, and example case 2 proved that APFDv is producing better results than APFDc. Therefore, we used APFDv as a performance evaluation metric because the performance goal of the proposed VCFDB-TCP is to increase the average percentage of faults severity detection per value.
In this section, the results have been presented to answer the defined research question. The results of the case study are compared in terms of APFDv for the proposed and existing state-of-the-art approaches and are presented in Tabs. 17 and 18.
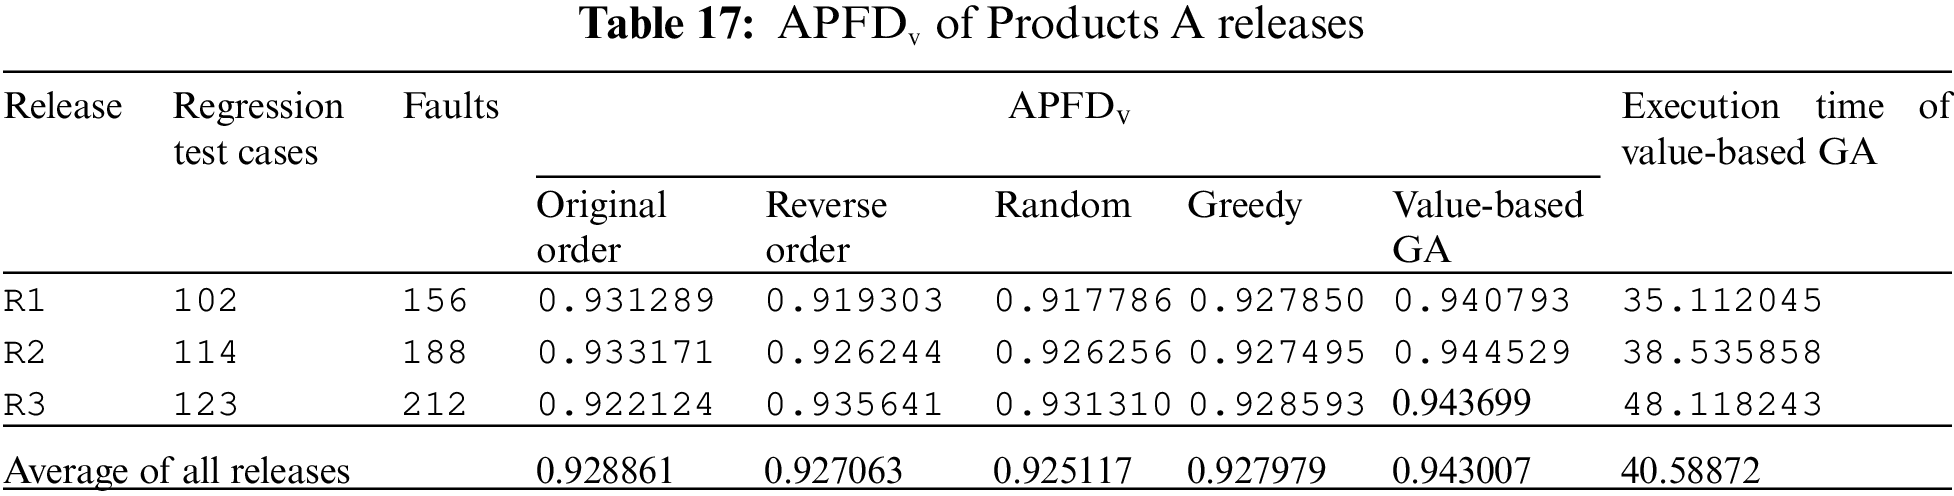

The performance results of all three releases are averaged out. Tab. 17 shows that the performance of the proposed technique is better than OO, RO, REVO, and Greedy approaches in terms of APFDv against all releases of Product A. The proposed technique outperformed state-of-the-art techniques. The performance of RO approach was the worst among all the techniques. The performance of OO was second best. The results are presented in a box plot chart in Fig. 4.

Figure 4: Performance results of Product A releases
Tab. 18 depicts the performance results of different releases of product B. It shows that the performance of the proposed technique is better than OO, RO, REVO, and Greedy approaches in terms of APFDv against product B.
A pictorial representation of the results is given in the box plot chart in Fig. 5. The proposed technique outperformed existing state-of-the-art techniques in terms of APFDv. OO is the second-best performer and REVO is the least performer. The reason for the better performance of the proposed GA-based TCP is that it gives higher priority to test cases with higher severity detection rate with respect to cost resulting in a higher APFDv value as compared to other comparison techniques.

Figure 5: Performance results of Product B releases
The proposed technique is the GA-based search optimization TCP technique implemented using python language. The execution of GA is based on some termination criteria. The algorithm will terminate its execution if reached an optimal solution that is 100% APFDv reached. In this paper, termination criteria are based on the number of iterations. The number of iterations is a value taken as user input. The user can increase the number of iterations if results are being improved gradually. Each iteration processes five permutations and calculates APFDv against the dataset. The execution time of implemented technique is based on the number of iterations. Against each release dataset, we executed it with 25, 50, 100, 200, 400, and 800 iterations and recorded its APFDv and maximum execution time. Tabs. 19 and 20 show the value of APFDv and maximum execution time for a different number of iterations against each release. The average maximum execution time of products A and B are 40.02367 s and 47.11399 s respectively.
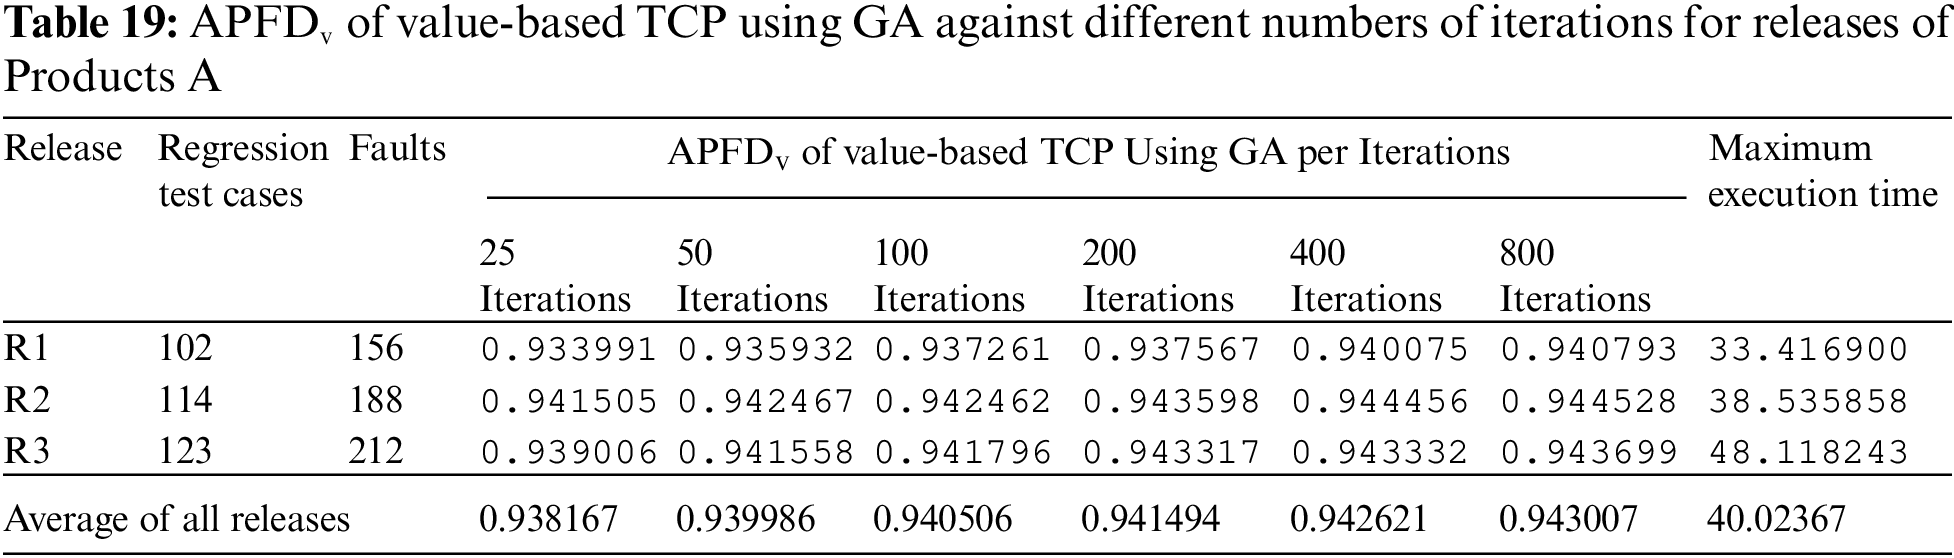

The APFDv value trend with the different numbers of iterations for Product A is depicted in Fig. 6. The graph shows that as the number of iterations increases, the APFDv value increases gradually. The growth trend in all three releases of product A is almost consistent.

Figure 6: APFDv trend per number of iterations for Product A
Similarly, the APFDv value trend with the different numbers of iterations for Product B is depicted in Fig. 7. The graph shows that as the number of iterations increases, the APFDv value increases gradually. The growth trend in releases R1 and R3 of product B is consistent. For R2, the APFDv value declined with 200 iterations and then improved with 400, and 800 iterations gradually. The overall trend of increase in APFDv value with a greater number of iterations is consistent. A different number of iterations are exercised for different releases of Product A and Product B. With 800 iterations, the results almost got mature.

Figure 7: APFDv trend per number of iterations for Product B
This section describes a case study conducted to evaluate the performance of VCRCB-TCP. The purpose is to answer the following research question.
RQ2: What is the performance of VCRCB-TCP compared to the existing TCP techniques in terms of APRCv?
This section describes the context of the case study. As an object of our study, two healthcare applications developed by a US-based software company are selected. These applications are developed to support ACO business in the USA. The performance goal of the proposed VCRCB-TCP is to increase the average percentage of requirement coverage in a value context. The dataset for this study is comprised of a test case set, requirements set, and coverage information. The test cases also include their execution time or cost, and requirements include their business value. The test case execution time is recorded by MTM, and requirements business value is defined by the business analysis team by using expert judgment techniques. Data is collected against three releases. The dataset is collected from the Azure DevOps system in which the population care management projects are managed. Test cases are designed against requirements. Each requirement is associated with a test. The test cases set, requirements set and coverage information for the last three releases are collected against Application A and Application B. Application A is a healthcare management system developed for care analytics. Its current version is V12, it has 65028 lines of code and was developed using .Net/MVC technologies. Application B is a healthcare-related application developed for the care management of patients. Its current version is V12, it has 88210 LOC and was developed using .Net/MVC technologies. The dataset specifications are given in Tab. 21.

To answer the established research question, requirements coverage is used as the testing criteria. This coverage is taken in a value-based fashion where the business value of requirements and test cases cost is considered. The business value coverage of a test case is the ratio value of total requirements business value covered and total cost consumed. The test cases vs. requirements coverage matrix along with test cases cost and business value of requirements are extracted. The requirement’s business value is the coverage criteria to be optimized.
The performance of the proposed technique is compared with four other state-of-the-art techniques including Original Order (OO), Reverse Order (REV-O), Random Order (RO), and Greedy algorithm.
Coverage-based methods are most prominent in TCP, therefore most of the researchers evaluated the performance of their proposed techniques with this method [38]. The metric for performance evaluation of requirements coverage-based TCP techniques is APRC but this is not applicable for value-based requirements coverage-based TCP where test cases execution time and the value of requirements vary. In this study, the proposed performance evaluation metric APRCv is used for the performance evaluation of VCRCB-TCP. The metric APRCv is presented by Eq. (6) in Section 3.2.
In this section, the results of the study have been presented to answer the defined research question. The results of the case study are compared in terms APRCv for the proposed and existing state-of-the-art approaches and are presented in Tabs. 22 and 23.


The performance results of all three releases are averaged out. Tab. 22 shows that the performance of the proposed VCRCB-TCP technique is better than the OO, RO, REVO, and Greedy approach in terms of APRCv against all releases of Application A. The proposed technique outperformed state-of-the-art techniques. The performance of the Greedy approach was the worst among all the techniques. The performance of OO was second best. The results are presented in a box plot chart in Fig. 8.
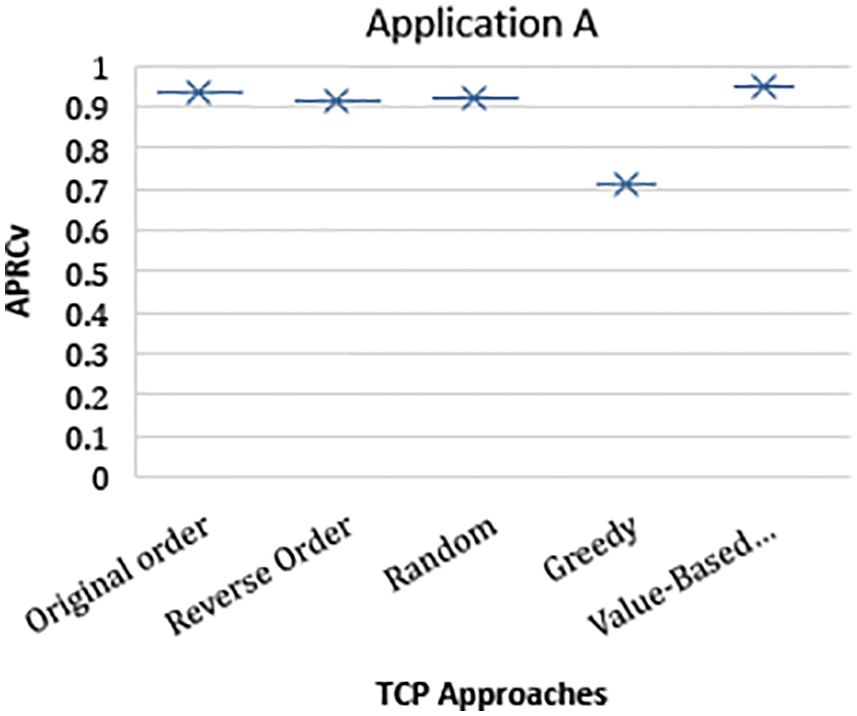
Figure 8: Performance results of Application A releases
Tab. 23 depicts the performance results of different releases of Application B. It shows that the performance of the proposed technique is better than the OO, RO, REVO, and Greedy approaches in terms of APRCv against Application B. The reason for the better performance of the proposed GA-based TCP is that it gives higher priority to test cases with higher business value coverage of requirements with respect to cost resulting in a higher APRCv value as compared to other comparison techniques.
A pictorial representation of the results is given in the box plot chart in Fig. 9. The proposed technique outperformed existing state-of-the-art techniques in terms of APRCv. REVO is the second-best performer and Greedy is the worst among all other techniques. The proposed technique is the GA-based search optimization TCP technique implemented using python language. The execution of GA is based on some termination criteria. Algorithm will terminate its execution if reached an optimal solution that is 100% APRCv reached. In this paper, termination criteria are based on the number of iterations. The number of iterations is a value taken as user input. User can increase number of iterations if results are being improved gradually. Each iteration processes five permutations and calculates APRCv against the dataset. The execution time of implemented technique is based on the number of iterations. Against each release dataset, we executed it with 25, 50, 100, 200, 400, and 800 iterations and recorded its APRCv and maximum execution time. Tabs. 24 and 25 show the value of APRCv and maximum execution time for the different number of iterations against each release.

Figure 9: Performance results of Application B releases
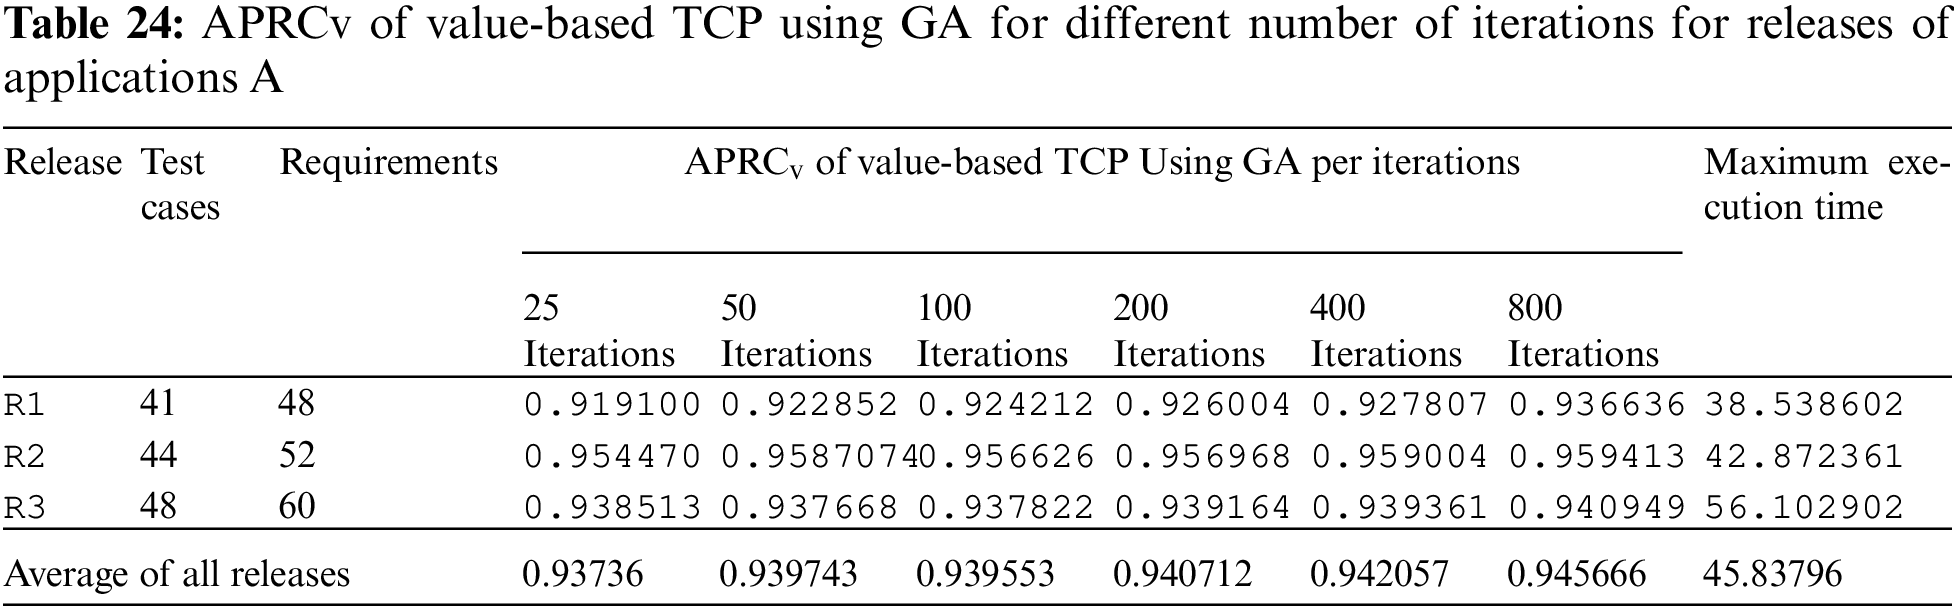

The average maximum execution time of Application A and B are 45.83796 s and 68.19199 s respectively.
The APRCv value trend with the different number of iterations for Application A is depicted in Fig. 10. The graph shows that as the number of iterations increases, the APRCv value increases gradually. The growth trend in all three releases of Application A is almost consistent.

Figure 10: APRCv trend per number of iterations for Application A
Similarly, the APRCv value trend with the different number of iterations for Application B is depicted in Fig. 11. The graph shows that as the number of iterations increases, the APRCv value increases gradually. The growth trend in releases R2 and R3 of Application B is consistent. For R1, the APRCv value declined with 400 iterations and then significantly improved by 800 iterations. The overall trend of increase in APRCv value with a greater number of iterations is consistent. The different number of iterations for different releases of Application A and Application B is exercised. With 800 iterations, the results almost got mature.

Figure 11: APRCv trend per number of iterations for Application B
Our defined research questions only cover fault detection and requirements coverage and don’t include other coverage criteria like statement coverage, branch coverage, function coverage, etc. This is a construct validity threat and we addressed it in future work directions. The study assumes that one unit of severity is equivalent to one unit of test case cost or execution time. Similarly, one unit of the business value of a requirement is equivalent to one unit of the test case time to cover it. It assumes that the business value of requirements and test case execution time is already known in the case of VCRCB-TCP. Similarly, the severity of faults and test case cost is already known in the case of VCFDB-TCP. In this study, it is considered that both test case cost and fault severity are equally important. However, in some scenarios, there might require a tradeoff between cost and severity. Similarly, there might be a tradeoff between test case cost and business value of requirements. The number of iterations for GA execution is taken as user input. This is an internal validity threat, and it is addressed through multiple executions of GA for improving the results. The datasets used for the study are of smaller size and are collected against different products/applications from a single company. The results may vary with the variety of other software applications developed by different software development organizations. This is an external validity threat, and it is addressed by performing two independent case studies with real-world projects on two different software products with multiple releases.
Prioritizing test cases with a business perspective is vital because different features of software applications have different business values. Two value-based cost cognizant TCP techniques have been introduced in this work including VCFDB-TCP and VCRCB-TCP. Two performance evaluation metrics have also been introduced including APFDv and APRCv. To validate the proposed techniques and performance evaluation metrics, two case studies have been performed. The proposed techniques are implemented by using GA. The performance of VCFDB-TCP is evaluated in terms of APFDv and the performance of VCRCB-TCP is evaluated in terms of APRCv. The performance of the proposed techniques is found better as compared to the OO, RO, REVO, and Greedy approaches. Incorporating business value in TCP is highly likely to produce reliable and satisfactory results. The novelty of proposed techniques is that these are business value-centric instead of considering the only frequency of faults or frequency of requirement coverage. The proposed techniques ensure that regression testing time is utilized on the items with greater business value. Value-orientation can be applied to different coverage-based TCP techniques like it can be applied to statement coverage, branch coverage, function coverage, or any other element coverage. Similarly, value-cognizant performance evaluation metrics can be derived following the APFDv pattern. It can bring a shift from value-neutral TCP to value-based TCP. Value-based TCP still has many dimensions to be investigated in the future. Introducing business value in coverage-based TCP can ensure that the regression effort is utilized to cover those aspects of the application that have greater business worth. More diverse datasets should be used in the future.
Acknowledgement: We are thankful to Wiseman Innovations for providing testing data for their real projects.
Funding Statement : The authors received no specific funding for this study.
Conflicts of Interest: The authors declare that they have no conflicts of interest to report regarding the present study.
References
1. N. Gupta, A. Sharma and M. K. Pachariya, “An insight into test case optimization: Ideas and trends with future perspectives,” IEEE Access, vol. 7, pp. 22310–22327, 2019. [Google Scholar]
2. G. Rothermel, R. H. Untch and M. J. Harrold, “Prioritizing test cases for regression testing,” IEEE Transactions on Software Engineering, vol. 27, no. 10, pp. 929–948, 2001. [Google Scholar]
3. H. Jahan, Z. Feng and S. M. H. Mahmud, “Risk-based test case prioritization by correlating system methods and their associated risks,” Arabian Journal for Science and Engineering, vol. 45, no. 4, pp. 6125–6138, 2020. [Google Scholar]
4. R. Huang, Q. Zhang, T. Y. Chen, J. Hamlyn-Harris, D. Towey et al., “An empirical comparison of fixed-strength and mixed-strength for interaction coverage-based prioritization,” IEEE Access, vol. 6, pp. 68350–68372, 2018. [Google Scholar]
5. Z. Li, M. Harman and R. M. Hierons, “Search algorithms for regression test case prioritization,” IEEE Transactions on Software Engineering, vol. 33, no. 4, pp. 225–237, 2007. [Google Scholar]
6. S. Elbaum, A. Malishevsky and G. Rothermel, “Incorporating varying test costs and fault severities into test case prioritization,” in Proc. of the 23rd Int. Conf. on Software Engineering. ICSE, Toronto, Ont., Canada, pp. 329–338, 2001. [Google Scholar]
7. A. Bajaj and O. P. Sangwan, “A systematic literature review of test case prioritization using genetic algorithms,” IEEE Access, vol. 7, pp. 126355–126375, 2019. [Google Scholar]
8. B. Miranda and A. Bertolino, “An assessment of operational coverage as both an adequacy and a selection criterion for operational profile-based testing,” Software Quality Journal, vol. 26, no. 4, pp. 1571–1594, 2018. [Google Scholar]
9. R. Matinnejad, S. Nejati, L. C. Briand and T. Bruckmann, “Test generation and test prioritization for simulink models with dynamic behavior,” IEEE Transactions on Software Engineering, vol. 45, no. 9, pp. 919–944, 2019. [Google Scholar]
10. M. Khatibsyarbini, M. A. Isa, D. N. A. Jawawi, H. N. A. Hamed and M. D. Mohamed Suffian, “Test case prioritization using firefly algorithm for software testing,” IEEE Access, vol. 7, pp. 132360–132373, 2019. [Google Scholar]
11. S. Tahvili, R. Pimentel, W. Afzal, M. Ahlberg, E. Fornander et al., “sOrTES: A supportive tool for stochastic scheduling of manual integration test cases,” IEEE Access, vol. 7, pp. 12928–12946, 2019. [Google Scholar]
12. R. Mukherjee and K. S. Patnaik, “Prioritizing JUnit test cases without coverage information: An optimization heuristics-based approach,” IEEE Access, vol. 7, pp. 78092–78107, 2019. [Google Scholar]
13. C. Lu, J. Zhong, Y. Xue, L. Feng and J. Zhang, “Ant colony system with sorting-based local search for coverage-based test case prioritization,” IEEE Transactions on Reliability, vol. 69, no. 3, pp. 1–17, 2019. [Google Scholar]
14. M. Abdur, M. Abu and M. Saeed, “Prioritizing dissimilar test cases in regression testing using historical failure data,” International Journal of Computer Applications, vol. 180, no. 14, pp. 1–8, 2018. [Google Scholar]
15. D. Hao, L. Zhang, L. Zang, Y. Wang, X. Wu et al., “To be optimal or not in test-case prioritization,” IEEE Transactions on Software Engineering, vol. 42, no. 5, pp. 490–505, 2016. [Google Scholar]
16. Y. Bian, Z. Li, R. Zhao and D. Gong, “Epistasis based ACO for regression test case prioritization,” IEEE Transactions on Emerging Topics in Computational Intelligence, vol. 1, no. 3, pp. 213–223, 2017. [Google Scholar]
17. S. Eghbali and L. Tahvildari, “Test case prioritization using lexicographical ordering,” IEEE Transactions on Software Engineering, vol. 42, no. 12, pp. 1178–1195, 2016. [Google Scholar]
18. A. Marchetto, M. M. Islam, W. Asghar, A. Susi and G. Scanniello, “A multi-objective technique to prioritize test cases,” IEEE Transactions on Software Engineering, vol. 42, no. 10, pp. 918–940, 2016. [Google Scholar]
19. M. Abu Hasan, M. Abdur Rahman and M. Saeed Siddik, “Test case prioritization based on dissimilarity clustering using historical data analysis,” in International Conference on Information, Communication and Computing Technology, In: S. Kaushik, D. Gupta, L. Kharb and D. Chahal (Eds.vol. 750, Singapore: Springer, pp. 269–281, 2017. [Google Scholar]
20. H. Mei, D. Hao, L. Zhang, L. Zhang, J. Zhou et al., “A static approach to prioritizing JUnit test cases,” IEEE Transactions on Software Engineering, vol. 38, no. 6, pp. 1258–1275, 2012. [Google Scholar]
21. M. R. N. Dobuneh, D. N. Jawawi, M. Ghazali and M. V. Malakooti, “Development test case prioritization technique in regression testing based on hybrid criteria,” in 8th Software Engineering Conf. (MySEC), Langkawi, Malaysia, pp. 301–305, 2014. [Google Scholar]
22. B. Jiang and W. K. Chan, “Input-based adaptive randomized test case prioritization: A local beam search approach,” Journal of Systems and Software, vol. 105, no. 2, pp. 91–106, 2015. [Google Scholar]
23. B. Miranda, “FAST approaches to scalable similarity-based test case prioritization,” in IEEE/ACM 40th Int. Conf. on Software Engineering (ICSE), Gothenburg, Sweden, pp. 222–232, 2018. [Google Scholar]
24. A. Nanda, S. Mani, S. Sinha, M. J. Harrold and A. Orso, “Regression testing in the presence of non-code changes,” in Fourth IEEE Int. Conf. on Software Testing, Verification and Validation, Berlin, Germany, pp. 21–30, 2011. [Google Scholar]
25. L. Xiao, H. Miao, W. Zhuang and S. Chen, “An empirical study on clustering approach combining fault prediction for test case prioritization,” in IEEE/ACIS 16th Int. Conf. on Computer and Information Science (ICIS), Wuhan, China, pp. 815–820, 2017. [Google Scholar]
26. P. Konsaard and L. Ramingwong, “Total coverage-based regression test case prioritization using genetic algorithm,” in 12th Int. Conf. on Electrical Engineering/Electronics, Computer, Telecommunications and Information Technology (ECTI-CON), Hua Hin, Thailand, pp. 1–6, 2015. [Google Scholar]
27. T. B. Noor and H. Hemmati, “Test case analytics: Mining test case traces to improve risk-driven testing,” in IEEE 1st Int. Workshop on Software Analytics (SWAN), Montreal, QC, Canada, pp. 13–16, 2015. [Google Scholar]
28. D. Marijan, M. Liaaen, A. Gotlieb, S. Sen and C. Ieva, “TITAN: Test suite optimization for highly configurable software,” in IEEE Int. Conf. on Software Testing, Verification and Validation (ICST), Tokyo, Japan, pp. 524–531, 2017. [Google Scholar]
29. R. Lachmann, “Machine learning-driven test case prioritization approaches for black-box software testing,” in The European Test and Telemetry Conf., Von-Münchhausen-Str 49 31515 Wunstorf Ger, AMA Serv. GmbH, 2018. [Google Scholar]
30. A. Ansari, A. Khan, A. Khan and K. Mukadam, “Optimized regression test using test case prioritization,” Procedia Computer Science, vol. 79, pp. 152–160, 2016. [Google Scholar]
31. H. Sun and R. Grishman, “Employing lexicalized dependency paths for active learning of relation extraction,” Intelligent Automation & Soft Computing, vol. 34, no. 3, pp. 1415–1423, 2022. [Google Scholar]
32. H. Sun and R. Grishman, “Lexicalized dependency paths based supervised learning for relation extraction,” Computer Systems Science & Engineering, vol. 43, no. 3, pp. 861–870, 2022. [Google Scholar]
33. M. M. Öztürk, “A bat-inspired algorithm for prioritizing test cases,” Vietnam Journal of Computer Science, vol. 5, no. 1, pp. 45–57, 2018. [Google Scholar]
34. D. Marijan, “Multi-perspective regression test prioritization for time-constrained environments,” in IEEE Int. Conf. on Software Quality, Reliability and Security, Vancouver, BC, Canada, pp. 157–162, 2015. [Google Scholar]
35. S. Wang, J. Nam and L. Tan, “QTEP: Quality-aware test case prioritization,” in Proc. of the 11th Joint Meeting on Foundations of Software Engineering-ESEC/FSE 2017, Paderborn, Germany, pp. 523–534, 2017. [Google Scholar]
36. M. Aggarwal and S. Sabharwal, “Combinatorial test set prioritization using data flow techniques,” Arabian Journal for Science and Engineering, vol. 43, no. 2, pp. 483–497, 2018. [Google Scholar]
37. E. Ashraf, K. Mahmood, T. Ahmed and S. Ahmed, “Value based PSO test case prioritization algorithm,” International Journal of Advanced Computer Science and Applications, vol. 8, no. 1, pp. 389–394, 2017. [Google Scholar]
38. C. Catal and D. Mishra, “Test case prioritization: A systematic mapping study,” Software Quality Journal, vol. 21, no. 3, pp. 445–478, 2013. [Google Scholar]
39. B. W. Boehm, “Value-based software engineering: Overview and agenda,” in Value-Based Software Engineering, In: S. Biffl, A. Aurum, B. Boehm, H. Erdogmus and P. Grünbacher (Eds.Berlin, Heidelberg: Springer, pp. 3–14, 2006. [Google Scholar]
40. R. Ramler, S. Biffl and P. Grünbacher, “Value-based management of software testing,” in Value-Based Software Engineering, Berlin, Heidelberg: Springer, pp. 225–244, 2006. [Google Scholar]
41. F. S. Ahmed, A. Majeed, T. A. Khan and S. N. Bhatti, “Value-based cost-cognizant test case prioritization for regression testing,” PLOS ONE, vol. 17, no. 5, pp. 1–26, 2022. [Google Scholar]
42. S. Elbaum, A. G. Malishevsky and G. Rothermel, “Prioritizing test cases for regression testing,” in Proc. of the 2000 ACM SIGSOFT Int. Symp. on Software Testing and Analysis, New York, NY, USA, pp. 102–112, 2000. [Google Scholar]
43. G. Luque and E. Alba, Parallel genetic algorithms: Theory and real-world applications. Malaga, Spain: Springer, 2011. [Google Scholar]
44. G. Antoniol, M. Di Penta and M. Harman, “Search-based techniques applied to optimization of project planning for a massive maintenance project,” in 21st IEEE Int. Conf. on Software Maintenance (ICSM’05), Budapest, Hungary, pp. 240–249, 2005. [Google Scholar]
45. M. Tulasiraman, N. Vivekanandan and V. Kalimuthu, “Multi-objective test case prioritization using improved pareto-optimal clonal selection algorithm,” 3D Research, vol. 9, no. 3, pp. 1–13, 2018. [Google Scholar]
46. K. J. Kelleher, J. Cooper, K. Deans, P. Carr, R. J. Brilli et al., “Cost saving and quality of care in a pediatric accountable care organization,” Pediatrics, vol. 135, no. 3, pp. 582–589, 2015. [Google Scholar]
47. S. W. Thomas, H. Hemmati, A. E. Hassan and D. Blostein, “Static test case prioritization using topic models,” Empirical Software Engineering, vol. 19, no. 1, pp. 182–212, 2014. [Google Scholar]
48. S. Yoo and M. Harman, “Pareto efficient multi-objective test case selection,” in Int. Symp. on Software Testing and Analysis-ISSTA, London, United Kingdom, pp. 140–150, 2007. [Google Scholar]
Cite This Article
 Copyright © 2023 The Author(s). Published by Tech Science Press.
This work is licensed under a Creative Commons Attribution 4.0 International License , which permits unrestricted use, distribution, and reproduction in any medium, provided the original work is properly cited.
 Downloads
 Citation Tools