
 Submit a Paper
 Propose a Special lssue
 Open Access
ARTICLE
A Deep Learning for Alzheimer’s Stages Detection Using Brain Images
1 Department of Information Systems, Faculty of Computing and Information Technology, King Abdulaziz University, Jeddah, Saudi Arabia
2 Department of Computer Sciences, College of Computer and Information Sciences, Princess Nourah bint Abdulrahman University, Riyadh, Saudi Arabia
* Corresponding Author: Zahid Ullah. Email:
Computers, Materials & Continua 2023, 74(1), 1457-1473. https://doi.org/10.32604/cmc.2023.032752
Received 28 May 2022; Accepted 01 July 2022; Issue published 22 September 2022
 View Full Text
 Download PDF
Abstract
Alzheimer’s disease (AD) is a chronic and common form of dementia that mainly affects elderly individuals. The disease is dangerous because it causes damage to brain cells and tissues before the symptoms appear, and there is no medicinal or surgical treatment available yet for AD. AD causes loss of memory and functionality control in multiple degrees according to AD’s progression level. However, early diagnosis of AD can hinder its progression. Brain imaging tools such as magnetic resonance imaging (MRI), computed tomography (CT) scans, positron emission tomography (PET), etc. can help in medical diagnosis of AD. Recently, computer-aided diagnosis (CAD) such as deep learning applied to brain images obtained with these tools, has been an established strategic methodology that is widely used for clinical assistance in prognosis of AD. In this study, we proposed an intelligent methodology for building a convolutional neural network (CNN) from scratch to detect AD stages from the brain MRI images dataset and to improve patient care. It is worth mentioning that training a deep-learning model requires a large amount of data to produce accurate results and prevent the model from overfitting problems. Therefore, for better understanding of classifiers and to overcome the model overfitting problem, we applied data augmentation to the minority classes in order to increase the number of MRI images in the dataset. All experiments were conducted using Alzheimer’s MRI dataset consisting of brain MRI scanned images. The performance of the proposed model determines detection of the four stages of AD. Experimental results show high performance of the proposed model in that the model achieved a 99.38% accuracy rate, which is the highest so far. Moreover, the proposed model performance in terms of accuracy, precision, sensitivity, specificity, and f-measures is promising when compared to the very recent state-of-the-art domain-specific models existing in the literature.Keywords
AD is one of the chronic neurodegenerative diseases and mainly causes dementia among the middle-aged and elderly [1]. This is an irreversible disease with high chances of failure in medical trials for AD drugs [2]. AD is pathologically classified by steady and gradual deterioration in memory and other cognitive functions [3]. The present clinical prognosis of this disease is waste of time without success [4]. In 2006, the number of AD patients reached more than 26 million worldwide [5]. While an estimate presented by [6] shows that around 50 million people are living with dementia, and this number is predicted to increase by 2050 to 152 million, especially in poor and middle-income countries, which is a significant challenge of the twenty-first century. As discussed by [7], AD is the 6th leading cause of death in the US. The mental health ability of patients deteriorates such that patients are unable to live normal lives without their family members’ assistance [8]. But early prognosis and treatment can hinder the progression of AD [9].
The cause of AD is still not fully known [10]; however, some potential causes are environmental and genetic factors, head injuries, and chemicals [8] that lead to damaged brain cells and tissue and thus decreasing its functionalities [11]. AD patients have common symptoms like loss of memory, communication and recognition issues, cognition issues, and disruptions in mood and behavior [8]. Primarily, AD affects portions of the brain that regulate memory and language, resulting in AD subjects undergoing memory loss, confusion, and difficulties reading, writing, and speaking [12]. There is no remedial treatment for AD because the brain cells die, which ultimately causes loss of memory and cognitive power [8]. But on the other hand, early prognosis and treatment [9], exercise, and memory coaching [1] can slow down the progression of AD.
Over the past couple of decades, researchers have presented new imaging modalities to medical doctors such as computer-aided diagnosis (CAD) to be applied to medical images that assist clinicians to make sense of large amounts of non-invasive medical data and assist them in diagnostic tasks [13]. CAD systems make use of state-of-the-art technologies such as X-rays, MRI, CT scans, PET, and other revolutionary studies such as DNA sequencing, gene expression [9], and ultrasound are nowadays indispensable for diagnosis and prognosis of different types of cancer, bone and skin diseases, and AD [14]. Moreover, the American Academy of Neurology advocated that the most appropriate primary evaluation for patients with dementia is the structural imaging of the brain (either CT scan or MRI), which shows diffuse cortical and intellectual weakness in AD patients [8]. So, CT scan and MRI provide deep insight into the study of the brain and also into the features of the brain that can thoroughly assess the disease and ultimately discover the best mechanisms for diagnosing AD. Thus, they can be utilized with CAD systems [13] that help clinicians to avoid misdiagnosis due to less experience or exhaustion. In addition, it may provide earlier and more accurate diagnosis, which in turn reduces the costs of caring for AD patients [14].
Advances in state-of-the-art technologies and the current growth of deep learning (DL) have impacted every field of life, and their applications in (for example) medical imaging have shown tremendous potential for clinical decision support that helps physicians diagnose various stages of disease. The strength of DL compared to other shallow learning models is that DL can learn the most predictive features from the raw data [15]. Unlike artificial neural networks (ANN), DL models use a data-driven approach by utilizing deep neural networks (DNN) with multiple layers in a hierarchical structure to capture high-level features of the raw data [16].
The application of DNN for extracting features such as a stack autoencoder or Deep Boltzmann machine (DBM) outperformed conventional ML methods [17]. Due to several limitations of the traditional machine-learning (ML) methods with respect to image data and the increased success of the DL model, which requires less effort when preprocessing images and can automatically extract salient features from the raw data without feature selection in advance, leading DL to a more objective and less biased model [1]. Moreover, deep-learning models remained progressive in performance and seem to hold potential for diagnostic classification of AD using multimodal neuroimaging data [18]. The motivation of this study is due to these properties of DL models and their success with imaging data in detecting disease. In this study, we have proposed a DL model for detecting different stages of AD based on MRI images. Our proposed model is using a data-driven strategy with a convolutional neural network (CNN), which consists of multiple convolutional layers. The benefits of using CNN include extracting the most salient features from the images, detecting different stages of AD and, on the basis of that information, providing an effective decision support system for physicians to help them in their diagnostic work. We have tried both approaches (i.e., transfer learning and CNN from scratch) for building the model. In transfer learning, we used VGG-16 and ResNet-50, but unfortunately, the results of both transfer learning models were not promising, both in terms of validation and of testing data. The results of CNN from scratch achieved the highest results in terms of accuracy and other classification measures, tested and validated on a publicly MRI dataset available on Kaggle. Therefore, this study has reported the results of CNN from scratch.
Research is an ongoing process whereby researchers analyze raw data from different perspectives using different methodologies and mechanisms and reaching conclusions by providing in-depth insights drawn from raw data and building decision support models that can help decision-makers in their jobs across different fields. Similarly, the detection of AD has attracted the recent attention of researchers, and various methodologies were proposed with ML and DL as common approaches for automatic detection. Since this study is more concerned with the DL methodology, we will therefore limit the scope of our discussion to only DL models in the literature.
A study conducted by [1] used three MRI and one fMRI image datasets for classification into binary and multi-classes using a deep ensemble approach with three trained networks of fine-tuned AlexNet, ResNet-101, and Inception-ResNet-v2. Moreover, the study has increased the number of images using data augmentation before training the model. The results reported show the higher accuracy of their proposed model achieving 98.51% on binary classification and 98.67% on multi-class classification. Similarly, the study of [8] has applied an VGG model to an Alzheimer’s disease national initiative (ADNI) dataset. Due to the insufficient number of 379 patients’ images in the ADNI dataset, data augmentation using flipping, rotation, illumination, and zooming techniques was applied in order to increase the number of images that are ideal for training the CNN model. The dataset was augmented from 3925 to 37,590 images. The results of the proposed VGG model achieved the test accuracies of binary classification—i.e., 99.27% (MCI vs. AD), 97.06% (MCI vs. CN), and 98.89% (AD vs. CN).
Reference [9] used a DL framework for early detection of AD with an embedded feature selection method. In this approach, the feature selection was performed using conventional ML methods with k-folds cross-validation for model evaluation. They found that AdaBoost (AB) with 5-fold cross-validation yielded optimal results in terms of feature selection, which were used for training the models—i.e., recurrent neural network (RNN), CNN, deep RNN, and enhanced deep RNN. The results showed that EDRNN outperformed the other three models with a classification rate of 88.7%.
In [19] the researchers used different models with CNN architecture and applied them to an ADNI dataset for classifying different stages of AD. According to them, 29 different pre-trained models were used on MRI images and evaluated the learning models using accuracy, precision, sensitivity, and specificity. Among these models, EfficientNetB0 achieved high accuracy of 92.98%, while precision of the EfficientNetB3 model was 89.78%, sensitivity of the EfficientNetB2 model was 94.42%, and specificity of the EfficientNetB3 model was 97.28%.
An attempt made by [20] used a CNN-based DEMNET (dementia network) model for detecting four different stages of AD. The dataset used in the study was collected from Kaggle containing 6400 MRI images. The data augmentation was performed using the SMOTE method. The results of the DEMNET model achieved a testing accuracy of 95.23%. Similarly, [21] applied a hybrid classical quantum NN to a Kaggle dataset containing 6400 MRI images for automated detection of AD, and ResnNet34 was used for feature extraction. The proposed hybrid classical quantum network achieved the highest testing accuracy of 97.2%.
Reference [22] used DL and hybrid DL methods for analyzing MRI images for early diagnosis of AD and dementia. They have used OASIS and Kaggle MRI datasets for training AlexNet and ResNet-50 models, as well as AlexNet+SVM and ResNet-50+SVM hybrid models. For data augmentation, the SMOTE method was used for an OASIS dataset to balance the classes, while data augmentation was used for the Kaggle dataset. The AlexNet+SVM outperformed other methods applied to the Kaggle MRI dataset after augmentation and attained the high classification rate of 94.8%.
The detection of AD using DL was performed by [23], who used a dataset of digital subtracted angiogram scans of AD subjects. The feature extraction was made using pre-trained models—i.e., InceptionV3 and DenseNet201. Data augmentation was used to increase the number of scans in the dataset, while principal component analysis (PCA) was used for feature selection with a criterion of explained variance ratio of 0.99. The model was trained and concluded with an accuracy score of 99%. Likewise, [24] used three CNN-based models for early diagnosis of AD. For that, the models were applied to MRI images from an ADNI dataset. The reported results showed model performance with a classification rate of 97.65% for AD vs. MCI and 88.37% for MCI vs. CN.
A volumetric feature-based AD diagnosis method using CNN and DNN was proposed by [25]. The proposed AD diagnosis method was based on volumetric feature extraction from the left and right hippocampi of structured MRI data. The dataset (GARD) containing MRI scans were collected in South Korea. The proposed models were trained using the preprocessed GARD dataset and achieved an average accuracy of 94.82% and 94.02%, respectively. Reference [26] proposed GoogleNet, ResNet-18, and ResNet-152 to detect the four stages of AD. The experimental results show ResNet-18 achieved an accuracy of 98.88%, and ResNet-152 98.14%. Similarly, [27] has used CNN and MMSE methods to identify MCI vs. CN from MRI images and achieved an accuracy rate of 90.9%.
The Alzheimer’s brain MRI dataset of 6400 images was collected from Kaggle [28]. The dataset was divided into four different classes: mildly demented, moderately demented, non-demented, and very mildly demented. The number of images per class were of variable length in that mildly demented contained 896, moderately demented contained 64, non-demented contained 3200, and very mildly demented contained 2240 images, which comes to a total of 6400 images, as shown in Fig. 1. The dataset was processed with all images resized into (128 × 128) pixels. Fig. 2 shows sample images of the Alzheimer’s dataset displayed from the training set.
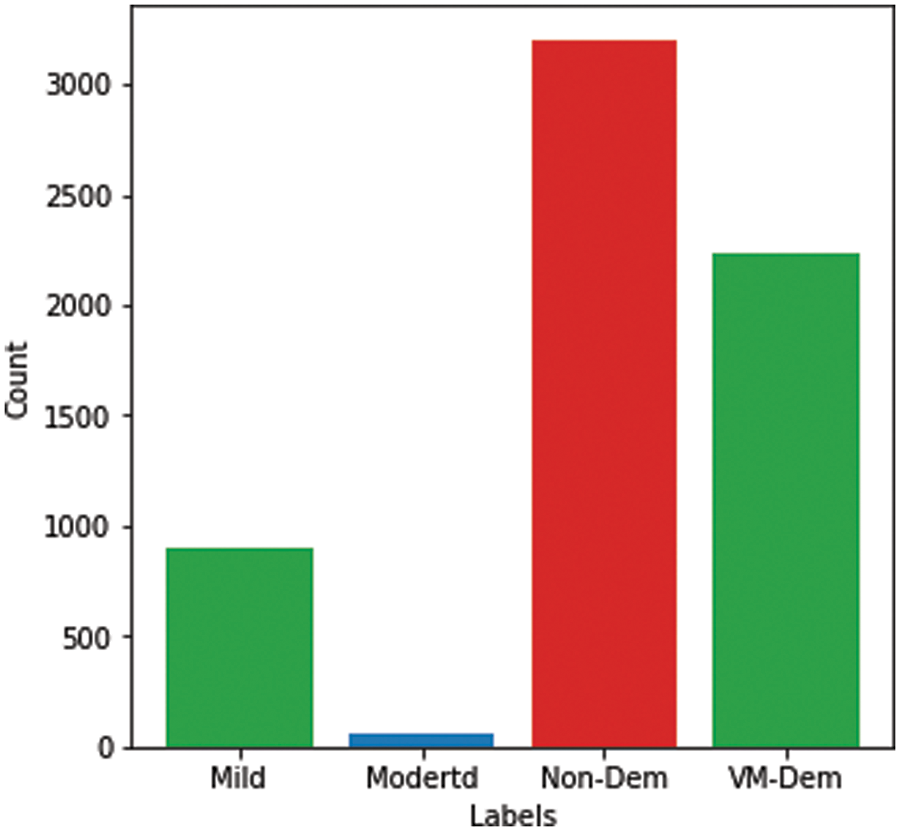
Figure 1: Alzheimer dataset
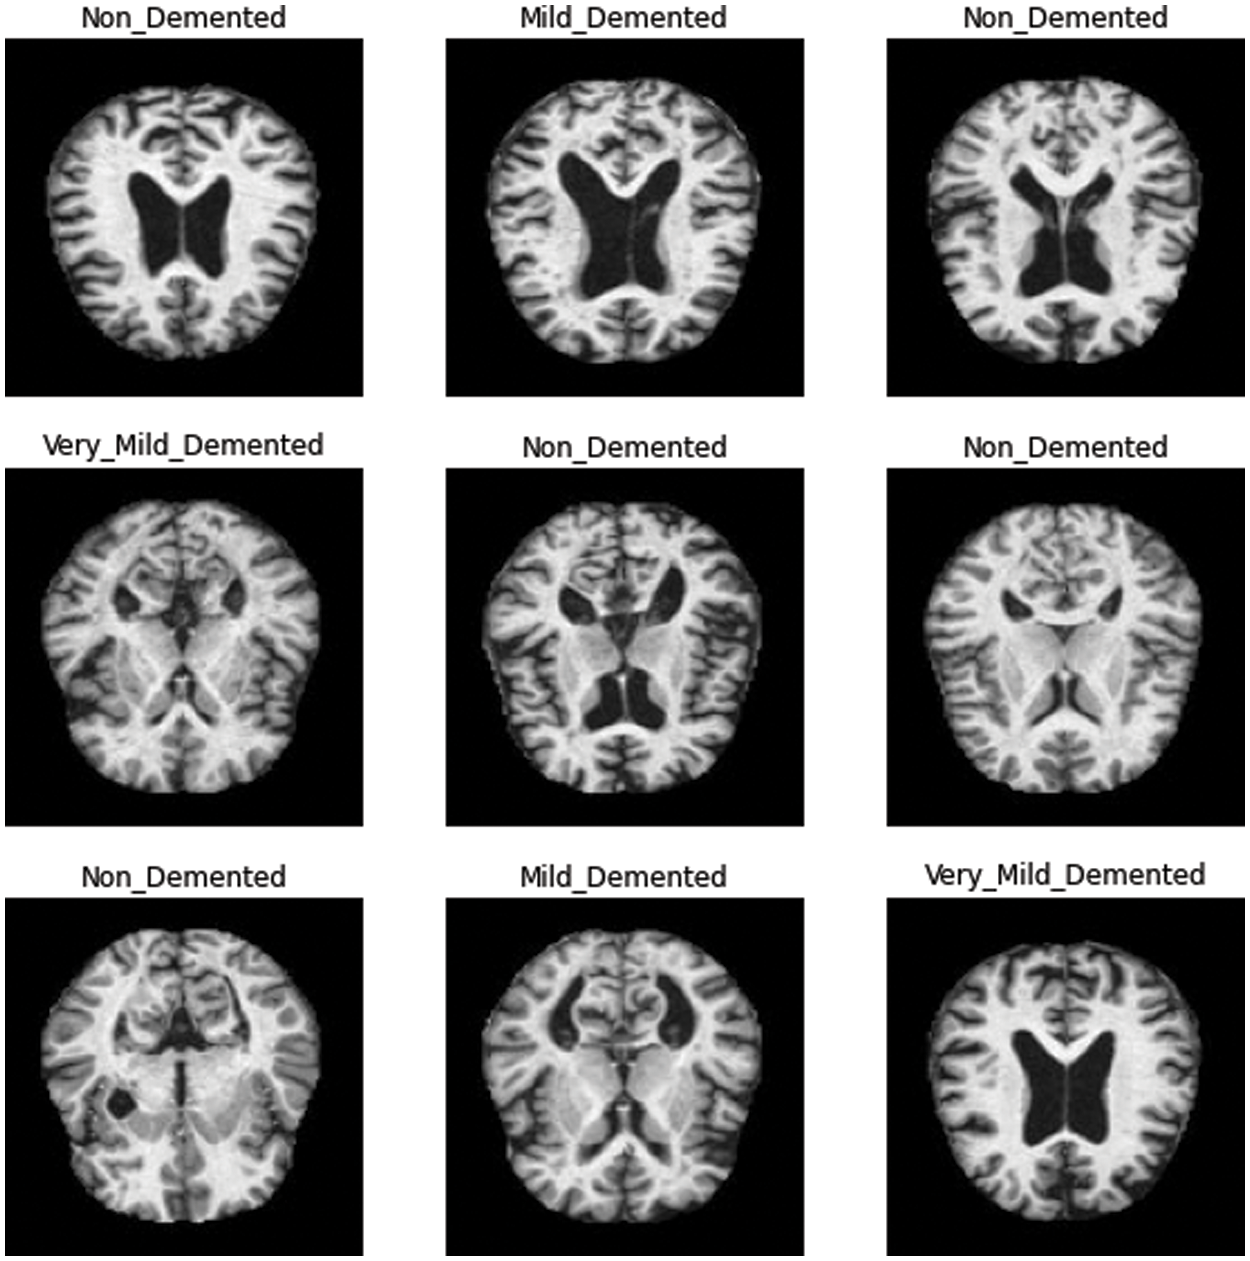
Figure 2: Sample images in training set
Recently, the application of DNN has attracted the attention of researchers for detecting and diagnosing AD. Neural networks (NN) are the fundamental building blocks of the deep-learning model, where DNN contains millions of parameters to learn; therefore, numerous iterations are required to find the optimal values for classification [29]. The data size is an essential factor because a large amount of data can help better learn the model parameters and generalize better, since it captures the intrinsic data effectively [30]. One of the major issues with DNN applications in AD detection and diagnosis is the unavailability of a large amount of training data for learning discriminative patterns in large dimensional feature spaces [17] because large data size prevents deep-learning models from experiencing overfitting problems [22].
Since the collected dataset was hugely imbalanced, as shown in Fig. 1, class balancing was necessary to increase the number of images in the minority classes in order to reach a better understanding of the learning model’s classifier. Although it is challenging to produce a large, benchmarked, medically tested set of images [31], this challenge can be overcome using data augmentation containing numerous methods that bring random variations to existing training images while maintaining class labels [32,33]. Moreover, although a contingency simulation can generate a large amount of data, the process is burdensome and error-prone, while data augmentation artificially increases representative and diversified training data with labels preserving transformation in a low-cost and effectual manner [34].
In this study, data augmentation was performed using several techniques, including rotation, shearing, zooming, and horizontal and vertical flipping. The number of images increased after data augmentation to a total of 10,074 images, as shown in Fig. 3.
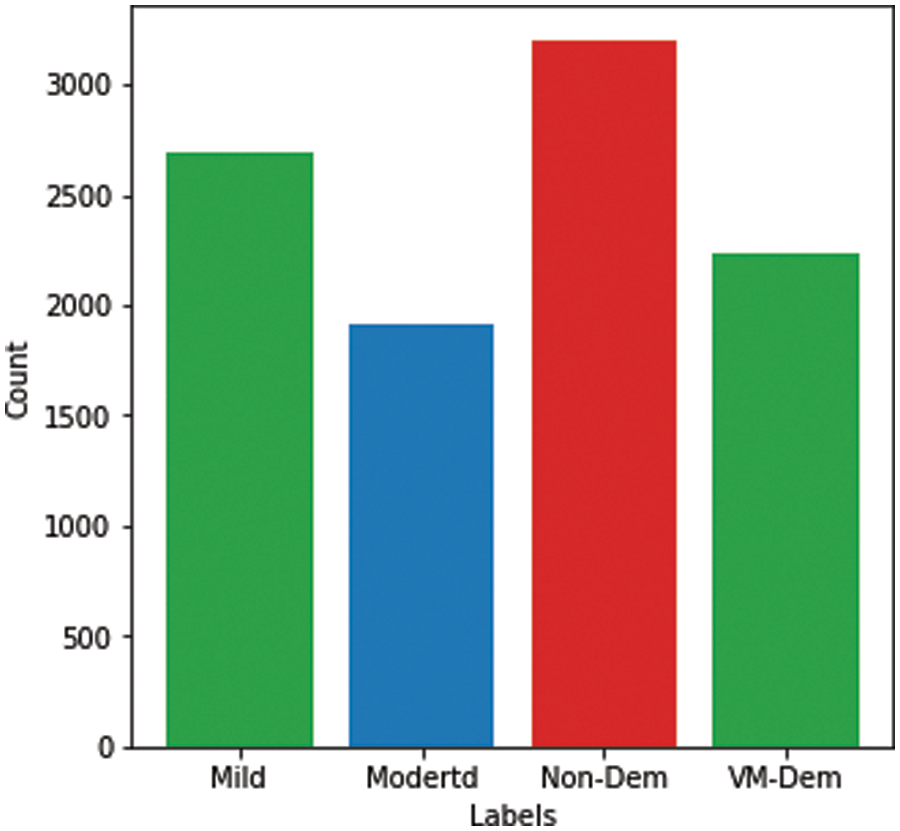
Figure 3: Alzheimer’s dataset after data augmentation
In this study, we proposed a deep-learning model based on CNN architecture built from scratch. CNN is one of the most commonly used types of ANN [35] that has revealed amazing solutions to image data problems [36]. The architecture of CNN normally comprises 3 main layers: convolution, pooling, and fully connected layers [37] with an additional output layer. In convolution layers, the input images are convoluted with filters and generate feature maps [38]. A pooling layer is normally used after the convolution layer for reducing the dimensionality of an image while preserving the main features of the feature maps [39]. The fully connected layers contain various layers in which each node of a previous layer is connected to the nodes of the next layer [36]. A flattened layer is also part of the CNN architecture that normally occurs between the last convolution and the fully connected layers and is used to vectorize the feature maps and pass it on as input to the fully connected layers.
The proposed model comprises 3 convolutional layers, 3 pooling layers, 2 fully connected layers, and one output layer, as shown in Fig. 4. The pixel size of all images in the proposed method represented size of (128 × 128). The input layer takes the images in three dimensions, which are height, width, and dimension (i.e., H × W × D), where D represents whether the image is RGB or in a greyscale. In the proposed method, the image was provided in RGB form. Therefore, the input image was provided at size (128 × 128 × 3). Moreover, all convolution layers are convoluted according to the kernel size of (3 × 3), which is normally appropriate for classification purposes [40]. Similarly, ReLu is used as an activation function, as shown in Eq. (1), while same padding is used to avoid image shrinkage.
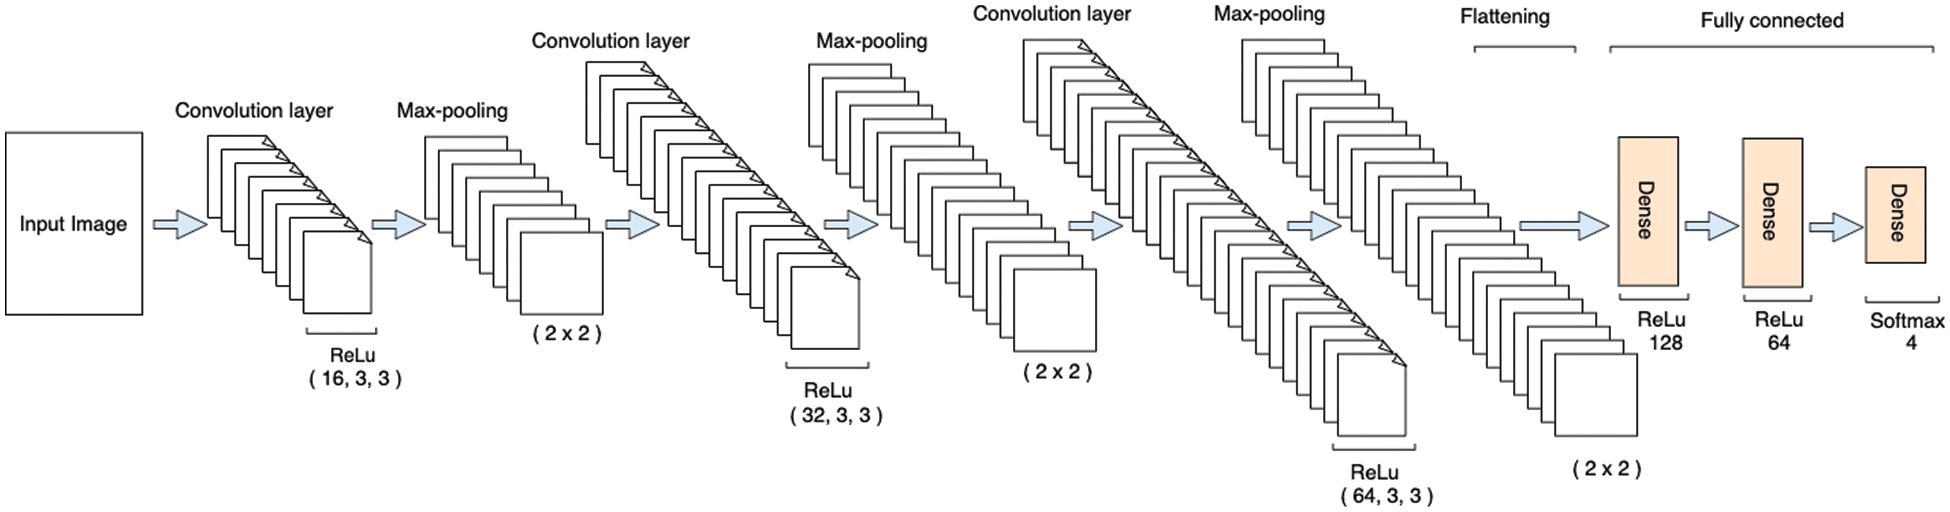
Figure 4: Architecture of the proposed model
Likewise, the dropout operation was also performed in order to prevent the model from overfitting. As in the deep-learning models, the input layer is used to provide the image in a specific shape, while the actual learning of the model started at the convolution layers. Therefore, the input layers have zero trainable parameters, as shown in Tab. 2.
The first convolutional layer in our proposed model used 16 filters with respect to the kernel size of (3 × 3) and same padding. The output shape of the first convolution layer per formula (filters + 2 × padding – (kernel_size – 1)) is (128 × 128 × 16). Moreover, the activation shape is the product of the three dimensions (i.e., 128 × 128 × 16), which is 262,144 elements, as shown in Tab. 1. Similarly, the number of trainable parameters in each layer is calculated using Eq. (2).
where f is the current kernel size, x is the previous layer output, b is a bias constant, and z is the output vector.
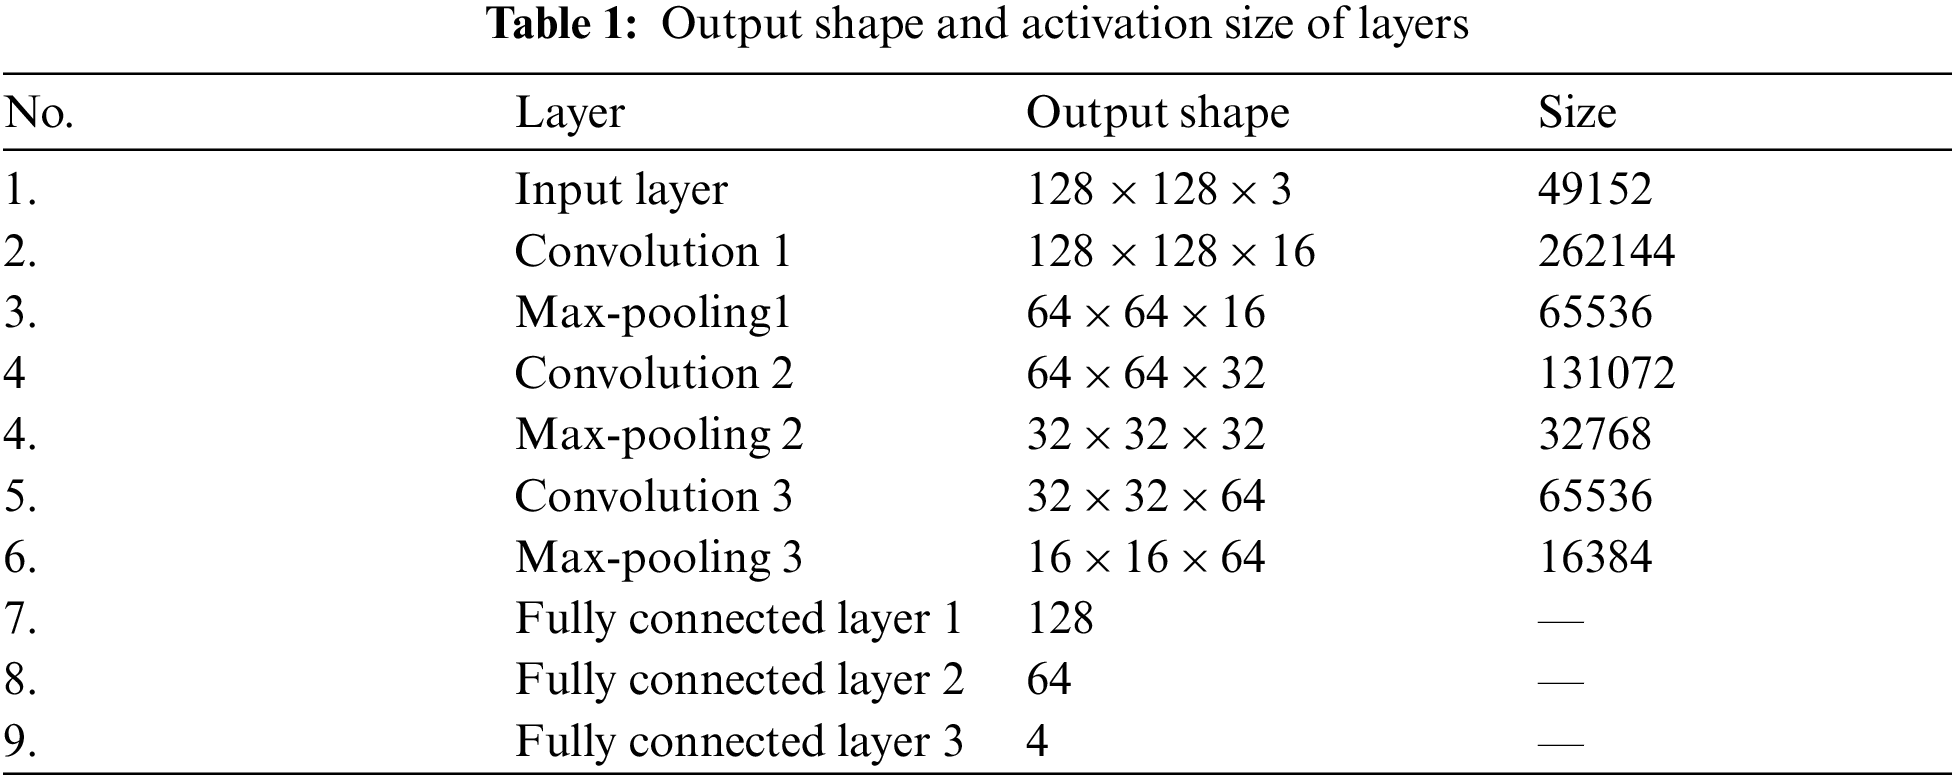

The total number of trainable parameters in the first convolution layer is [((3 × 3 × 3) + 1) × 16] = 448 as shown in Tab. 2. After the first convolution layer, a max-pooling layer was used to reduce the dimensionality of the images. As described by [41], this layer is normally utilized for capturing the important features of the feature maps. In our proposed model, a max-pooling of size (2 × 2) was used in order to reduce the dimensionality of images, thus making a layer of size (64 × 64 × 16), as shown in Tab. 1. A dropout operation was also performed after the max-pooling layer in order to avoid overfitting.
The second convolution layer was used with 32 filters of the Alzheimer’s images, kernel size (3 × 3), and same padding. The output shape of the second layer is (64 × 64 × 32), and the activation shape has 131,072 elements, as shown in Tab. 1. The total number of trainable parameters in the second layer is 4,640, as shown in Tab. 2. A max-pooling layer was added after the second convolution layer of size (2 × 2) for dimensionality reduction, followed by a dropout layer to avoid overfitting.
A third convolution layer with 64 filters, kernel size of (3 × 3), and same padding was used. The output shape of this layer was (32 × 32 × 64), and the activation size was 6,5536 elements. The total number of trainable parameters in this layer was 18,496. Like the first two layers, a max-pooling and dropout layers were also added after the third convolution layer for dimensionality reduction and preventing model overfitting problems, respectively. After the analysis of the convolution layers, the features were vectorized using the flattened layer and passed to the fully connected layers. The fully connected layers typically accept the feature maps in a vector shape, which is the responsibility of the flattened layer.
The last step in building the proposed model was the fully connected layers, comprised of various layers depending on the nature of the problem, in which each node (neuron) of a previous layer is linked to the nodes of the next layer [40]. In the proposed model, two fully connected layers were built of 128 and 64 neurons, respectively. The last fully connected layer of 4 neurons was an output layer, which was predicting the sorting of Alzheimer’s images into their corresponding classes. In the fully connected layers, ReLu was used as an activation function except for the last layer, where softmax was used instead, as shown in Eq. (4). The softmax layer consisted of 4 neurons and was used to classify each image with respect to their class based on the predicted value.
A hyperparameter tuning was performed to finalize parameters for the proposed model. According to the [42,43] setting of proper hyperparameters is the key to attain optimal outcomes in classification problems. In this tuning, the Adam optimizer provided promising results and was ultimately chosen for the compilation of our proposed model. Moreover, sparse categorical cross-entropy was utilized for measuring loss of the proposed model in classifying the Alzheimer’s MRI images based on the predicted values.
First of all, the dataset was divided into three different sets: training set, validation set, and testing set with ratios of 80%, 10%, and 10%, respectively. The model was compiled using the Adam optimizer, while loss was computed using sparse categorical cross-entropy. The proposed model was executed using 100 epochs in a Google Colab notebook in a GPU environment. Moreover, the model was also executed with different numbers of iterations, but 100 iterations achieved promising results. The average execution time for each epoch was around 6 s. The batch size was set to 64, which has achieved better results compared to the alternate numbers. After the execution of the proposed model for all epochs, the model was saved to the directory for future use. Furthermore, the validation set was used to validate our proposed model in terms of training and validation losses and accuracies. Fig. 5 shows training and validation accuracy with respect to epochs. Generally, the training accuracy is higher, but in this case both curves coincide as the epochs progress.
Similarly, training and validation loss was exhibited in Fig. 6. As the epochs progress, both curves come closer to each other in Fig. 6. At the start, both curves proceed with a very minor gap between them, but after epoch 25, the curves are very close to each other, and as the epochs continue, the curves coincide. This overlap of training and validation loss curves demonstrates the lack of model overfitting. Moreover, model overfitting was also prevented using dropout operations.
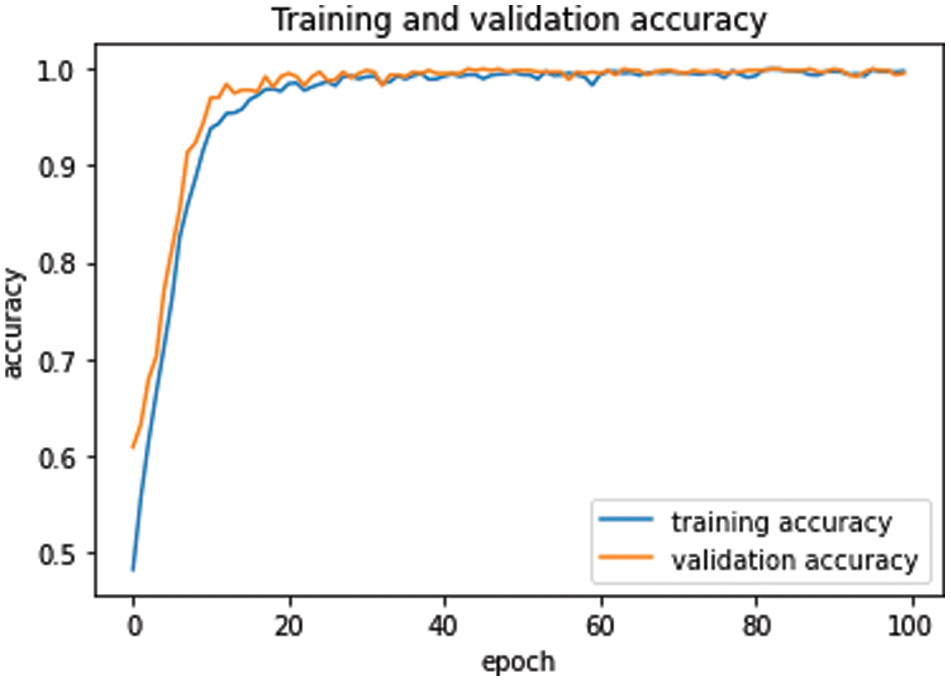
Figure 5: Training and validation accuracy with respect to epochs
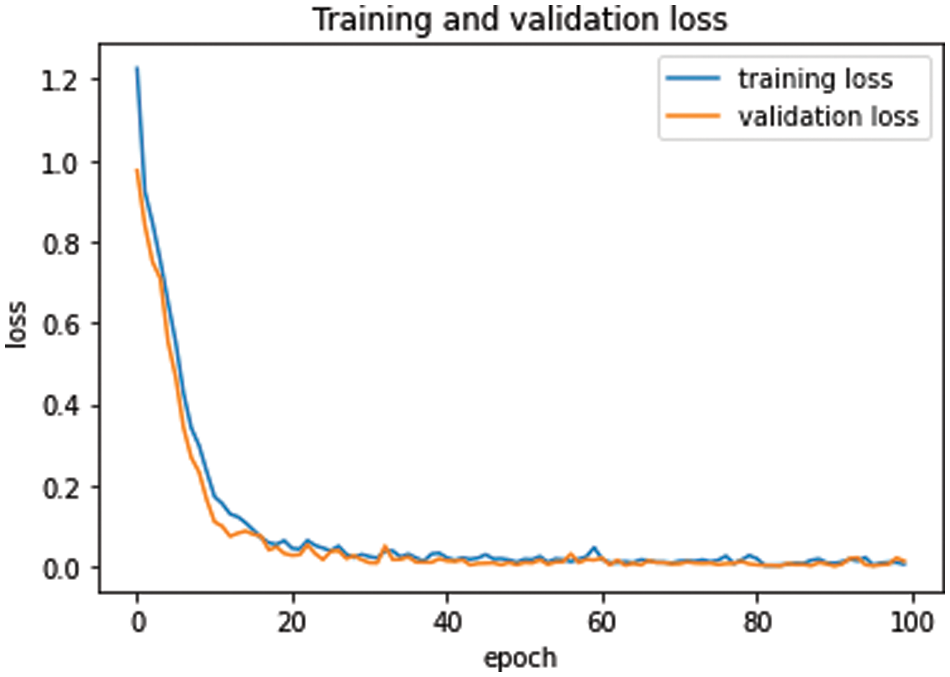
Figure 6: Training and validation loss with respect to epochs
The experiment was repeated several times to validate the results of the proposed model, and the best classifier according to the accuracy metric was utilized to report the results. The model was evaluated using the test set and achieved the highest testing accuracy of 99.38%, which gives a classification error of only 0.62%. This shows the reliability of the proposed model to be used as an intelligent model for automatic detection of Alzheimer’s patients based on unseen MRI images. The accuracy of the proposed model was calculated using Eq. (4).
Moreover, in the implementation phase of testing the proposed model, a confusion matrix was computed as shown in Fig. 7, which provides some significant values that are calculated based on accurately and inaccurately classified MRI images. These values are commonly referred to as True Positive (TP), True Negative (TN), False Positive (FP), and False Negative (FN).
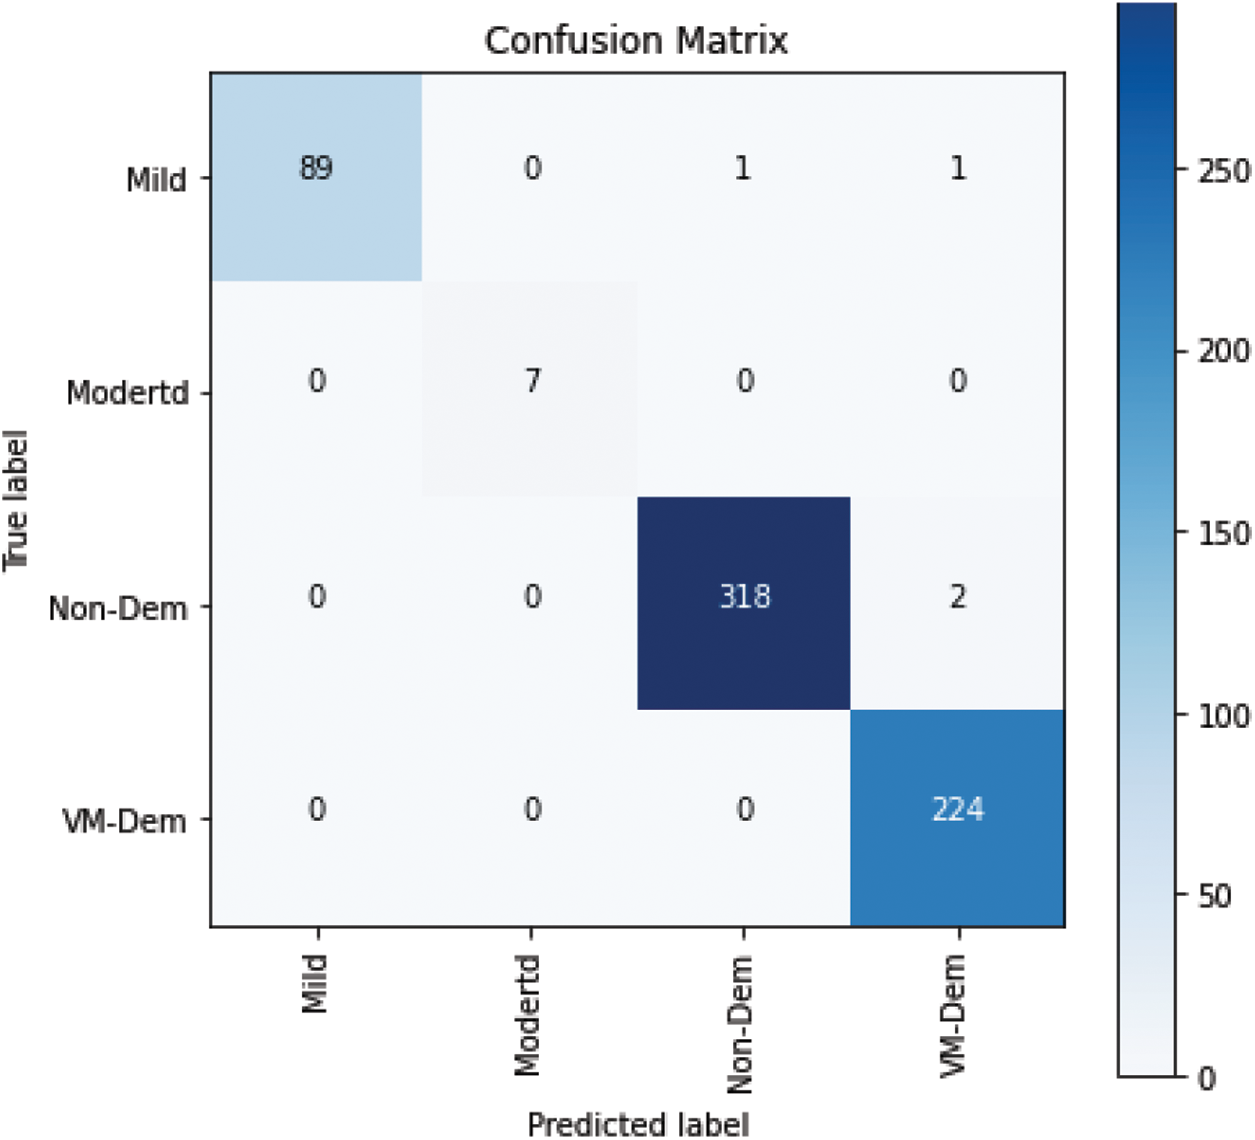
Figure 7: Confusion matrix
The proposed model was further evaluated using precision, sensitivity, and F-measure, which are calculated based on the values of the confusion matrix.
Based on the above equation, the classification report is exhibited in Tab. 3.
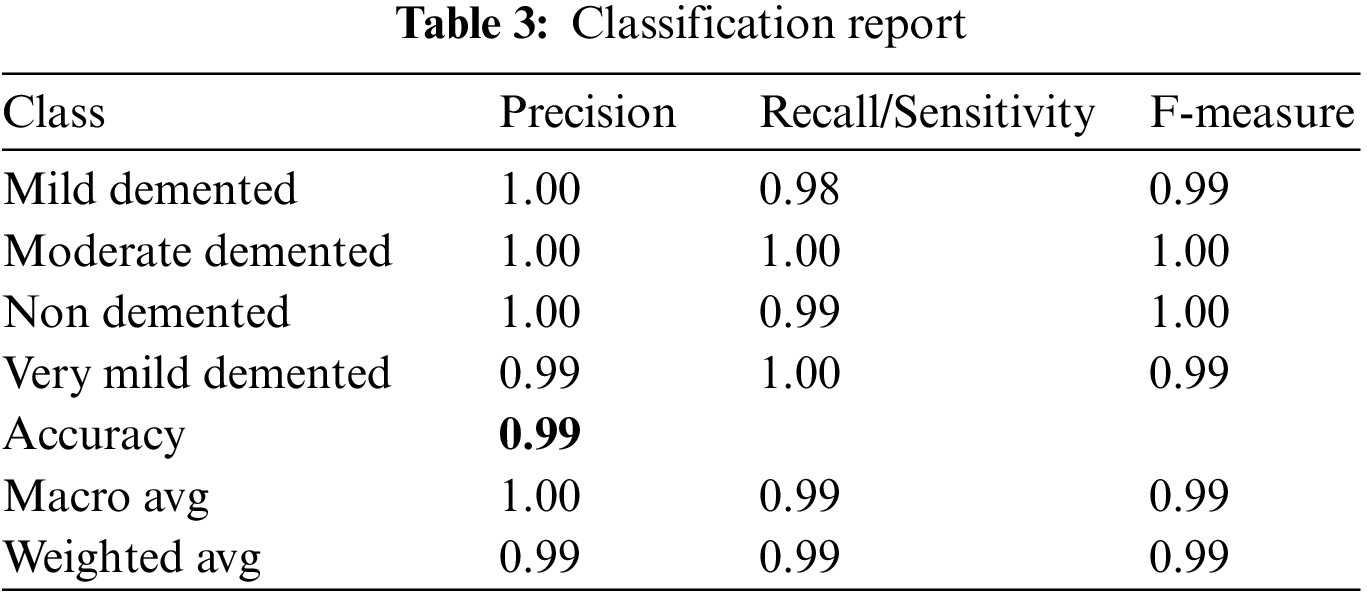
The values in Tab. 3 show the reliability of the proposed model in terms of precision, sensitivity, and F-measure to be used as a decision support system for detecting the stages of Alzheimer’s disease and can help medical practitioners with its diagnosis.
We compared our results using the proposed model with those of existing state-of-the-art studies using the same dataset. Our proposed method outperformed existing studies in terms of accuracy, precision, sensitivity, specificity, and F-measure, as shown in Tab. 4.

Murugan et al. [20] used a CNN-based DEMNET model for classifying the stages of AD. The dataset was collected from Kaggle containing a total of 6400 MRI images, which was initially imbalanced. The class balancing was conducted using a conventional SMOTE ML method, resulting in increasing the number of images to 12800. Moreover, the dataset was split into 80% training, 10% validation, and 10% testing sets. The input image was resized into (172 × 172). The proposed DEMNET architecture contained 2 convolution layers followed by a pooling layer. The DEMNET block comprises the stacked layer of two convolution layers, batch normalization, and a pooling layer. The blocks consisted of distinctive filters (i.e., 32, 64, 128, and 256). Dropout operation was also performed after the third and fourth blocks to reduce the model overfitting problem. Moreover, three dense layers and a softmax layer was used to output the classification results. The model was compiled using root mean square propagation optimizer, and the loss was measured using categorical cross entropy. In contrast to the study of [20], we proposed a CNN from scratch model and applied it to the same dataset. The main differences include that, for example, data augmentation is more powerful than the conventional SMOTE method for increasing the number of images. We used input image of size (128 × 128) and dropout operation after each pooling layer. Moreover, for model compilation, we used an Adam optimizer and sparse categorical cross-entropy for measuring loss, which was optimal in our proposed model. These are the main reasons for achieving higher results.
Similarly, [21] used a hybrid classical–quantum NN model in which the feature extraction was based on CNN-based ResNet34 that converted the given input into 512 feature vectors, and the dimensionality reduction was performed using a quantum variational circuit. Data augmentation was not performed. The model output was a binary classification of MRI images, either demented or non-demented, with an accuracy rate of 97%. Likewise, in Mohammed et al. [22], data augmentation was performed on the whole MRI dataset using cropping, rotation, brightness, flipping, and contrast methods and increased the images to 29,090. In contrast, we used data augmentation in only minority classes that initially had fewer images and achieved high performance of the model in terms of accuracy, sensitivity, specificity, and F-measure. The high performance of our proposed model shows the reliability of the proposed method to be used as a reliable decision support system for detecting AD that can help clinicians diagnose the disease.
Furthermore, our proposed model outperformed other state-of-the-art models that used different datasets, as discussed in Section 2. We have collected and discussed the most recent literature in the same domain of our study. The trend of using pre-trained models is obvious in the previous studies, most of which have used transfer learning methods for binary or multi-class classification of AD MRI images. However, our proposed model shows higher performance in terms of accuracy and other classification measures compared to existing state-of-the-art studies that used the same or different datasets, as discussed in Section 2 of this study.
Moreover, the proposed model was tested on the unseen MRI images of the test set and achieved promising results, as shown in Fig. 8. Our proposed model predicted the same brain MRI images of Alzheimer’s patients with respect to classes that actually belong to those classes. This also leads us to conclude that our proposed model is reliable for detecting AD stages and can be used as a medical decision support system that helps physicians in their diagnosing tasks.
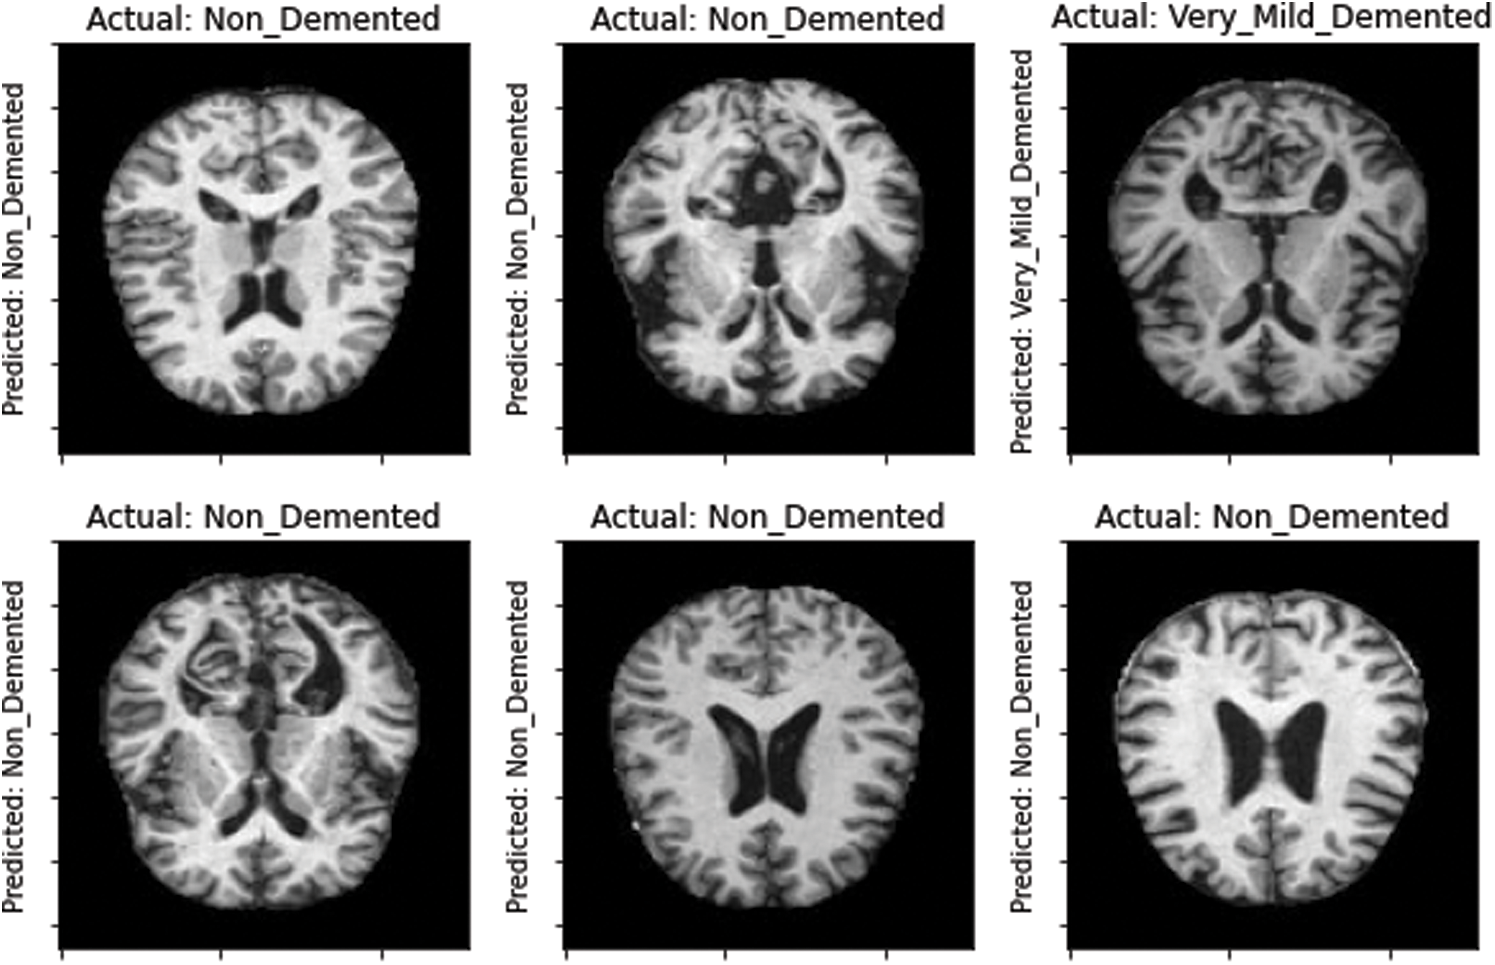
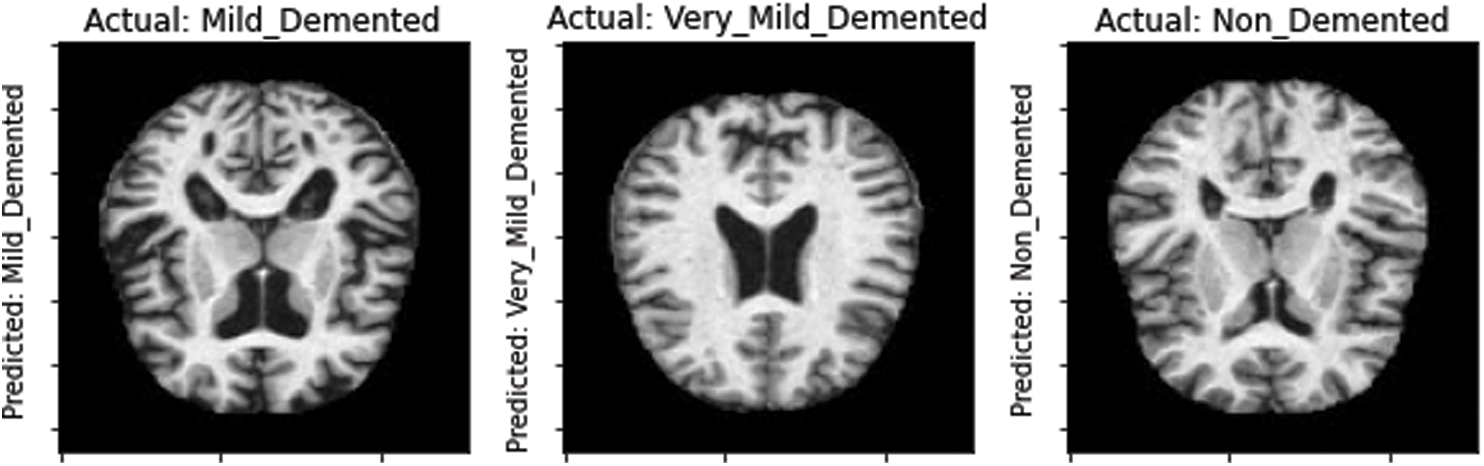
Figure 8: Model-predicted results
In this study, we present a CNN model built from scratch to detect the four stages of AD. The aim of this study was the detection of AD and providing a decision-based model that can help clinicians to diagnose AD. For this, we also attempted to use some transfer learning models of CNN-based architectures such as VGG-16 and ResNet50. The transfer learning models were employed in the same dataset, but unfortunately the results were not promising. Therefore, in this scenario, we concluded that the CNN model built from scratch provides better detection results in than the pre-learned models. Moreover, the proposed CNN from scratch model was also compared to recent existing state-of-the-art models. The performance of the proposed model showed a high testing accuracy rate of 99.38%, which is the highest so far. Moreover, the performance of the model in terms of precision, sensitivity, specificity, and F-measure was 99%, 99%, and 99% respectively, outperforming the existing models in the literature. This shows that the proposed model is reliable for detecting the four stages of AD and can be used as an intelligent decision support model for clinical diagnosis of AD. In future, the dataset can be enriched with real MRI images collected from different hospitals, clinics, and research centers to validate the results. New models, especially transfer learning models and models with different parameters, can also be applied to the new dataset, and the results will be evaluated and compared to the existing models.
Acknowledgement: Princess Nourah bint Abdulrahman University Researchers Supporting Project number (PNURSP2022R104), Princess Nourah bint Abdulrahman University, Riyadh, Saudi Arabia.
Funding Statement: Princess Nourah bint Abdulrahman University Researchers Supporting Project number (PNURSP2022R104), Princess Nourah bint Abdulrahman University, Riyadh, Saudi Arabia.
Conflicts of Interest: The authors declare that they have no conflicts of interest to report regarding the present study.
References
1. A. Loddo, S. Buttau and C. Di Ruberto, “Deep learning based pipelines for Alzheimer’s disease diagnosis: A comparative study and a novel deep-ensemble method,” Computers in Biology and Medicine, vol. 141, pp. 1–15, 2022. [Google Scholar]
2. G. Mirzaei and H. Adeli, “Machine learning techniques for diagnosis of Alzheimer disease, mild cognitive disorder, and other types of dementia,” Biomedical Signal Processing and Control, vol. 72, 2022. [Google Scholar]
3. M. Dadar, T. A. Pascoal, S. Manitsirikul, K. Misquitta, V. S. Fonov et al., “Validation of a regression technique for segmentation of white matter hyperintensities in Alzheimer’s disease,” IEEE Transactions on Medical Imaging, vol. 36, no. 8, pp. 1758–1768, 2017. [Google Scholar]
4. B. Lei, E. Liang, M. Yang, P. Yang, F. Zhou et al., “Predicting clinical scores for Alzheimer’s disease based on joint and deep learning,” Expert Systems with Applications, vol. 187, 2022. [Google Scholar]
5. R. Brookmeyer, E. Johnson, K. Ziegler-Graham and H. M. Arrighi, “Forecasting the global burden of Alzheimer’s disease,” Alzheimer’s and Dementia, vol. 3, no. 3, pp. 186–191, 2007. [Google Scholar]
6. G. Livingston, J. Huntley, A. Sommerlad, D. Ames, C. Ballard et al., “Dementia prevention, intervention, and care: 2020 report of the lancet commission,” The Lancet, vol. 396, no. 10248, pp. 413–446, 2020. [Google Scholar]
7. S. Kumar, I. Oh, S. Schindler, A. M. Lai, P. R. O. Payne et al., “Machine learning for modeling the progression of Alzheimer disease dementia using clinical data: A systematic literature review,” JAMIA Open, vol. 4, no. 3, pp. 1–10, 2021. [Google Scholar]
8. S. Naz, A. Ashraf and A. Zaib, “Transfer learning using freeze features for Alzheimer neurological disorder detection using ADNI dataset,” Multimedia Systems, vol. 28, no. 1, pp. 85–94, 2022. [Google Scholar]
9. N. Mahendran and D. R. V. PM, “A deep learning framework with an embedded-based feature selection approach for the early detection of the Alzheimer’s disease,” Computers in Biology and Medicine, vol. 141, no. September 2021, 2022. [Google Scholar]
10. S. Afzal, M. Maqsood, U. Khan, I. Mehmood, H. Nawaz et al., “Alzheimer disease detection techniques and methods: A review,” International Journal of Interactive Multimedia and Artificial Intelligence, vol. 6, no. 7, pp. 26–38, 2021. [Google Scholar]
11. X. Bi, S. Li, B. Xiao, Y. Li, G. Wang et al., “Computer aided Alzheimer’s disease diagnosis by an unsupervised deep learning technology,” Neurocomputing, vol. 392, pp. 296–304, 2020. [Google Scholar]
12. J. Islam and Y. Zhang, “Early diagnosis of Alzheimer’s disease: A neuroimaging study with deep learning architectures,” in IEEE Conf. on Computer Vision and Pattern Recognition Workshops, Salt Lake City, USA, pp. 1994–1996, 2018. [Google Scholar]
13. P. Padilla, M. Lopez, J. M. Gorriz, J. Ramirez, D. Salas-Gonzalez et al., “NMF-SVM based CAD tool applied to functional brain images for the diagnosis of Alzheimer’s disease,” IEEE Transactions on Medical Imaging, vol. 31, no. 2, pp. 207–216, 2012. [Google Scholar]
14. J. Gao, Q. Jiang, B. Zhou and D. Chen, “Convolutional neural networks for computer-aided detection or diagnosis in medical image analysis: An overview,” Mathematical Biosciences and Engineering, vol. 16, no. 6, pp. 6536–6561, 2019. [Google Scholar]
15. J. Venugopalan, L. Tong, H. R. Hassanzadeh and M. D. Wang, “Multimodal deep learning models for early detection of Alzheimer’s disease stage,” Scientific Reports, vol. 11, no. 1, pp. 1–13, 2021. [Google Scholar]
16. E. Lin, C. H. Lin and H. Y. Lane, “Deep learning with neuroimaging and genomics in Alzheimer’s disease,” International Journal of Molecular Sciences, vol. 22, no. 15, pp. 1–20, 2021. [Google Scholar]
17. D. Lu, K. Popuri, G. W. Ding, R. Balachandar and M. F. Beg, “Multimodal and multiscale deep neural networks for the early diagnosis of Alzheimer’s disease using structural MR and FDG-PET images,” Scientific Reports, vol. 8, no. 1, pp. 1–13, 2018. [Google Scholar]
18. T. Jo, K. Nho and A. J. Saykin, “Deep learning in Alzheimer’s disease: Diagnostic classification and prognostic prediction using neuroimaging data,” Frontiers in Aging Neuroscience, vol. 11, pp. 1–14, 2019. [Google Scholar]
19. S. Savaş, “Detecting the stages of Alzheimer’s disease with pre-trained deep learning architectures,” Arabian Journal for Science and Engineering, vol. 47, no. 2, pp. 2201–2218, 2022. [Google Scholar]
20. S. Murugan, C. Venkatesan, M. G. Sumithra, X. Z. Gao, B. Elakkiya et al., “DEMNET: A deep learning model for early diagnosis of Alzheimer diseases and dementia from mr images,” IEEE Access, vol. 9, pp. 90319–90329, 2021. [Google Scholar]
21. T. Shahwar, J. Zafar, A. Almogren, H. Zafar, A. U. Rehman et al., “Automated detection of Alzheimer’s via hybrid classical quantum neural networks,” Electronics, vol. 11, no. 5, pp. 1–19, 2022. [Google Scholar]
22. B. A. Mohammed, E. M. Senan, T. H. Rassem, N. M. Makbol, A. A. Alanazi et al., “Multi-method analysis of medical records and mri images for early diagnosis of dementia and Alzheimer’s disease based on deep learning and hybrid methods,” Electronics, vol. 10, pp. 1–20, 2021. [Google Scholar]
23. M. Gharaibeh, M. Almahmoud, M. Z. Ali, A. Al-Badarneh, M. El-Heis et al., “Early diagnosis of Alzheimer’s disease using cerebral catheter angiogram neuroimaging: A novel model based on deep learning approaches,” Big Data and Cognitive Computing, vol. 6, no. 2, pp. 1–23, 2022. [Google Scholar]
24. H. Ji, Z. Liu, W. Q. Yan and R. Klette, “Early diagnosis of Alzheimer’s disease using deep learning,” in Proc. of the 2nd Int. Conf. on Control and Computer Vision, Korea, pp. 87–91, 2019. [Google Scholar]
25. A. Basher, B. C. Kim, K. H. Lee and H. Y. Jung, “Volumetric feature-based Alzheimer’s disease diagnosis from smri data using a convolutional neural network and a deep neural network,” IEEE Access, vol. 9, pp. 29870–29882, 2021. [Google Scholar]
26. A. Farooq, S. M. Anwar, M. Awais and S. Rehman, “A deep CNN based multi-class classification of Alzheimer’s disease using MRI,” in 2017 IEEE Int. Conf. on Imaging Systems and Techniques (IST), Beijing, China, pp. 1–7, 2017. [Google Scholar]
27. S. Qiu, G. H. Chang, M. Panagia, D. M. Gopal, R. Au et al., “Fusion of deep learning models of MRI scans, mini–mental state examination, and logical memory test enhances diagnosis of mild cognitive impairment,”Alzheimer’s & Dementia: Diagnosis, Assessment & Disease Monitoring, vol. 10, pp. 737–749, 2018. [Google Scholar]
28. Kaggle, “Alzheimer MRI preprocessed dataset,” https://www.kaggle.com/datasets/sachinkumar413/alzheimer-mri-dataset, 2022 (accessed Apr. 16, 2022). [Google Scholar]
29. J. P. Maheswari, “Breaking the curse of small data sets in machine learning: Part 2,” https://towardsdatascience.com/breaking-the-curse-of-small-data-sets-in-machine-learning-part-2-894aa45277f4#:~:text=Neural%20networks%20are%20the%20basic,iteration%20can%20result%20in%20overfitting, 2022. [Google Scholar]
30. K. Ding, Z. Xu, H. Tong and H. Liu, “Data augmentation for deep graph learning: A survey,” arXiv preprint arXiv, pp. 08235, 2022, [Online]. Available: http://arxiv.org/abs/2202.08235. [Google Scholar]
31. P. P. Kumar, V. M. A. Bai and G. G. Nair, “Augmentation techniques on mammogram images for cnn based breast cancer classification,” in Emergent Converging Technologies and Biomedical Systems, Singapore, Springer, pp. 635–649, 2022. [Google Scholar]
32. P. Oza, P. Sharma, S. Patel, F. Adedoyin and A. Bruno, “Image augmentation techniques for mammogram analysis,” Journal of Imaging, vol. 8, no. 5, pp. 1–22, 2022. [Google Scholar]
33. H. Ahmad, S. Ahmad, M. Asif, M. Rehman, A. Alharbi et al., “Evolution-based performance prediction of star cricketers,” Computers, Materials and Continua, vol. 69, no. 1, pp. 1215–1232, 2021. [Google Scholar]
34. Y. Li, M. Zhang and C. Chen, “A deep-learning intelligent system incorporating data augmentation for short-term voltage stability assessment of power systems,” Applied Energy, vol. 308, pp. 1–17, 2022. [Google Scholar]
35. U. R. Acharya, S. L. Oh, Y. Hagiwara, J. H. Tan, M. Adam et al., “A deep convolutional neural network model to classify heartbeats,” Computers in Biology and Medicine, vol. 89, pp. 389–396, 2017. [Google Scholar]
36. N. Altwaijry and I. Al-Turaiki, “Arabic handwriting recognition system using convolutional neural network,” Neural Computing and Applications, vol. 33, pp. 2249–2261, 2021. [Google Scholar]
37. F. Sultana, A. Sufian and P. Dutta, “Advancements in image classification using convolutional neural network,” in 4th IEEE Int. Conf. on Research in Computational Intelligence and Communication Networks, Kolakata, India, pp. 122–129, 2018. [Google Scholar]
38. S. Yu, S. Jia and C. Xu, “Convolutional neural networks for hyperspectral image classification,” Neurocomputing, vol. 219, pp. 88–98, 2017. [Google Scholar]
39. N. Abiwinanda, M. Hanif, S. T. Hesaputra, A. Handayani and T. R. Mengko, “Brain tumor classification using convolutional neural network,” in World Congress on Medical Physics and Biomedical Engineering, Singapore, Springer, pp. 183–189, 2019. [Google Scholar]
40. Z. Ullah and M. Jamjoom, “An intelligent approach for arabic handwritten letter recognition using convolutional neural network,” PeeJ Computer Science, vol. 8, pp. 1–22, 2022. [Google Scholar]
41. B. Gambäck and U. K. Sikdar, “Using convolutional neural networks to classify hate-speech,” in Proc. of the First Workshop on Abusive Language Online, Vancouver, Canada, no. 7491, pp. 85–90, 2017. [Google Scholar]
42. X. R. Zhang, J. Zhou, W. Sun and S. K. Jha, “A lightweight CNN based on transfer learning for COVID-19 diagnosis,” Computers, Materials & Continua, vol. 72, no. 1, pp. 1123–1137, 2022. [Google Scholar]
43. W. Sun, G. C. Zhang, X. R. Zhang, X. Zhang and N. N. Ge, “Fine-grained vehicle type classification using lightweight convolutional neural network with feature optimization and joint learning strategy,” Multimedia Tools and Applications, vol. 80, no. 20, pp. 30803–30816, 2021. [Google Scholar]
Cite This Article
 Copyright © 2023 The Author(s). Published by Tech Science Press.
This work is licensed under a Creative Commons Attribution 4.0 International License , which permits unrestricted use, distribution, and reproduction in any medium, provided the original work is properly cited.
 Downloads
 Citation Tools