
 Submit a Paper
 Propose a Special lssue
 Open Access
ARTICLE
Optimizing Optical Attocells Positioning of Indoor Visible Light Communication System
1 School of Electrical Engineering, Faculty of Engineering, Universiti Teknologi Malaysia, Skudai, 81310, Malaysia
2 Lightwave Communications Research Group (LCRG), Faculty of Electrical Engineering, Universiti Teknologi Malaysia (UTM), Skudai, Johor, Malaysia
3 Department of Electronics and Electrical Engineering, Faculty of Engineering, International University of Africa, Khartoum, 12223, Sudan
4 Department of Communication Engineering, Faculty of Electrical and Electronic Engineering Universiti Tun Hussein Onn Malaysia (UTHM), Parit Raja, Batu Pahat, 86400, Johor, Malaysia
5 Faculty of Computing and Informatics, Universiti Malaysia Sabah, Kota Kinabalu, 88400, Malaysia
6 Department of Computer Science, University of São Paulo, São Paulo, Brazil
* Corresponding Author: Muzaffar Hamzah. Email:
Computers, Materials & Continua 2023, 74(2), 3607-3625. https://doi.org/10.32604/cmc.2023.031192
Received 12 April 2022; Accepted 29 June 2022; Issue published 31 October 2022
 View Full Text
 Download PDF
Abstract
Visible light communication (VLC), which is a prominent emerging solution that complements the radio frequency (RF) technology, exhibits the potential to meet the demands of fifth-generation (5G) and beyond technologies. The random movement of mobile terminals in the indoor environment is a challenge in the VLC system. The model of optical attocells has a critical role in the uniform distribution and the quality of communication links in terms of received power and signal-to-noise ratio (SNR). As such, the optical attocells positions were optimized in this study with a developed try and error (TE) algorithm. The optimized optical attocells were examined and compared with previous models. This novel approach had successfully increased minimum received power from −1.29 to −0.225 dBm, along with enhanced SNR performance by 2.06 dB. The bit error rate (BER) was reduced to and by utilizing OOK-NRZ and BPSK modulation techniques, respectively. The optimized attocells positions displayed better uniform distribution, as both received power and SNR performances improved by 0.45 and 0.026, respectively. As the results of the proposed model are optimal, it is suitable for standard office and room model applications.Keywords
As projected by Cisco, the demand for high data rate communication systems has been escalating on daily basis [1] and the mobile data traffic has been expected to multiply over seven-fold between 2017 and 2022 [2]. To date the radio frequency (RF) technology suffers from numerous shortcomings in terms of its capacity crunch, bandwidth bottleneck, electromagnetic interference, power consumption, and costs. These setbacks have caused the RF technology to fall behind on its usability in massive applications. Hence, alternative solutions, such as visible light communication (VLC), have been introduced to bridge the gap in providing higher data transmission rates and services for both single and multiple users in indoor environments [3–5]. Such a solution is viable even to connect mobile and fixed devices [6]. The VLC is a critical key alternative technology for 6th generation cellular communications [7,8]. At present, VLC has garnered interest due to its energy efficiency, security, and cost-efficiency–a suitable wireless technology for indoor setting [9,10]. A typical VLC system consists of optical attocells, which refer to small base stations (BS) mounted on the ceiling of a standard room or office to provide both communication and illumination simultaneously [11–13]. The VLC system configurations share many similarities with the macro, micro, and femtocells configurations of a cellular network. Fig. 1 illustrates various cellular coverage zones of heterogeneous networks in combination with optical attocells.
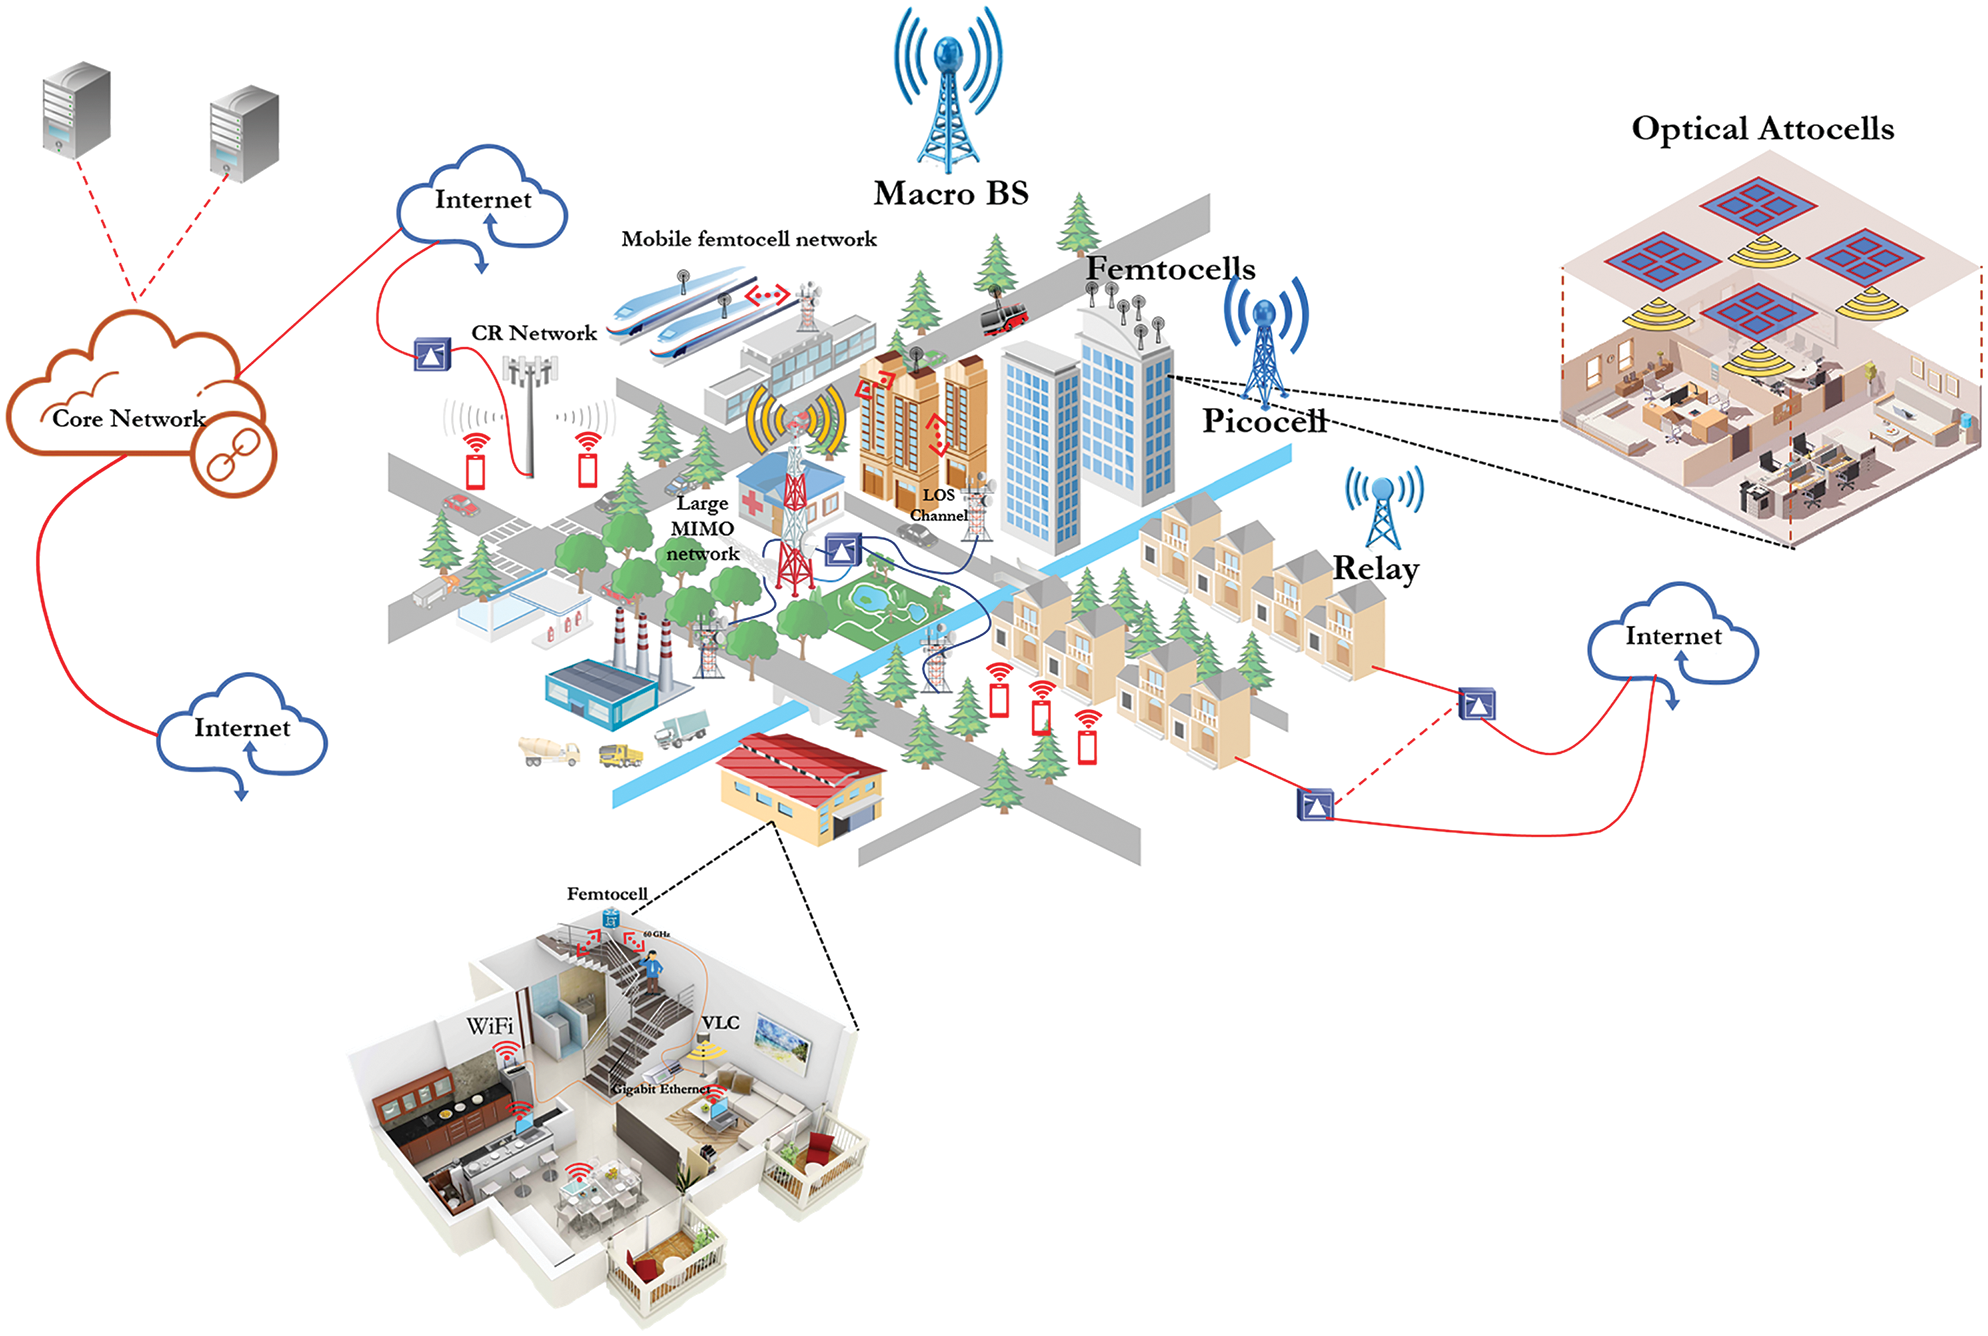
Figure 1: Several cellular coverage zones for heterogeneous networks
The distribution of many small optical attocells in indoor environments should satisfy the requirements of 5G applications due to enhanced channel capacity, transmission rate, and signal-to-noise ratio (SNR) performance, as well as reduced bit error rate (BER) [14,15]. Optical attocells also offer improved support for user mobility in terms of better link availability and quality for multiple settings [16,17].
The layout of optical attocells plays a crucial role in the indoor VLC system, especially to ascertain the uniform distribution of received power and SNR over the communication plane [18–21]. Random movement of mobile terminals is a hindrance to mobile networking [22], in which performance parameters (e.g., received power & SNR) are not fairly distributed across the entire environment. The use of VLC system in rooms or office spaces has faced multiple obstacles and its development is still ongoing, particularly to maximize uniform distribution, to improve both received power and SNR performances, as well as to reduce BER. As a result, several solutions have been proposed to optimize these parameters for indoor VLC systems. One viable solution is the use of multiple optical attocells transmitters [23–27] to cover a wide indoor region, thus enhancing uniform distribution.
Alternatively, numerous optical attocell configurations were investigated with a range of parameters for indoor setting [28]. These studies assessed the impact of multipath reflections in terms of root mean square (RMS) delay spread and BER performance. The coverage ratio performance with multiple optical attocells in a typical room model was examined as well. The system was evaluated based on the quality of experience (QoE) metrics [29]. The effect of several parameters, such as transmission power, user equipment (UE) density, number of UEs, and optical attocells, on coverage probability was assessed in a similar indoor setting. Next, a dense optical attocells configuration with single and multi-colors light emitting diode (LED) had been investigated in [30] to improve the performance of indoor VLC system. In addition, LED half power was optimized to maximize transmission rate. Additionally, two layout models with 16 optical attocells were proposed using enhanced genetic annealing algorithm to improve coverage uniformity in terms of illumination and received power distribution [31]. Based on the findings reported in past studies [28–31], the distribution of a large number of optical attocells on the room ceiling improved uniformity distribution due to the short distances among the optical attocells. However, this had increased RMS delay spread and further led to a severe impact on the system performance.
Another potential solution is to use a developed artificial fish swarm algorithm to optimize the positioning of optical attocells in a typical room, which resulted in better communication performance [32]. Upon using 4 and 16 optical attocells in the room, the study examined power uniformity. An optimal optical attocell placement algorithm was proposed in [33] to enhance illumination and communication performances simultaneously. Besides, a power minimization issue was formulated under illumination and communication levels constraints, which improved power efficiency. Various hemispherical optical receivers were designed to enhance intersymbol interference (ISI) and SNR at the receiver end for the multiple-input multiple-output (MIMO) VLC system, in which the angle diversity technology was deployed [34]. The outcomes revealed improvement in the average SNR by 15.2% with a minimum number of photodiodes (PDs) at the receiving end.
The VLC system, which has been considered as a Non-Line of Sight (LOS) channel, was evaluated using a new approach [35], where Gaussian approximation was employed to derive the mathematical expression of BER performance. The study disclosed that the BER enhanced with increased SNR and a huge reflection provided an approximate performance to the LOS channel. Many other optimization techniques were investigated and reviewed to improve the performance of VLC system [10,36] by addressing power allocation, security issues, energy harvesting, maximizing sum rate, and other performance parameters. The impact of VLC limitations on system performance is discussed in [36]. Based on the related work described in this section, the authors of this present study were motivated to bridge the identified gaps in the literature by offering the following novel contributions:
• Proposing new optical attocells positioning on the room ceiling by using a developed try and error (TE) algorithm.
• Extracting new mathematical formulas to solve the problem of maximizing and minimizing performances of several parameters, such as received power, SNR, and BER.
• Reducing the BER using OOK-NRZ and BPSK modulation techniques.
• Improving uniform distribution in the entire room.
• Obtaining higher minimum received power and SNR in the room.
The remainder of this paper is as follows: Section 3 presents the proposed system model and TE algorithm. Next, Section 4 discusses the VLC system parameters, including horizontal illuminance, received power and SNR distribution, modulation techniques, and coefficient of variation (CV). Then, Section 5 presents the simulation results and discussion. This paper is concluded in Section 6.
The primary goal of this study is to maximize the received power and SNR distribution, as well as to reduce BER. Hence, an optimization positions (i.e., TE) algorithm for optical attocells in a standard room model was developed. The mathematical formulation of the maximization and minimization problems is expressed in the following:
Such that
where
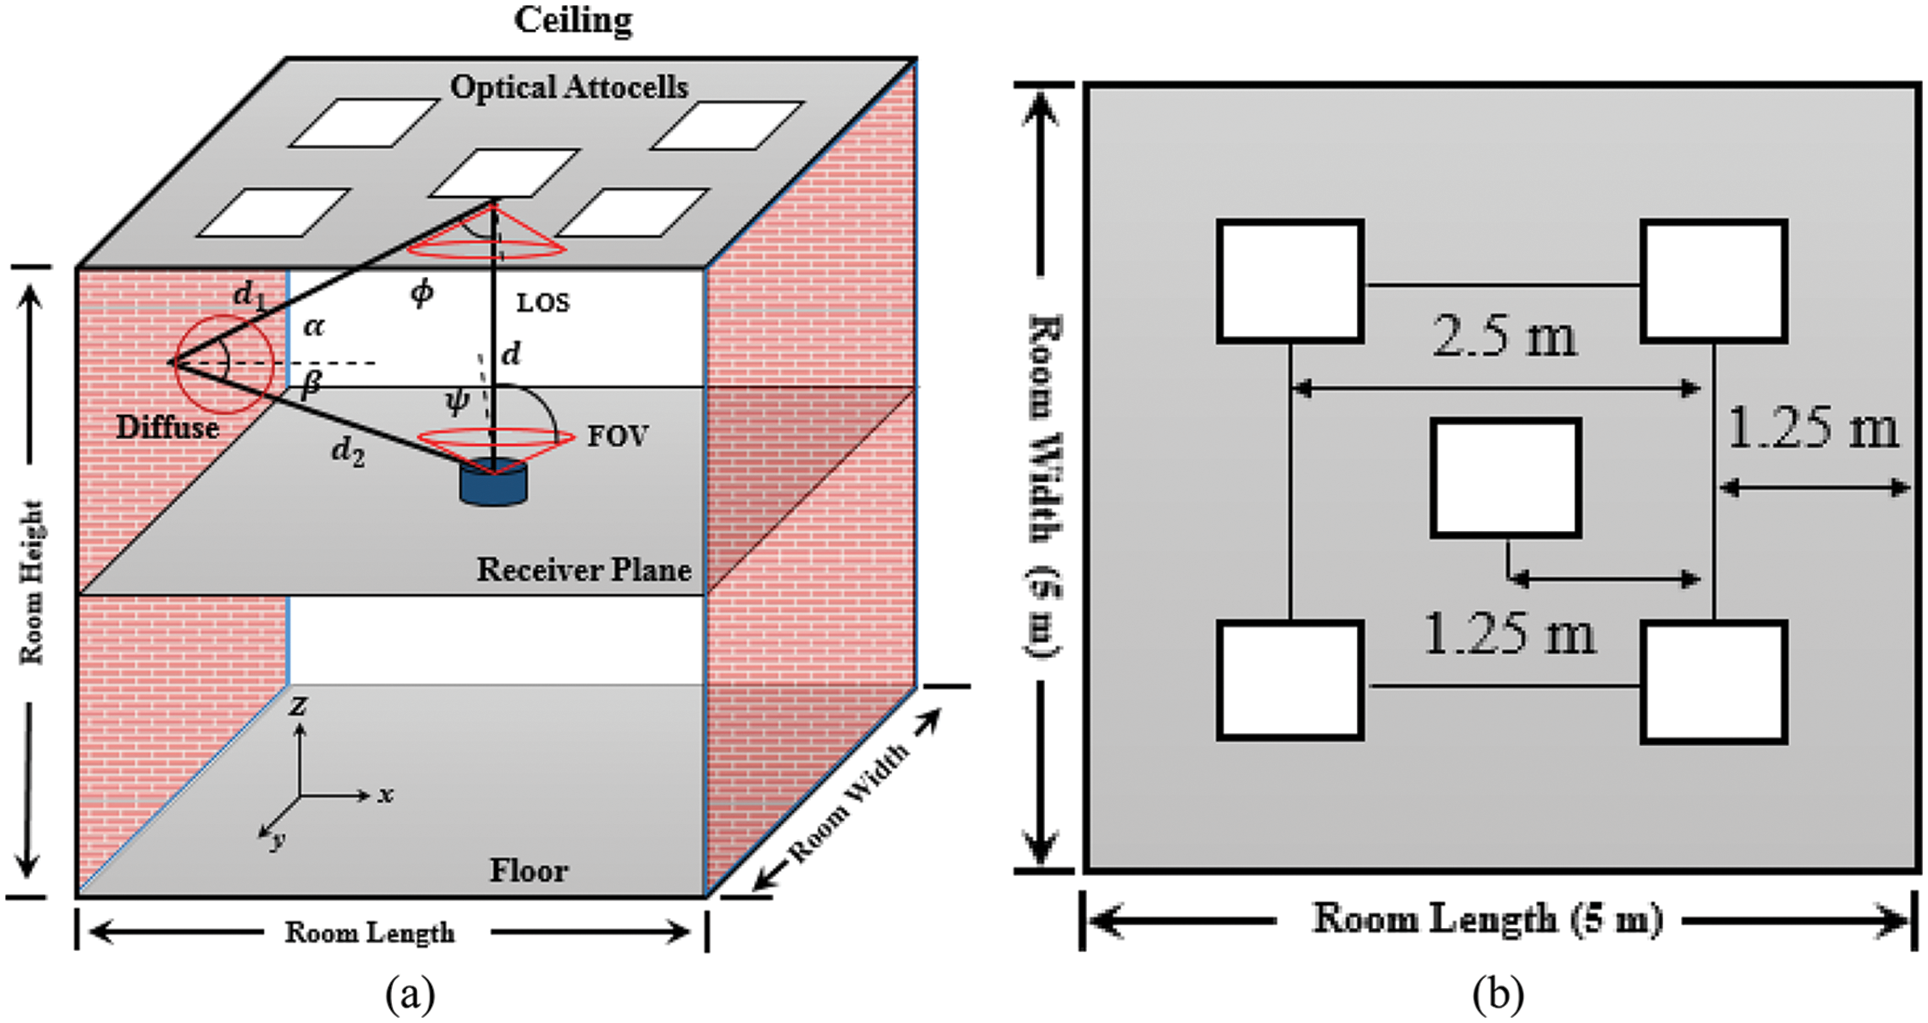
Figure 2: Illustration of basic VLC system for Model 1 (a) standard room scenario and (b) top view of optical attocells deployment configuration [10]
Furthermore, the optimization positions should maximize the uniform distribution (CV) in terms of received power and SNR, as given below:
Such that,
where E [.] represents the expectation operator, CV is a uniformity metric termed ‘coefficient of variation’ (CV). l and w denote the length and width of the standard room, respectively. (
The optical attocells deployment of Model 1 is described in [10], which consists of the VLC system (see Fig. 2). One optical attocell is located at the center of the room, while the other 4 optical attocells are deployed at the corners of the room.
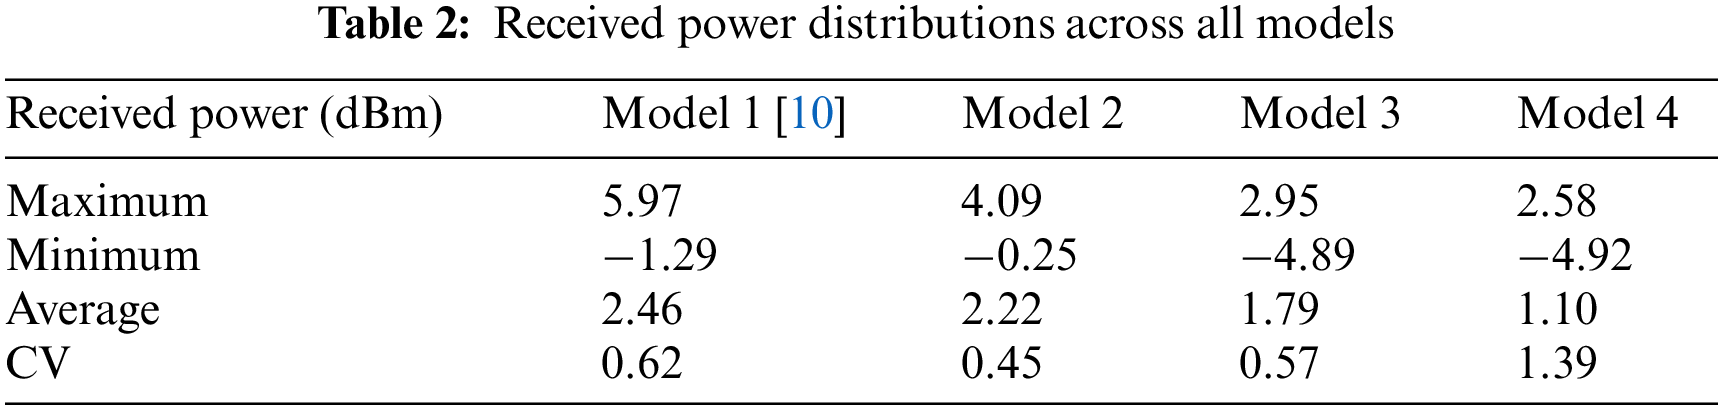
In Model 1, the separation distance between the optical attocells at the room corners is 2.5 m. However, each optical attocell is separated by 1.25 m from the room edges. In order to improve uniformity, as well as to optimize the minimum received power and SNR, new optical attocells positions with different separation distances were investigated. Tab. 1 shows an example of the separation distances between optical attocells at the corners and edges for different models, which was determined by using the developed TE algorithm.
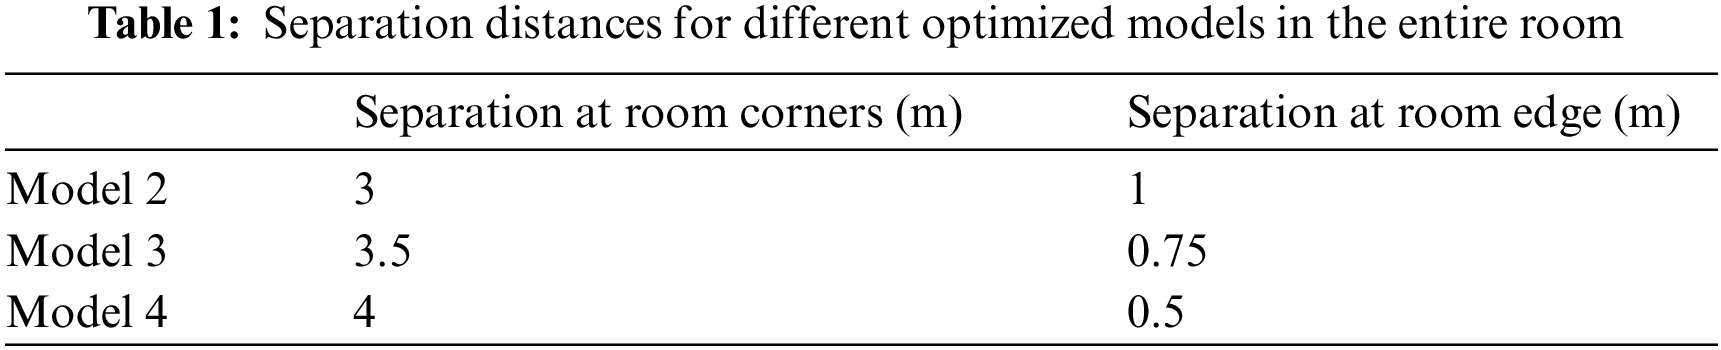
Fig. 3 displays the top view of optical attocells positions for the three models, where the distances among optical attocells at room corners, individual optical attocells to room edge, and optical attocell at the center to each optical attocell at the corners are illustrated.
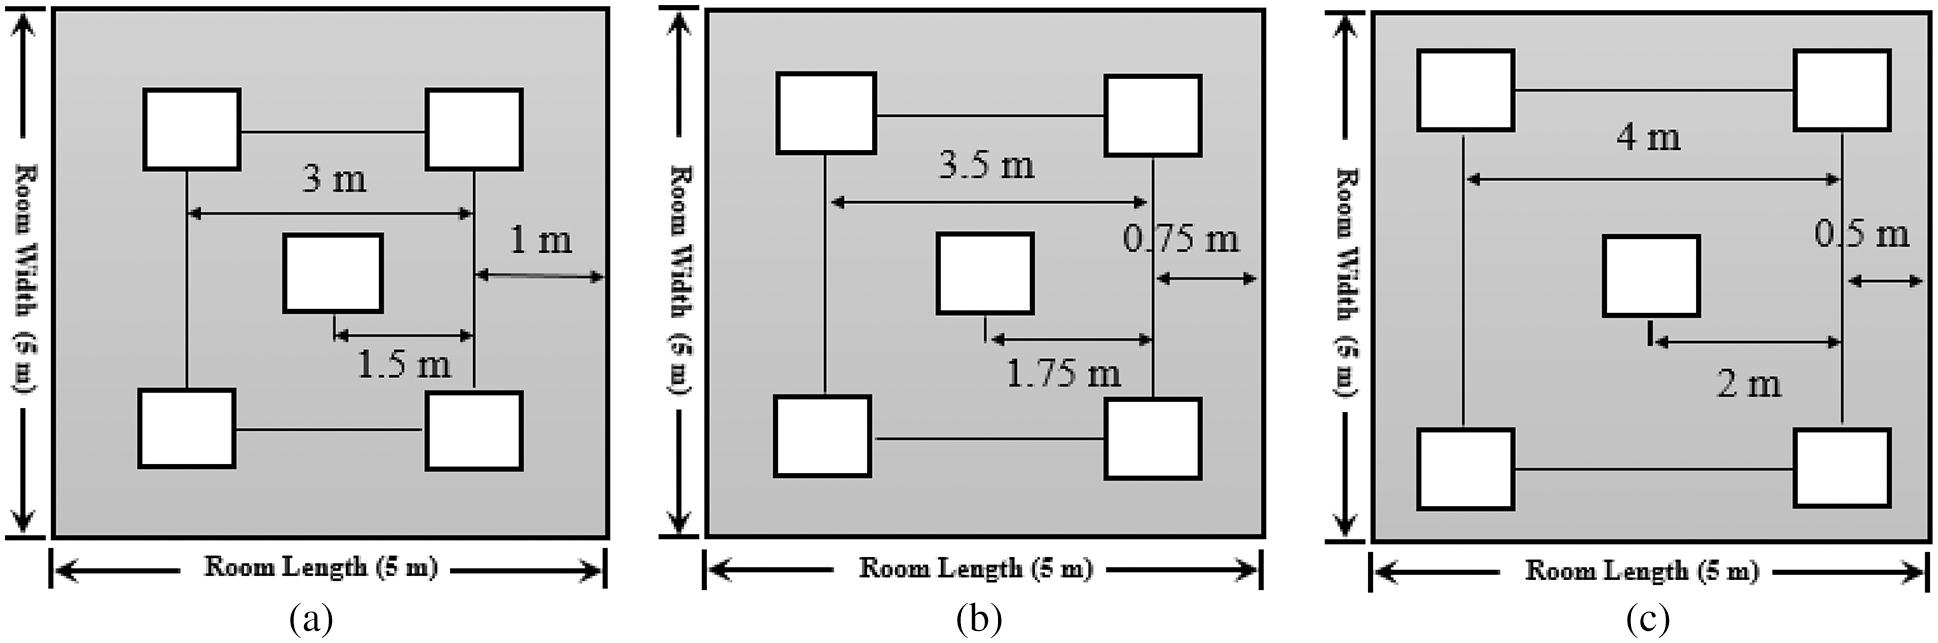
Figure 3: Top view of optical attocells positions for (a) Model 2, (b) Model 3 and (c) Model 4
The following lists are the definitions and the flow chart of the TE algorithm, as illustrated in Fig. 4, in order to optimize the optical attocells positions.
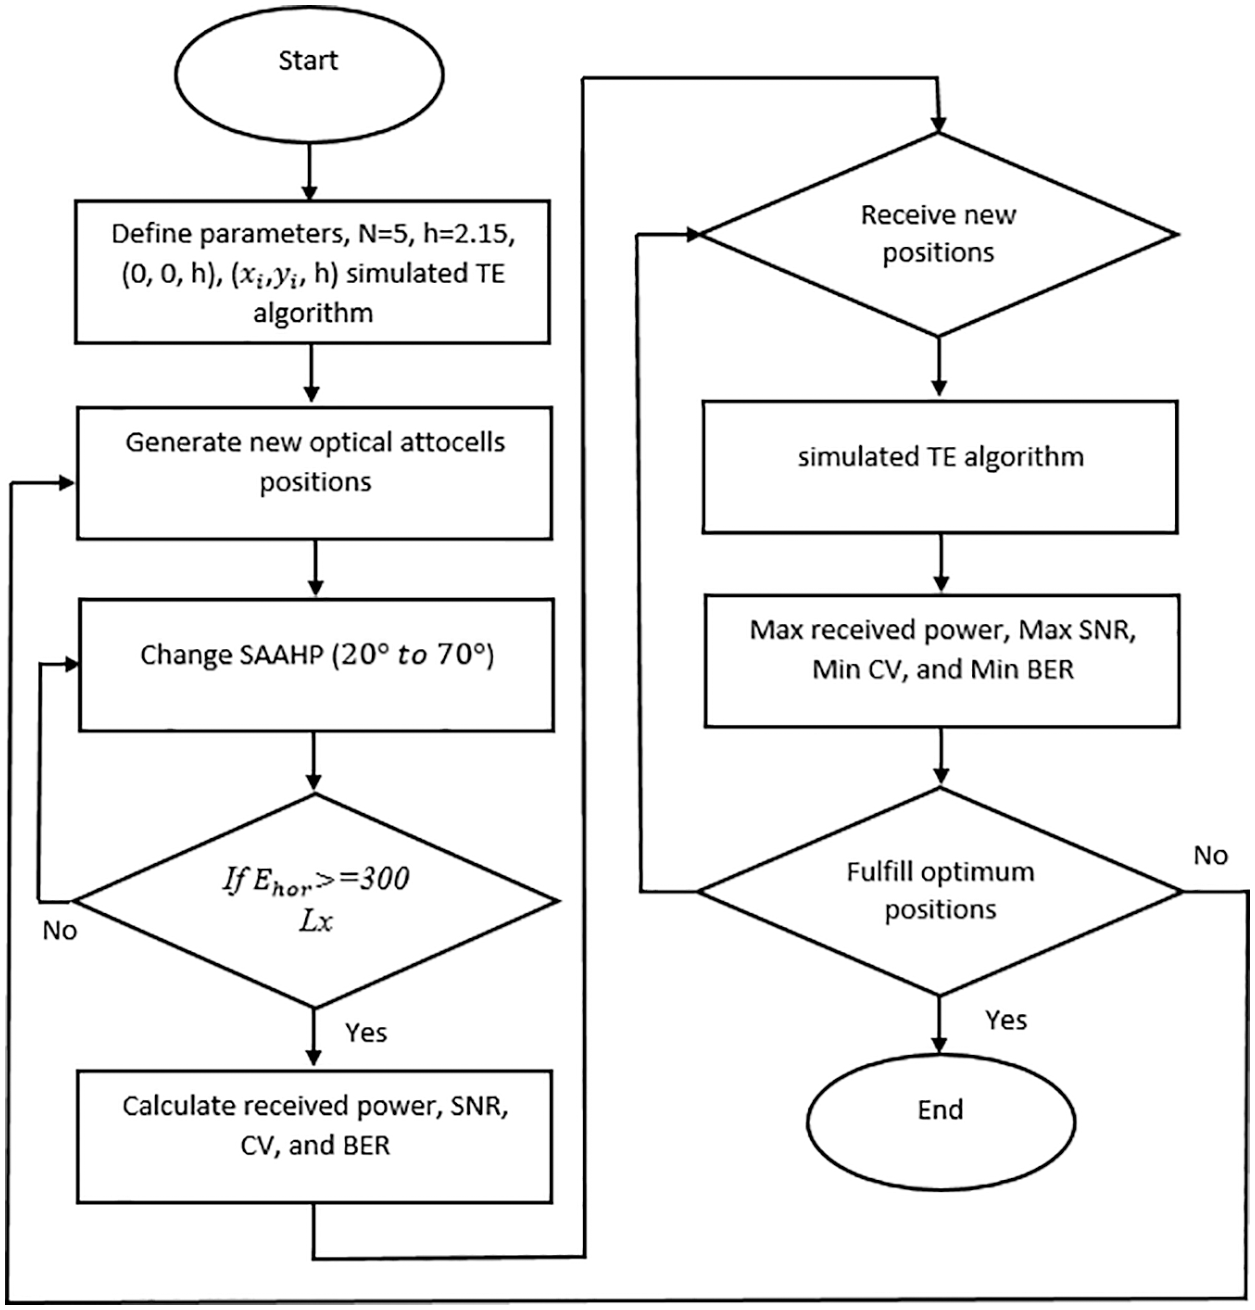
Figure 4: Flow chart of the simulated TE algorithm
Definitions:
Lx % horizontal illumination is based on ISO for a standard room
N = 5% Number of optical attocells within the room
H = 2.15% is the height between optical attocell and receiver plane level
(0, 0, h) is an optical attocell located at the center of the room
(
The maximum result in SNR had reduced the BER, as presented in Eq. (2). Therefore, the TE algorithm is suitable for any VLC system design for indoor applications. The results denoting improved illumination and communication performances in terms of received power, SNR, CV, and BER as described in Section 5.
Different parameters were employed to evaluate the VLC systems of all optimized models, in terms of illumination, received power, SNR, BER, and CV. The results of all parameters are discussed and analyzed in the following sub-sections.
4.1 Horizontal Illuminance, Received Power and SNR Distribution
The geometry system of the standard room model, as illustrated in Fig. 2a, is composed of LOS and Non-LOS links. However, in this study, only the channel model of the LOS link was considered and analyzed. The Lambertian radiation pattern was also considered as a source of emission. Hence, the intensity of illumination at angle ϕ is expressed as follows [10,23]:
where I (0) represents the center luminous intensity from a group of LEDs, while ϕ and m are the angle of irradiance and order of Lambertian emission, respectively. Lambertian is defined by the semi-angle of half illumination from LEDs denoted by
The horizontal illumination of 3D points (x, y, and z) is referred to by
where ψ is an angle of incident,
The channel DC gain of LOS link is given by Eq. (7).
where A refers to the detector physical area of PD and ψ is the FOV angle of the receiver.
where
The received power and SNR distribution can be computed respectively as follows:
where
where the aforementioned definitions and values were previously presented in [10].
All previously presented models were further studied by evaluating the BER performance, where the on-off-keying non-return-to-zero (OOK-NRZ) and binary phase-shift keying (BPSK) modulation techniques were deployed in this present study. The BER calculation of both modulation techniques was computed as follows:
where
4.3 Coefficient of Variation (CV)
The CV is a uniformity metric employed to determine the suitable positions of optical attocells that could be used to provide acceptable communication and illumination performances. Ideal communication quality may be obtained at the lower mean of received power and SNR. The CV of both received power and SNR distribution could be computed respectively as follows:
where
where
5 Simulation Results and Discussion
Fig. 5 illustrates the evaluation of horizontal illuminance distribution at SAAHP
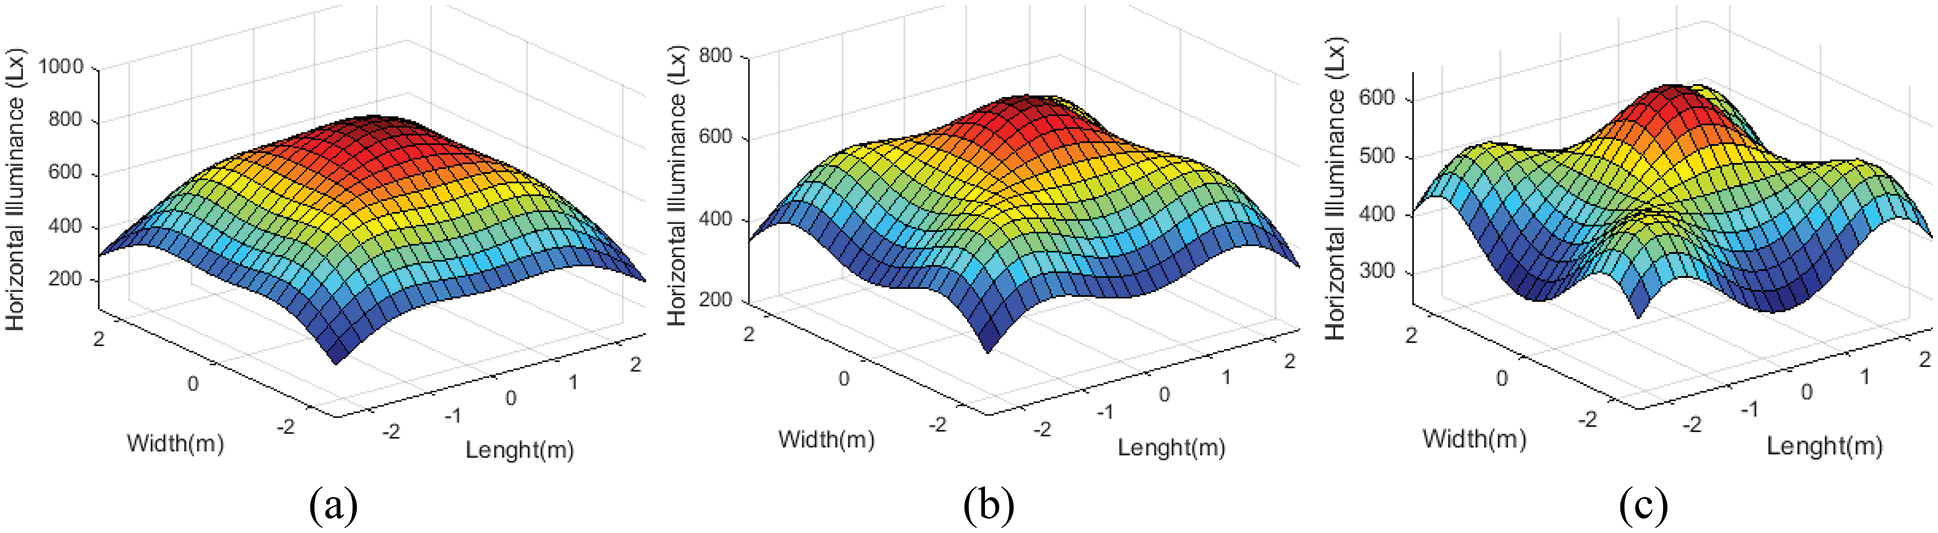
Figure 5: Horizontal illumination distribution at SAAHP
Fig. 6 presents the effect of various SAAHP angles on the conduct of illumination distribution. As observed, wider SAAHP produced the highest illumination levels. Besides, the simulated models satisfied the illumination required for the typical room model based on the ISO standard.
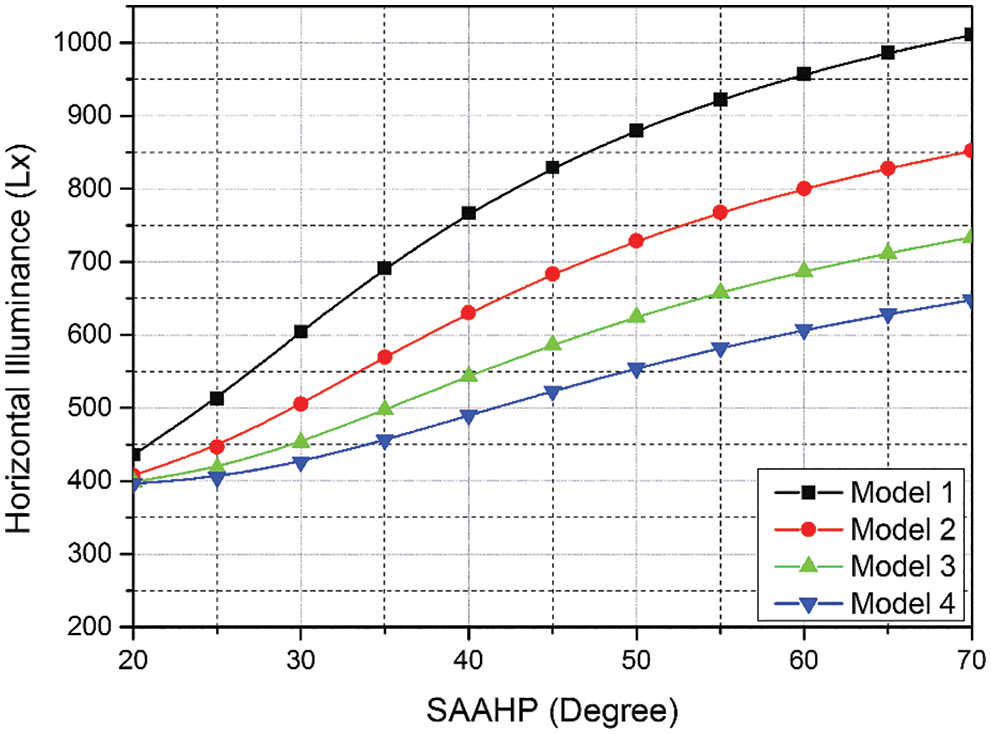
Figure 6: Horizontal illuminance against various SAAHP angles
In order to assess the effect of optical attocells deployment on received power, SNR, and uniform distribution; the simulation was performed for all models. Fig. 7 illustrates the received power distribution at SAAHP
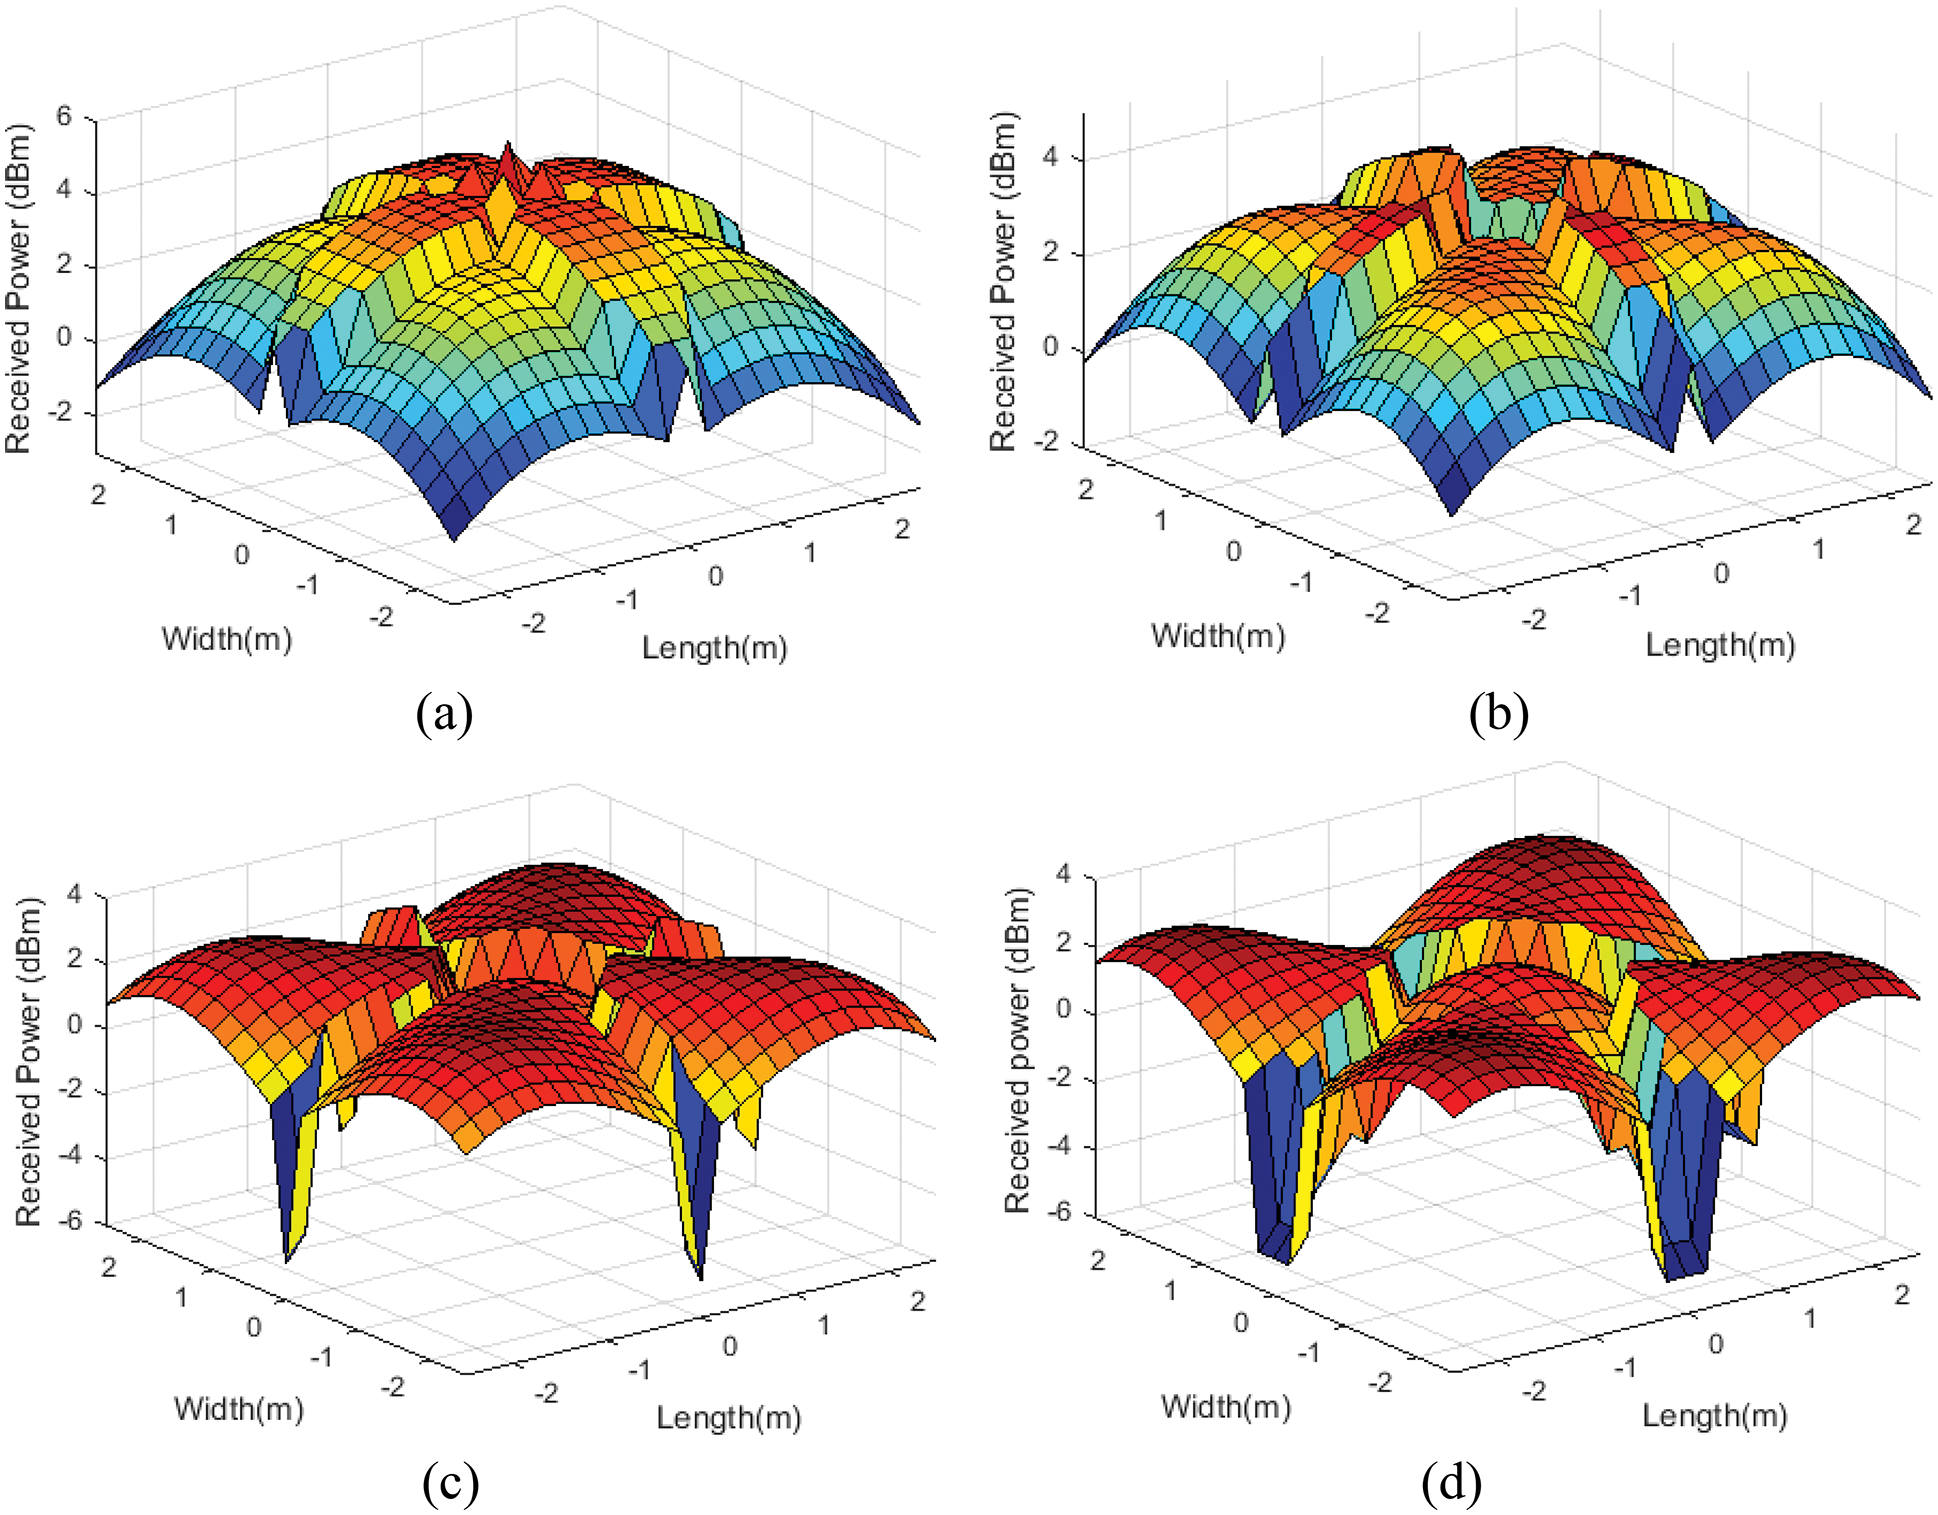
Figure 7: Received power distribution at SAAHP
The effect of various SAAHP angles on minimum received power is displayed in Fig. 8. The minimum received power improved as SAAHP angles increased, where SAAHP that exceeded
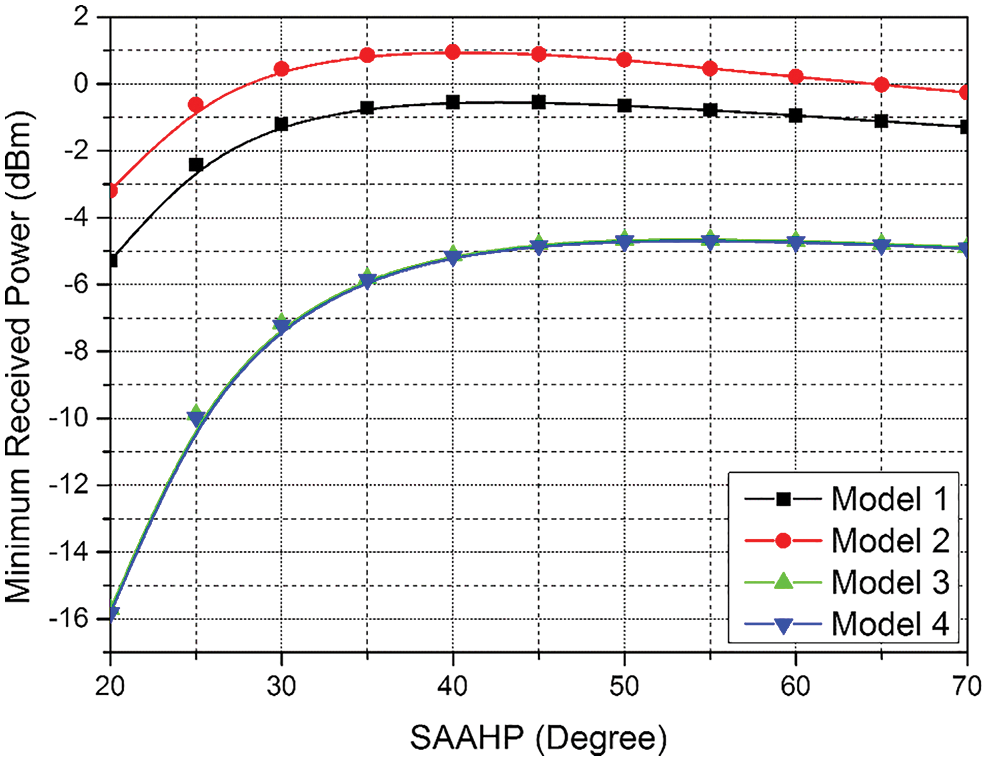
Figure 8: Minimum received power vs. different SAAHP angles
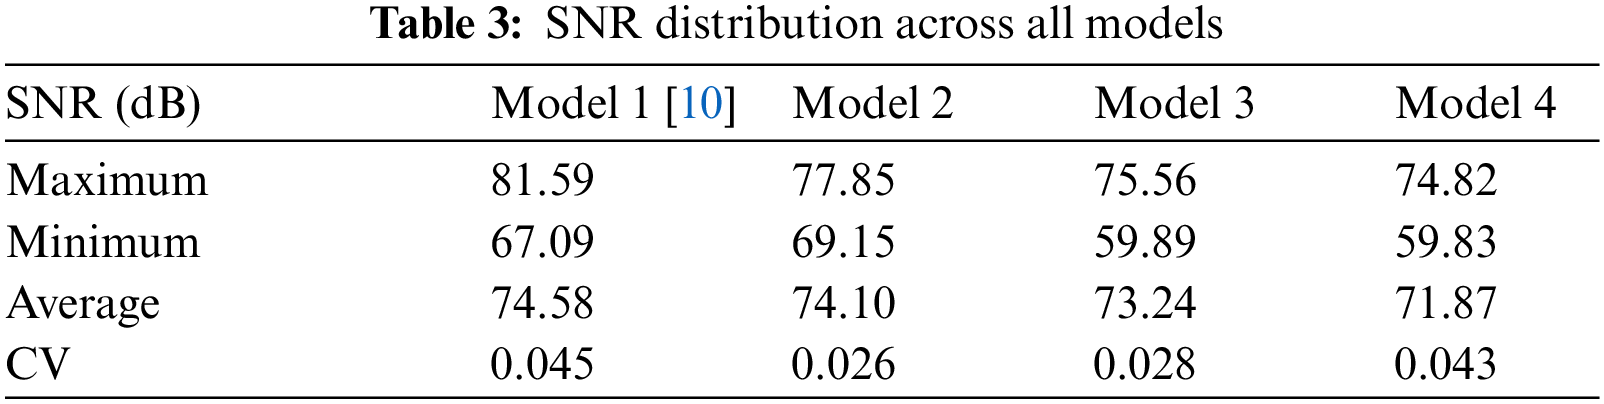
Fig. 9 illustrates the SNR distribution of previous models (see maximum, minimum, average, & CV of SNR results in Tab. 3). The minimum SNR values of 67.09, 69.15, 59.89, and 59.83 dB were achieved by Models 1, 2, 3, and 4, respectively. Imminently, Model 2 recorded the highest minimum SNR in comparison with other models.
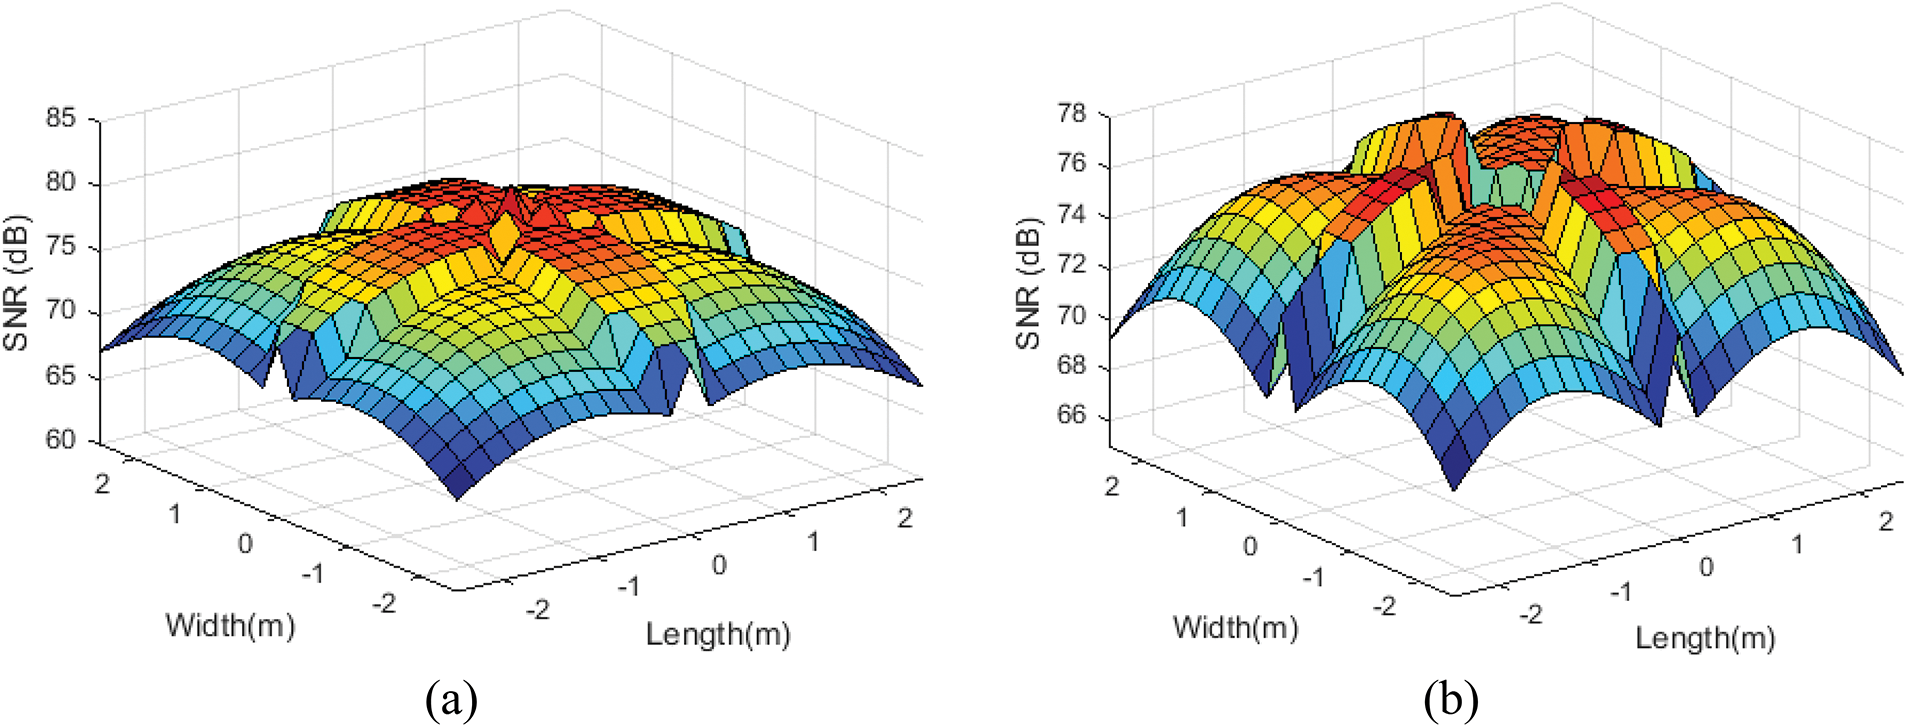
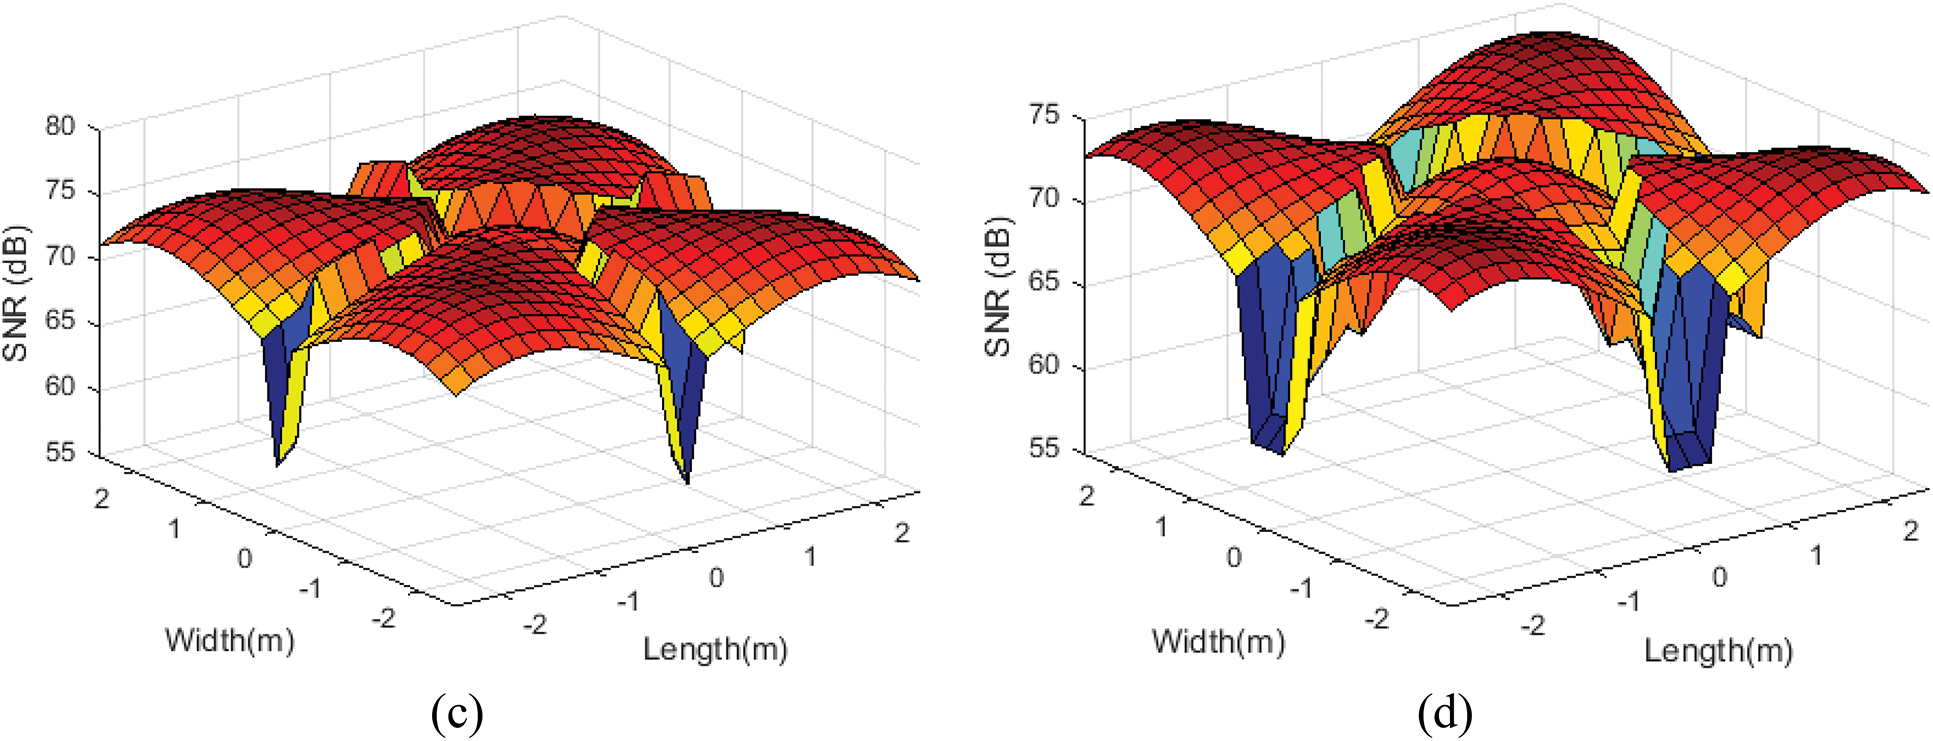
Figure 9: Received power distribution at SAAHP
The results of minimum SNR vs. different SAAHP angles are presented in Fig. 10, whereby small SAAHP angles reduced minimum SNR distribution, but improved with increasing SAAHP values. Moreover, the SNR for SAAHP angles above
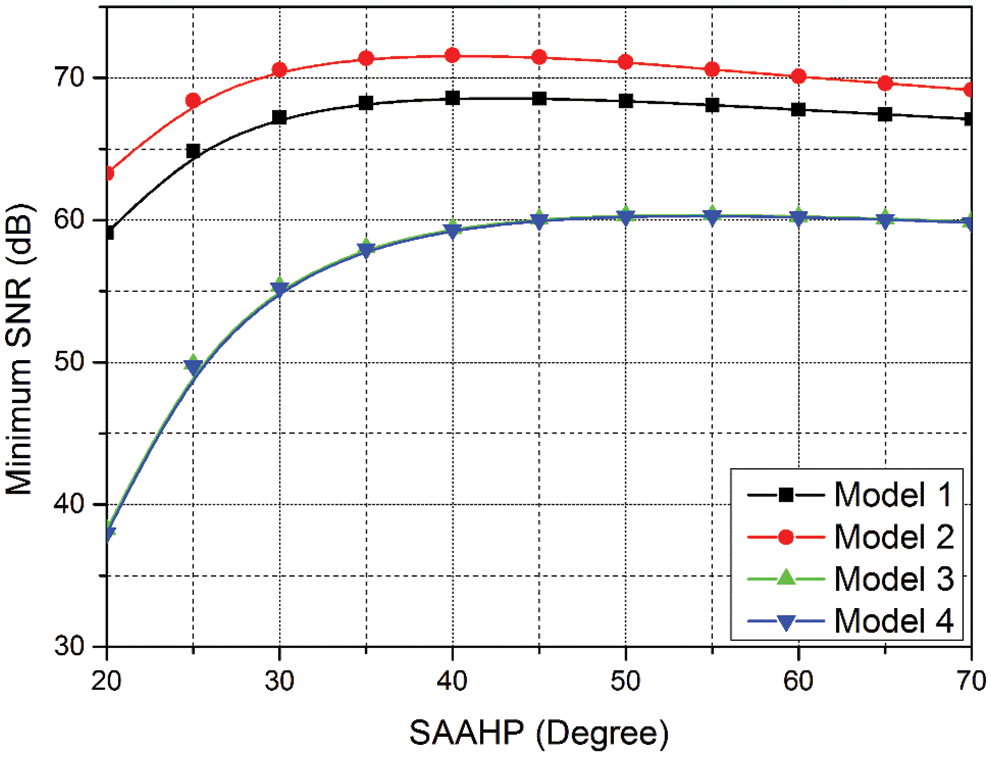
Figure 10: Minimum SNR vs. different SAAHP angles
Fig. 11 illustrates the BER performance of the aforementioned models by using OOK-NRZ modulation, in which BER levels of
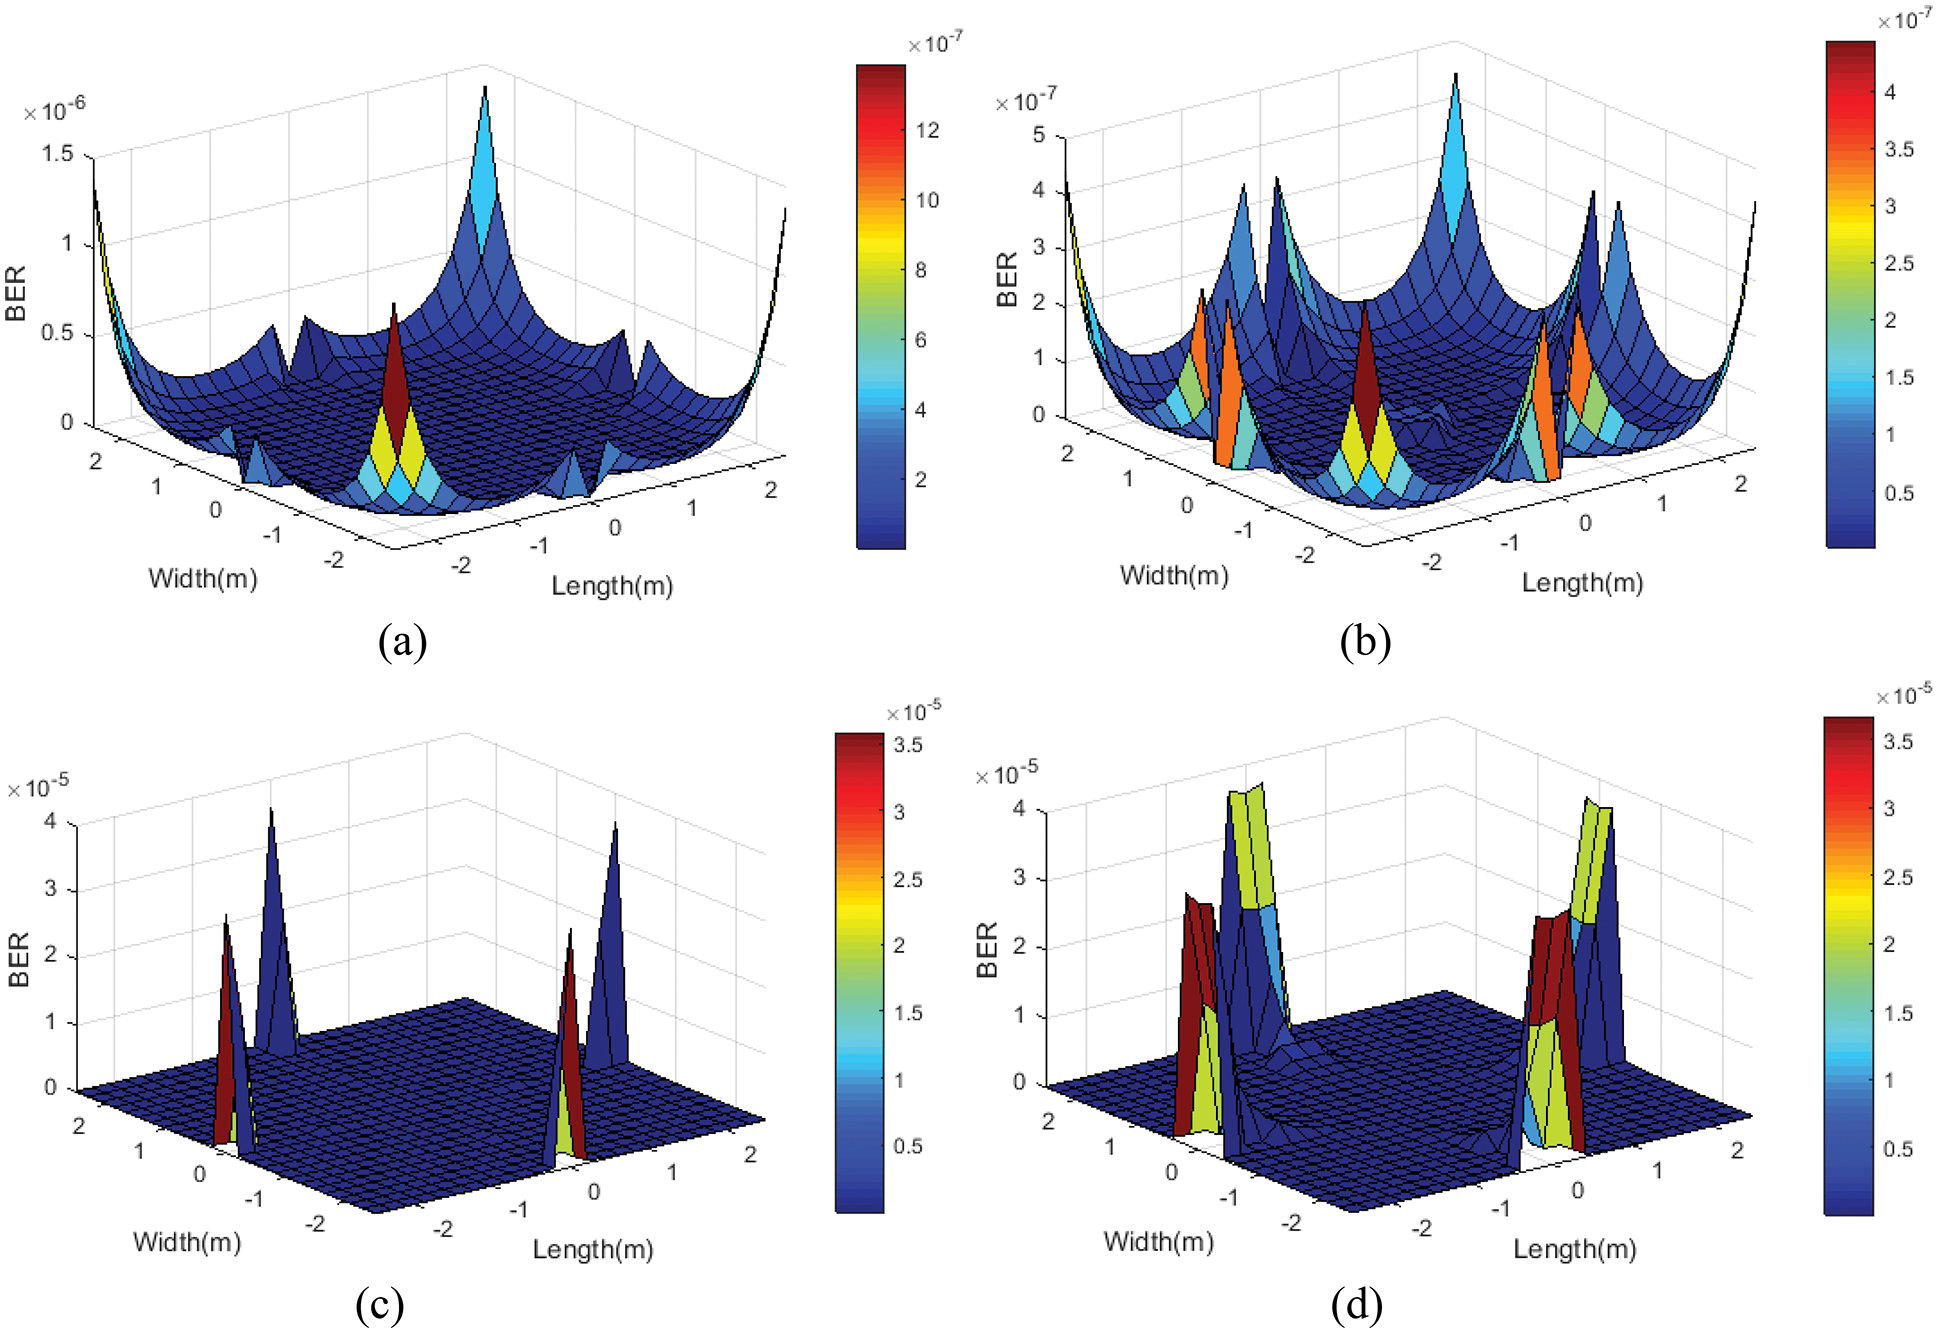
Figure 11: BER performance for OOK-NRZ (a) Model 1, (b) Model 2, (c) Model 3 and (d) Model 4
To further assess BER, the BPSK modulation technique was applied to explore potential performance improvements. Fig. 12 presents the BER of BPSK modulation. The BER levels of
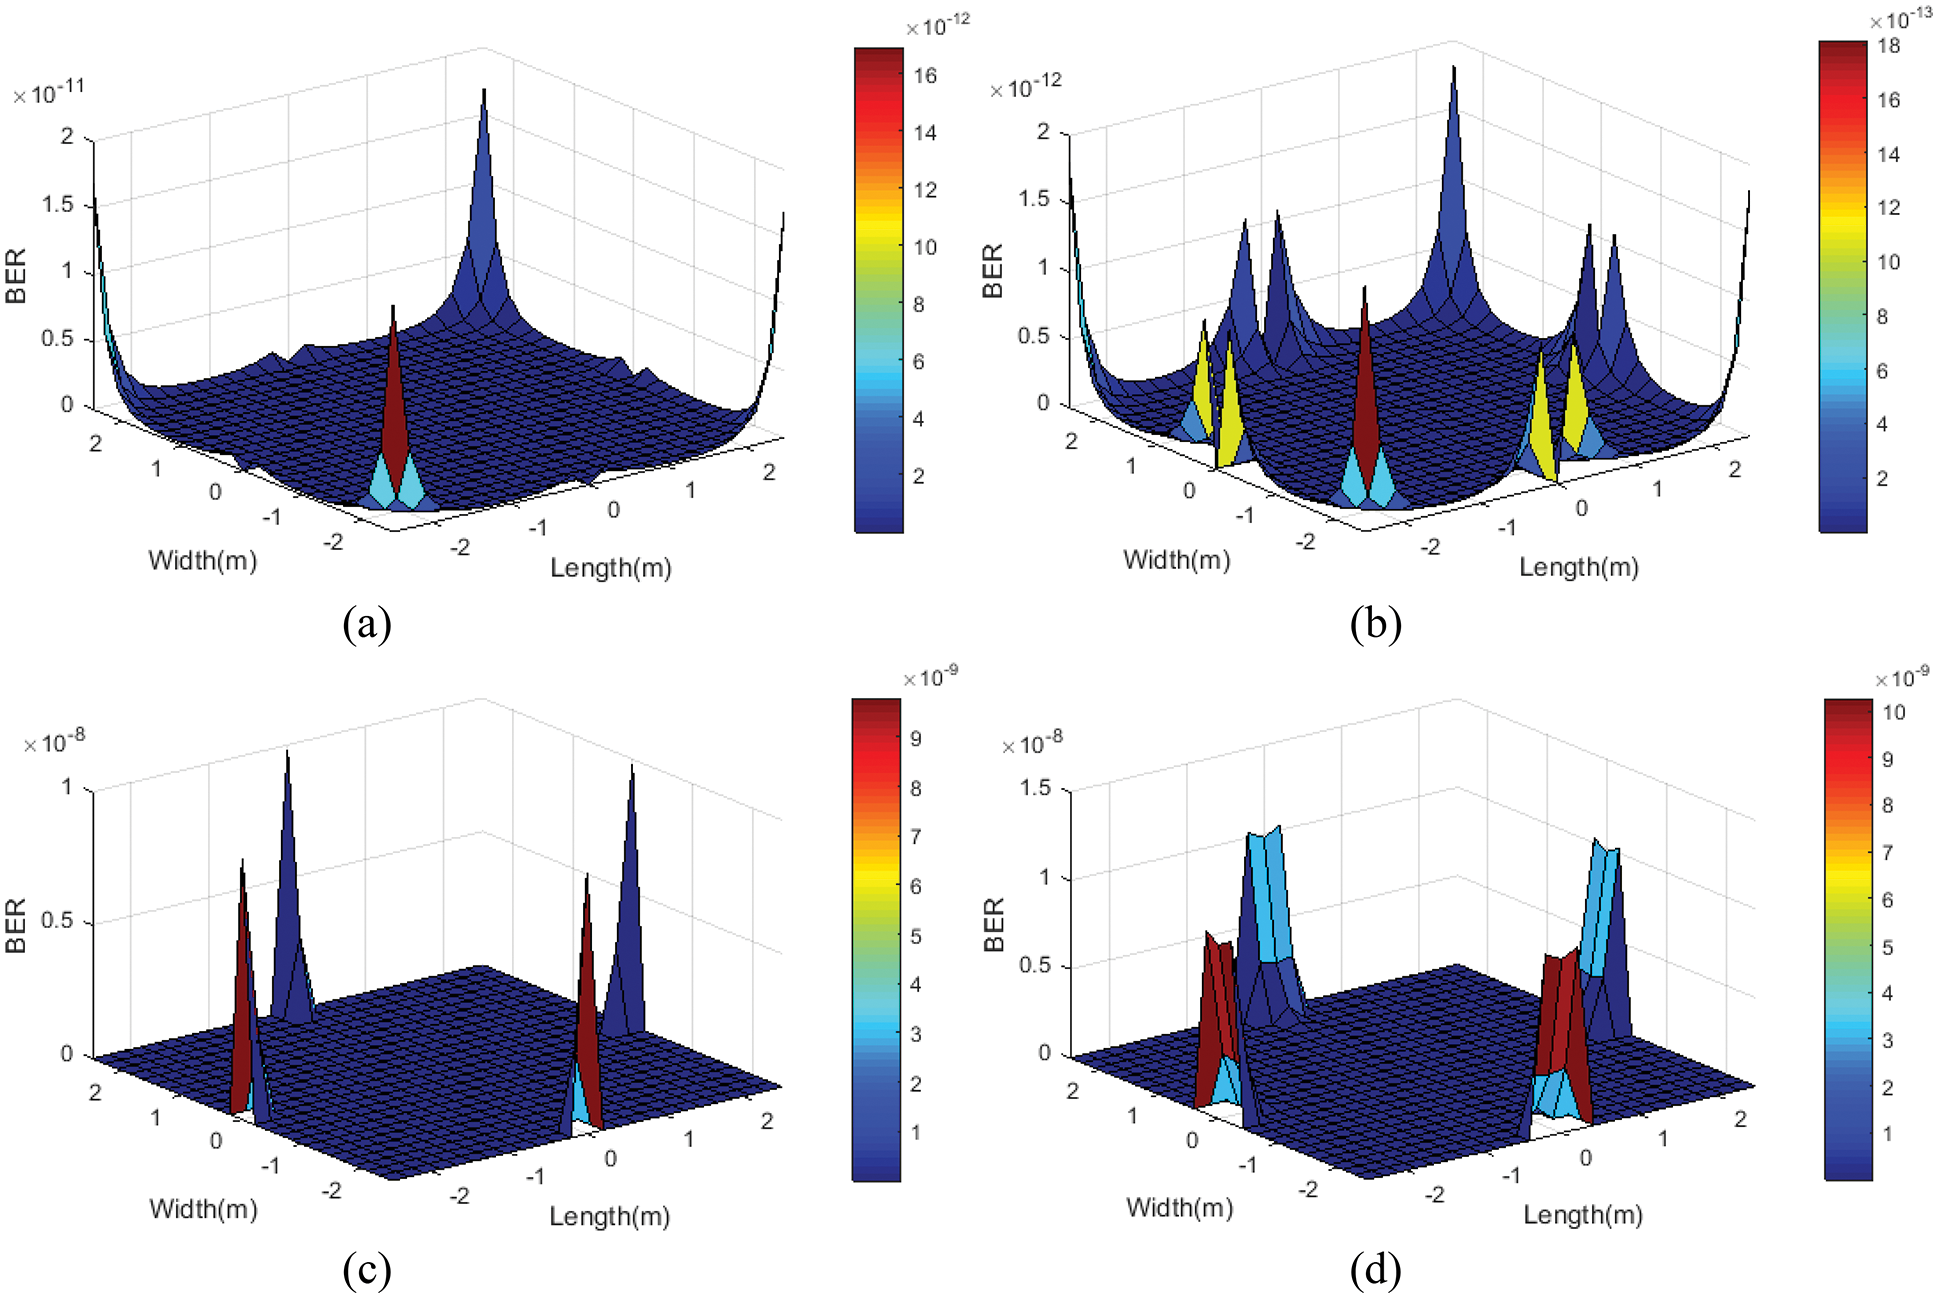
Figure 12: BPSK BER performance (a) Model 1, (b) Model 2, (c) Model 3 and (d) Model 4
The BER performance of all models based on OOK-NRZ and BPSK modulation techniques is summarized in Tab. 4.
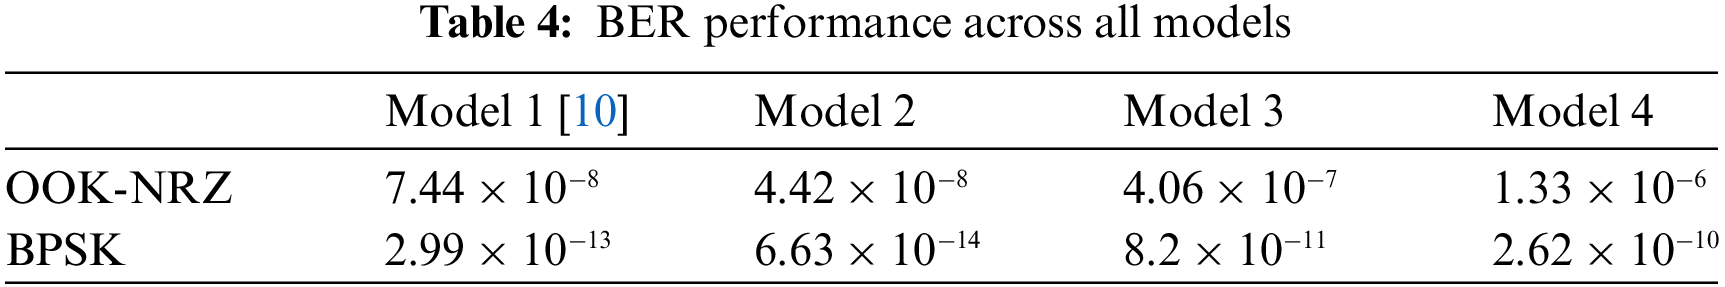
Fig. 13 illustrates the BER behavior over various SAAHP angles by utilizing OOK-NRZ and BPSK modulation techniques. Notably, smaller SAAHP angles resulted in higher BER levels and vice versa; signifying an inversely proportional relationship between the two elements. Next, the lowest BER levels were achieved with SAAHP values between 25° and 40°, which slightly increased with increment in SAAHP. The OOK-NRZ and BPSK achieved the lowest BER levels of
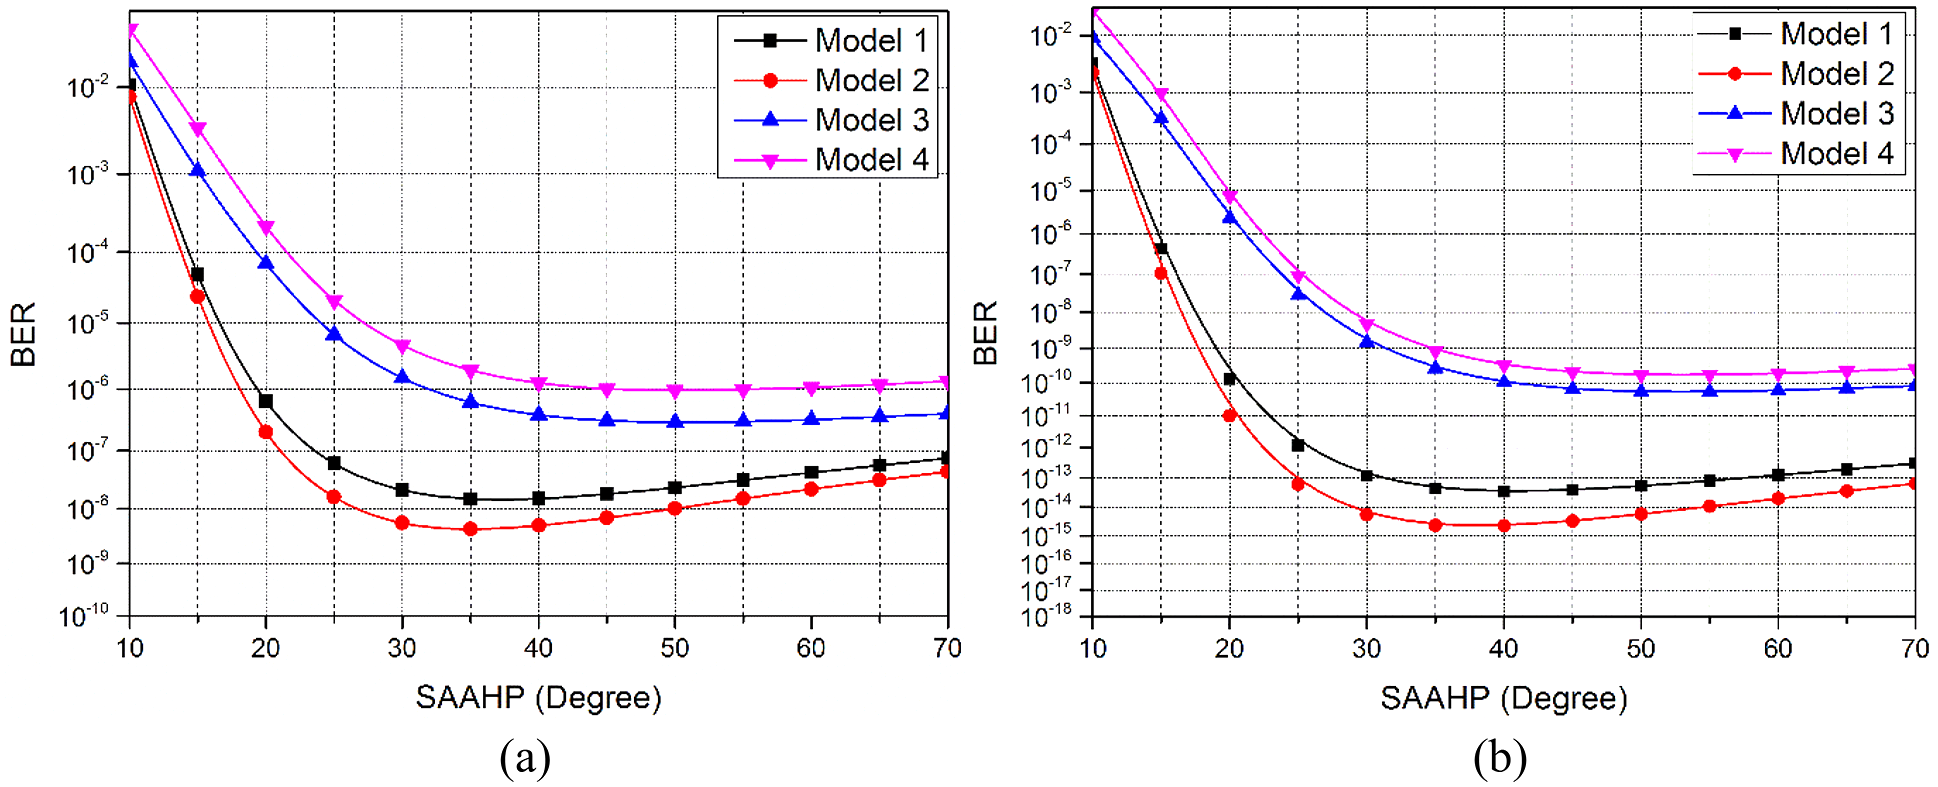
Figure 13: BER vs. different SAAHP angles (a) OOK-NRZ and (b) BPSK
5.5 Uniformity Distribution Analysis
Fig. 14 illustrates the uniformity of received power and SNR distribution in terms of CV, as well as the effect of various SAAHP angles on uniformity behavior. Referring to Fig. 13a, the CV values of 0.62, 0.45, 0.57, and 1.39 were obtained for Models 1, 2, 3, and 4, respectively. In addition, Fig. 13b shows the uniformity of SNR distribution with CV values of 0.045, 0.026, 0.028, and 0.043 for Models 1, 2, 3, and 4, respectively. Based on Fig. 13, it was observed that all models displayed improved received power and SNR uniformity as the SAAHP angles increased. In addition, Model 2 achieved the lowest CV values for received power and SNR, as well as better uniformity over other models.
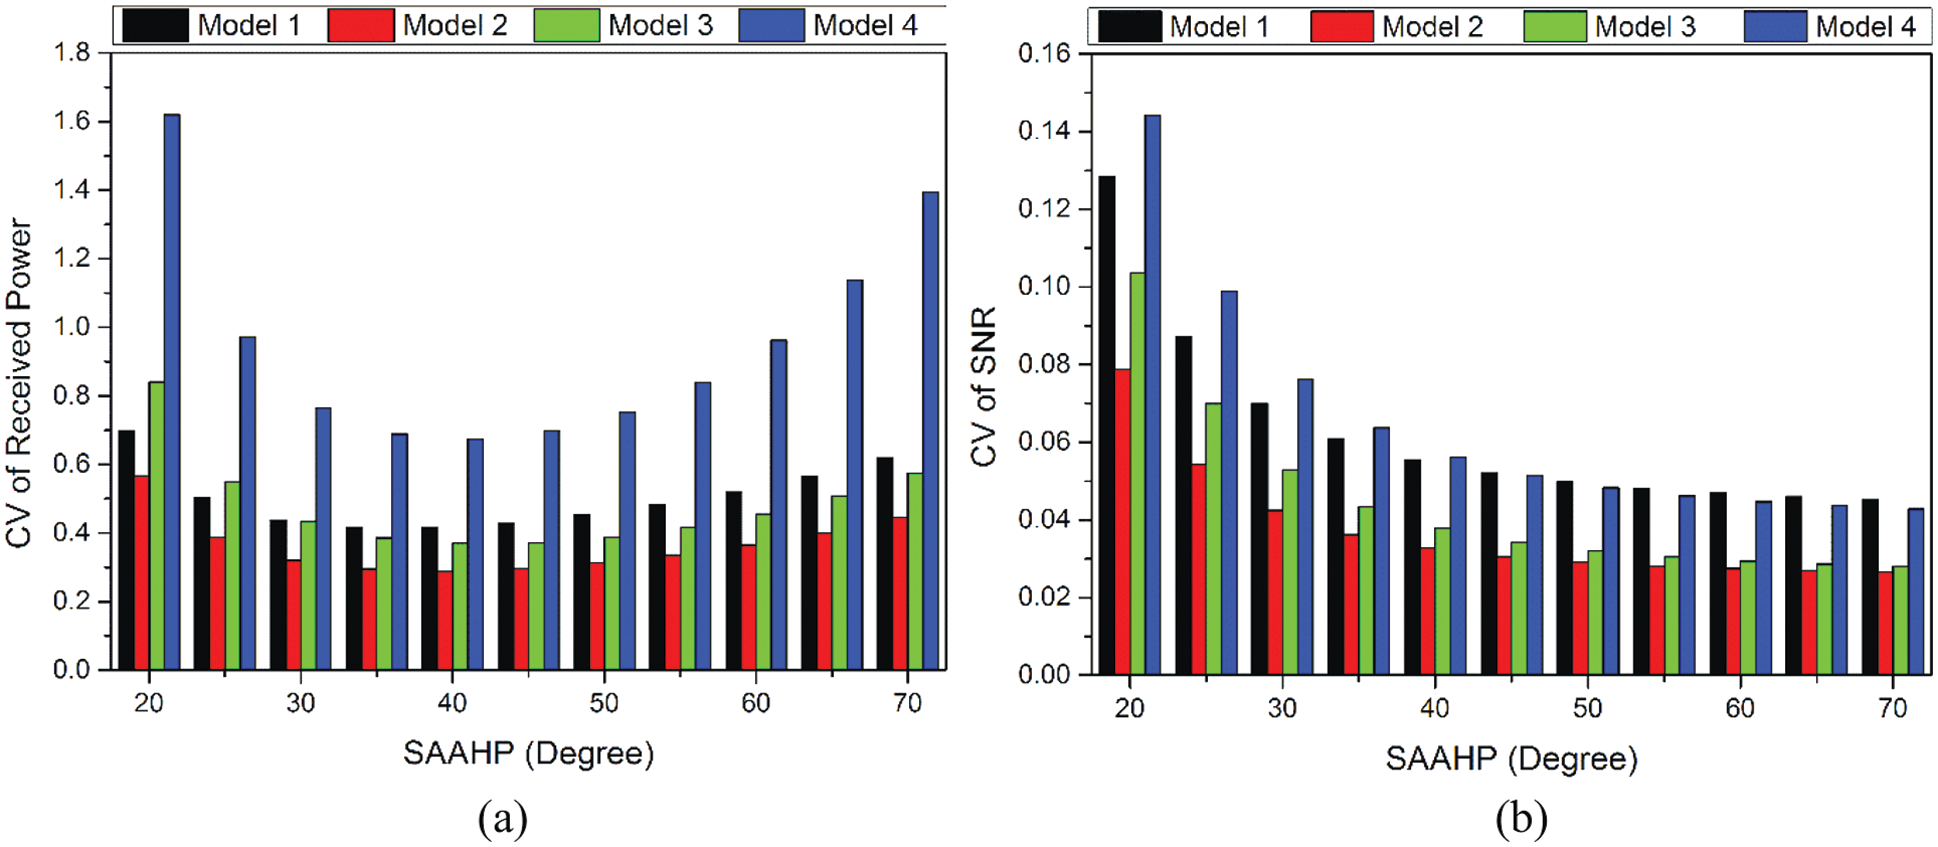
Figure 14: Uniformity distribution of (a) Received power and (b) SNR
Novel optical attocells positions were optimized in this study using a developed TE algorithm with mathematical formulation to enhance the VLC system for a typical room model. Several models were evaluated and the outcomes were compared in terms of received power, SNR, and uniform distribution (i.e., CV). In addition, OOK-NRZ and BPSK modulation techniques were deployed to improve the overall BER performance. Imminently, the optimization model proposed in this study displayed significant improvements in terms of the minimum received power by 80.23% and SNR improvements by 3.1% over the other existing models. Furthermore, the CV values of both received power and SNR were significantly improved by 27.42% and 42.22%, respectively. Besides, reduction of BER using various modulation techniques can successfully deliver reliable communication links especially with BER value below (
Acknowledgement: The authors acknowledge the funding of this project by the Research Management Centre (RMC), under the Professional Development Research University grant (UTM Vot No. 05E69), Universiti Teknologi Malaysia (UTM), Malaysia. This project was also funded by Universiti Teknologi Malaysia (UTM), under TDR grant Vot No.05G27.
Funding Statement: The manuscript APC is supported by the grant names “Professional Development Research University Grant (UTM Vot No. 05E69” and “TDR grant Vot No.05G27”).
Conflicts of Interest: The authors declare that they have no conflicts of interest to report regarding the present study.
References
1. S. H. Younus, A. A. Al-Hameed, A. T. Hussein, M. T. Alresheedi and J. M. H. Elmirghani, “Parallel data transmission in indoor visible light communication systems,” IEEE Access, vol. 7, pp. 1126–1138, 2019. [Google Scholar]
2. T. Barnett, S. Jain, U. Andra and T. Khurana, “Cisco visual networking index (VNI) complete forecast update, 2017–2022,” Cisco Systems, 2018. Available online: https://bit.ly/385BAhJ (Accessed on 10 Febraury2022). [Google Scholar]
3. S. H. Younus, A. A. Al-Hameed, A. T. Hussein, M. T. Alresheedi and J. M. H. Elmirghani, “Multi-branch transmitter for indoor visible light communication systems,” in 2020 22nd Int. Conf. on Transparent Optical Networks (ICTON), Bari, Italy, pp. 1–6, 2020. [Google Scholar]
4. M. A. de Oliveira, E. S. Lima, M. S. P. Cunha, M. Abreu and A. C. S. Jr, “RGB-based VLC system using 5G NR standard,” Optics Communications, vol. 481, no. July 2020, pp. 126542, Feb. 2021. [Google Scholar]
5. S. Arai, M. Kinoshita and T. Yamazato, “Optical wireless communication: A candidate 6G technology?,” IEICE Transactions on Fundamentals of Electronics, Communications and Computer Sciences, vol. E104.A, no. 1, pp. 227–234, Jan. 2021. [Google Scholar]
6. H. Haas, L. Yin, C. Chen, S. Videv, D. Parol et al., “Introduction to indoor networking concepts and challenges in LiFi,” Journal of Optical Communications and Networking, vol. 12, no. 2, pp. A190–A203, 2020. [Google Scholar]
7. M. Najla, P. Mach, Z. Becvar, P. Chvojka and S. Zvanovec, “Efficient exploitation of radio frequency and visible light communication bands for D2D in mobile networks,” IEEE Access, vol. 7, pp. 168922–168933, 2019. [Google Scholar]
8. K. B. Letaief, W. Chen, Y. Shi, J. Zhang and Y. -J. A. Zhang, “The roadmap to 6G: AI empowered wireless networks,” IEEE Communications Magazine, vol. 57, no. 8, pp. 84–90, Aug. 2019. [Google Scholar]
9. S. Al-Ahmadi, O. Maraqa, M. Uysal and S. M. Sait, “Multi-user visible light communications: State-of-the-art and future directions,” IEEE Access, vol. 6, pp. 70555–70571, 2018. [Google Scholar]
10. M. S. M. Gismalla, M. F. L. Abdullah, B. Das, W. A. Mabrouk and N. E. Mahfouz, “Design of an optical attocells configuration for an indoor visible light communications system,” AEU-International Journal of Electronics and Communications, vol. 112, pp. 152946, Dec. 2019. [Google Scholar]
11. M. S. M. Gismalla and M. F. L. Abdullah, “Optimization of received power and SNR for an indoor attocells network in visible light communication,” Journal of Communications, vol. 14, no. 1, pp. 64–69, 2019. [Google Scholar]
12. X. Zhang, W. Zhang, W. Sun, H. Wu, A. Song et al., “A real-time cutting model based on finite element and order reduction,” Computer Systems Science and Engineering, vol. 43, no. 1, pp. 1–15, 2022. [Google Scholar]
13. X. Zhang, J. Zhou, W. Sun and S. K. Jha, “A lightweight CNN based on transfer learning for COVID-19 diagnosis,” CMC-Computers, Materials & Continua, vol. 72, no. 1, pp. 1123–1137, 2022. [Google Scholar]
14. Z. Ghassemlooy, L. N. Alves, S. Zvanovec and M. -A. Khalighi, “Modulation schemes,” in Visible Light Communications: Theory and Applications, 1st ed., vol. 1. Boca Raton, USA: CRC Press, pp. 97–144, 2017. [Google Scholar]
15. T. Ganjian, G. Baghersalimi and Z. Ghassemlooy, “Performance evaluation of the received power based on the transmitter position in a visible light communications system,” in 2017 Iranian Conf. on Electrical Engineering (ICEE), Tehran, Iran, pp. 1763–1768, 2017. [Google Scholar]
16. X. Zhang, N. Zhao, F. Al-Turjman, M. B. Khan and X. Yang, “An optimization of the signal-to-noise ratio distribution of an indoor visible light communication system based on the conventional layout model,” Sustainability, vol. 12, no. 21, pp. 9006, Oct. 2020. [Google Scholar]
17. N. Chaudhary, O. I. Younus, L. N. Alves, Z. Ghassemlooy, S. Zvanove et al., “An indoor visible light positioning system using tilted LEDs with high accuracy,” Sensors (Switzerland), vol. 21, no. 3, pp. 1–16, 2021. [Google Scholar]
18. X. Li, R. Zhang and L. Hanzo, “Optimization of visible-light optical wireless systems: Network-centric versus user-centric designs,” IEEE Communications Surveys & Tutorials, vol. 20, no. 3, pp. 1878–1904, 2018. [Google Scholar]
19. M. S. M. Gismalla, M. F. L. Abdullah, M. I. Niass, B. Das and W. A. Mabrouk, “Improve uniformity for an indoor visible light communication system,” International Journal of Communication Systems, vol. 33, no. 8, pp. e4349, 2020. [Google Scholar]
20. N. Chi, Y. Zhou, Y. Wei and F. Hu, “Visible light communication in 6G: Advances, challenges, and prospects,” IEEE Vehicular Technology Magazine, vol. 15, no. 4, pp. 93–102, Dec. 2020. [Google Scholar]
21. A. Singh, G. Ghatak, A. Srivastava, V. A. Bohara and A. K. Jagadeesan, “Performance analysis of indoor communication system using off-the-shelf LEDs with human blockages,” IEEE Open Journal of the Communications Society, vol. 2, pp. 187–198, 2021. [Google Scholar]
22. H. Haas, J. Elmirghani and I. White, “Optical wireless communication,” Philosophical Transactions of the Royal Society A, Mathematical, Physical, and Engineering Sciences, vol. 378, no. 2169, pp. 20200051, Apr. 2020. [Google Scholar]
23. Z. Ghassemlooy, W. Popoola and S. Rajbhandari, “Visible light communications,” in Optical Wireless Communications: System and Channel Modelling with Matlab®, 2nd ed., vol. 1. Boca Raton, USA: CRC Press, pp. 443–494, 2019. [Google Scholar]
24. N. E. Mahfouz, H. A. Fayed, A. Abd El Aziz and M. H. Aly, “Improved light uniformity and SNR employing new LED distribution pattern for indoor applications in VLC system,” Optical and Quantum Electronics, vol. 50, no. 9, pp. 350, 2018. [Google Scholar]
25. A. M. Vegni and M. Biagi, “Optimal LED placement in indoor VLC networks,” Optics Express, vol. 27, no. 6, pp. 8504, 2019. [Google Scholar]
26. M. T. Niaz, F. Imdad, S. Kim and H. S. Kim, “Deployment methods of visible light communication lights for energy efficient buildings,” Optical Engineering, vol. 55, no. 10, pp. 106113, Oct. 2016. [Google Scholar]
27. M. S. M. Gismalla, M. F. L. Abdullah, M. S. Ahmed, W. A. Mabrouk, N. ALF Najib et al., “Design and analysis of different optical attocells deployment models for indoor visible light communication system,” International Journal of Integrated Engineering, vol. 13, no. 6, pp. 253–264, 2021. [Google Scholar]
28. R. Raj, S. Jaiswal and A. Dixit, “On the effect of multipath reflections in indoor visible light communication links: Channel characterization and BER analysis,” IEEE Access, vol. 8, pp. 190620–190636, 2020. [Google Scholar]
29. J. Li, X. Bao, W. Zhang and N. Bao, “QoE probability coverage model of indoor visible light communication network,” IEEE Access, vol. 8, no. Cic, pp. 45390–45399, 2020. [Google Scholar]
30. J. Xu, C. Gong, J. Luo and Z. Xu, “LED half-power angle optimization for ultra-dense indoor visible light communication network deployment,” IEEE Open Journal of the Communications Society, vol. 1, no. July, pp. 835–848, 2020. [Google Scholar]
31. H. Liu, Z. Lin, Y. Xu, Y. Chen and X. Pu, “Coverage uniformity with improved genetic simulated annealing algorithm for indoor visible light communications,” Optics Communications, vol. 439, no. January, pp. 156–163, 2019. [Google Scholar]
32. W. Jiaan, X. Ancheng, J. Jintao and G. Linyang, “Optimization lighting layout of indoor visible light communication system based on improved artificial fish swarm algorithm,” Journal of Optics, vol. 22, no. 3, pp. 035701, Mar. 2020. [Google Scholar]
33. Y. Yang, Z. Zhu, C. Guo and C. Feng, “Power efficient LED placement algorithm for indoor visible light communication,” Optics Express, vol. 28, no. 24, pp. 36389–36402, 2020. [Google Scholar]
34. J. Feng, C. Yang, J. Hou, H. Long and S. Chen, “Performance enhancement for indoor visible light communication system with an improved inter-symbol interference model using optimized hemispherical optical-angle-diversity-receivers,” Optics Communications, vol. 454, no. September 2019, pp. 124488, 2020. [Google Scholar]
35. V. Dixit and A. Kumar, “Performance analysis of non-line of sight visible light communication systems,” Optics Communications, vol. 459, no. September 2019, pp. 125008, 2020. [Google Scholar]
36. M. Obeed, A. M. Salhab, M. S. Alouini and S. A. Zummo, “On optimizing VLC networks for downlink multi-user transmission: A survey,” IEEE Communications Surveys & Tutorials, vol. 21, no. 3, pp. 2947–2976, 2019. [Google Scholar]
Cite This Article
 Copyright © 2023 The Author(s). Published by Tech Science Press.
This work is licensed under a Creative Commons Attribution 4.0 International License , which permits unrestricted use, distribution, and reproduction in any medium, provided the original work is properly cited.
 Downloads
 Citation Tools