
 Submit a Paper
 Propose a Special lssue
 Open Access
ARTICLE

Optimization of Coronavirus Pandemic Model Through Artificial Intelligence
1 Department of Mathematics, College of Sciences, King Khalid University, Abha, 61413, Saudi Arabia
2 Baqai Medical University, Karachi, 75340, Pakistan
3 Shalamar Medical and Dental College, Lahore, 54000, Pakistan
4 Department of Mathematics, Cankaya University, Balgat, Ankara, 06530, Turkey
5 Department of Medical Research, China Medical University, Taichung, 40402, Taiwan
6 Institute of Space Sciences, Magurele-Bucharest, 077125, Romania
7 Department of Mathematics, Govt. Maulana Zafar Ali Khan Graduate College Wazirabad, Punjab Higher Education Department (PHED), Lahore, 54000, Pakistan
8 Department of Mathematics, University of Gujrat, Gujrat, 52200, Pakistan
9 Department of Mathematics and Statistics, The University of Lahore, Lahore, 54590, Pakistan
10 Department of Mathematics, Faculty of Science and Technology, University of Central Punjab, Lahore, 54000, Pakistan
11 Department of Computer Science, University of Lahore, Lahore, 54590, Pakistan
12 Department of Mathematics and Statistics, College of Science, Taif University, P. O. Box, 11099, Taif, 21944, Saudi Arabia
* Corresponding Author: Tahir Nawaz Cheema. Email:
Computers, Materials & Continua 2023, 74(3), 6807-6822. https://doi.org/10.32604/cmc.2023.033283
Received 13 June 2022; Accepted 23 September 2022; Issue published 28 December 2022
 View Full Text
 Download PDF
Abstract
Artificial intelligence is demonstrated by machines, unlike the natural intelligence displayed by animals, including humans. Artificial intelligence research has been defined as the field of study of intelligent agents, which refers to any system that perceives its environment and takes actions that maximize its chance of achieving its goals. The techniques of intelligent computing solve many applications of mathematical modeling. The research work was designed via a particular method of artificial neural networks to solve the mathematical model of coronavirus. The representation of the mathematical model is made via systems of nonlinear ordinary differential equations. These differential equations are established by collecting the susceptible, the exposed, the symptomatic, super spreaders, infection with asymptomatic, hospitalized, recovery, and fatality classes. The generation of the coronavirus model’s dataset is exploited by the strength of the explicit Runge Kutta method for different countries like India, Pakistan, Italy, and many more. The generated dataset is approximately used for training, validation, and testing processes for each cyclic update in Bayesian Regularization Backpropagation for the numerical treatment of the dynamics of the desired model. The performance and effectiveness of the designed methodology are checked through mean squared error, error histograms, numerical solutions, absolute error, and regression analysis.Keywords
The Chinese government declared the agent virus on 1st January 2020 [1]. The critical source of spreaders of this dangerous disease is due to Bats, as discussed in [2,3]. The effect of the COVID-19 epidemic on human health is that it changes daily life routines [4]. Due to the significant problems of COVID-19, the governments of different countries are forced to think about this disease and make strict public policies to face created challenges to save their populations. The crown infection of 2019 is also known as crown infection of Wuhan because its presence is found first in Wuhan city of China, the capital of Hubei territory. It is observed that this is a transmitted infection and is considered a respiratory disease rapidly transmitted from one human being to another. The epidemic ofCOVID-19 spread in the whole world in a few months, and millions of people were hunted by this disease. According to the news agencies and World Health Organization (WHO), data collected up to 27th may 2021 in three countries, Pakistan, India, and Italy are given as, in Pakistan the total confirmed infected cases are 927000, recovered 85300, number of deaths is 21022, and fully vaccinated people are 1513144 which are 0.7% of the total population. In India, the total confirmed infected cases are 28.4 M, recovered 26.4 M, the number of deaths is 338 K, and fully vaccinated people are 42419560, 3.1% of the population. While in Italy, the total confirmed infected cases are 4.22 M, recovered 3.89 M, the number of deaths is 126 K, and fully vaccinated people are 11245499, 19.1% of the population. The past medical history of viruses tells us that the spreaders of different viruses are always due to some logical reasoning, and medical companies of the world can prepare medications in time for better treatment. The rate of spread of coronavirus is much high as compared to other viruses in human history. Furthermore, the source of transmission of this disease is humans to humans only [5]. First time in history, all industries and trade centers have been closed for a long time. The developed and developing countries’ economy is badly affected. In the first phase of the COVID-19 epidemic, the much-effected countries are China, the USA, Italy, Brazil, etc. But in the second and third phases, Asian countries like India, Iran, Pakistan, and many Arabian countries like Saudi Arabia, UAE, etc., are highly affected. The vaccination process has started worldwide and is expected to be reduced after some weeks. No doubt, this disease affects a large population of the world. However, many health organizations play a vital role in decreasing this disease and overcoming the difficulties of human beings. Meanwhile, the research community also takes an active part in helping world organizations by designing COVID-19 models to create awareness of the current situation about death rate, infected people, recovered people, and the ratio of spreading coronavirus in different areas of the world. These research techniques are necessary for solving future problems and planning coming issues. The mathematical models used by the research community for linear and nonlinear virus disease variations are studied in [6–10]. The well-known models on the strategy of the epidemic are studied in [11–32]. The model considered for the study is presented in [33]. Many countries like Germany, the USA, Spain, and Italy are affected due to this disease [34], and their governments try to overthrow the virus by imposing social distancing. Infectious diseases have significant effects the health as well as finance [35]. Learning the dynamic forces of disease transmission is very important with the help of mathematical tools [36], the prospect of guessing many real-world time sequences in various fields like economics [37], business, and the environment. The mathematical model is also helpful in predicting the spread of diseases and thus supports the governments being organized and making the necessary decisions [38]. The paper’s strategy is as follows: Section 2 goes to innovation work. Section 3 goes to mathematical modeling of coronavirus. Section 4 goes to numerical results via MATLAB and graphical illustration of each compartment; the Last section goes to a conclusion.
The innovative contributions of the study introduced here for Bayesian-regularization backpropagation artificial neural networks applied on COVID-19 models are emphasized below.
• A revolutionary scheme on the base of the two-layers design of the Bayesian-regularization backpropagation artificial neural networks (BRANNs) is described to investigate the dynamics of the COVID-19 model that are expressed with a system of eight ordinary differential equations corresponding to the initial value problems.
• The analysis of the results obtained computationally is performed effectively by the mean square error (MSE) index to structure a merit function for the design of Bayesian-regularization backpropagation by considering the reference solutions of eight classes established on the model for the COVID-19 pandemic by using artificial neural network techniques.
• Bayesian-regularization backpropagation is utilized to execute validation, testing processes, and training to get the decision variables tuned for artificial neural network techniques for incrementing epoch index each. To satisfy the target, we have considered a model of eight complex classes that is established on the Susceptible (Scov), the Exposed (Gcov), the Symptomatic and Infectious (Mcov), the Super Propagation (Pcov), the Infection but the Asymptomatic (Lcov), the Hospitalized (Hcov), the Recovery (Rcov) and the Fatality (Fcov) classes.
In our investigation, we use the proposed model, which consists of eight classes the susceptible (S), the exposed (G), the symptomatic and infectious (M), the super spreaders (P), the infection but asymptomatic (L), the hospitalized (H), the recovery (R) and fatality (F) classes, for numerical investigations. The graphical description of the model is in Fig. 1.
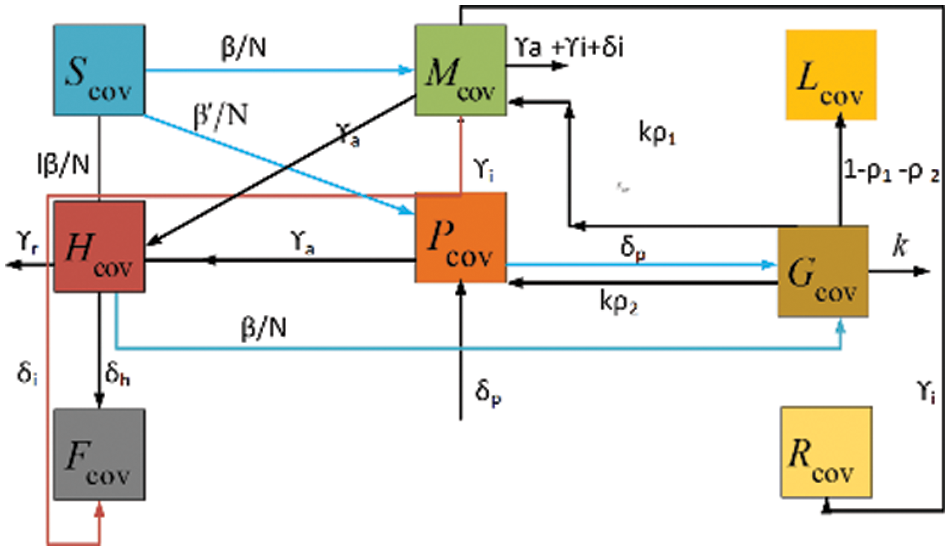
Figure 1: Flow chart of COVID-19 of eight classes
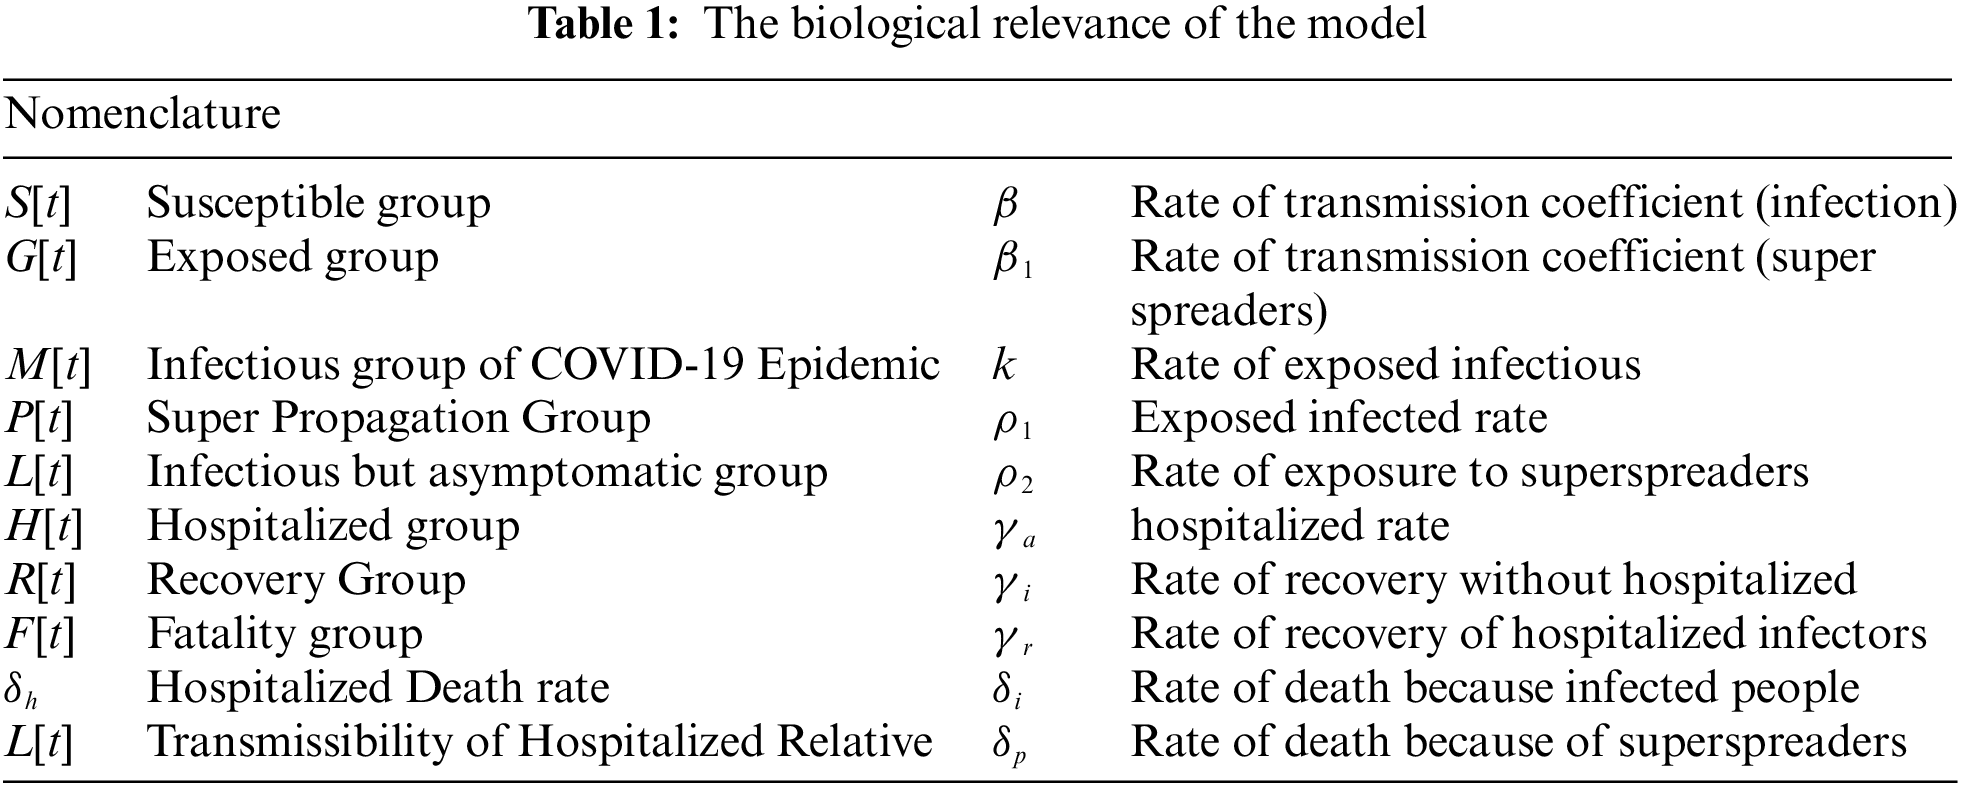
The general mathematical description of the model that explains the relations of all classes with the included parameters is defined as a set of the system (1–2). The physical relevance of the model is presented in Table 1.
The system of differential equations is as follows:
This section describes the necessary information about the proposed modeling mathematically with the help of a performance matrix—modeling of applied mathematics dependent upon the three steps. In step one, the COVID-19 model is established for three-word countries geographically located in Europe and Asia; such type of investigation is known as the input reference dataset. On the other hand, the step neural network layer structure and the training we take into account models. Bayesian-regularization backpropagation artificial neural networks (BRANNs) are performed in step third with a Bayesian-regularization solver.
Let us suppose the dynamical system for differential equations describing the COVID-19 model for India.
Let us suppose the dynamical system for differential equations describing the COVID-19 model for Pakistan.
Let us suppose the dynamical system for the differential equations describing the COVID-19 model for Italy
The expression for predictor step-2 formula for the case for 1st equation of dataset is expressed by
When the step-2 correlation formula for the case for the 1st equation of the dataset is expressed in following
Consequently, the formulas for the predictive and accurate technique of the remaining equations are formulated in a set. The two-layer structure for Bayesian-regularization backpropagation artificial neural networks (BRANNs) models with ten hidden neurons layer. The Bayesian-regularization backpropagation artificial neural networks (BRANNs) built-in architecture is presented in Fig. 2.
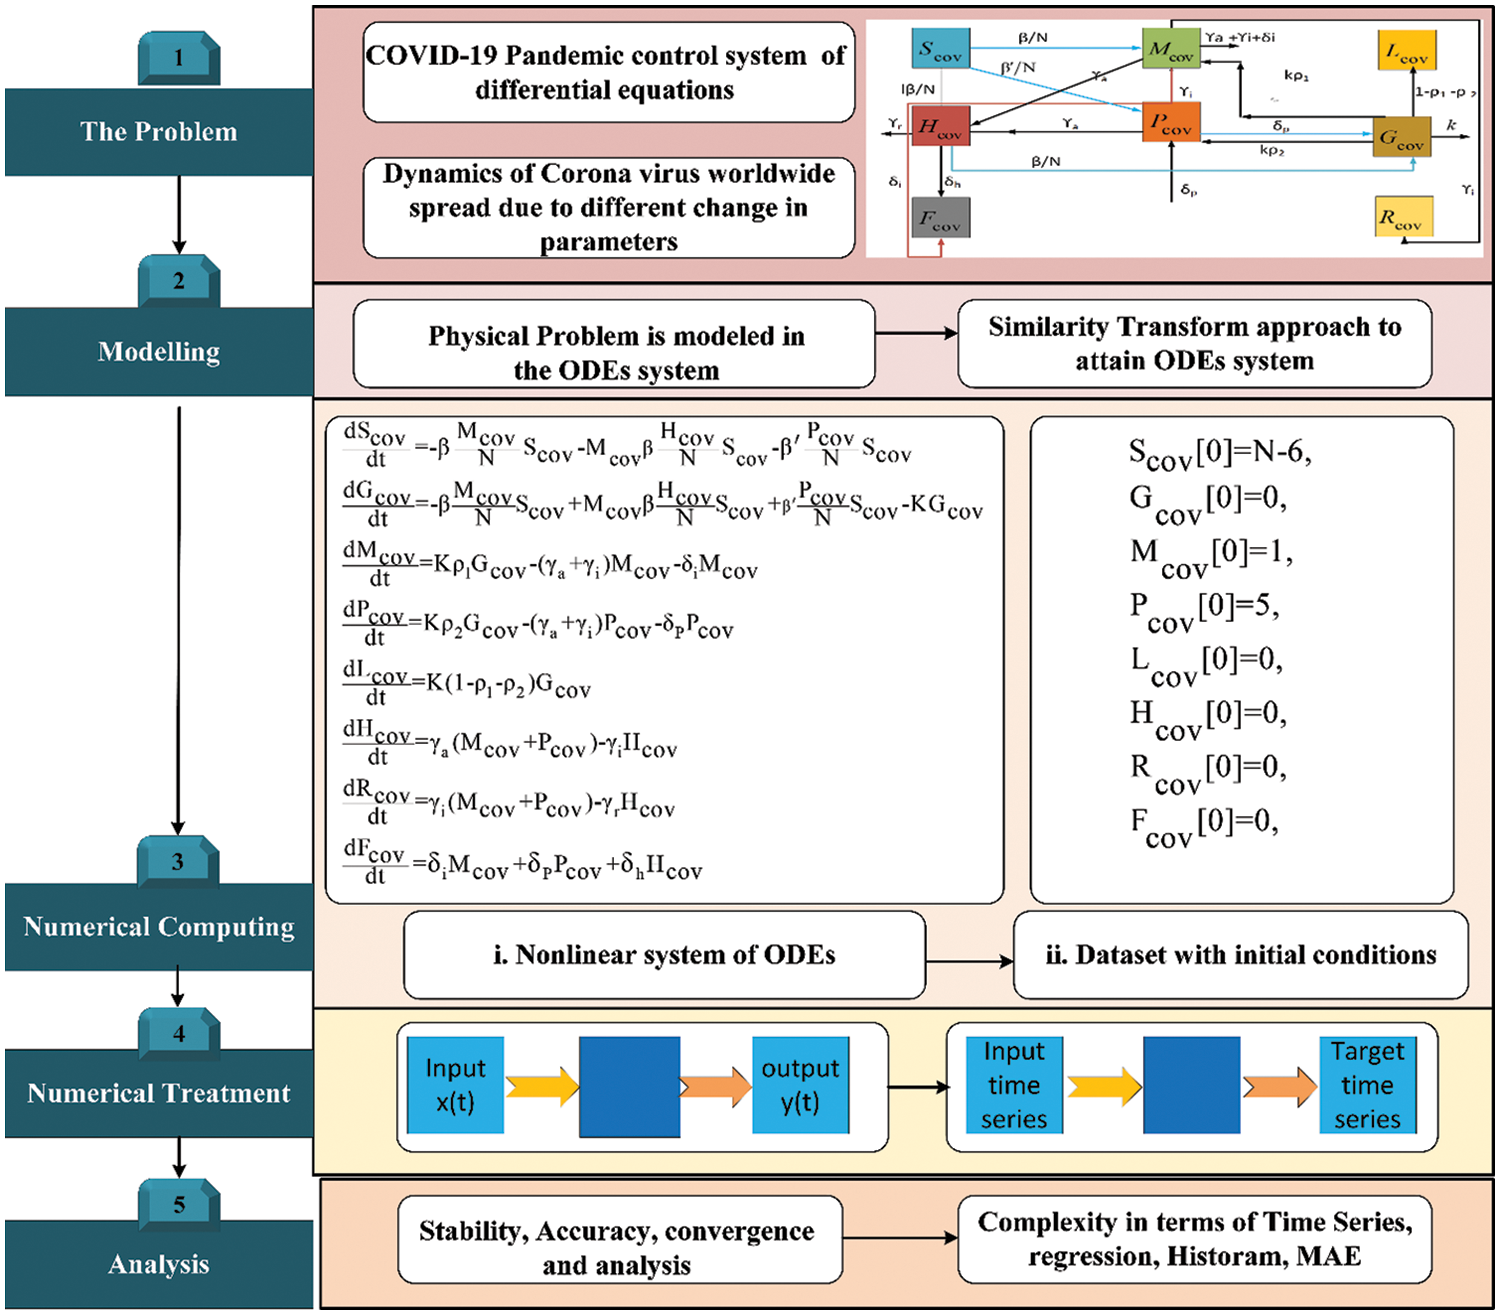
Figure 2: Procedure flow design of the proposed Bayesian-regularization backpropagation artificial neural networks (BRANNs) for solving the COVID-19 model
An error-based merit function is explained through the training of Bayesian-regularization backpropagation artificial neural networks (BRANNs) with the Levenberg-Marquardt method (LMM) and Bayesian Regulation (BR). The objective function is extracted from the metric of the objective function, and mean square error (MSE) is optimized with Bayesian-regularization backpropagation artificial neural networks (BRANNs) for all the cases inclusively corresponding to both Wuhan and Karachi cities. The mathematical performance matrix by merit data, absolute error (AE) that is, mean square error (MSE), and regression coefficient are listed underneath:
Here
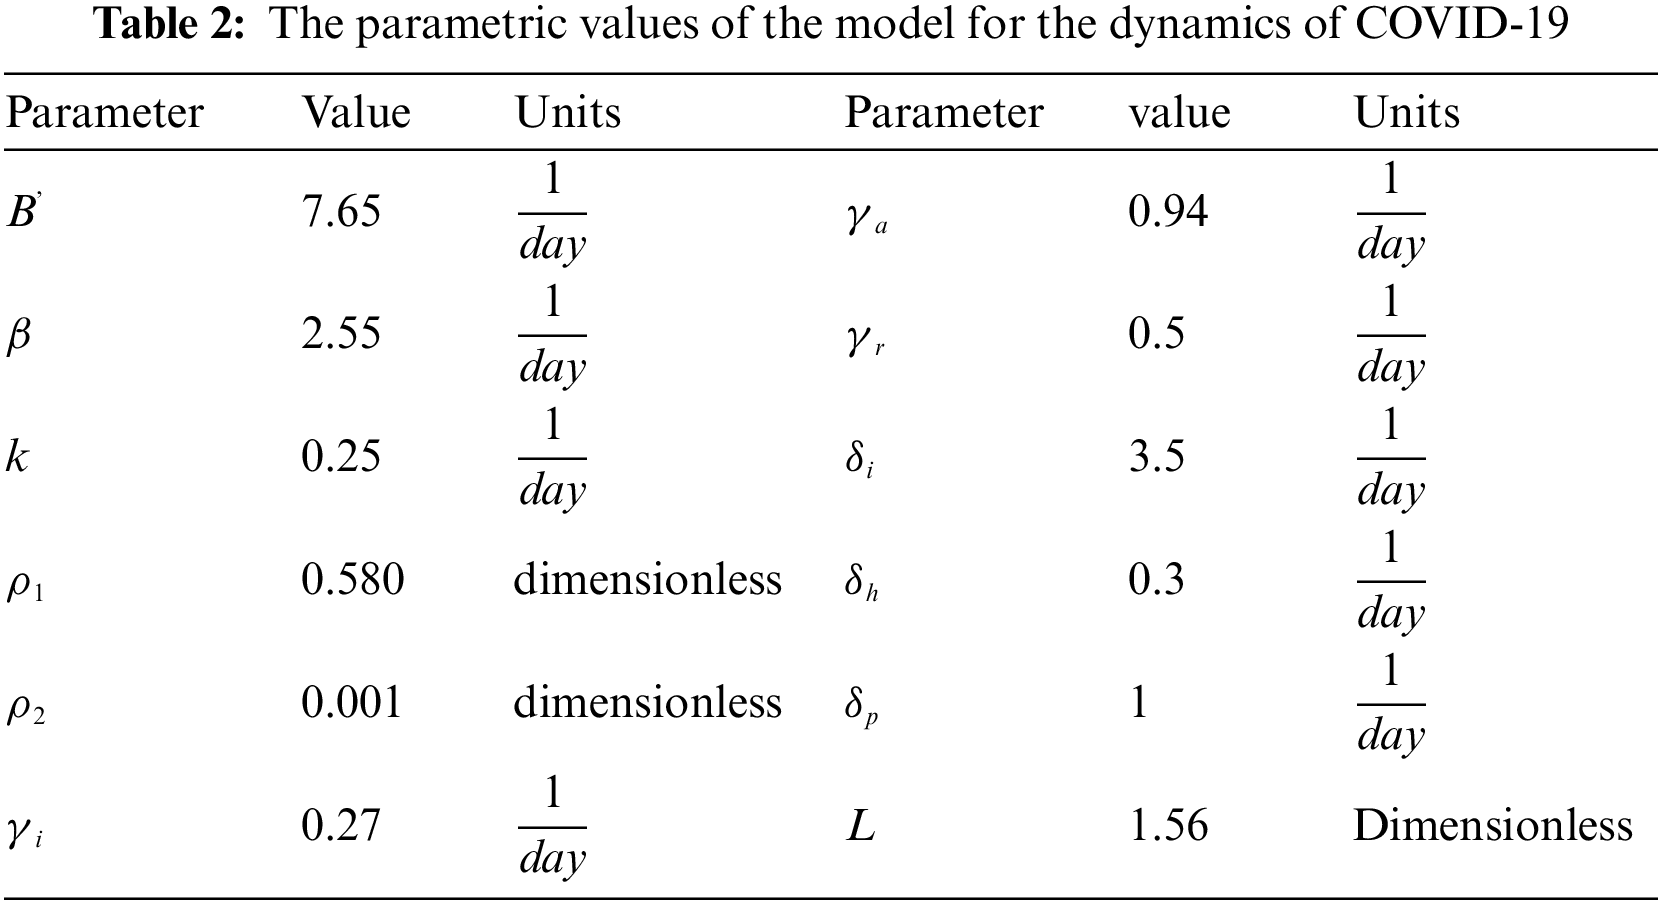
The synthetic study of numbers with the required specifications is presented here for the first-order nonlinear system in which the model of COVID-19 is solved by the proposed Bayesian-regularization backpropagation artificial neural networks (BRANNs) method. The pandemic model is represented. The parametric values of the model corresponding to the three countries are discussed in Table 2.
The plot of the training performance is described in Fig. 3. Network-trained functions provide 19 training values, and validation and test performances are presented graphically. As we can see, the train curves, test, and confirmation are almost identical in Fig. 3. This means it’s about to be the most delusional time of the year. If the test curves increase faster than the verification curves, then overfitting is likely. The value of Mu and gradient corresponding to the distance determines the slow or fast convergence rate, as shown in Fig. 4. When the validation check touches its maximum value at epoch 1000 with decent gradient value = 0.00412, 0.00258, and 0.00552, respectively, Mu = 500 for each value training stops. The convergence depends on the value of Mu and gradient. The error is a difference between target and output values in neural networks, represented as a histogram in Fig. 5.
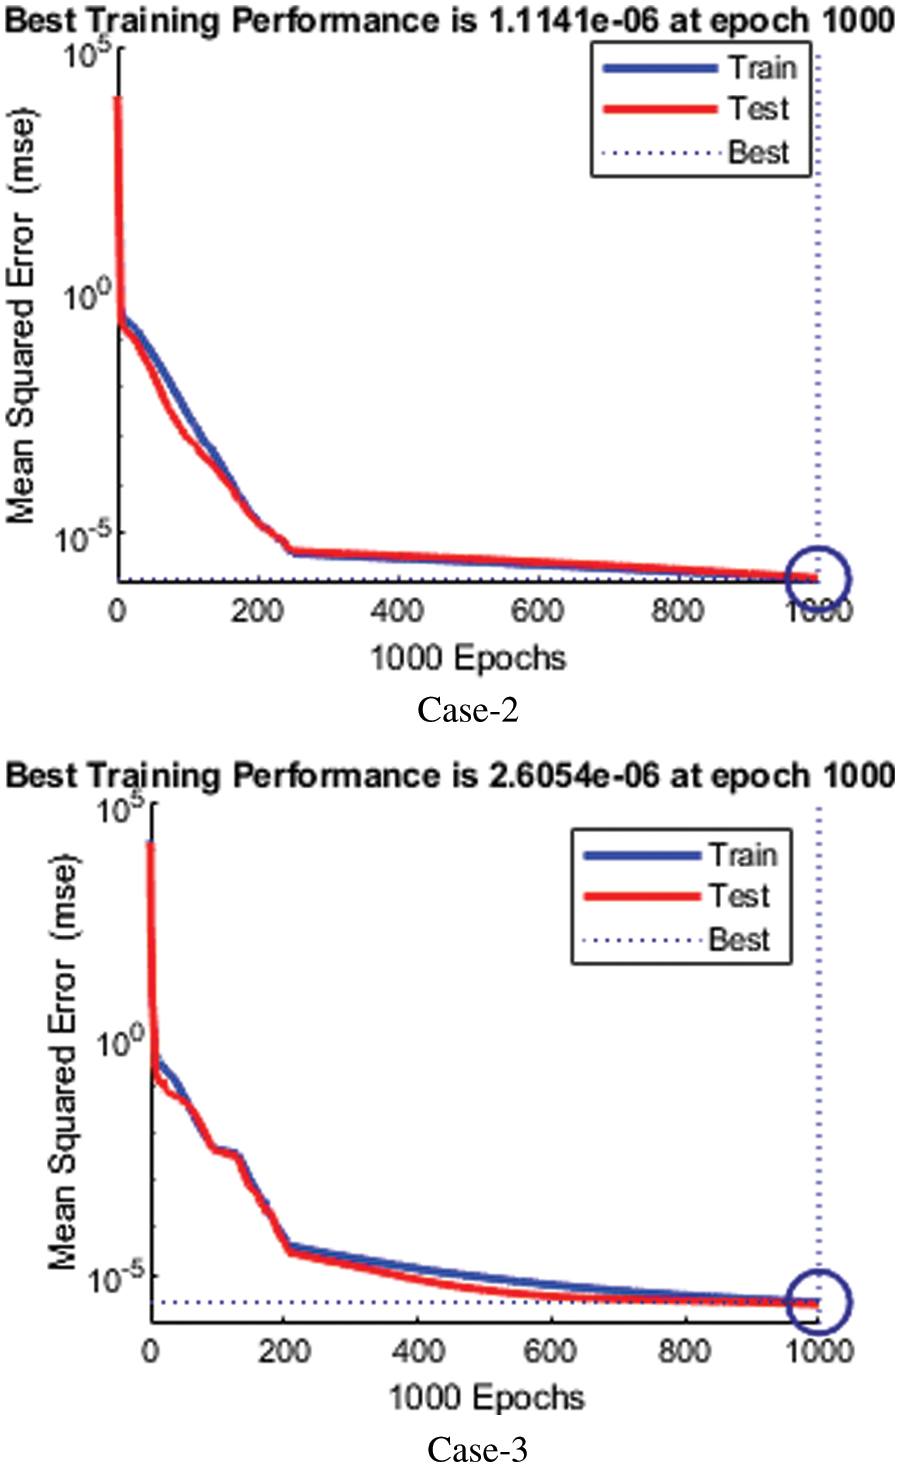
Figure 3: MSE of COVID-19 for cases 2–3
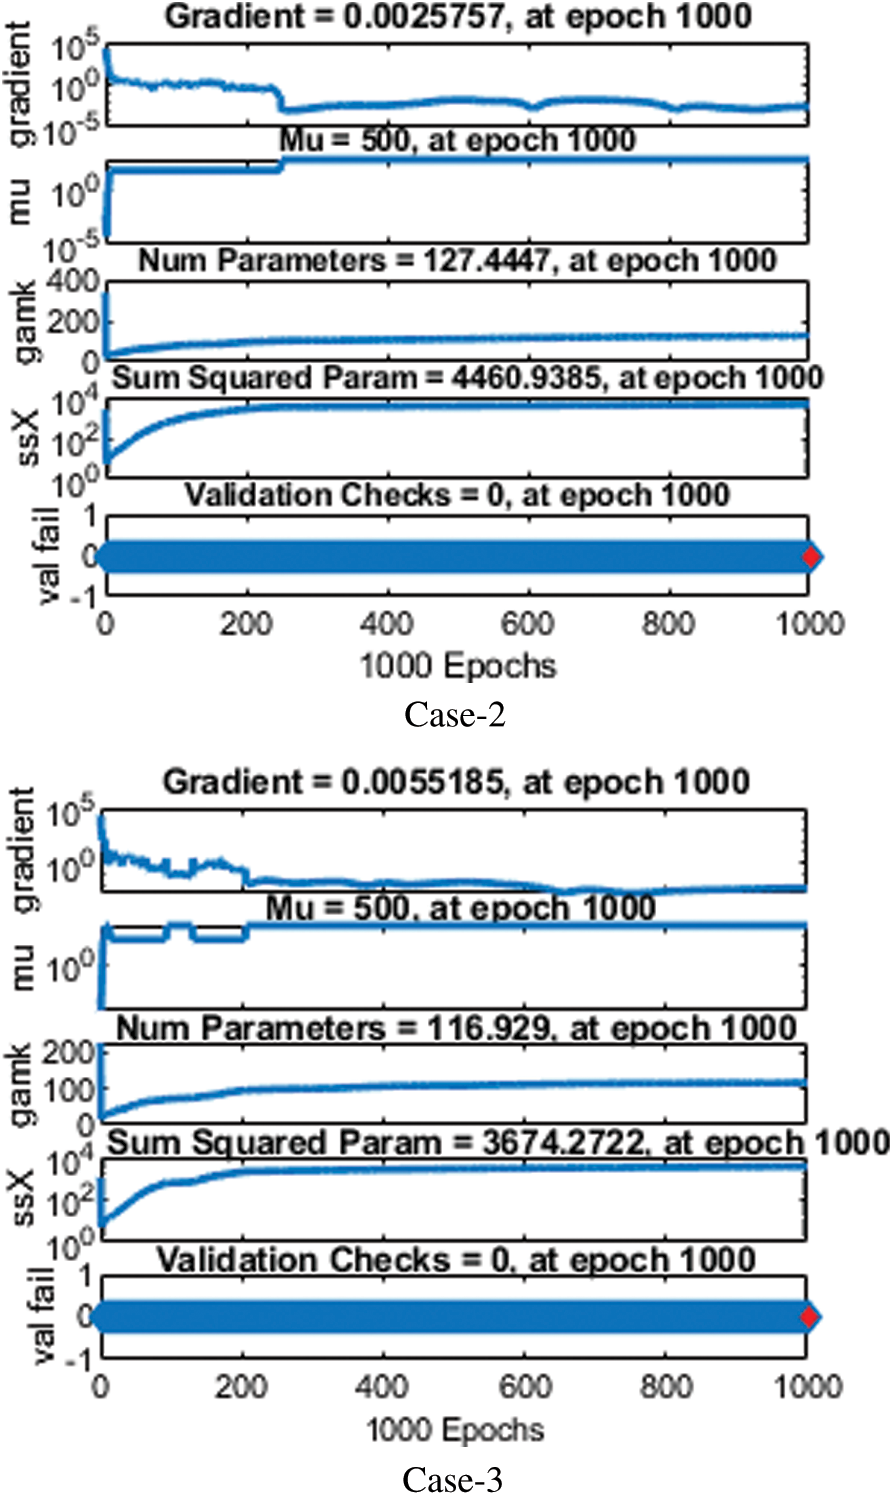
Figure 4: Analysis of state transition dynamics for different values of N for cases 2–3
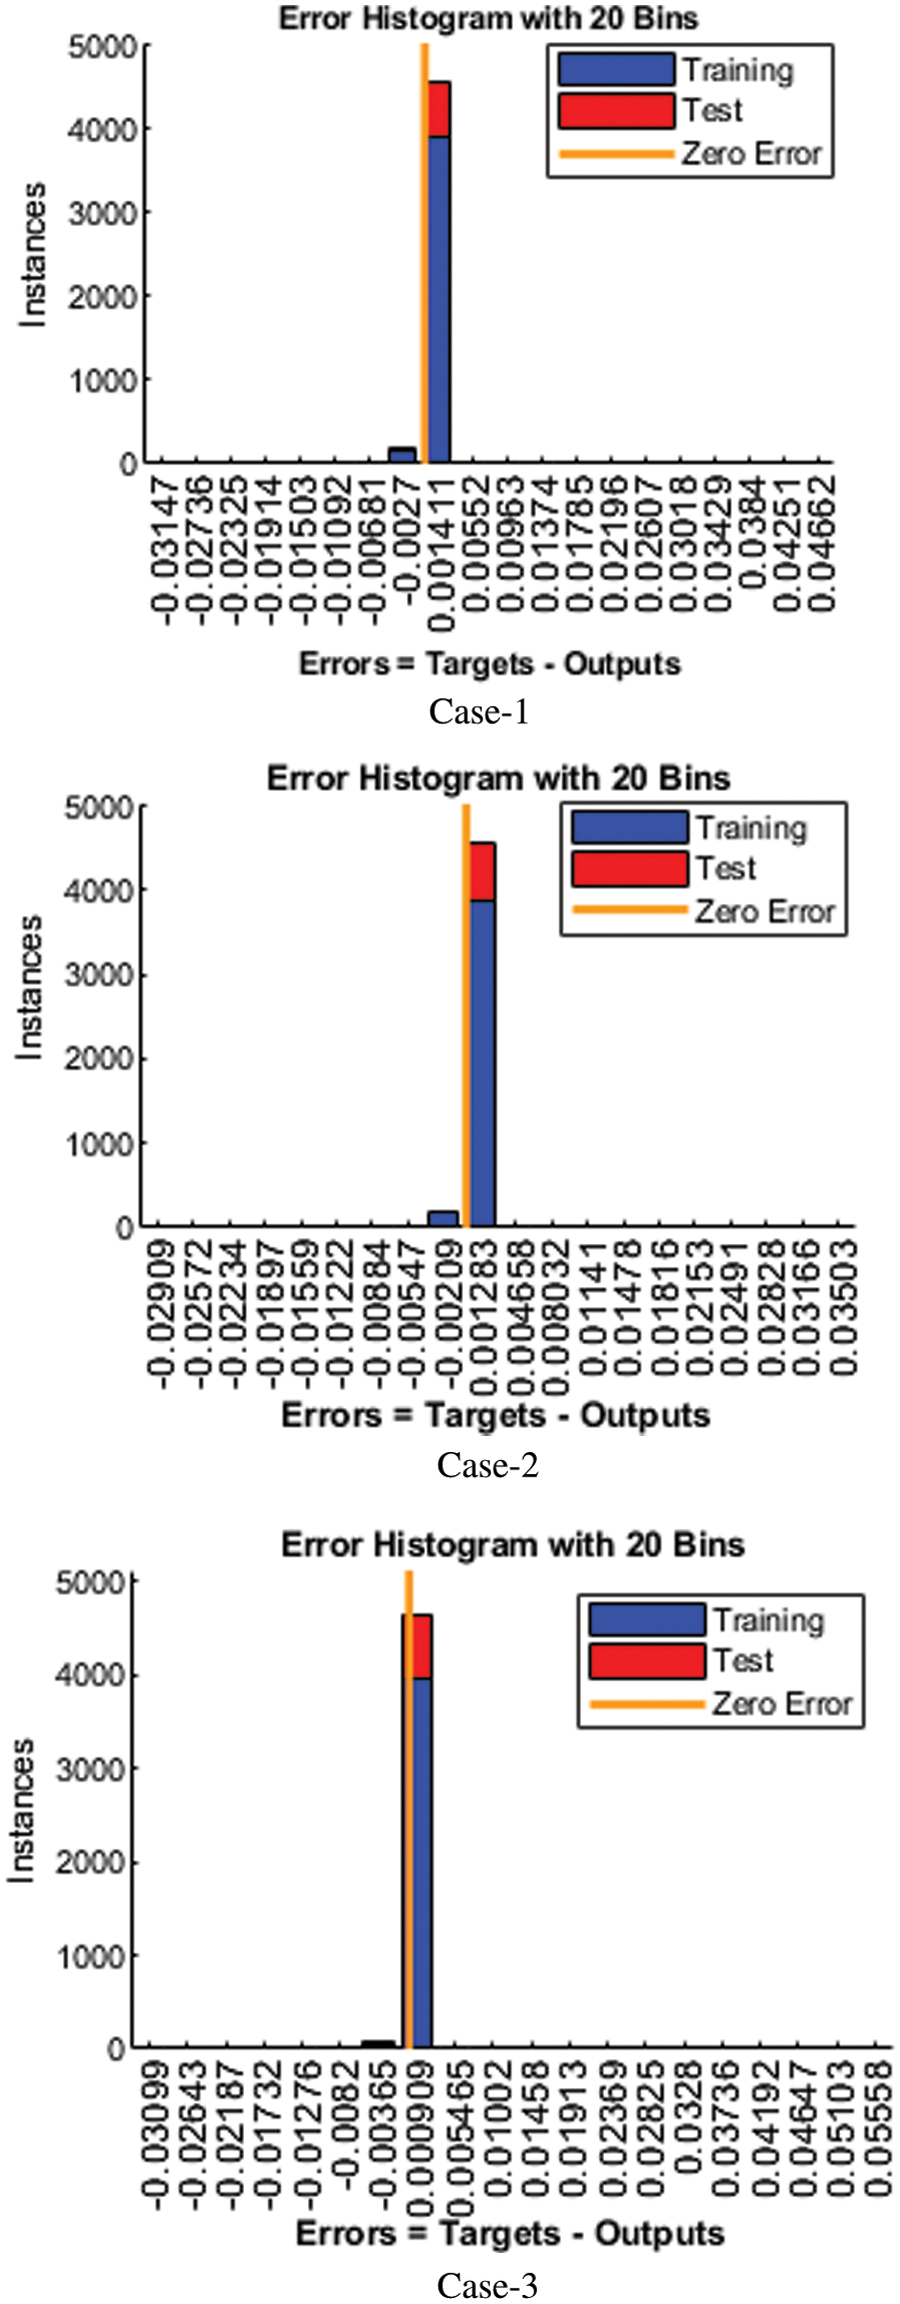
Figure 5: Analysis of error histogram for cases1–3
The vertical bars in the error histogram represent the number of boxes that are 20. The y-axis shows the number of samples taken from Mathematica’s dataset; how many models are in each box. We can observe that the error in the middle part of the error histogram is equal to 0.001411, in which the blue part shows dataset training at an altitude of 4000, but the upper green and red part shows confirmation and test from 4500. Up to 5000, The X-axis represents the zero-error line in Fig. 6. When the network completes training, testing, and validation, the regression analysis is performed in Bayesian-regularization backpropagation artificial neural networks (BRANNs). Estimating the relationship between target values and output values is statistically called regression. The plot regression function uses the values of two parameters (targets and outputs). The plot regression function graphically represents the relationship between targets and output values in Fig. 7. The logarithmic scale is used in the image for small changes because it enables us to understand tiny changes. The proposed Bayesian-regularization backpropagation artificial neural networks (BRANNs) solver is used in the neural network toolbox in the environment through the ‘nets tool’ (neural network fitting tool). In contrast, Bayesian Regularization (BR) is used for training the weights. The designed Bayesian-regularization backpropagation artificial neural networks (BRANNs) have been conducted for two countries based on the accurate data set of India, Pakistan, and Italy. Furthermore, this table explains numerically the time taken during the running of the proposed solver, testing, training, gradient, and performance values for each country and describes the accurate performance.
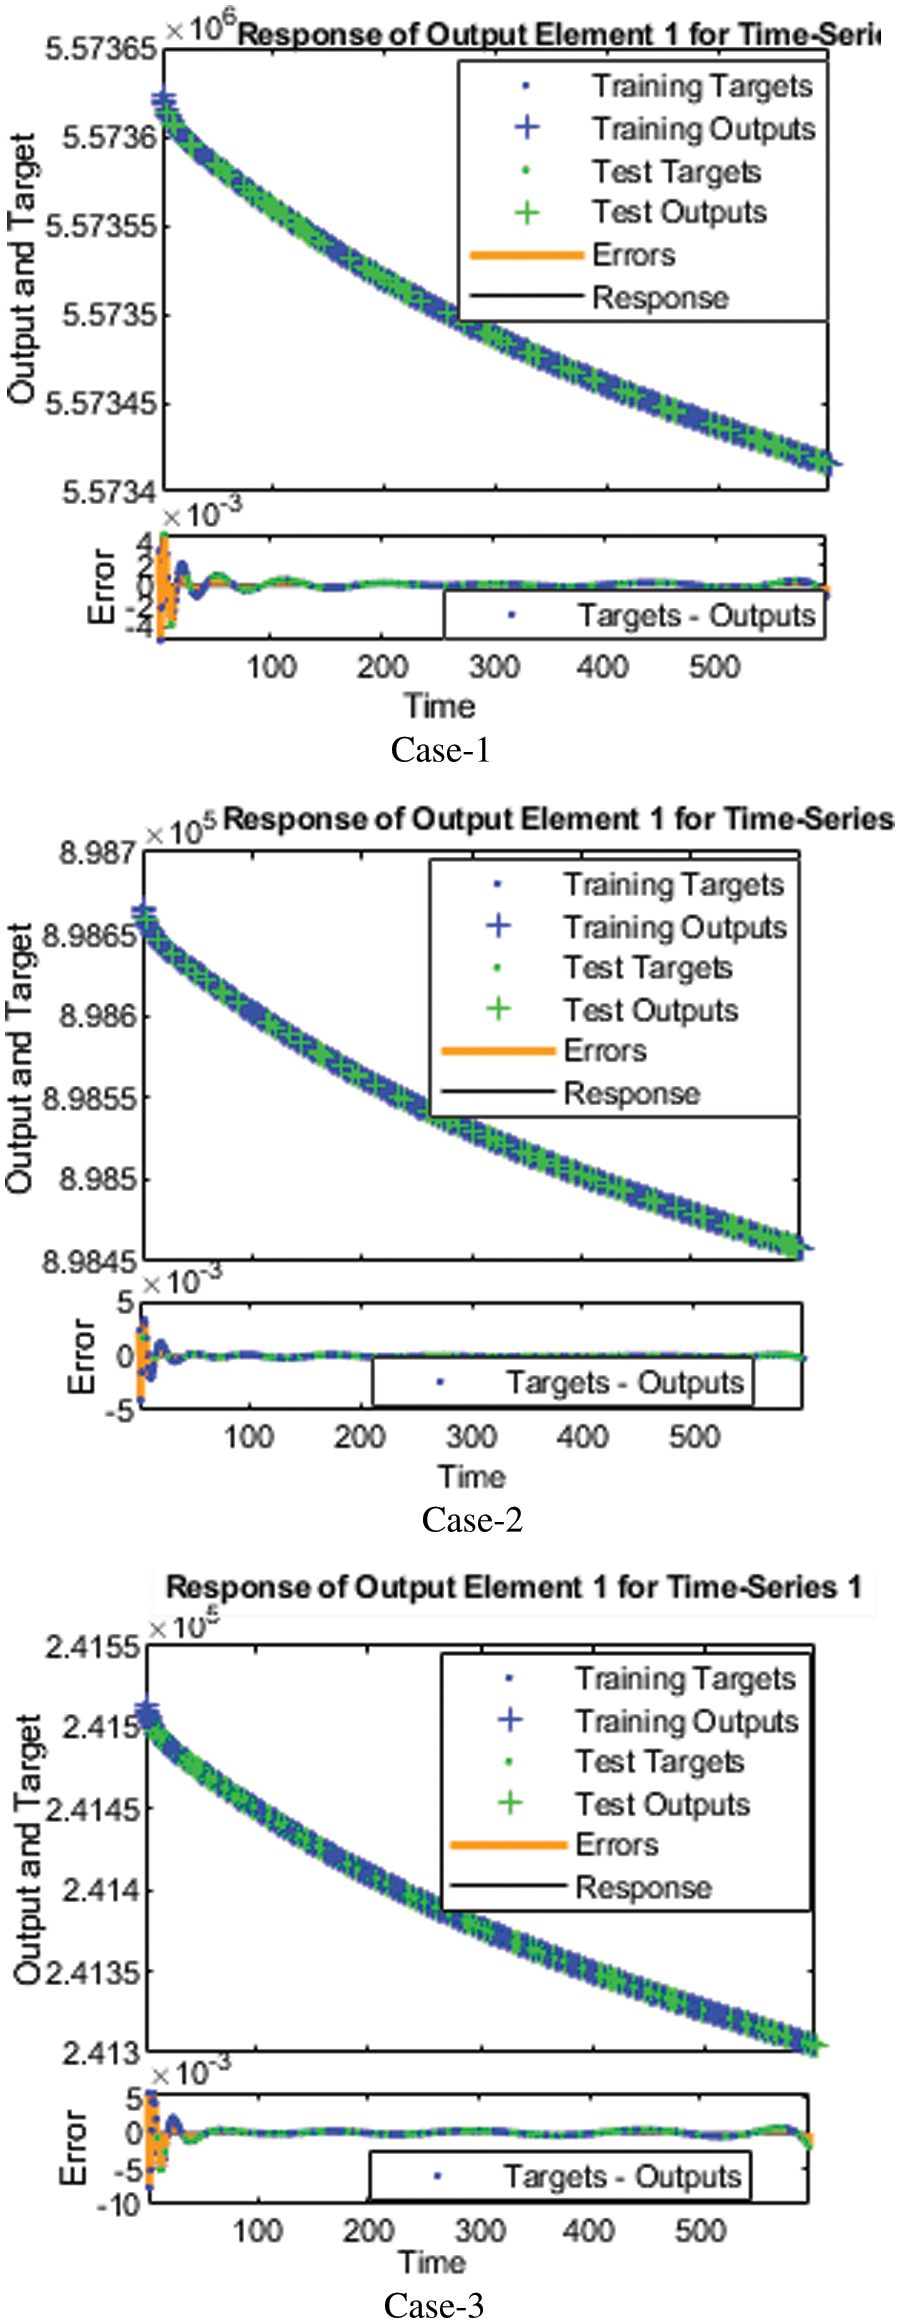
Figure 6: Analysis of fitness plot for all cases1–3
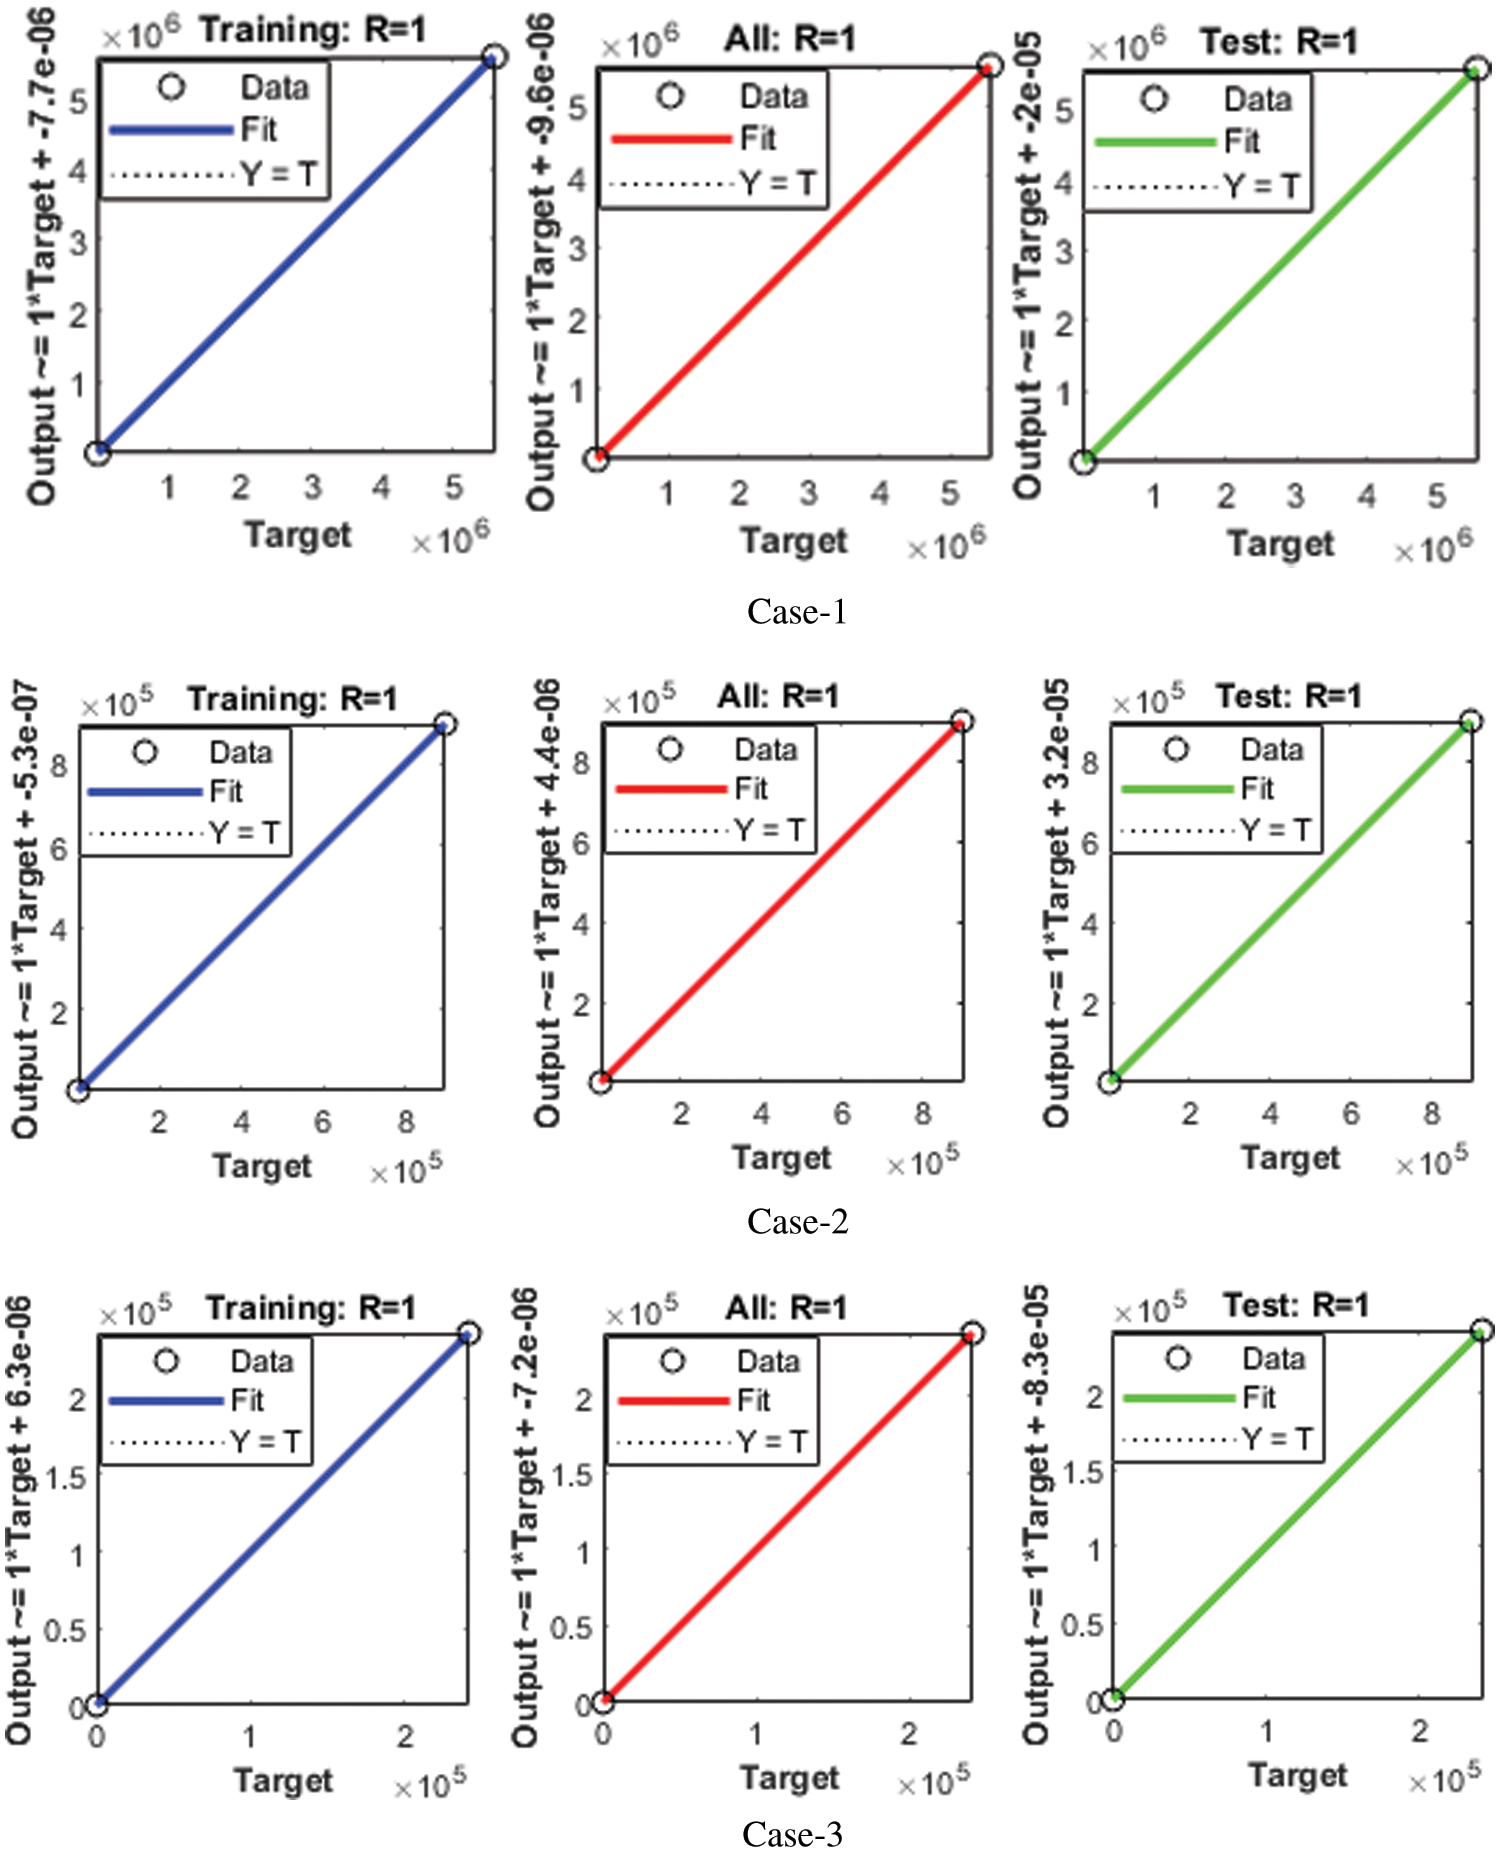
Figure 7: Regression analysis of COVID-19 outputs and targets for cases1–3
Integrated computing intelligent platform based on artificial intelligence introduced by artificial neural networks with backpropagation of Bayesian regulation to mathematics for COVID-19 manifesting coronavirus spread through multifaceted classes in different countries India, Pakistan, and Italy model to be solved based on the accurate data. The dataset for the model for COVID-19 has been developed using a solution of colored quotas for different classes. 70% of the reference data is employed for validation, testing, and training of the Bayesian-regularization backpropagation artificial neural networks (BRANNs).
• ODEs showing the fast spread of COVID-19 are tackled by employing a governing system, Bayesian-regularization backpropagation artificial neural networks (BRANNs).
• A comparison of the projected outcomes with the reference of the numerical solution obtained displays the consistency and accuracy of the suggested Bayesian-regularization backpropagation artificial neural networks (BRANNs).
• Moreover, the suggested method’s scenario is justified by the numerical and graphical expression based on the error histograms, convergence plots, i.e., regression dynamics, and square errors.
• Differences in the parameters of interest significantly affect the dynamics of the model.
• The demonstration of the process of computation is good in case of the complexity found in connection with time series, histogram, regression, mean square error, etc.
In the future, anyone will be able to solve their systems and differential equations with different sigmoidal, radial base, and violet initiation purposes to solve neutral, single, multi, fuzzy, and partial variations.
Acknowledgement: Thanks to our families and colleagues who supported us morally. The authors extend their appreciation to the Deanship of Scientific Research at King Khalid University for funding this work through Large Groups (Project under Grant Number (RGP.2/116/43)).
Funding Statement: The authors received no specific funding for this study.
Conflicts of Interest: The authors declare that they have no conflicts of interest to report regarding the present study.
References
1. A. E. Gorbalenya, S. C. Baker, R. S. Baric, R. J. D. Groot, C. Drosten et al., “The species severe acute respiratory syndrome-related coronavirus: Classifying 2019-nCoV and naming it SARS–CoV-2,” Nature Microbiology, vol. 5, no. 4, pp. 536–544, 2020. [Google Scholar]
2. M. A. Shereen, S. Khan, A. Kazmi, N. Bashir and R. Siddique, “COVID-19 infection: Emergence, transmission, and characteristics of human coronaviruses,” Journal of Advanced Research, vol. 24, no. 1, pp. 91–98, 2020. [Google Scholar]
3. J. Cui, F. Li and Z. L. Shi, “Origin and evolution of pathogenic coronaviruses,” Nature Reviews Microbiology, vol. 17, no. 3, pp. 181–192, 2019. [Google Scholar]
4. M. E. Zowalaty and J. D. Järhult, “From SARS to COVID-19: A previously unknown SARS-CoV-2 virus of pandemic potential infecting humans,” Call for a One Health Approach One Health, vol. 9, no. 1, pp. 1–18, 2020. [Google Scholar]
5. J. M. Hughes, M. E. Wilson, S. P. Wilson, E. S. Gurley and M. J. Hossain, “Transmission of human infection with Nipah virus,” Clinical Infectious Diseases, vol. 49, no. 11, pp. 1743–1748, 2009. [Google Scholar]
6. N. H. Tuan, H. Mohammadi and S. Rezapour, “A mathematical model for COVID-19 transmission by using the caput derivative,” Chaos Solitons and Fractals, vol. 140, no. 1, pp. 1–19, 2020. [Google Scholar]
7. B. Ivorra, M. R. Ferrández, M. V. Pérez and A. M. Ramos, “Mathematical modeling of the spread of the coronavirus disease 2019 (COVID-19) taking into account the undetected infections. The case of China,” Communications in Nonlinear Science and Numerical Simulation, vol. 88, no. 1, pp. 1–18, 2020. [Google Scholar]
8. K. Y. Ng and M. M. Gui, “Development of a robust mathematical model and simulation package with consideration for ageing population and time delay for control action and re-susceptibility,” Physica D: Nonlinear Phenomena, vol. 411, no. 1, pp. 1–22, 2020. [Google Scholar]
9. P. Khrapov and A. Loginova, “Comparative analysis of the mathematical models of the dynamics of the coronavirus COVID-19 epidemic development in the different countries,” International Journal of Open Information Technologies, vol. 8, no. 5, pp. 17–22, 2020. [Google Scholar]
10. C. Liu, X. Wu, R. Niu, X. Wu and R. Fan, “A new SAIR model on complex networks for analyzing the 2019 novel coronavirus (COVID-19),” Nonlinear Dynamics, vol. 101, no. 3, pp. 1777–1787, 2020. [Google Scholar]
11. A. Raza, Y. M. Chu, M. Y. Bajuri, A. Ahmadian, N. Ahmed et al., “Dynamical and nonstandard computational analysis of heroin epidemic model,” Results in Physics, vol. 34, no. 1, pp. 1–10, 2022. [Google Scholar]
12. A. Raza, A. Ahmadian, M. Rafiq, S. Salashour, M. Naveed et al., “Modeling the effect of delay strategy on transmission dynamics of HIV/AIDS disease,” Advances in Difference Equations, vol. 663, no. 1, pp. 1–19, 2020. [Google Scholar]
13. A. Raza, A. Ahmadian, M. Rafiq, S. Salahshour and I. R. Laganà, “An analysis of a nonlinear susceptible-exposed-infected-quarantine-recovered pandemic model of a novel coronavirus with delay effect,” Results in Physics, vol. 21, no. 1, pp. 1–07, 2021. [Google Scholar]
14. S. A. M. Alsallami, A. Raza, M. Elmahi, M. Rafiq, S. Bilal et al., “Computational approximations for real-world application of epidemic model,” Intelligent Automation and Soft Computing, vol. 33, no. 3, pp. 1923–1939, 2022. [Google Scholar]
15. M. A. Noor, A. Raza, M. S. Arif, M. Rafiq, K. S. Nisar et al., “Non-standard computational analysis of the stochastic COVID-19 pandemic model: An application of computational biology,” Alexandria Engineering Journal, vol. 61, no. 1, pp. 619–630, 2021. [Google Scholar]
16. A. Raza, “Mathematical modelling of rotavirus disease through efficient methods,” Computers, Materials and Continua, vol. 72, no. 3, pp. 4727–4740, 2022. [Google Scholar]
17. M. Rafiq, M. Naveed, Z. Khan, A. Raza, J. Awrejcewicz et al., “Modeling the spread of leishmaniasis disease via delayed analysis,” Alexandria Engineering Journal, vol. 61, no. 12, pp. 11197–11209, 2022. [Google Scholar]
18. A. Raza, J. Awrejcewicz, M. Rafiq, N. Ahmed, M. S. Ahsan et al., “Dynamical analysis and design of computational methods for nonlinear stochastic leprosy epidemic model,” Alexandria Engineering Journal, vol. 61, no. 10, pp. 8097–8111, 2022. [Google Scholar]
19. A. Raza, M. Rafiq, J. Awrejcewicz, N. Ahmed and M. Mohsin, “Stochastic analysis of nonlinear cancer disease model through virotherapy and computational methods,” Mathematics, vol. 10, no. 3, pp. 1–18, 2022. [Google Scholar]
20. A. Raza, M. Rafiq, J. Awrejcewicz, N. Ahmed and M. Mohsin, “Dynamical analysis of coronavirus disease with crowding effect, and vaccination: A study of third strain,” Nonlinear Dynamics, vol. 107, no. 4, pp. 3963–3982, 2022. [Google Scholar]
21. A. Raza, J. Awrejcewicz, M. Rafiq and M. Mohsin, “Breakdown of a nonlinear stochastic Nipah virus epidemic model through efficient numerical methods,” Entropy, vol. 23, no. 12, pp. 1–20, 2021. [Google Scholar]
22. N. Ahmed, J. E. M. Diaz, A. Raza, D. Baleanu, M. Rafiq et al., “Design of generalized non-standard computational method for the solution of stochastic fractional malaria epidemic model,” Axioms, vol. 11, no. 1, pp. 1–13, 2022. [Google Scholar]
23. J. Ali, A. Raza, N. Ahmed, A. Ahmadian, M. Rafiq et al., “Evolutionary optimized padé approximation scheme for analysis of COVID-19 model with crowding effect,” Operations Research Perspectives, vol. 8, no. 1, pp. 1–13, 2021. [Google Scholar]
24. A. Raza, E. E. Mahmoud, A. M. A. Bugami, D. Baleanu, M. Rafiq et al., “Examination of pine wilt epidemic model through efficient algorithm,” Computers, Materials and Continua, vol. 71, no. 3, pp. 5293–5310, 2022. [Google Scholar]
25. A. Raza, A. Ahmadian, M. Rafiq, M. C. Ang, S. Salashour et al., “The impact of delay strategies on the dynamics of coronavirus pandemic model with nonlinear incidence rate,” Fractals, vol. 30, no. 5, pp. 1–13, 2022. [Google Scholar]
26. A. Raza and M. Rafiq, “Modeling and transmission dynamics of leprosy disease via numerical methods,” Iranian Journal of Science and Technology, Transactions A: Science, vol. 46, no. 1, pp. 279–290, 2022. [Google Scholar]
27. A. Raza, D. Baleanu, M. Yousaf, N. Akther, S. K. Mehmood et al., “Modeling of anthrax disease via efficient computing techniques,” Intelligent Automation and Soft Computing, vol. 32, no. 2, pp. 1109–1124, 2022. [Google Scholar]
28. N. Ahmad, A. Elsonbaty, A. Raza, M. Rafiq and W. Adel, “Numerical simulation and stability analysis of a novel reaction-diffusion COVID-19 model,” Nonlinear Dynamics, vol. 23, no. 1, pp. 1–18, 2021. [Google Scholar]
29. N. Ahmed, A. Raza, M. Rafiq, A. Ahmadian, N. Batool et al., “Numerical and bifurcation analysis of SIQR model,” Chaos, Solitons and Fractals, vol. 150, no. 1, pp. 1–15, 2021. [Google Scholar]
30. A. Akgul, U. Fatima, M. S. Iqbal, N. Ahmed, A. Raza et al., “A fractal fractional model for computer virus dynamics,” Chaos, Solitons and Fractals, vol. 147, no. 1, pp. 1–19, 2021. [Google Scholar]
31. J. E. M. Diaz, A. Raza, N. Ahmed and M. Rafiq, “Analysis of a nonstandard computer method to simulate a nonlinear stochastic epidemiological model of coronavirus-like diseases,” Computer Methods and Programs in Biomedicine, vol. 204, no. 1, pp. 1–10, 2021. [Google Scholar]
32. A. Akgul, M. S. Iqbal, U. Fatima, N. Ahmed, Z. Iqbal et al., “Optimal existence of fractional order computer virus epidemic model and numerical simulations,” Mathematical Methods in the Applied Sciences, vol. 7437, no. 1, pp. 1–13, 2021. [Google Scholar]
33. N. Fernandes, “Economic effects of coronavirus outbreak (COVID-19) on the world economy,” International Journal of Economics, Finance and Management Sciences, vol. 1, no. 1, pp. 1–50, 2020. [Google Scholar]
34. O. O. Ogunleye, D. Basu, D. Mueller, J. Sneddon, R. A. Seaton et al., “Response to the novel coronavirus (COVID-19) pandemic across Africa: Successes, challenges, and implications for the future,” Frontiers in Pharmacology, vol. 11, no. 1, pp. 1–20, 2020. [Google Scholar]
35. M. Mandal, S. Jana, S. K. Nandi, A. Khatua, S. Adak et al., “A Model-based study on the dynamics of COVID-19: Prediction and control,” Chaos, Solitons & Fractals, vol. 136, no. 1, pp. 1–20, 2020. [Google Scholar]
36. K. Rajagopal, N. Hasanzadeh, F. Parastesh, I. I. Hamarash, S. Jafari et al., “A Fractional-order model for the novel coronavirus (COVID-19) outbreak,” Nonlinear Dynamics, vol. 101, no. 1, pp. 711–718, 2020. [Google Scholar]
37. E. Herrera-Delgado, J. Briscoe and P. Sollich, “Tractable nonlinear memory functions as a tool to capture and explain dynamical behaviors,” Physical Review Research, vol. 2, no. 4, pp. 1–18, 2020. [Google Scholar]
38. S. S. M. Ghoneim, T. A. Farrag, A. A. Rashed, E. S. M. El-Kenawy and A. Ibrahim, “Adaptive dynamic meta-heuristics for feature selection and classification in diagnostic accuracy of transformer faults,” IEEE Access, vol. 9, no. 1, pp. 78324–78340, 2021. [Google Scholar]
Cite This Article
 Copyright © 2023 The Author(s). Published by Tech Science Press.
This work is licensed under a Creative Commons Attribution 4.0 International License , which permits unrestricted use, distribution, and reproduction in any medium, provided the original work is properly cited.
 Downloads
 Citation Tools