
 Submit a Paper
 Propose a Special lssue
 Open Access
ARTICLE

Transfer Learning-Based Semi-Supervised Generative Adversarial Network for Malaria Classification
1 Institute of Computing, Kohat University of Science and Technology, Kohat, 26000, K.P.K, Pakistan
2 College of Science and Engineering, Hamad bin Khalifa University, Doha, Qatar
3 Centre of Research in Data Science, Computer and Information Sciences Department, Universiti Teknologi PETRONAS, Seri Iskandar, 32610, Perak, Malaysia
* Corresponding Author: Samir Brahim Belhaouari. Email:
Computers, Materials & Continua 2023, 74(3), 6335-6349. https://doi.org/10.32604/cmc.2023.033860
Received 29 June 2022; Accepted 02 September 2022; Issue published 28 December 2022
 View Full Text
 Download PDF
Abstract
Malaria is a lethal disease responsible for thousands of deaths worldwide every year. Manual methods of malaria diagnosis are time-consuming that require a great deal of human expertise and efforts. Computer-based automated diagnosis of diseases is progressively becoming popular. Although deep learning models show high performance in the medical field, it demands a large volume of data for training which is hard to acquire for medical problems. Similarly, labeling of medical images can be done with the help of medical experts only. Several recent studies have utilized deep learning models to develop efficient malaria diagnostic system, which showed promising results. However, the most common problem with these models is that they need a large amount of data for training. This paper presents a computer-aided malaria diagnosis system that combines a semi-supervised generative adversarial network and transfer learning. The proposed model is trained in a semi-supervised manner and requires less training data than conventional deep learning models. Performance of the proposed model is evaluated on a publicly available dataset of blood smear images (with malaria-infected and normal class) and achieved a classification accuracy of 96.6%.Keywords
Malaria is one of the most common causes of mortality in the world. Every year, it affects millions of people and leads to millions of deaths. According to WHO, nearly 228 million active malarial cases were reported in 2018 alone, and there were an approximate 405000 deaths worldwide [1]. Most of the malaria cases were reported from African regions (213 million or 93%). These are poverty-hit countries with very few resources to battle malaria. Traditional methods of diagnosing malaria, such as microscopy, rapid immune-chromatographic tests (RDTs), and polymerase chain reaction (PCR) [2] are not efficient enough to detect malaria. Malaria diagnosis and detection should be fast and accurate to prevent further spread in the community. Based on traditional Machine Learning (ML) and state-of-the-art deep learning (DL), numerous automated diagnosis systems for malaria have been presented to overcome the limitations of the conventional diagnosis methods [3]. However, it is still needed to improve these systems in terms of performance, training time, and amount of training data.
Traditional machine learning approaches are limited in their ability to interpret images in their raw form [4] and require extensive image preprocessing and segmentation processes. Moreover, the informative features are mostly extracted by experts based on their knowledge about malaria. Non-experts find it difficult to utilize ML approaches for their studies due to expert judgement and a time-consuming trial and error technique in the feature selection process [5]. By including the feature extraction stage into the process of learning, DL resolves this difficulty. In contrast to conventional machine learning techniques, the key features are extracted automatically in a self-instructed fashion [6], as a result, the responsibility of extracting features transferred from humans to computers, allowing non-experts to explore DL more effectively for their research. The amount of data, on the other hand, has a big impact on the potential of DL-based diagnosis systems. To prevent over-fitting, such models need a significant amount of data for training [7]. Moreover, due to expensive data collection and labeling processes, there is a scarcity of large labeled datasets in the medical field [4,8]. These challenges usually limit the use of DL models in building diagnosis systems.
TL has mostly been adopted in the literature to handle limited medical data [9]. Numerous diseases such as brain tumors [10], diabetes mellitus [11], breast cancer [12], Covid-19 [13], and Alzheimer [14] have been automatically diagnosed using pre-trained DL models. TL has also been used in combination with generative adversarial network (GAN) for the classification of limited medical data [15]. Integration of these two techniques also helped reduce the training time and enhance the quality of generated images [16]. Furthermore, it has been demonstrated that with less labelled data, the semi-supervised GAN (SGAN) can achieve performance comparable to a traditional supervised Convolutional Neural Net-work (CNN) for medical images [17]. Motivated by the existing research, we propose a model in this paper (which is an extension of our conference paper [18] ) to detect malaria, which is based on transfer learning (TL) and SGAN (TL-SGAN). Unlike a conventional CNN model, the proposed TL-SGAN is trained with fewer data. Another important aspect of the model is that only a small fraction of the training data is labeled. The main contributions of the current research work are as follows:
• The two concepts mentioned above, namely SGAN and TL are combined into a single model. The proposed model demonstrated excellent ability to detect malaria in blood cell images.
• The proposed TL-SGAN is trained in a semi-supervised manner using a small number of images. This approach makes the diagnosis and treatment of malaria more convenient and can relieve pathologists of enormous workload.
This research is an extension of our research work published in [18]. Rest of the paper is organized as follows. Literature review and background study related to this research work are given Section 2 and 3 followed by the detail explanation of the proposed methodology in Section 4. Empirical results are discussed in Section 5. The research work is concluded in Section 6.
Traditional machine learning methods have been widely applied to create automated diagnostic systems for malaria in recent years. In [19], an effective malaria detection technique is presented, where the erythrocytes were segmented from microscopic images using watershed transformation. After feature selection, support vector machine (SVM) and Bayesian network were utilized for classification. The Bayesian network attained an accuracy of 84.0% using the 19 most essential features. A generalized variation denoising method and a local adaptive threshold approach were utilized for noise removal and segmentation, respectively, in an image-based cytometer for quick malaria detection [20]. After that, SVM was used to classify the segmented images, with a minor false positive rate of 0.0025%. P. falciparum and white blood cells were identified in blood smear pictures using a mobile device-based automated approach [21]. Blood cells were segmented using adaptive threshold and then classified using SVM. Two image processing systems for the detection as well as the classification of malaria were proposed in [22]. A morphological algorithm was used was used to detect malaria in negative binary images with 95% accuracy, whereas 100% accuracy is observed while classifying the parasite into four species using normalized cross-correlation function. For the automatic detection and staging of RBCs infected with P. falciparum, quantitative phase analysis of unstained cell images was used [23].
DL has also shown enormous success in the automated diagnosis of malaria. A 19-layer CNN was demonstrated for classifying infected and uninfected malarial cells, with an accuracy rate of 98.9% [24]. The use of multi-wavelength imaging to aid in data augmentation was used in a quick and robust malaria classification system [25]. A CNN model with five convolutional layers and two fully connected (FC) layers was used to achieve a classification accuracy of 97%. Various combinations of different numbers of layers and nodes were used to identify malaria using a deep belief network [26]. The network’s optimal number of layers and nodes yielded a 96.21% accuracy. Faster R-CNN and Alex-Net for object detection and classification were used in a two-stage malaria detection and classification model that achieved a 98% accuracy [27]. VGG and SVM were used to identify falciparum malaria with 93.1% by substituting the last layers of VGG with SVM [28]. Various object detection pre-trained models such as Faster R-CNN, Single-shot multi-box detector, and RetinaNet were utilised for malaria parasite detection. The results demonstrated that Faster R-CNN is the most well-trained model with an average precision of over 0.94 [29]. For automatic diagnosis of malaria, stacked CNN [30,31] and an ensemble of residual networks [32] were recently used, with accuracy rate of 99.96% and 98.08%, respectively.
This section briefly discusses the background of the material and methods used in this research.
Plasmodium, a single-celled parasite, causes malaria, which is an infectious disease. When female Anopheles mosquitos bite humans and feed on their blood, they absorb the parasite and disseminate it. P. falciparum, P. vivax, P. malariae, P. ovale, and P. knowlesi are the five Plasmodium species that cause malaria in humans [33]. P. falciparum and P. vivax are the most abundant of the five kinds. The Plasmodium life cycle comprises two phases: sexual, which happens in mosquitoes, and asexual, which occurs in humans. A Plasmodium parasite enters the human body as a sporozoite and then enters hepatocytes, where it undergoes its first phase of asexual growth. Red blood cells (RBCs) go through a second period of asexual development, which eventually leads to their bursting [34]. Malaria infection symptoms might include headaches, nausea, vomiting, photophobia, and muscle aches in the early stages.
TL is a machine learning technique that retains and uses information obtained from addressing one problem to a related problem [8]. The idea is to apply a model’s understanding (e.g., ImageNet) to solve a different problem (e.g., Malaria detection) with a smaller data set is shown in Fig. 1. In TL, rather than learning from scratch, previously acquired patterns are applied to a new problem. TL is usually accomplished using DL models that are pre-trained on huge and demanding object recognition tasks such as ImageNet. Pre-trained models are either used as feature extractors or adapted to the new problem by fine-tuning their last layers. Reduced training time, increased efficiency, and the ability to work with a smaller data set are just a few of the benefits of TL [9].
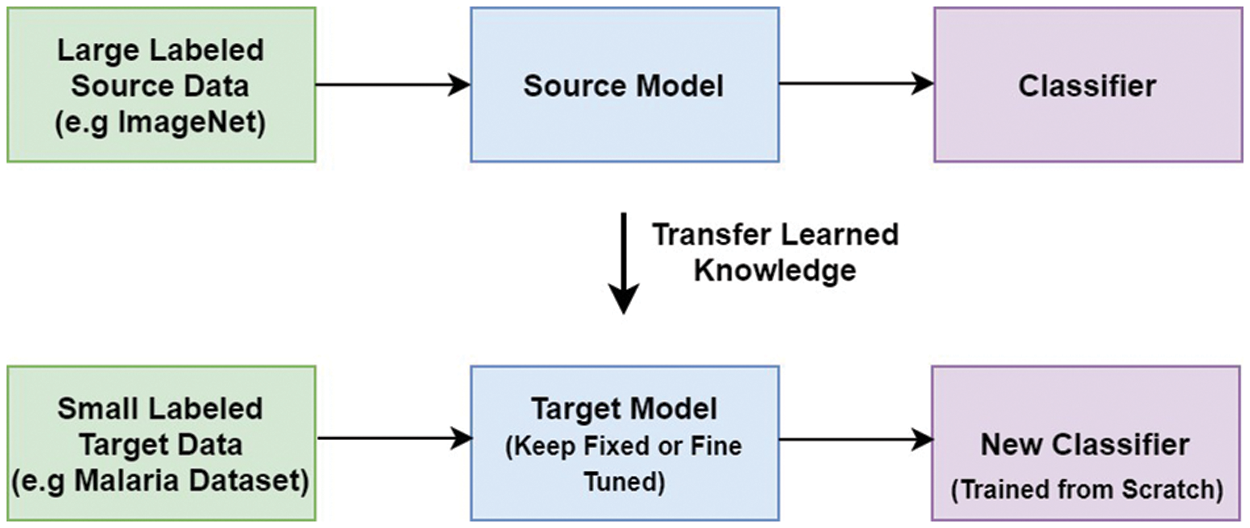
Figure 1: Transfer learning
VGG stands for the Oxford University’s Visual Geometric Group, and VGG16 is a deep learning model first presented by this group during the ImageNet challenge in 2014 [35]. It consists of thirteen convolutional layers and three FC layers. The model receives an input of size 224 × 224 × 3, which is convolved using kernels of size 3 × 3 (with stride and padding set to one pixel). The convolution operations in VGG16 do not change the spatial dimension of the feature maps. Moreover, five spatial max-pooling operations are performed over a 2 × 2-pixel window (stride size set to 2), and as a result, the spatial dimension of the feature maps becomes half. Two FC layers (each with 4096 nodes) are present between the convolutional stack and the output layer. The hidden layers in the network are equipped with rectified linear unit (RELU) activation function, while the output layer is a softmax layer consisting of 1000 nodes and classifies the images in the ImageNet data-set. The architecture of VGG16 is given in Fig. 2.
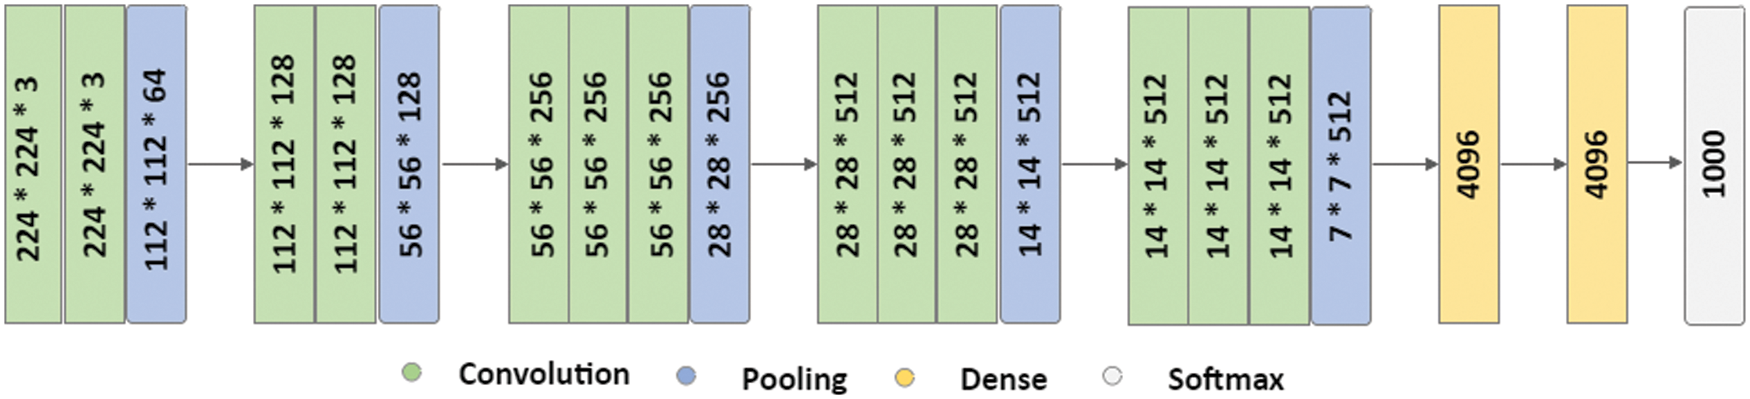
Figure 2: VGG16
SGAN shown in Fig. 3 is one of the most exciting applications of GANs in practice [36]. SGAN requires only a small fraction of the training data to be labelled, as compared to supervised learning approaches that require all of the data to be annotated. A generator and a discriminator are the two deep neural networks that constitute SGAN. The generator takes a random vector (z) as an input and outputs fake graphics (x*). Real images without labels from the training dataset (x), false images made by the generator (x*), and real images with labels from the training dataset (x, y), where y refers to the label for the provided image x are all inputs to the discriminator. For each example, the discriminator calculates and gives the probability of an image being real. The discriminator utilizes fake images as additional information to learn patterns in the data. During training, it learns to differentiate between fake images and actual unlabeled images and classify labeled images in the training data into their corresponding classes. In a nutshell, SGAN is a classifier with C + 1 output nodes, where C is the number of classes present in the data. Fig. 3 depicts architecture of SGAN.
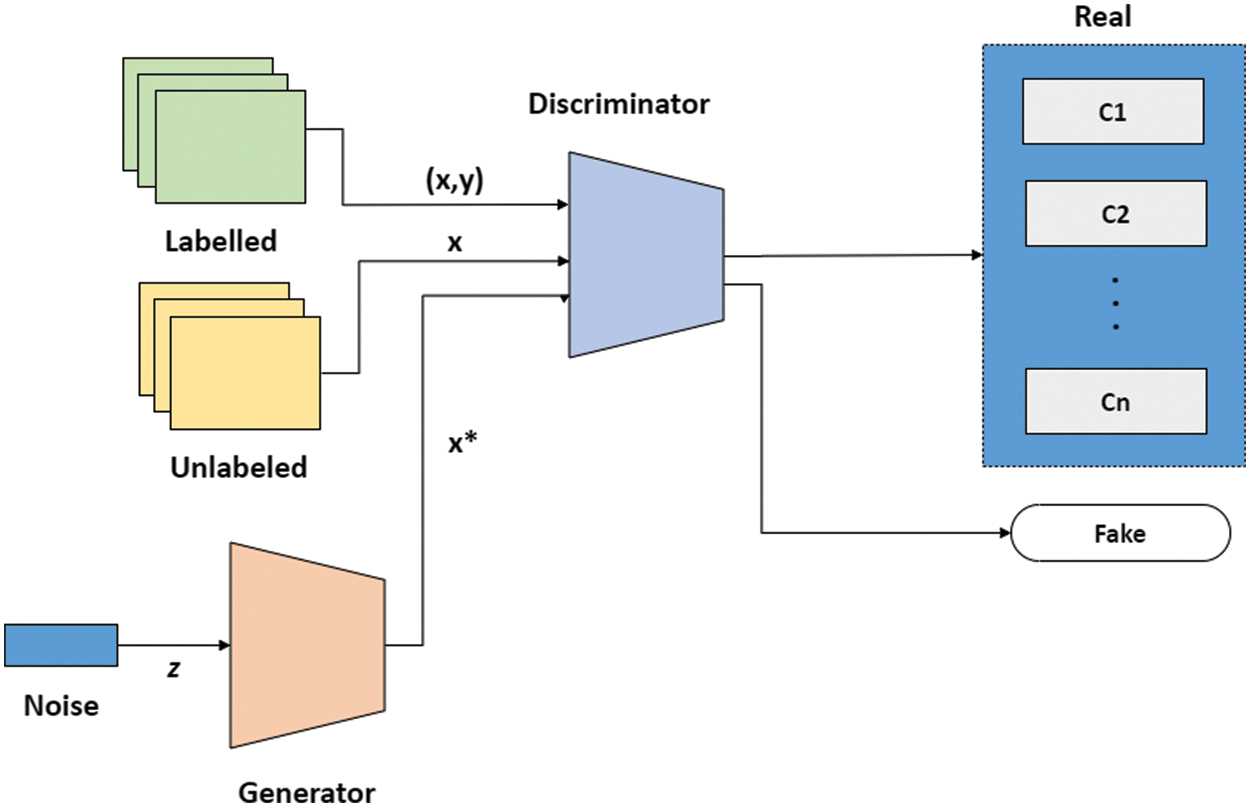
Figure 3: SGAN
Fig. 4 shows the flow diagram of the proposed TL-SGAN, while the different steps involved are discussed below.
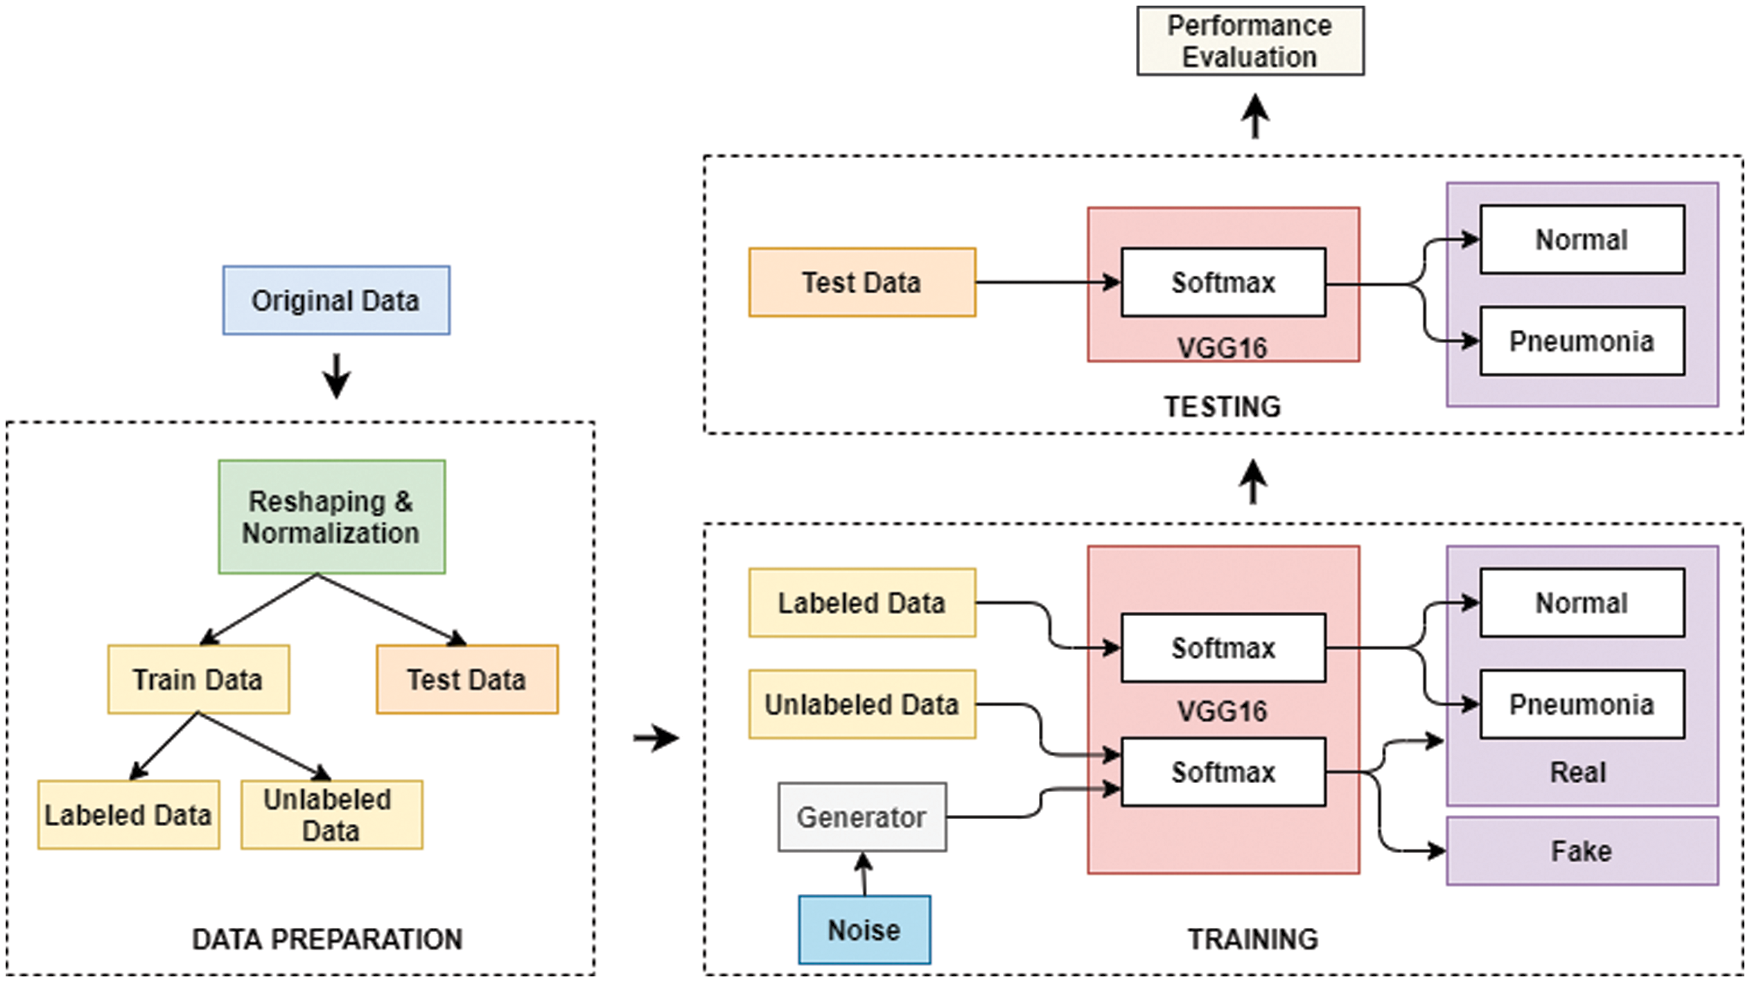
Figure 4: Flow diagram of the proposed TL-SGAN
A publicly available dataset of 27,558 blood cell pictures with the same amount of infected and uninfected cells is used [37]. Plasmodium was present in the infected blood cells, but not in the uninfected ones as shown in Fig. 5. At Chittagong Medical College Hospital in Bangladesh, Giemsa-stained thin blood smear slides from 150 Plasmodium falciparum-infected and 50 healthy persons were investigated for image collection. In order to capture the photos, a normal Android phone was connected to a light microscope which were then manually tagged. The RBCs were segmented using a level-set based algorithm [36].
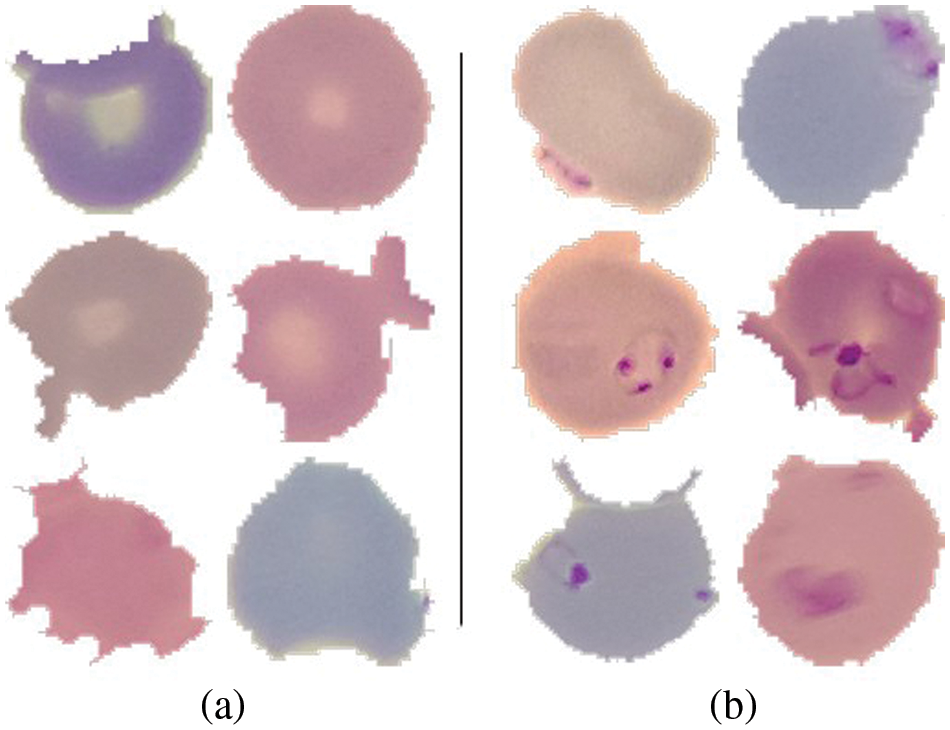
Figure 5: (a) Uninfected cells (b) Infected cells
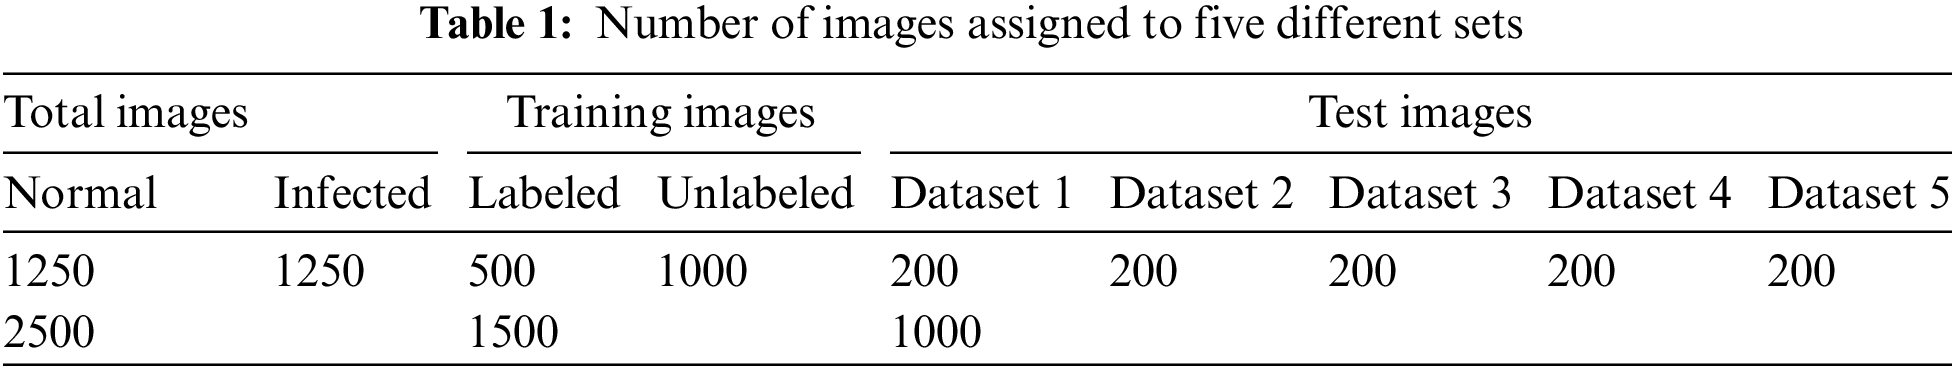
In this research, only 2500 images from the dataset are utilized. For each class, i.e., infected and non-infected cells, 1250 images are randomly selected. The images are initially reshaped to attain same dimension of 128 × 128 × 3 and then normalized. The normalization is performed by dividing each pixel value in the images by 255. The data is then divided into training (1500 images) and testing datasets (1000 images), respectively. Moreover, 500 images in the training dataset are labeled, while the rest (1000) are unlabeled. Furthermore, the testing dataset is divided into five different sets each having 200 images as shown in Table 1. It also summarizes the distribution of images into different datasets.
The discriminator in SGAN is replaced by a pre-trained VGG16 model in the proposed TL-SGAN. The generator is a CNN with an FC layer that accepts a size 100 noise vector (z). The input vector is reshaped into a four-dimensional tensor and used as the starting point for the generator’s convolutional stack (six layers). The input is UpSampled before each convolutional layer, thus doubling its size. Similarly, except for the last convolutional layer, all of the convolutional layers utilize Relu as the activation function. The last layer makes use of the Tanh activation function to generate bogus images that are 128 × 128 × 3 in size. A few changes are made to the VGG16 (discriminator) architecture to make it more suitable for the problem at hand. Based on the image input size, the size of the convolutional and pooling layers is scaled. A single global average pooling (GAP) layer replaces the FC layers, calculating the mean of each feature map. A GAP layer contains fewer parameters than FC layers, which reduces the risk of over-fitting and the computational burden [7]. Similarly, the VGG16 replaces the single softmax layer (with 1000 nodes) with two output layers (each with two nodes), one to classify infected and uninfected blood cells, and the other distinguishing between fake and real photos. To put it another way, the proposed TL-SGAN architecture is a single architecture having two output layers that use similar feature selection layers. Fig. 6 depicts architecture of the TL-SGAN.
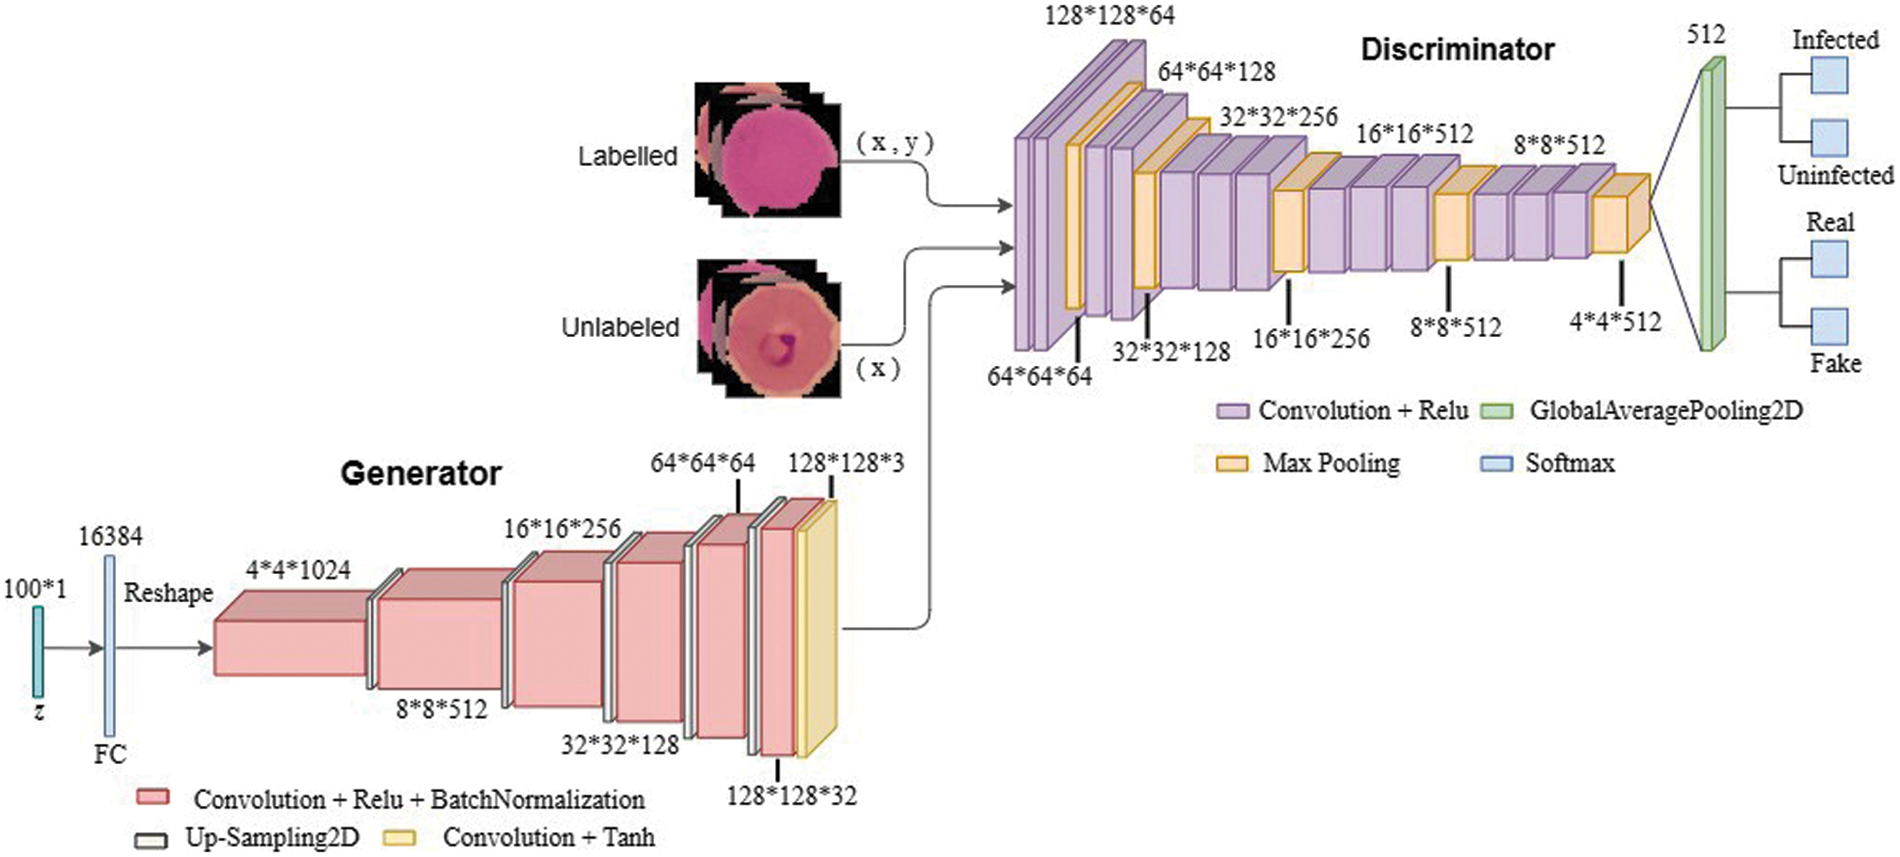
Figure 6: Network architecture
The generator and one output layer (which differentiates real images from fake) in the discriminator are entirely disregarded after training. The rest of the discriminator is retained and is used to classify the unseen data into infected and uninfected cells. The proposed model’s classification performance is evaluated using various statistical measures and is compared with the existing models.
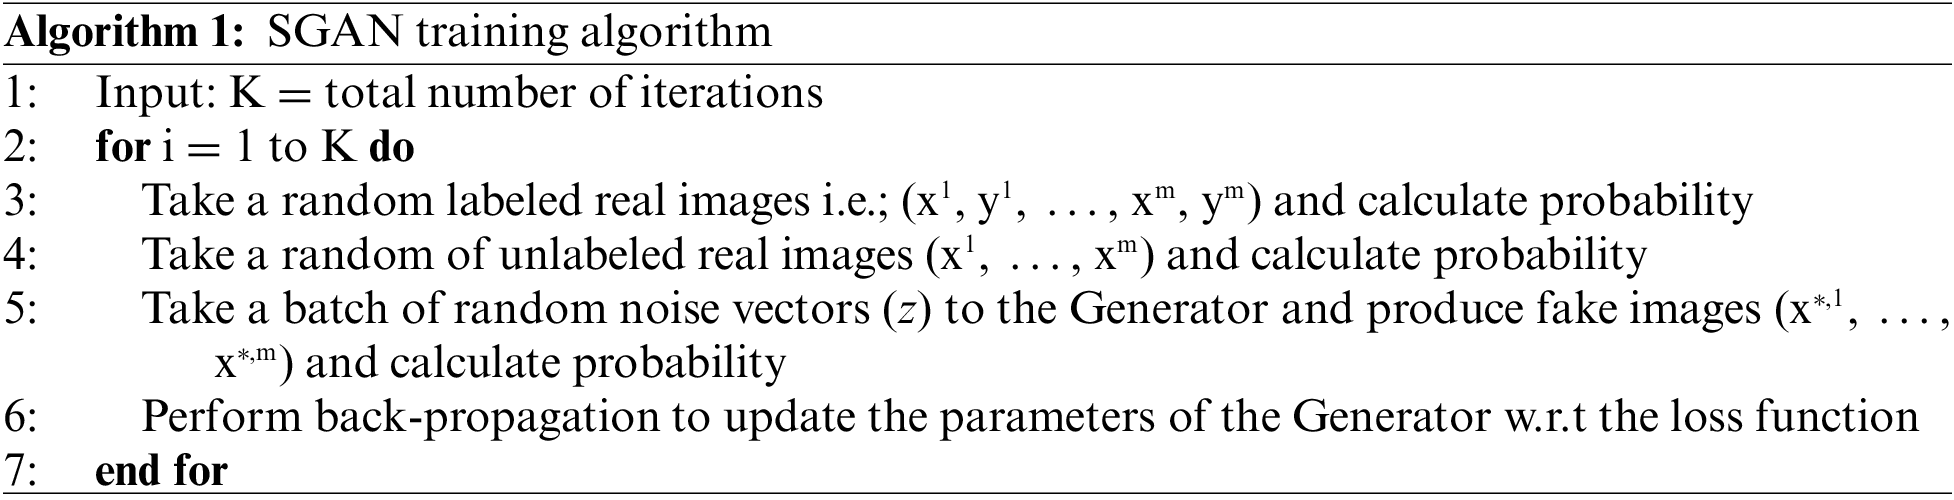
In the TL-SGAN, both the label and unlabeled datasets are taken and are utilized to train a generator model, a supervised and an unsupervised discriminator network, simultaneously. Such a model can predict C + 1 classes using a softmax activation function. Algorithm 1 represents the training process for the TL-SGAN. During SGAN training, random noise is introduced to the unlabeled (x) and labeled (x,y) real images so as to generate fake images. Where y is the labels associated to x. The fake images are then input to the discriminator for predicting whether they are real or fake. Parameters of the generator are updated iteratively till it predicts the fake image as real.
At the end, the proposed model’s classification performance is tested using multiple performance measures and compared to current models.
The experiments in this study are implemented on Tensorflow, an open-source deep learning system. Google Colab that is a cloud-based service with free GPU support is use to run the code. During training, the discriminator’s last three layers are fine-tuned, while the remainder of the first layers are frozen. On the malaria dataset, model training took roughly 500 iterations. With adam as the optimizer and binary cross-entropy as the loss function, a batch size of 64 is employed.
Statistical metrics such as precision, accuracy, sensitivity, F1 score, specificity and area under curve (AUC)-receiver operating curve (ROC) are calculated to measure the classification performance of the TL-SGAN model on testing dataset. These metrics depend on four main statistical values, such as true positives (TP), true negatives (TN), false positives (FP), and false negatives (FN), associated with the classification model. In this research, TP indicates the number of correctly categorized infected cells, while TN represents the number of healthy cells classified without error. FP and FN, on the other hand, represent misclassified infected and uninfected cells, respectively.
The Accuracy metric estimates the ratio of correctly classified images to the total images as in Eq. (1).
Precision metric determines the amount of correctly predicted infected cells to all the infected cells that the model predicts and can be expressed as in Eq. (2).
Sensitivity, also referred to as recall, calculates the number of infected cells that the model predicts correctly as in Eq. (3).
The specificity metric calculates the number of those normal cells that are rightly identified by the model and can be obtained using Eq. (4).
F1 score, also known as F-measure, measures the weighted average of precision and recall as in Eq. (5).
ROC plots two parameters i.e., true positive rate (calculated using Eq. (6)) and false positive rate (obtained using Eq. (7)). AUC value estimates the area under ROC curve and reflects the capability of our model to differentiate between the two classes.
As discussed in subsection 4.2, the TL-SGAN model uses five test sets to evaluate its performance. Fig. 7 shows the confusion matrices, while Table 2 presents the average values of the statistical measures achieved by the model for five testing datasets. A high recall value means the model has a low number of false negatives and can accurately identify parasitic cells (Fig. 7). Precision, on the other hand, is slightly reduced as a consequence of the greater number of false positives. The number of false positives is greater because the dataset contains some non-parasitic images that are difficult to separate from infected cell images, causing the model to misclassify them. Fig. 8 displays a few examples of uninfected cell pictures incorrectly categorized as infected by the model. Similarly, a high AUC score of 0.98 is attained by the proposed TL-SGAN (Fig. 9), which means the model has a high magnitude of separability for infected and uninfected cell images.
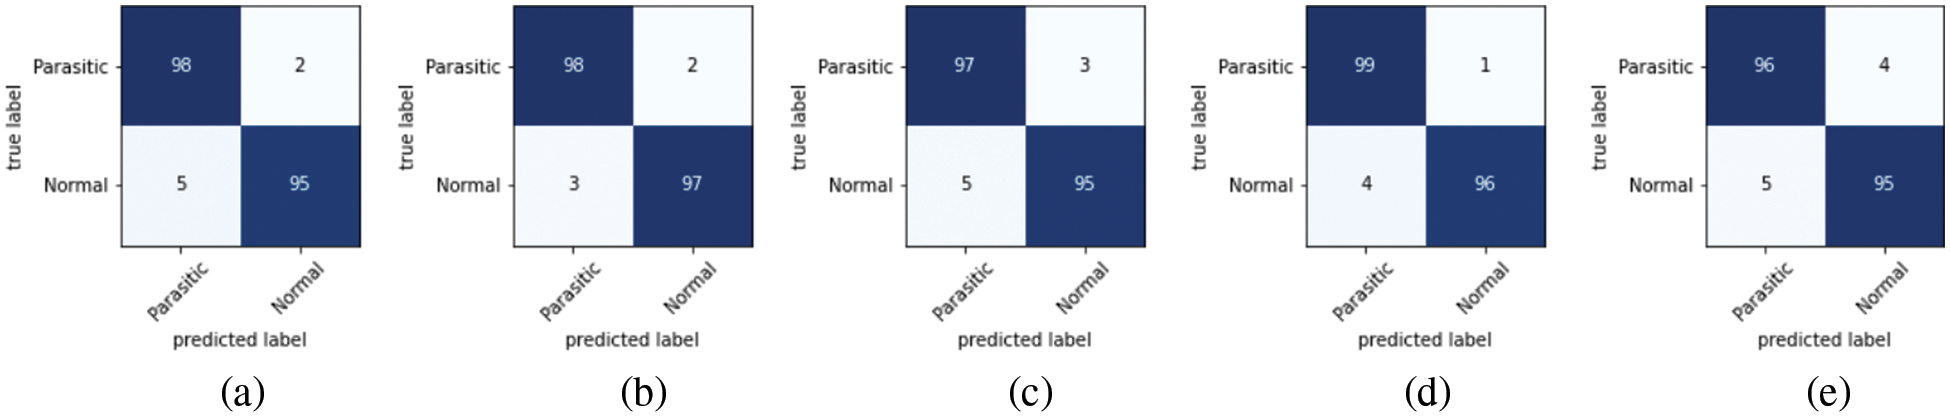
Figure 7: Confusion matrices: (a) Dateset-1 (b) Dateset-2 (c) Dateset-3 (d) Dateset-4 (e) Dateset-5
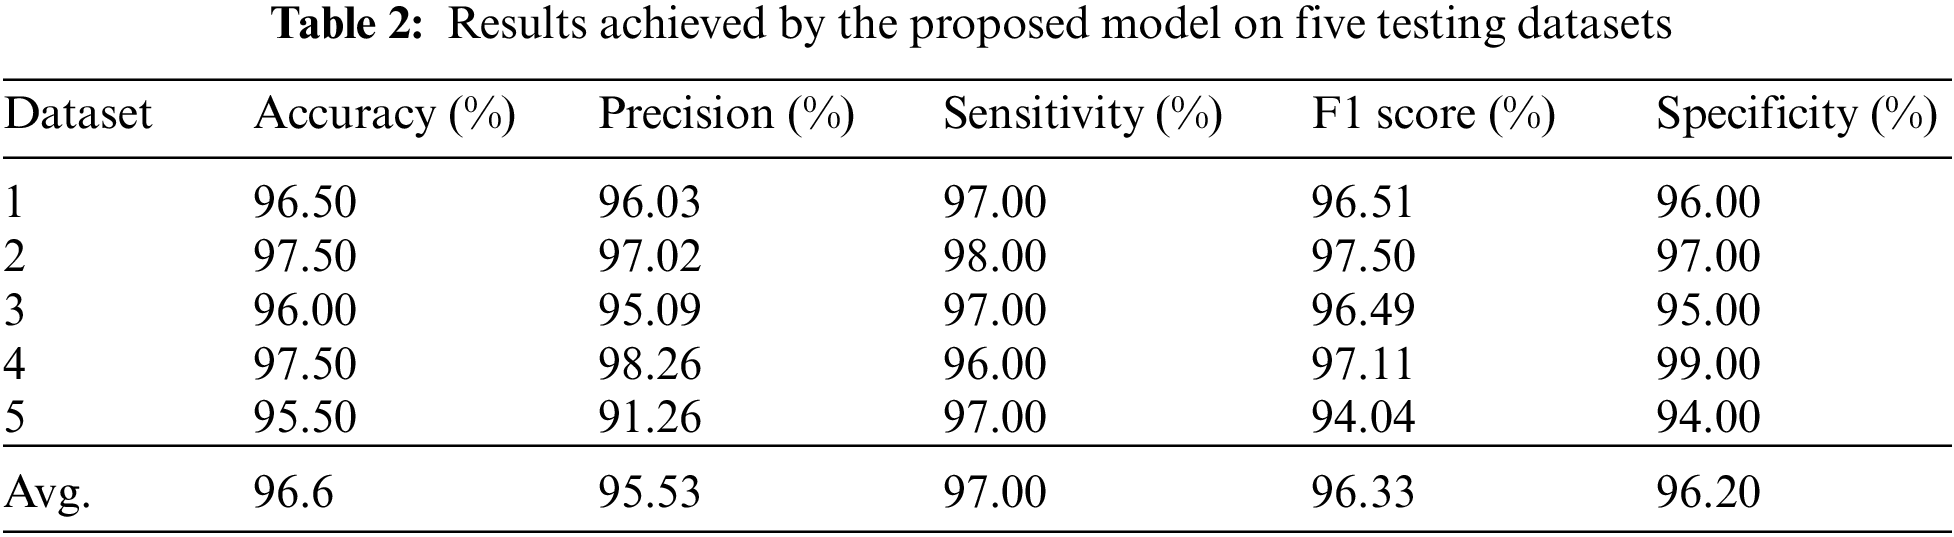
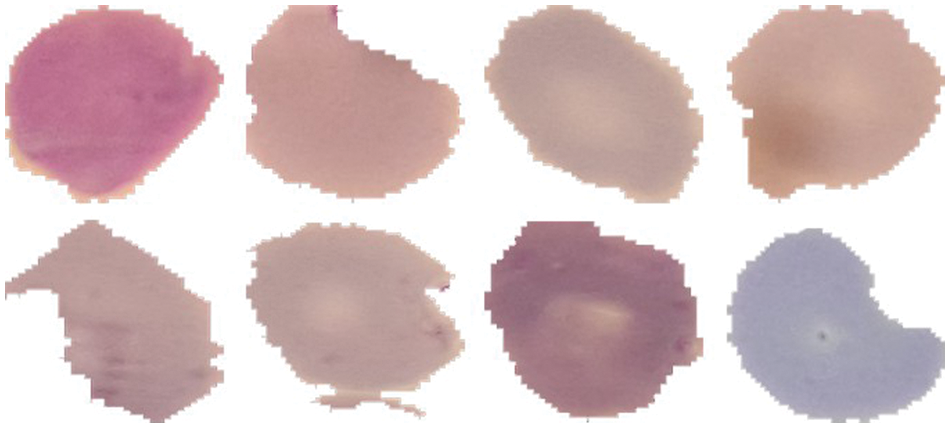
Figure 8: Misclassified uninfected cell images
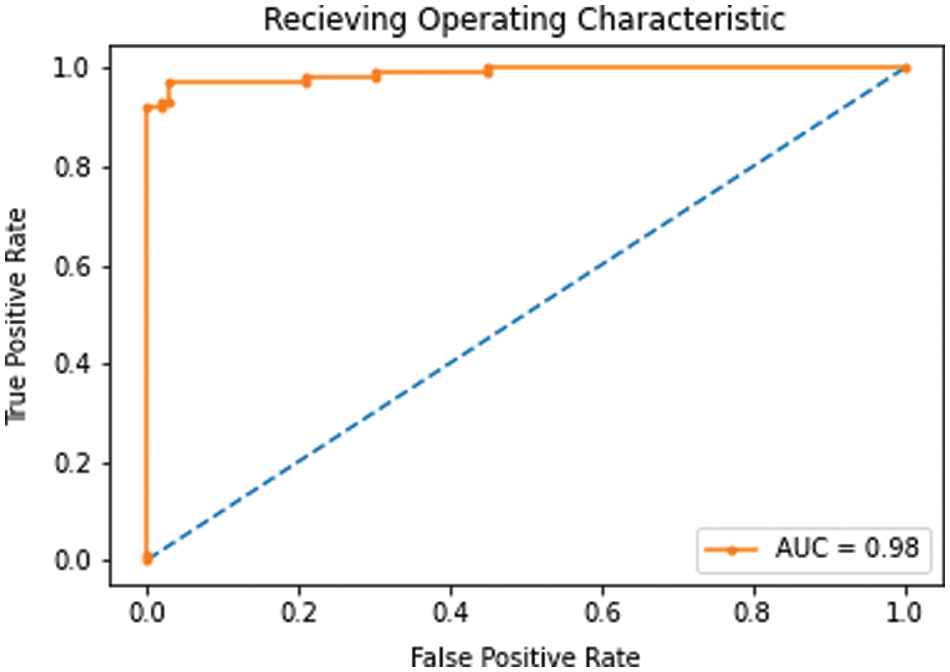
Figure 9: AUC-ROC
The proposed model is evaluated against some of the recent models in Table 3 that have utilized the same malaria dataset. Except the proposed model, all other models have used a large training data and have followed a supervised approach. Our TL-SGAN model with a small labeled data for training has achieved better results as compared to other models. Since it used a huge quantity of data for model training, the Squeeze and Excitation Network (SENet) has somewhat better accuracy (97%) than the proposed model [38]. They nearly tripled (82674 images) the size of the original dataset (27558 photos). SENet for malaria detection is computationally expensive and requires more training time than the suggested model because it uses such a huge number of images. The SGAN was trained from the ground up using the same number of photos as the proposed model. The SGAN trained from scratch not only took more time to train (as can be seen in Fig. 10) but also has led to over-fitting. This inference is based on the fact that SGAN (trained from scratch) achieved much higher training accuracy (98%) than the test accuracy (only 65%). In this case, the discriminator had a large number of trainable parameters against a small training data set, resulting in bad generalization performance.
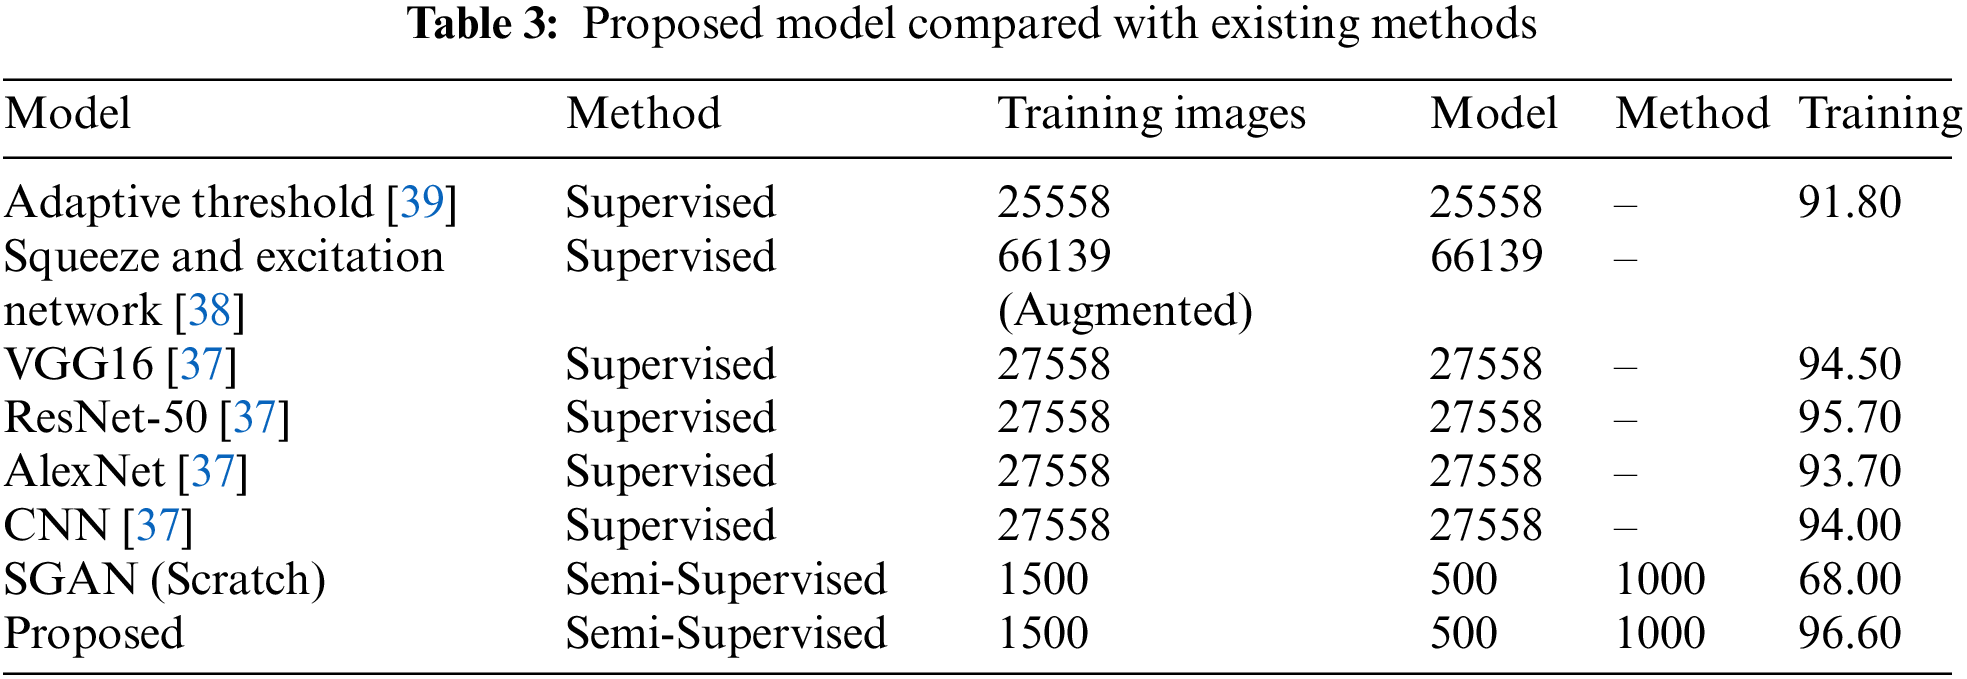
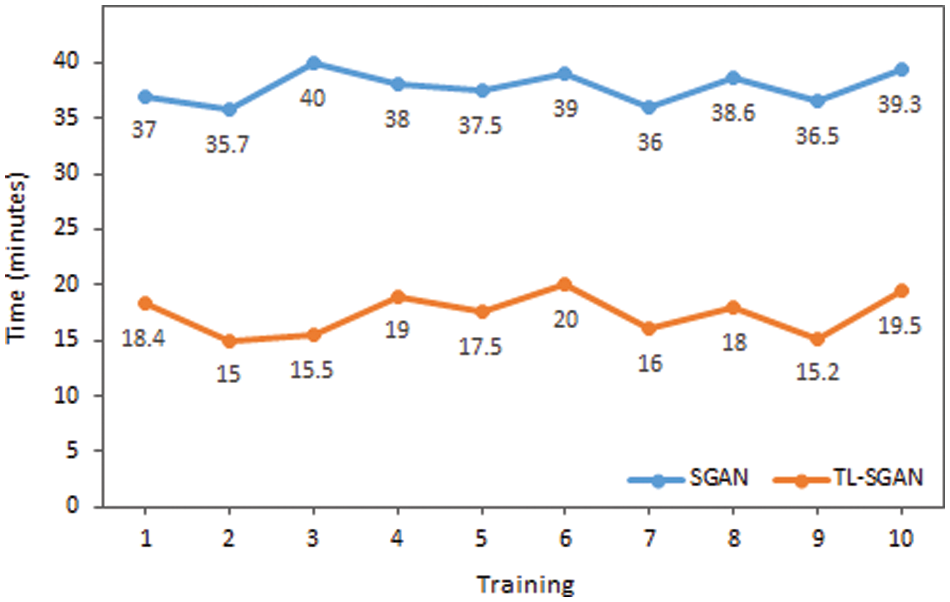
Figure 10: Time comparison of SGAN and TL-SGAN on ten different trainings
The impact on accuracy by changing the number of labeled images is also investigated. For this purpose, different numbers of labeled images (multiple of 50 up to 500) are used to train the model and then evaluated on the same testing dataset. The graph in Fig. 11 plots the number of labeled images against the mean accuracy of the model on five testing datasets. It was observed that even with 50 labeled images, accuracy of 81.34% is achieved, which is already acceptable for the given size of training data. As the number of labeled images is increased, the accuracy improved further. Initially, the slope of the accuracy curve is steep, slowing down and finally leveling off. Eventually, a peak accuracy of 96.6% is obtained with 500 labeled images.
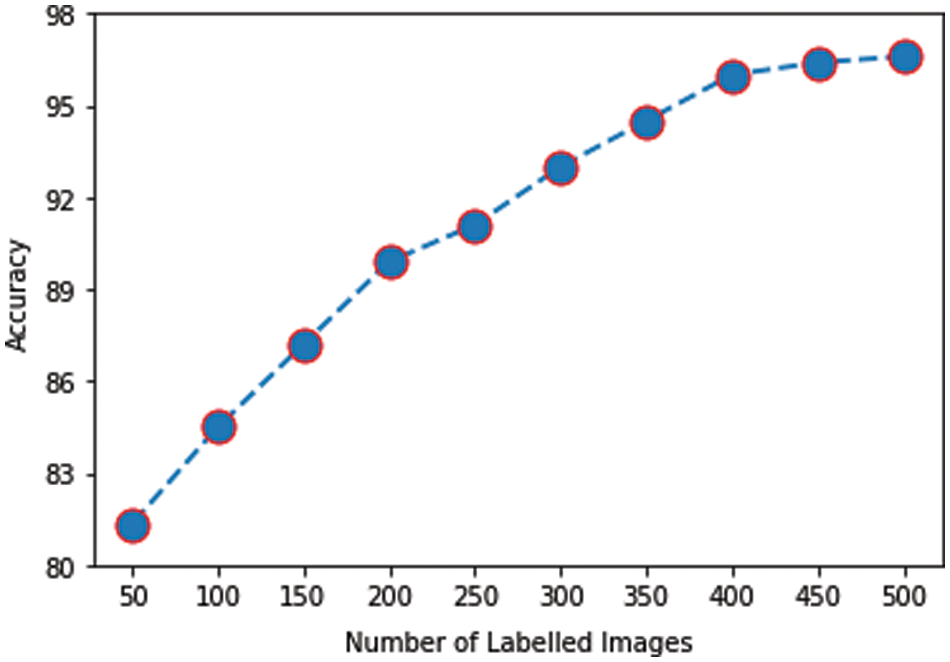
Figure 11: Labeled images vs. accuracy
This research aims to solve major medical image analysis issues, particularly in the automatic diagnosis of malaria. Malaria is automatically detected using TL and SGAN by classifying blood cell photos into infected and uninfected classes. Because the proposed model does not involve manual feature extraction and segmentation of microscopic images, it outperforms standard ML-based models for malaria detection. The deep CNN network (VGG16)’s convolutional and other hidden layers are strong enough to automatically extract essential features and distinguish infected cells from uninfected cells. DL models typically need a large amount of label data for training, which is very difficult to collect, particularly in the medical field. In this research paper, despite using small training data, accuracy of 96.6% is obtained for malaria detection. Similarly, the model is trained in a semi-supervised manner by annotating only a small portion of the training dataset. This semi-supervised approach is less depended on the medical experts and can overcome the problem of annotating all the images.
Our work is limited to the classification of healthy and Plasmodium falciparum-infected cells. In future work, the diagnosis of malaria and its treatment can be made even more effective by extending this research work to the detection and classification of malaria parasites into sub-classes. The identification of sub-types of Plasmodium will help the physicians in recommending a particular medicine and treatment plan. Moreover, the proposed methodology ability may be investigated on multi-class classification problems as well. Similarly, the VGG16 (discriminator) in the proposed model can be replaced by other pre-trained models such as ResNet, Inception, DenseNet, etc., successively. The diagnosis of malaria by the proposed model would improve if any other pre-trained model performs better than VGG16. The medical data can be noisy and can harm the performance of the model. The proposed methodology has not used any noise removal method as the data used in this research work does not have a high noise.
Author Contributions: The published version of the manuscript has been read and approved by all authors.
Funding Statement: The publication of this article is funded by the Qatar National Library. The authors would like to acknowledge the library for supporting the publication of this article.
Conflicts of Interest: The authors declare no conflict of interest.
References
1. World Health Organization, World malaria report 2020: 20 years of global progress and challenges, pp. 1–299, 2020. [Google Scholar]
2. E. Charpentier, E. Benichou, A. Pages, P. Chauvin, J. Fillaux et al., “Performance evaluation of different strategies based on microscopy techniques, rapid diagnostic test and molecular loop-mediated isothermal amplification assay for the diagnosis of imported malaria,” Clinical Microbiology and Infection, vol. 26,no. 1, pp. 115–121, 2020. [Google Scholar]
3. Z. Jan, A. Khan, M. Sajjad, K. Muhammad, S. Rho et al., “A review on automated diagnosis of malaria parasite in microscopic blood smears images,” Multimedia Tools and Application, vol. 77, no. 8, pp. 9801–9826, 2018. [Google Scholar]
4. M. I. Razzak, S. Naz and A. Zaib, “Deep learning for medical image processing: Overview, challenges and the future,” in N. Dey, A. Ashour, S. Borra (eds.Classification in BioApps. Lecture Notes in Computational Vision and Biomechanics, vol. 26, Berlin: Springer, pp. 323–350, 2018. [Google Scholar]
5. D. Shen, G. Wu and H. I. Suk, “Deep learning in medical image analysis,” Annual Review of Biomedical Engineering, vol. 19, no. 1, pp. 221–248, 2017. [Google Scholar]
6. Z. Hu, J. Tang, Z. Wang, K. Zhang, L. Zhan et al., “Deep learning for image-based cancer detection and diagnosis—a survey,” Pattern Recognition, vol. 83, no. 11, pp. 134–149, 2018. [Google Scholar]
7. J. Gu, Z. Wang, J. Kuen, L. Ma, A. Shahroudy et al., “Recent advances in convolutional neural networks,” Pattern Recognition, vol. 77, no. 11, pp. 354–377, 2018. [Google Scholar]
8. M. J. Afridi, A. Ross and E. M. Shapiro, “On automated source selection for transfer learning in convolutional neural networks,” Pattern Recognition, vol. 73, no. 2, pp. 65–75, 2018. [Google Scholar]
9. H. Malik, M. S. Farooq, A. Khelifi, A. Abid, J. N. Qureshi et al., “A comparison of transfer learning performance versus health experts in disease diagnosis from medical imaging,” IEEE Access, vol. 8, pp. 139367–139386, 2020. [Google Scholar]
10. M. Talo, U. B. Baloglu, O. Yildirim and U. R. Acharya, “Application of deep transfer learning for automated brain abnormality classification using MR images,” Cognitive Systems Research, vol. 54, no. C, pp. 176–188, 2019. [Google Scholar]
11. O. Yildirim, M. Talo, B. Ay, U. B. Baloglu, G. Aydin et al., “Automated detection of diabetic subject using pre-trained 2D-CNN models with frequency spectrum images extracted from heart rate signals,” Computers in Biology and Medicine, vol. 113, no. 11, pp. 1–10, 2019. [Google Scholar]
12. S. Khan, N. Islam, Z. Jan, I. U. Din and J. J. P. C. Rodrigues, “A novel deep learning based framework for the detection and classification of breast cancer using transfer learning,” Pattern Recognition Letters, vol. 125, no. 6, pp. 1–6, 2019. [Google Scholar]
13. I. D. Apostolopoulos and T. A. Mpesiana, “Covid-19: Automatic detection from X-ray images utilizing transfer learning with convolutional neural networks,” Physical and Engineering Sciences in Medicine, vol. 43, no. 2, pp. 635–640, 2020. [Google Scholar]
14. R. Jain, N. Jain, A. Aggarwal and D. J. Hemanth, “Convolutional neural network based Alzheimer’s disease classification from magnetic resonance brain images,” Cognitive Systems and Research, vol. 57, no. 2, pp. 147–159, 2019. [Google Scholar]
15. M. Rubin, O. Stein, N. A. Turko, Y. Nygate, D. Roitshtain et al., “TOP-GAN: Stain-free cancer cell classification using deep learning with a small training set,” Medical Image Analysis, vol. 57, pp. 176–185, 2019. [Google Scholar]
16. Y. Wang, C. Wu, L. Herranz, J. van de Weijer, A. Gonzalez-Garcia et al., “Transferring GANs: Generating images from limited data,” in V. Ferrari, M. Hebert, C. Sminchisescu, Y. Weiss (eds.Computer Vision-ECCV 2018. Lecture Notes in Computer Science, vol. 11210. Cham: Springer, pp. 220–236, 2018. [Google Scholar]
17. X. Yi, E. Walia and P. Babyn, “Generative adversarial network in medical imaging: A review,” Medical Image Analysis, vol. 58, no. 2, pp. 1–24, 2019. [Google Scholar]
18. I. Amin, S. Hassan and J. Jaafar, “Semi-supervised learning for limited medical data using generative adversarial network and transfer learning,” in ICCI, Bandar Seri Iskandar, Malaysia, pp. 5–10, 2020. [Google Scholar]
19. D. K. Das, M. Ghosh, M. Pal, A. K. Maiti and C. Chakraborty, “Machine learning approach for automated screening of malaria parasite using light microscopic images,” Micron, vol. 45, no. 6, pp. 97–106, 2013. [Google Scholar]
20. D. Yang, G. Subramanian, J. Duan, S. Gao, L. Bai et al., “A portable image-based cytometer for rapid malaria detection and quantification,” PLoS One, vol. 12, no. 6, pp. 1–18, 2017. [Google Scholar]
21. L. Rosado, J. M. C. da Costa, D. Elias and J. S. Cardoso, “Automated detection of malaria parasites on thick blood smears via mobile devices,” Procedia Computer Science, vol. 90, no. 1, pp. 138–144, 2016. [Google Scholar]
22. H. A. Mohammed and I. A. M. Abdelrahman, “Detection and classification of malaria in thin blood slide images,” in Proc. ICCCCEE, Khartoum, Sudan, pp. 1–5, 2017. [Google Scholar]
23. H. S. Park, M. T. Rinehart, K. A. Walzer, J. T. A. Chi and A. Wax, “Automated detection of P. falciparum using machine learning algorithms with quantitative phase images of unstained cells,” PLoS One, vol. 11, no. 9, pp. 1–19, 2016. [Google Scholar]
24. M. Suriya, V. Chandran and M. G. Sumithra, “Enhanced deep convolutional neural network for malarial parasite classification,” International Journal of Computers and Applications, vol. 41, pp. 1–10, 2019. [Google Scholar]
25. N. Singla and V. Srivastava, “Deep learning enabled multi-wavelength spatial coherence microscope for the classification of malaria-infected stages with limited labelled data size,” Optics and Laser Technology, vol. 130, no. 2, pp. 1–7, 2020. [Google Scholar]
26. D. Bibin, M. S. Nair and P. Punitha, “Malaria parasite detection from peripheral blood smear images using deep belief networks,” IEEE Access, vol. 5, pp. 9099–9108, 2017. [Google Scholar]
27. J. Hung and A. Carpenter, “Applying faster R-CNN for object detection on malaria images,” in Proc. CVPRW, Honolulu, HI, USA, pp. 56–61, 2017. [Google Scholar]
28. A. Vijayalakshmi and R. Kanna, “Deep learning approach to detect malaria from microscopic images,” Multimedia Tools and Applications, vol. 79, no. 21–22, pp. 15297–15317, 2020. [Google Scholar]
29. R. Nakasi, E. Mwebaze, A. Zawedde, J. Tusubira, B. Akera et al., “A new approach for microscopic diagnosis of malaria parasites in thick blood smears using pre-trained deep learning models,” Applied Science, vol. 2, no. 7, pp. 1–7, 2020. [Google Scholar]
30. M. Umer, S. Sadiq, M. Ahmad, S. Ullah, G. S. Choi et al., “A novel stacked CNN for malarial parasite detection in thin blood smear images,” IEEE Access, vol. 8, pp. 93782–93792, 2020. [Google Scholar]
31. E. Hassan, M. Y. Shams, N. A. Hikal and S. Elmougy, “A novel convolutional neural network model for malaria cell images classification,” Computers, Materials & Continua, vol. 72, no. 3, pp. 5889–5907, 2022. [Google Scholar]
32. P. A. Pattanaik, M. Mittal, M. Z. Khan and S. N. Panda, “Malaria detection using deep residual networks with mobile microscopy,” Journal of King Saud University-Computer and Information Sciences, vol. 34, no. 5, pp. 1700–1705, 2022. [Google Scholar]
33. M. Poostchi, K. Silamut, R. J. Maude, S. Jaeger and G. Thoma, “Image analysis and machine learning for detecting malaria,” Translational Research, vol. 194, no. 6_Suppl, pp. 36–55, 2018. [Google Scholar]
34. M. A. Greischar, S. E. Reece, N. J. Savill and N. Mideo, “The challenge of quantifying synchrony in malaria parasites,” Trends in Parasitology, vol. 35, no. 5, pp. 341–355, 2019. [Google Scholar]
35. K. Simonyan and A. Zisserman, “Very deep convolutional networks for large-scale image recognition,” in ICLR, San Diego, CA, USA, 2015. https://arxiv.org/abs/1409.1556. [Google Scholar]
36. T. Salimans, I. Goodfellow, W. Zaremba, V. Cheung, A. Radford et al., “Improved techniques for training GANs,” in Proc. NIPS, Barcelona, Spain, pp. 2234–2242, 2016. [Google Scholar]
37. S. Rajaraman, S. K. Antani, M. Poostchi, K. Silamut, M. A. Hossain et al., “Pre-trained convolutional neural networks as feature extractors toward improved malaria parasite detection in thin blood smear images,” PeerJ, vol. 6, no. 6, pp. 1–17, 2018. [Google Scholar]
38. S. P. Singh, P. Bansal, S. Kumar and P. Shrivastava, “Malaria parasite recognition in thin blood smear images using squeeze and excitation networks,” in Proc. CICT, Allahabad, India, pp. 1–5, 2019. [Google Scholar]
39. T. Fatima and M. S. Farid, “Automatic detection of Plasmodium parasites from microscopic blood images,” Journal of Parasitic Diseases, vol. 44, no. 1, pp. 69–78, 2020. [Google Scholar]
Cite This Article
 Copyright © 2023 The Author(s). Published by Tech Science Press.
This work is licensed under a Creative Commons Attribution 4.0 International License , which permits unrestricted use, distribution, and reproduction in any medium, provided the original work is properly cited.
 Downloads
 Citation Tools