
 Submit a Paper
 Propose a Special lssue
 Open Access
ARTICLE

Energy Theft Detection in Smart Grids with Genetic Algorithm-Based Feature Selection
1 Faculty of Information Technology, University of Central Punjab, Lahore, 54590, Pakistan
2 DAAI Research Group, Department of Computing and Data Science, School of Computing and Digital Technology, Birmingham City University, Birmingham B4 7XG, UK
3 Faculty of Computer and Information Systems, Fayoum University, 63514, Egypt
4 Khaybar Applied College, Taibah University, Saudi Arabia
* Corresponding Author: Muhammad Umair. Email:
Computers, Materials & Continua 2023, 74(3), 5431-5446. https://doi.org/10.32604/cmc.2023.033884
Received 30 June 2022; Accepted 03 October 2022; Issue published 28 December 2022
 View Full Text
 Download PDF
Abstract
As big data, its technologies, and application continue to advance, the Smart Grid (SG) has become one of the most successful pervasive and fixed computing platforms that efficiently uses a data-driven approach and employs efficient information and communication technology (ICT) and cloud computing. As a result of the complicated architecture of cloud computing, the distinctive working of advanced metering infrastructures (AMI), and the use of sensitive data, it has become challenging to make the SG secure. Faults of the SG are categorized into two main categories, Technical Losses (TLs) and Non-Technical Losses (NTLs). Hardware failure, communication issues, ohmic losses, and energy burnout during transmission and propagation of energy are TLs. NTL’s are human-induced errors for malicious purposes such as attacking sensitive data and electricity theft, along with tampering with AMI for bill reduction by fraudulent customers. This research proposes a data-driven methodology based on principles of computational intelligence as well as big data analysis to identify fraudulent customers based on their load profile. In our proposed methodology, a hybrid Genetic Algorithm and Support Vector Machine (GA-SVM) model has been used to extract the relevant subset of feature data from a large and unsupervised public smart grid project dataset in London, UK, for theft detection. A subset of 26 out of 71 features is obtained with a classification accuracy of 96.6%, compared to studies conducted on small and limited datasets.Keywords
The growth of the population has led to increasing consumerism which posed a significant challenge for utility provisions such as the electric industry. A critical change in the past decade is the Smart Grid (SG) construction. The SG was introduced to improve the operational efficiencies of the conventional power grid. The traditional electrical system made it difficult to track how electricity was consumed daily in the houses because there was no communication. Due to this unawareness of how much energy we were using until a sizable bill showed up in the mailbox, it was simple to waste it unknowingly. By burning so much additional energy in the power plants, unintentional energy wastage released the hazardous greenhouse gas emissions brought on by burning fossil fuels. Wasted energy leads to excess pollution and harmful health effects, disproportionately affecting communities that practice environmental justice. In Fig. 1, the detailed architecture of a modern SG can be seen, which shows how it is a two-way system, where any unused energy is propagated back into the electric supply or can be rerouted elsewhere where it is needed. However, this has increased the risk of data security breaches and cyber-attacks [1]. The unused energy is routed back to the distributed station, which further en-routes it to needy consumers.
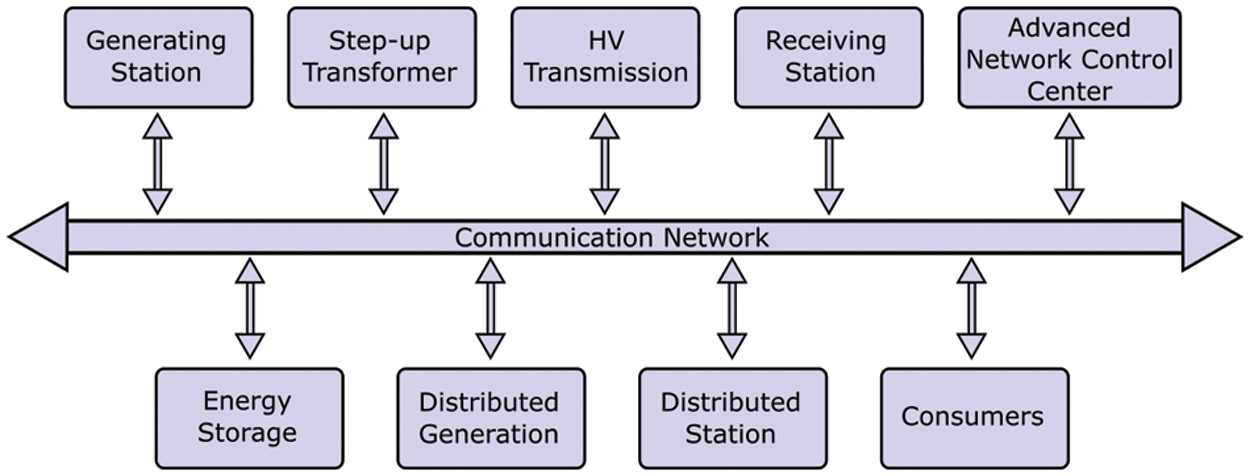
Figure 1: Working of a smart grid system
The concept of SG comprises a large amount of real-time data transmission on semi-open network structures. Such transmission makes it vulnerable to theft as data tempering becomes easier on the metering system from any available public network. Many statistical studies show that electricity theft in many developed countries reaches billions of dollars. E.g., the US suffers almost 6 billion USD in electricity theft [2,3]. Such theft has consequently inhibited the growth and development of SG. To avoid such losses in the SG, they are categorized into two major kinds, technical losses (TLs) and non-technical losses (NTL). TLs are the ohmic losses in the transmission and distribution lines due to faulty infrastructure and resistance. NTLs are where everything in the infrastructure works perfectly per design, but faults occur due to external tampering or fraud. So, it can be seen that the NTLs are energy theft-based losses, whereas the TLs are not due the energy theft. Theft of energy is the most commonly occurring non-technical loss, and the non-technical nature of this problem makes it very tricky for providers to detect and analyze the causes and the responsible parties for theft. The main challenge in SGs is hardware requirements, security, and data privacy.
The primary motivation to drive the proposed research work is to minimize the NTLs in the SG structure by detecting the most compromised areas of supply. For the detection of areas that causes the leak and fraud, various models are currently working, such as evolutionary computing is in use. However, here is a big room to enhance the system’s overall capacity. The proposed model is based on the ideas of computational intelligence and big data analysis to detect fraudulent customers based on their load summary. This research is focused on a solution that uses a hybrid Support Vector Machine (SVM) using optimized features subset from a large dataset of unsupervised SG data gathered as a result of the Genetic Algorithm (GA). Hence, it is a hybrid approach of GA and SVM, which is used to get a relevant subset of data from a large and unsupervised dataset of a public SG project in London, UK. The proposed model successfully achieved the feature subset of 26 out of 71 features, resulting in a classification accuracy of 96.6% on this dataset. The main contributions of this research are as follows:
i) Data pre-processing and identification of different load clusters in the London SG dataset.
ii) Development of feature selection and classification model.
iii) Highlighting important features for theft detection in the dataset.
iv) Classification of fraudulent and non-fraudulent customers.
TLs usually comprise network intrusion, false data injection, and electricity theft. Network intrusion is one of the widely studied non-technical losses. Three main kinds of techniques for detection techniques were discovered signature-based, anomaly-based, and specification-based.
A contextual anomaly framework was used for Big Sensor Data systems such as the one used in an SG [4]. It was proposed as a real-time point anomaly detection with a well-defined algorithm based on a sensor profile generated by a multivariate clustering algorithm. Another proposed technique was the compressive sensing theory for an anomaly detection algorithm. The anomaly detection algorithm was based on wavelet packet transform, and a statistical process control theory was subsequently deduced [5,6] Overall, fault detection in big data applications has been a hot topic in the last decade [7]. One such discussion was elaborated in [8], where the author targeted the problem of theft that results from privacy issues in data. In this work, the author used a P2P (peer-to-peer) computing approach to detect honest users from fraudulent users. It was somewhat successful in detecting users’ anomalous behavior; however, this method’s computing complexity was very high and hence not suitable for real-time data.
Similarly, a top-down approach using decision trees has been used in [9], where decision trees are used for a rigorous analysis of the data produced by the smart meter. This method was somewhat of an improvement compared to the last ones since it was practical enough to be implemented in real-time and reasonably accurate on large-scale data. Another similar work was proposed in [10], where the attack tree-based model was introduced to detect the theft behaviors in the data. It presented a novel idea that was based on the needs. There can be three ways for theft detection, namely divided into the following categories; Classification based, State–estimation based, and Game theory-based. An even better approach, if a very complex one, was used in [11,12]. The paper investigated the presently trending False Data Injection (FDI) attack. This was performed by utilizing the introduction of the combined sum of energy profiles and its attack in a well-organized manner in coordinated manner on a certain number of customers and their smart meters, which shows a lowered figure of energy consumption for the attacker as opposed to a higher reading for the neighborhood. An integrated data storage can be seen as a distinct node connecting only with the data collector node. Therefore, the authors used the Naive Bayes Classifier to catch the impending black-hole hits, which stems from the Bayes theorem. In [13], an intrusion detection framework for advanced metering infrastructure (AMI), which also used the anomaly detection technique, was studied. The architecture of the said model was comprised of various individual IDS modules that were kept at different locations in HANs (Home Area Network), NAN (Neighborhood Area Network), and WAN (Wide Area Network). Correspondingly, if an IDS module comes across a possible threat, then an associated notification will be delivered to the system administrator of AMI. Also, a principle IDS module sums up and studies the future alarms that may be generated by the different IDS modules [14,15]. All how fraudulent or adversary parties can attack the AMI system of the SG are discussed in [16], as the AMI is a key component for SGs. Energy data usage was manipulated, and penetration testing was performed on the commodity devices. This paper highlighted a number of ways in which AMI can be tampered with, especially data-driven theft techniques. Hence, it proved to help for future research by laying out different ways in which theft is done and paved the way for some better methods for theft detection.
Similarly, electricity theft is also categorized as a non-technical loss since it is human-induced. For example the energy theft has become a recurrent problem in traditional power systems. Utility companies in the United States face a loss of around 6 billion dollars annually due to energy theft to this problem [17,18]. In the past few years, the SG was introduced as an innovative electrical grid to upgrade the conventional grids to make power delivery more reliable, economical, and sustainable [19]. A standout feature amongst the SG is the substitution of ordinary simple mechanical meters for advanced meters, often called “smart meters”.
Smart meters, equipped with recording user consumption data because of their communication architecture, can give a two-way correspondence between unit commitment (UC) and customers, encouraging effective power framework control and observation [20]. In contrast, the mechanical meters, which may be physically altered, smart meters are not protected against network attacks, which may make energy theft simpler to carry out and subsequently become a significantly increasingly significant issue in SGs. Therefore, it has become increasingly crucial to develop methodologies that can be efficient as well as scalable methods that can help in theft detection. Before studying theft detection in SGs, it is essential to shedding some light on the work done for fault detection using data-driven techniques [21]. One of the earliest non-technical fault detections was used in mechanical big data and process manufacturing. Since the advent of SGs, there has been constant research on resolving TLs and NTL, such as theft. The work done in security and network security for TLs, inadvertently paved the path for the research on energy theft [22]. In [23], the discussion was done where the author targeted the problem of theft that results from privacy issues in data. In this work, the author used a P2P (peer-to-peer) computing approach to detect honest users from fraudulent users. It was somewhat successful in the detection of the anomalous behavior of users at the cost of high computational complexity.
FDI attacks were investigated in another way by using the overall sum of energy attacks in a way upon many customers’ smart meters, which would give a lower bill value for the hacker or attacker and a higher bill value for someone whose energy got stolen. The research model was a “one type” change problem that paved the way to decrease the frequency of attacked meters based on the parity of an aggregated load to evade detection. A hybrid detection framework was proposed to check malicious activities by integrating an algorithm for grid sensor placement along with observability analysis to increase the rate of detection [24]. This work could be used to improve the network observability and detection accuracy, which was made even better by the grid-placed sensor deployment. However, this was a hardware-based approach to an extent and did not address the huge amount of data vulnerable to attacks. Another efficient method to detect energy fraud using ICT was presented in [25], which involved the disposition of smart meters by using the matrix pencil approach, but it was a costly solution, albeit a novel one.
Along with the stated approaches, scholars have explored various techniques for theft detection. In [26–28], fuzzy classification, rough set theory and SVM were used to recognize anomalies in customer usage patterns. The fuzzification of features could be a cumbersome task. Rough sets gave rise to a high false positive rate, and the SVM scheme was not attractive due to the manual data collection of the customers.
In [29], Particle Swarm Optimization (PSO) was employed for feature selection in intrusion detection. Similarly, Ant Colony Optimization (ACO) was employed for feature reduction in face recognition problems [30]. Both methods, PSO and ACO, have high computational complexity. In [31], the total electricity cost was minimized in SGs with short-term time averaged electricity cost as an objective function in GA. Another aspect of theft detection with feature engineering in SGs is presented in [32] using the GA. The dataset used was based on 4000 household records. Besides evolutionary methods, the principle component analysis and mean shift algorithm were employed in [33] for residential consumers’ power theft detection. Another approach using the hybrid approach based on convolutional neural networks and Random Forests was proposed in [34]. Another framework based on Neural Networks, SVM, was proposed for anomaly detection in [35,36]. The computational complexity of such methods is relatively high. However, the number of false positives decreased when all these irregularities were studied and combined with various other parameters to identify theft and thieving customers successfully.
In all this research, many techniques have been put forward for detecting electricity theft in SGs. However, most of these can only offer a solution for very few customers, and the detection accuracy is not as high as ideally desired. However, a limited set of paraments and the high number of false positives limit the application of these solutions.
This section presents the proposed methodology for identifying anomalous and falsely injected data to identify electricity theft and to recognize the parameters that set typical SG Data apart from malicious data injected for energy theft. The main aim here is to employ the techniques of computational intelligence that can be used in big data analysis and help detect erroneous data. Fig. 2 shows the proposed system architecture. A thorough explanation of the architecture is as follows.
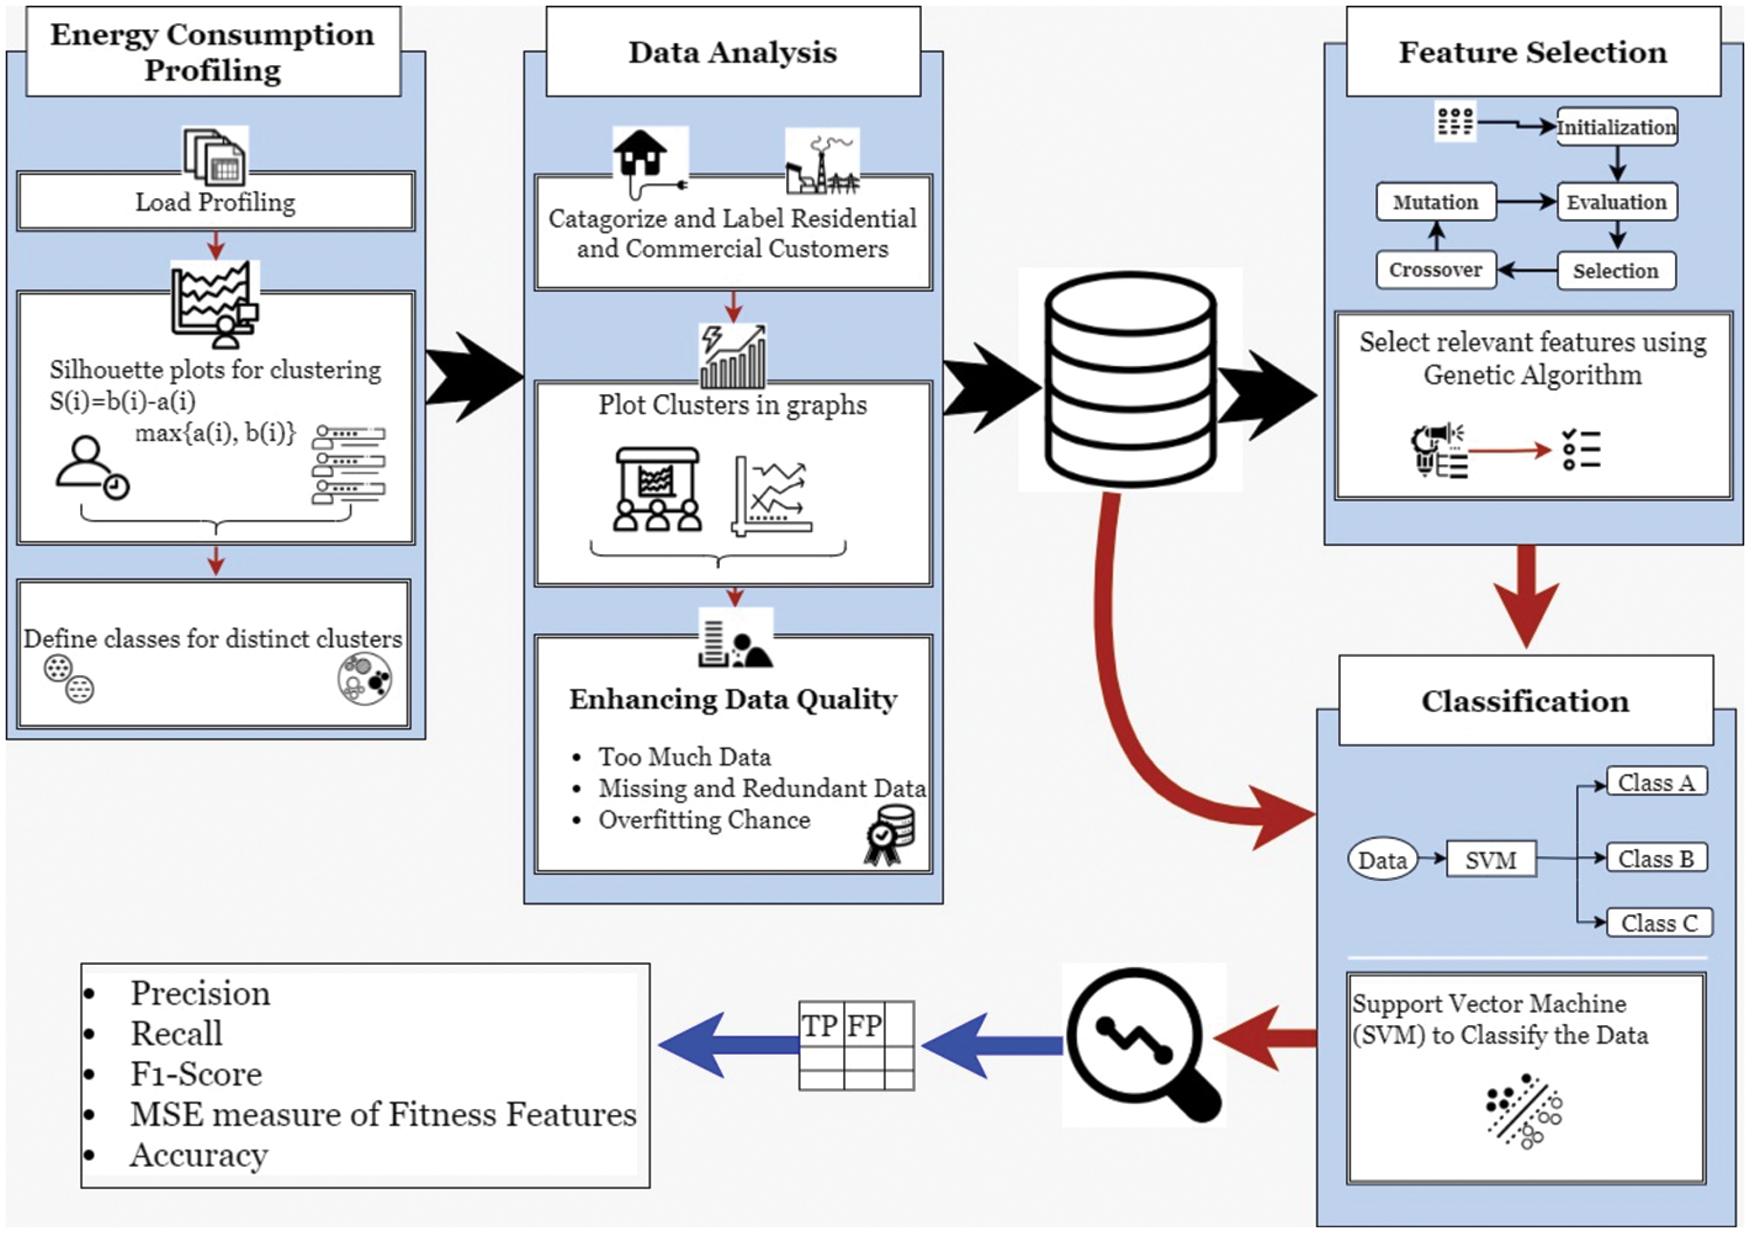
Figure 2: System architecture for feature selection and classification
3.1 Energy Consumption Profiling
Since this is a data-driven model, a thorough analysis of the consumers’ load profile and energy consumption was performed. There were three major categories of customers, industrial, commercial and residential. The load profiles of residential and commercial users were analyzed.
The residential and commercial customer average energy consumption should fall, as illustrated in Tables 1 and 2, respectively. The main aim here is to analyze the percentage losses that occur after factoring in distribution losses of 3%–5%. The dataset was divided into clusters for better analysis and pre-processing.
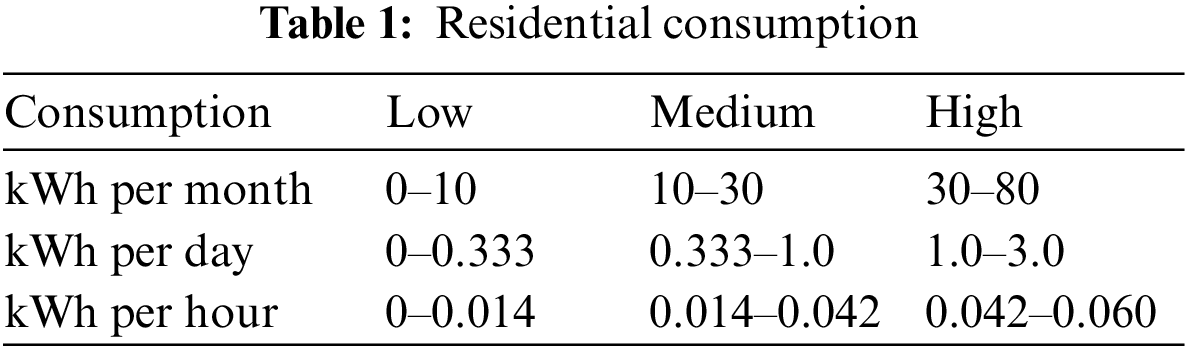
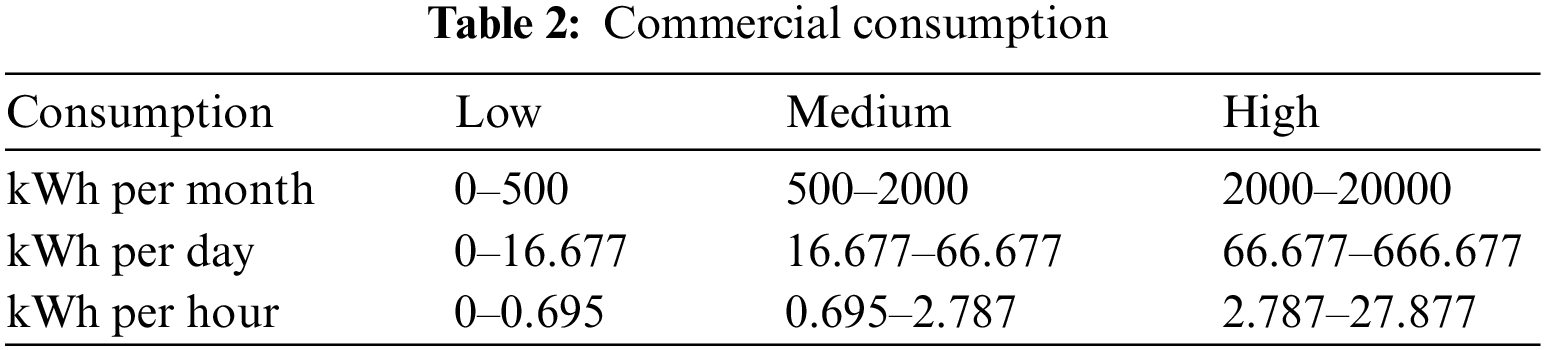
Fig. 3a shows the expected regular consumption and the number of days for three residential customers. This depicts three non-fraudulent customers, C1, C2, and C3, in residential areas and how their energy consumption remains constant for over a month. The Fig. 3b shows that three residential customers, C1, C2, and C3, involved in electricity theft are using abnormally large amounts of electricity in the given time frame; not only that but there is no regularity at all in the usage, which shows that electricity distribution is tempered.
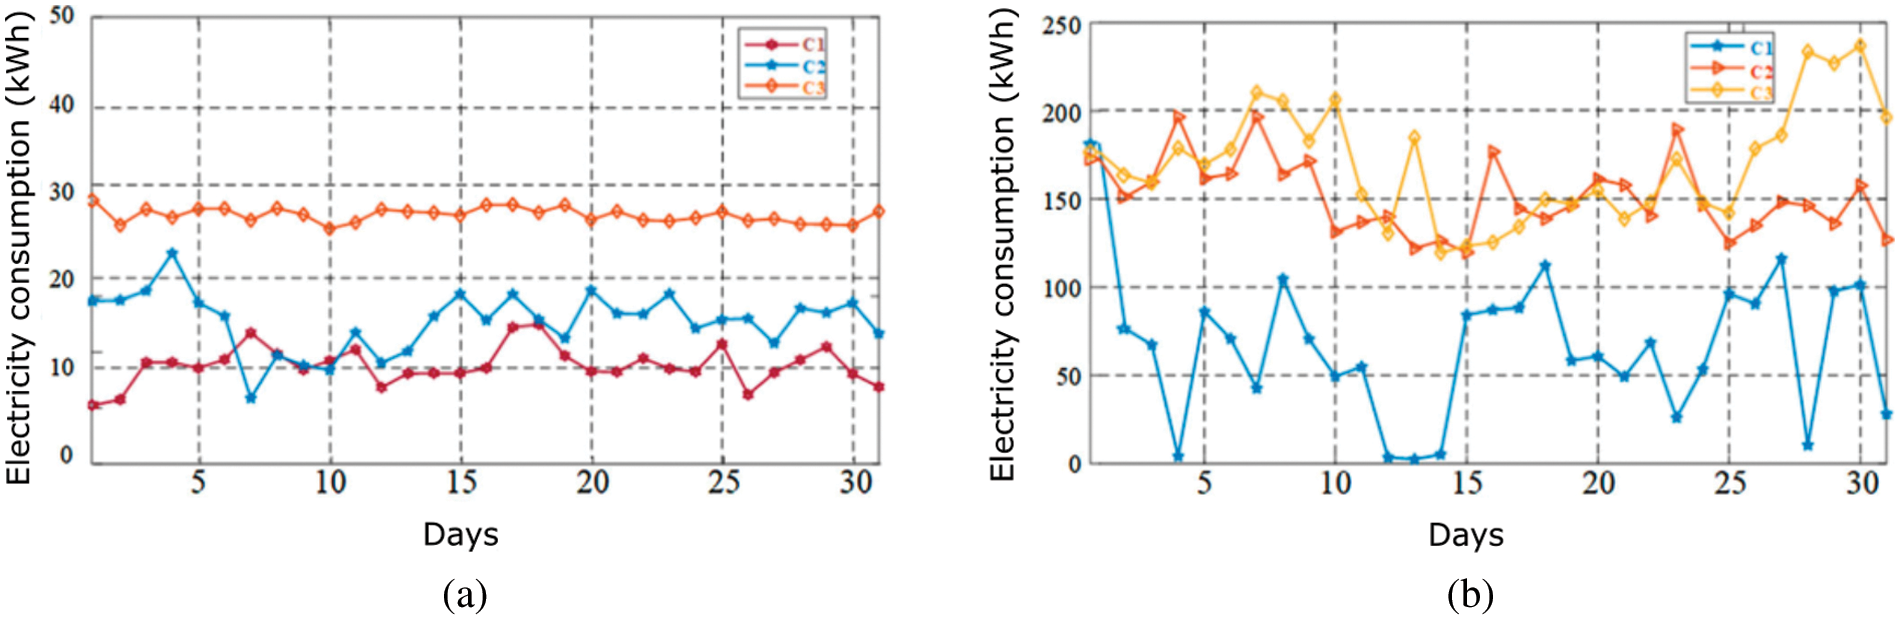
Figure 3: Electricity consumption across 30 days. (a) Expected consumption for three non-fraudulent residential customers (b) Actual consumption for three non-fraudulent residential customers
The Silhouette plot shows the closeness of each point in a single cluster with the neighboring cluster points in the range of [−1,1]. Assume that the data have been separated into k clusters with each sample being a sample
Then the silhouette value
The average of
The case is marked as anomalous or fraudulent if any customer or electrical company faces losses exceeding a set threshold. The proposed study considers three different behaviors of a fraudulent customer. The explanation of each type of fraud is as below:
i) Energy consumption must follow the approximate consumption pattern as illustrated for the customer. However, those customers who do not follow such consumption patterns are categorized as category C.
ii) If zero consumption is read for more than two hours in 24 h, such customers are categorized as category B customers.
iii) It may have more than six individual zero-energy consumption inputs while displaying any zero-energy consumption repetitions. However, the customers with such behavior were categorized as category A customers.
The above rules were generally applied, and customers that fall into the above categories were inspected [2].
3.2 Feature Selection and Classification
When working with fault and outlier detection, a focus on dataset features is imperative since it helps to understand what features classify as standard data and what features would classify as abnormal. Feature selection algorithms reduce the number of input variables, thus reducing the complexity of prediction models. These models are of two types: the first one is feature ranking, and the other one is set selection. Feature ranking deletes all the features that do not have an appropriate score. The best set of features from all possible features is searched in feature selection. Feature selection is the method employed in this research. However, before training data, only the smallest set of features that leads to the highest accuracy are kept, and irrelevant features are discarded.
GA is used for the feature selection on the original feature set, and the best feature selected by GA is used by SVM for anomalous data detection. Fig. 4 shows the basic framework proposed in this methodology, which illustrates how the large dataset with many redundant or non-important features will be optimized. In the proposed method, supervised feature selection filters out the dataset’s irrelevant and redundant features. A target feature is defined, and the features that do not contribute much to the target value or do not cause a huge variance in the target are removed. In this case, individual features are the genes, and any chromosome is a candidate set of features. Each chromosome in the “population” is ranked on fitness solution, on a fitness score, which is a model performance in this case. The fittest chromosome will be selected (survive) and reproduce, repeating until the population converges on a solution after some generations.
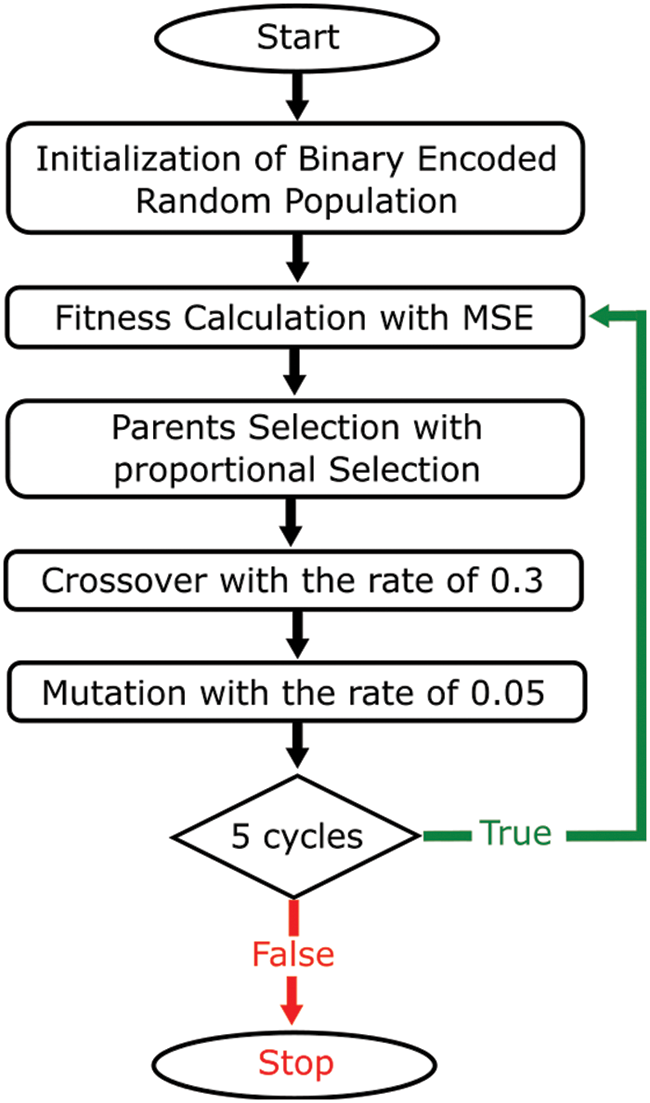
Figure 4: Propose hybrid GA and SVM-based methodology for feature selection and classification
Below are the steps taken for feature selection using GA:
i. Initialization of Binary Encoded Population: Binary encoding for inclusion and exclusion of features is carried out to ensure that the data fits into the GA model. This is also done to avoid any categorical attribute whose values may not be all present in the train and test data. The random exclusion of features initializes the population of chromosomes. Eq. (2) represents the initial population matrix С on ith iteration where i ≥ 0.
The
ii. Fitness Calculation with MSE: For the fitness function, the ‘fitness’ of a chromosome will be gauged by using Mean Square Error (MSE). In this model, the model is built using build using independent variables and predicting particular dependent or target variables. Since the dependent variable is numeric in the case of electricity usage, the linear regression model is used to predict it. In the linear regression model for fitness function, MSE for the line is calculated as the average of the sum of squares for all data points. In short, the best fit is considered for the line that gives minimal MSE. The fitness values are represented by
The K-fold cross-validation technique was used to set a benchmark of accuracy for our algorithm, avoid over-fitting, and provide the best estimate of the GA model. This helps in selecting the parent chromosome for the next generation.
iii. Parents Selection with Proportional Selection: The next step is parent selection, in which the best chromosomes with high fitness values are selected as parents for the crossover.
iv. Crossover: The genes are selected from random parent chromosomes for a crossover with a probability of 0.3. However, it is advised to avoid large probabilities since this will create chromosomes with almost all features excluded.
v. Determining whether mutation will be done: Mutation of the chromosomes is the last operation to be performed. A chromosome is adjusted in order not to converge to a local optimum too quickly. The change involves randomly excluding a feature with a small probability. This is not a mandatory step but is used for large datasets in this research or is advised if the number of iterations increases as well. In this work, the mutation is carried out with the probability of 0.05 in the subsequent four iterations to prevent it from converging too quickly.
vi. Stopping criteria: The algorithm is executed for five iterations to get the optimal results. The fittest chromosomes are printed onto the console and exported to an excel file after the GA terminates.
Being a supervised machine learning algorithm, SVM is extensively used for classification and regression problems. It becomes pretty powerful due to its kernel trick. The kernel trick is used to transform the data to a higher dimension, and then along the guidelines of the transformations, it calculates an optimal boundary between all the possible outputs. Below is the step-by-step explanation of SVM classification:
i. Weighting the classes: To get a more emphasized decision boundary, the data sample is first weighted using the ‘sample_weight’ function of the ‘NumPy’ classifier in Python. The calculation of each class’s weights was derived. This was done by dividing the total number of classifier samples by the individual class samples, after which the class weights were multiplied by 100 to get good weight ratios for SVM training.
ii. Selection of Optimal Parameters for SVM: The optimum classification accuracy of the SVM classifier was estimated by optimizing the linear kernel parameter and the error penalty parameter. The Linear kernel is easily adjustable for both multidimensional and two-dimensional data due to its ease of use. The classification procedure requires the experiment to select the right value of γ, a suitable value of the cost function C, and the kernel function. The linear kernel function was used in this work. These parameters are crucial for results and depend directly on the rules and type of training data.
iii. Cross Validation (CV) Accuracy: For every pair of (C, γ), the validation was performed on 67% training and 33% testing data. The evaluation started at a γ value of 0.010 to 35.0. The best classification is gotten at a γ value of 25.20, with a probability of ‘1’, and for a linear kernel function. The iteration is repeated 200 times with a 10-fold CV, and training/testing data are selected randomly. The 10-fold CV was selected to ensure that the classifier did not overfit the data. The optimal parameters obtained the highest 10-fold CV training accuracy of 99.7%. The accuracy of the SVM classifier is calculated using the following expression:
where
iv. Output Visualization on Hyperplane: SVM results in hyper-plane graphs are shown in Fig. 6. However, for a more readable form, a confusion matrix (Fig. 7) is generated, and results can be viewed.
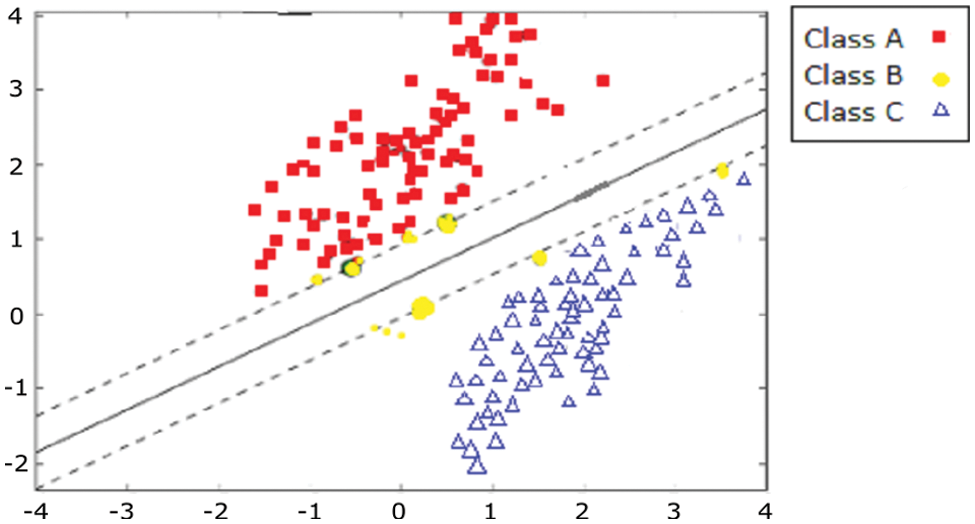
Figure 6: SVM classification for the three highlighted classes of Section 3.1
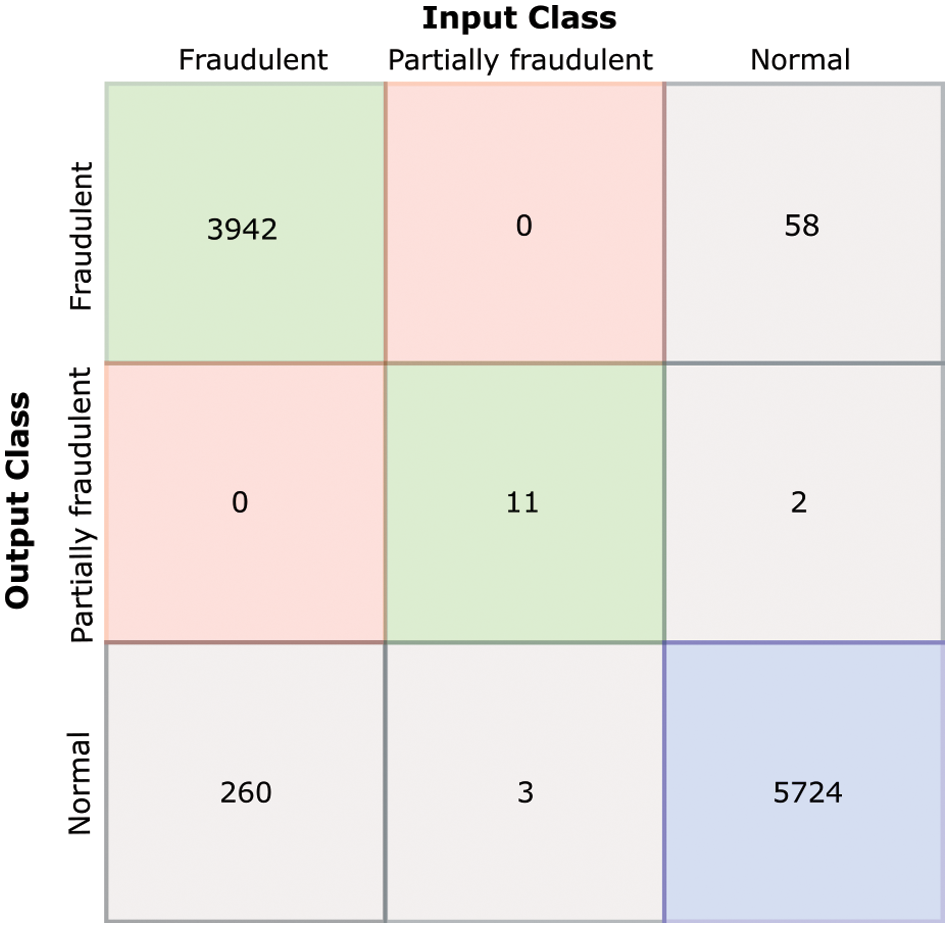
Figure 7: Confusion matrix of class-based theft detection
This section presents the employed dataset detail and experimental environment parameters with the results:
The dataset employed for energy consumption readings is a sample of 5,567 London Households named ‘London Smart Homes’1 1. https://data.london.gov.uk/dataset/smartmeter-energy-use-data-in-london-households. The dataset spans three years, verified by the smart homes project of the UK government. The dataset contains energy consumption in kWh (per half hour), unique household identifier, date, and time. The comma-separated values file is around 10GB when unzipped and contains 167 million data samples with 71 features. It also contains billing and consumption data compared to the user’s usage contract.
Data analysis was done in Python by dividing the data into five clusters, each of thousand houses. Each cluster was analyzed for trends, and then rules were established on these trends on how to recognize a fraudulent customer, as discussed in Section 3.1.
4.2 Genetic Algorithm Feature Selection Experimentation
To minimize the computational cost, the irrelevant features (number of columns) of the dataset were highlighted using the GA. GA used the linear estimator fitness function for finding the fitness of chromosomes, and stopping criteria were kept at six generations. The five offspring were mutated randomly with a mutation rate of 0.05. The selected features were marked 1, while the non-selected ones were marked 0.
Fig. 5 presents a graph depicting the history of the entire genetic optimization with the best and average score for each subsequent generation. The CV-MSE scores against the number of generations of GA are graphed.
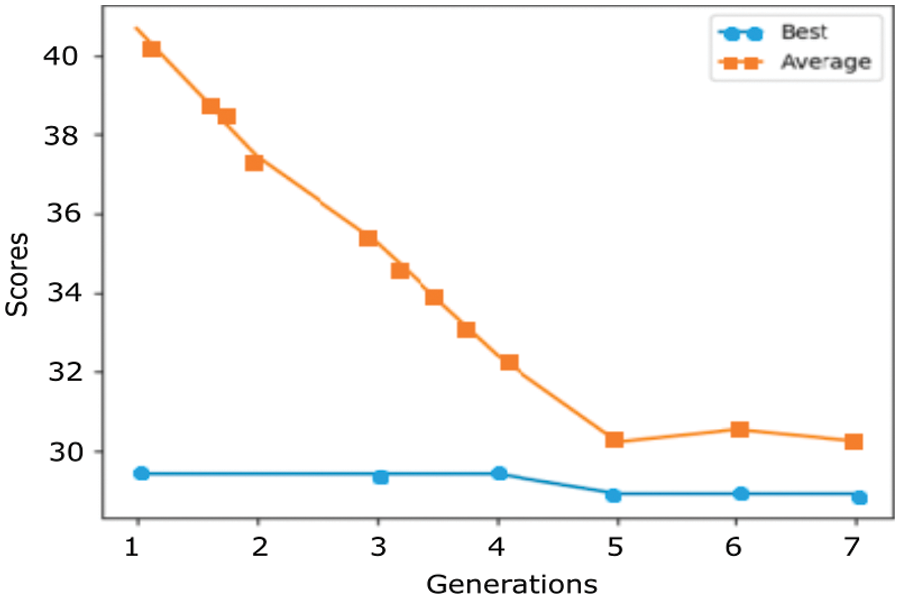
Figure 5: Genetic algorithm optimization showing the CV-MSE scores against several generations
For best accuracy in feature selection, the CV-MSE must be minimized. The number of features in an SG dataset is many. Most of them do not contribute to the target of the GA, which are the tariffs, the customer category, billing, and the amount of electricity consumption. The CV-MSE was used to know how close a regression line is to a set of data points. The fitness function used linear regression, and the CV-MSE was used to take the distances from the data points (features) to the regression line (these distances are the “errors”) and square them. The squaring was done to remove any negative signs. It also increases the weight to larger differences.
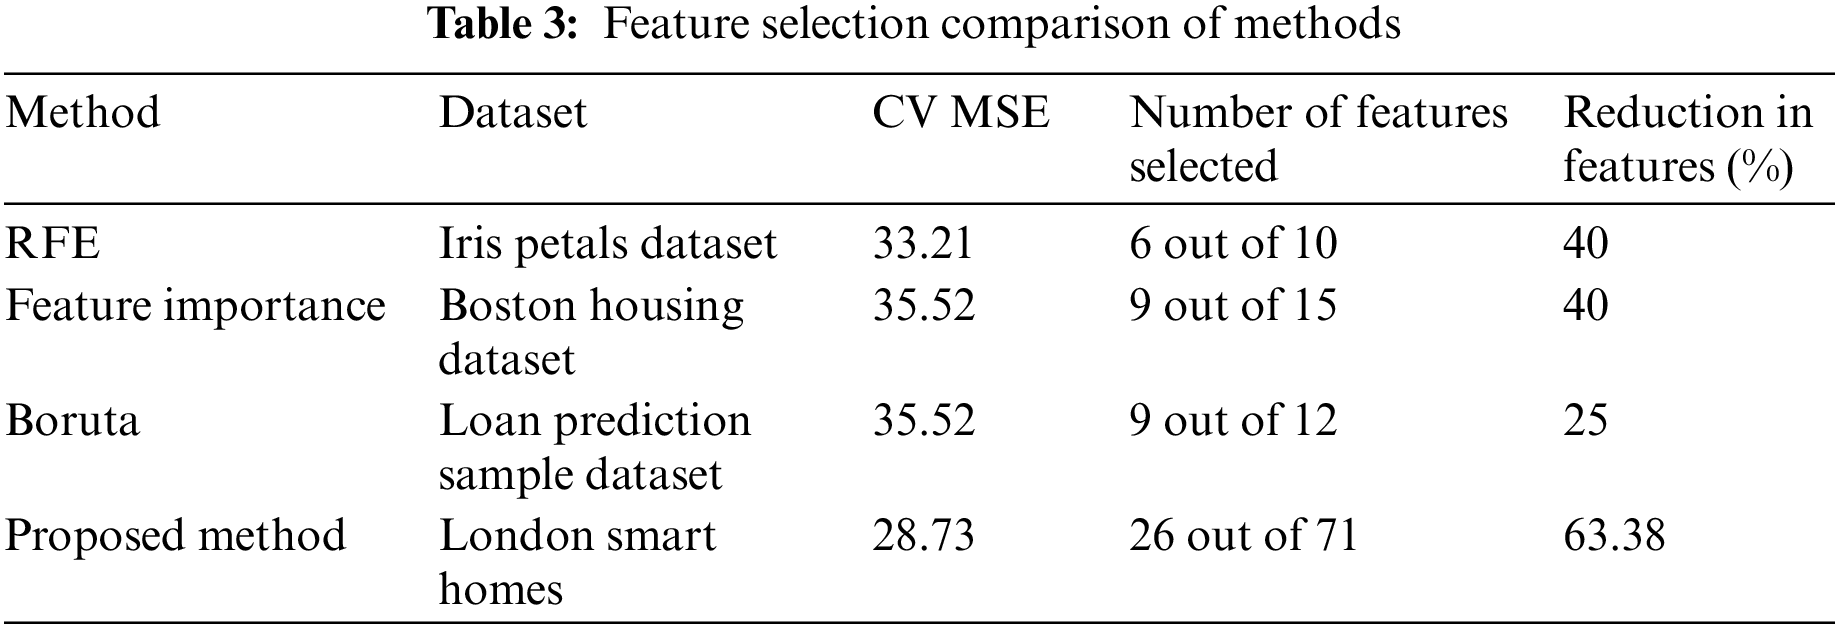
Here to remember that the dataset contains a considerable number of records, with 71 features, which were pre-processed and re-factorized. Finally, 26 features were selected using GA. There are multiple feature selection methods, which are compared as shown in Table 3. The proposed methodology reduced the number of features compared to the other methods. This proposed feature selection method is compared with the three other methods that worked on the data sets with fewer features. If it is compared concerning the number of features, then the proposed method reduces the features by 63.38%, which is the highest.
4.3 Classification Accuracy Using SVM
For training the SVM model on the dataset, the dataset of 167 million records was now reduced to around 200,000 chromosomes, with 26 features representing all the various kinds of customers and classes. The linear kernel distinctly divided the data into two classes. However, any classes (support vectors) lying closer to the hyper-plane were considered “partially fraudulent.” Fig. 6 represents the SVM hyper-plane representation of the three classes, as discussed in Section 3.1. Red support vectors represent Class A (Overloading/fraudulent customers), and Blue represents Class C (regular customers). Yellow support vectors closest to the hyper-plane are classified as class B (possibly/partially fraudulent).
A confusion matrix represents the performance of the proposed class-based theft detection method. This model considers theft when logged meter data crosses the preset voltage threshold. Fraudulent customer is marked 1, and Normal customer is 0. In Fig. 7, the confusion matrix, the rows, and the columns are named theft and usual. Ten thousand samples are picked randomly from the output dataset to ensure transparency and accuracy. Following are the results obtained from the output for the confusion matrix:
• 58 samples were incorrectly classified as a usual or false negative. This is undetected fraud.
• 5724 samples were classified as normal or true positive.
• The classification of 260 samples is incorrect, being considered theft. False positive is the case in which normal customers are misclassified as fraud.
• 3942 samples are classified as theft; called true negative; meaning that they have been accurately identified as falling in the Negative/non-Normal category.
• The following parameter for performance measurement is precision. Precision is the percentage of true positive instances among the total identified samples as positive by the theft detection method. The precision of the proposed model is 95.7%.
• The ability of a model to predict true positives is presented as a sensitivity metric. On the other side, the ability to predict true negatives is presented as a specificity metric. The proposed model’s sensitivity is 99.0%, and specificity is 93.8%.
•
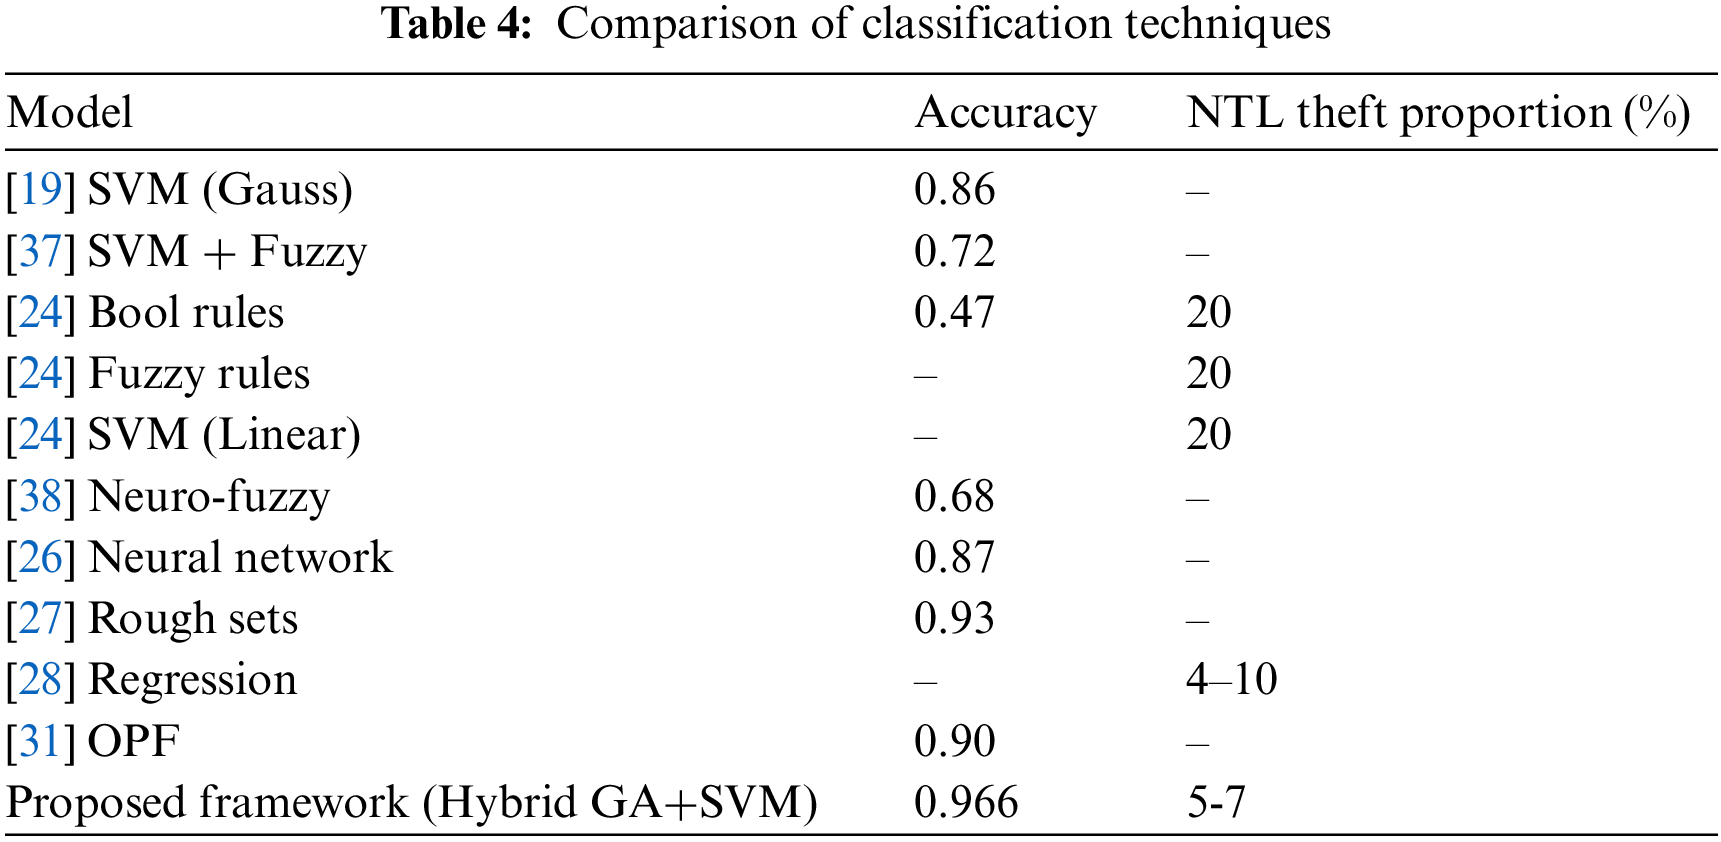
Table 4 compares the different accuracy of various methods and NTL. The overall validation accuracy is 96.6%. The most important aspect to remember is that the dataset consists of around 167 million rows, with more than 71 features, which were pre-processed and re-factorized. Finally, 26 features were selected using GA. This makes the model very vast, applicable to big data, and has more than 50 features. Other models have taken a maximum of 7 to 8 features. The most commonly used models comprise a combination of SVM with Boolean, fuzzy and neural networks. In addition, we can also see OPF and regression methods are used. Accuracy is the most popular performance measure in the literature, ranging from 0.45 to 0.90. Also, some models, such as those that use rough sets, are simply hypothetical and, while being strong research points, they cannot be considered optimally applicable to real-world problems as our solution. As a result, SVM was seen as the first choice of classification for multidimensional data, hence supporting the research that SVM proves best for classifying data that can predict and classify more than a single output.
NTLs are one of the predominant types of losses in SGs. They have a damaging impact on the economy and loss in revenue. In this paper, we have proposed a novel technique for detecting NTLs, basically a “fraudulent electricity consumption.” The proposed framework is based on optimized feature selection using GA and SVM classification. Our methodology, with an accuracy of 96.6%, shows reliability in detecting NTLs. This framework has the capacity of not only allowing SG companies to handle NTLs but will also complement their existing frameworks. The real-time (electricity consumption) data could be used as input to our implemented framework to classify it as normal, possibly fraudulent, and fraudulent customers. The system would also help monitor the SG consumption and trends of the customers. The user trends would also help predict future power consumption and would be helpful to set out the SG upgradation targets. Several challenges, open questions, and advancement voids still exist towards the advancement of smart grids [39], as our proposed methodology requires user data for training and testing the system. In the future, we plan to integrate a data encryption module using the available state-of-the-art data encryption techniques [40–43]. In addition, the data encryption would prevent data fabrication and theft and add customers’ trust in the energy suppliers. Furthermore, encryption would allow data access control, authentication, resilience, backup, and recovery.
Funding Statement: This research is funded by Fayoum University, Egypt.
Conflicts of Interest: The authors declare that they have no conflicts of interest to report regarding the present study.
References
1. E. Khan, B. Adebisi and B. Honary, “Location based security for smart grid applications,” Energy Procedia, vol. 42, pp. 299–307, 2013. [Google Scholar]
2. P. Antmann, “Reducing technical and non-technical losses in the power sector,” background paper for the WBG energy strategy,” Energy Unit World Bank, vol. 10, pp. 1–34, 2009. [Google Scholar]
3. W. Han and Y. Xiao, “Combating TNTL: Non-technical loss fraud targeting time-based pricing in smart grid,” in Int. Conf. on Cloud Computing and Security, Guangzhou, China, pp. 48–57, 2016. [Google Scholar]
4. A. Gandomi and M. Haider, “Beyond the hype: Big data concepts, methods, and analytics,” International Journal of Information Management, vol. 35, no. 2, pp. 137–144, 2015. [Google Scholar]
5. M. A. Hayes and M. A. M. Capretz, “Contextual anomaly detection in big sensor data,” in IEEE Int. Congress on Big Data, Anchorage, AK, USA, pp. 64–71, 2014. [Google Scholar]
6. D. Gonzalez-Jimenez, J. Del-Olmo, J. Poza, F. Garramiola and P. Madina, “Data-driven fault diagnosis for electric drives: A review,” Sensors, vol. 21, no. 12, pp. 4024, 2021. [Google Scholar]
7. S. O. Tehrani, M. H. Y. Moghaddam and M. Asadi, “Decision tree based electricity theft detection in smart grid,” in Proc. of 4th IEEE Int. Conf. on Smart City, Internet of Things and Applications (SCIOT), Mashhad, Iran, pp. 46–51, 2020. [Google Scholar]
8. W. Wang, D. Lu, X. Zhou, B. Zhang and J. Mu, “Statistical wavelet-based anomaly detection in big data with compressive sensing,” EURASIP Journal on Wireless Communications and Networking, vol. 2013, no. 1, pp. 1–6, 2013. [Google Scholar]
9. J. E. Cabral, J. O. P. Pinto, E. M. Martins and A. M. A. C. Pinto, “Fraud detection in high voltage electricity consumers using data mining,” in Proc. of IEEE/PES Transmission and Distribution Conf. and Exposition, Chicago Illinois, USA, pp. 1–5, 2008. [Google Scholar]
10. A. Jindal, A. Dua, K. Kaur, M. Singh, N. Kumar et al., “Decision tree and SVM-based data analytics for theft detection in smart grid,” IEEE Transactions on Industrial Informatics, vol. 12, no. 3, pp. 1005–1016, 2016. [Google Scholar]
11. P. Glauner, A. Boechat, L. Dolberg, R. State, F. Bettinger et al., “Large-scale detection of non-technical losses in imbalanced data sets,” in Proc. of IEEE Power & Energy Society Innovative Smart Grid Technologies Conf. (ISGT), Minneapolis, MN, USA, pp. 1–5, 2016. [Google Scholar]
12. K. Fei, Q. Li and C. Zhu, “Non-technical losses detection using missing values’ pattern and neural architecture search,” International Journal of Electrical Power & Energy Systems, vol. 134, no. 2, pp. 107410, 2022. [Google Scholar]
13. P. Jokar, N. Arianpoo and V. C. Leung, “Intrusion detection in advanced metering infrastructure based on consumption pattern,” in Proc. of IEEE Int. Conf. on Communications (ICC), Budapest, Hungary, pp. 4472–4476, 2013. [Google Scholar]
14. S. Salinas, M. Li and P. Li, “Privacy-preserving energy theft detection in smart grids,” in Proc. of 9th Annual IEEE Communications Society Conf. on Sensor, Mesh and Ad Hoc Communications and Networks (SECON), Seoul, Korea, pp. 605–613, 2012. [Google Scholar]
15. M. F. Elrawy, A. I. Awad and H. F. Hamed, “Intrusion detection systems for IoT-based smart environments: A survey,” Journal of Cloud Computing, vol. 7, no. 1, pp. 1–20, 2018. [Google Scholar]
16. R. Jiang, R. Lu, Y. Wang, J. Luo, C. Shen et al., “Energy-theft detection issues for advanced metering infrastructure in smart grid,” Tsinghua Science and Technology, vol. 19, no. 2, pp. 105–120, 2014. [Google Scholar]
17. P. McDaniel and S. McLaughlin, “Security and privacy challenges in the smart grid,” IEEE Security & Privacy, vol. 7, no. 3, pp. 75–77, 2009. [Google Scholar]
18. S. Salinas, C. Luo, W. Liao and P. Li, “State estimation for energy theft detection in microgrids,” in Proc. of 9th Int. Conf. on Communications and Networking in China, Maoming, China, pp. 96–101, 2014. [Google Scholar]
19. P. Jokar, N. Arianpoo and V. C. M. Leung, “Electricity theft detection in AMI using customers’ consumption patterns,” IEEE Transactions on Smart Grid, vol. 7, no. 1, pp. 216–226, 2015. [Google Scholar]
20. P. Kumar, Y. Lin, G. Bai, A. Paverd, J. S. Dong et al., “Smart grid metering networks: A survey on security, privacy and open research issues,” IEEE Communications Surveys & Tutorials, vol. 21, no. 3, pp. 2886–2927, 2019. [Google Scholar]
21. A. Althobaiti, A. Jindal, A. K. Marnerides and U. Roedig, “Energy theft in smart grids: A Survey on data-driven attack strategies and detection methods,” IEEE Access, vol. 9, pp. 159291–159312, 2021. [Google Scholar]
22. A. O. Otuoze, M. W. Mustafa, O. O. Mohammed, M. S. Saeed, N. T. Surajudeen-Bakinde et al., “Electricity theft detection by sources of threats for smart city planning,” IET Smart Cities, vol. 1, no. 2, pp. 52–60, 2019. [Google Scholar]
23. S. Salinas, M. Li and P. Li, “Privacy-preserving energy theft detection in smart grids: A P2P computing approach,” IEEE Journal on Selected Areas in Communications, vol. 31, no. 9, pp. 257–267, 2013. [Google Scholar]
24. T. B. Smith, “Electricity theft: A comparative analysis,” Energy Policy, vol. 32, no. 18, pp. 2067–2076, 2004. [Google Scholar]
25. H. Najmeddine, K. E. K. Drissi, C. Pasquier, C. Faure, K. Kerroum et al., “Smart metering by using “Matrix Pencil”,” in Proc. of 9th Int. Conf. on Environment and Electrical Engineering, Prague, Czech Republic, pp. 238–241, 2010. [Google Scholar]
26. G. Fenza, M. Gallo and V. Loia, “Drift-aware methodology for anomaly detection in smart grid,” IEEE Access, vol. 7, pp. 9645–9657, 2019. [Google Scholar]
27. A. G. Lazaropoulos, “Detection of energy theft in overhead low-voltage power grids  the hook style energy theft in the smart grid era,” Trends in Renewable Energy, vol. 5, no. 1, pp. 12–46, 2018. [Google Scholar]
28. R. Moghaddass and J. Wang, “A hierarchical framework for smart grid anomaly detection using large-scale smart meter data,” IEEE Transactions on Smart Grid, vol. 9, no. 6, pp. 5820–5830, 2017. [Google Scholar]
29. I. Ahmad, “Feature selection using particle swarm optimization in intrusion detection,” International Journal of Distributed Sensor Networks, vol. 11, no. 10, pp. 806954, 2015. [Google Scholar]
30. H. R. Kanan, K. Faez and S. M. Taheri, “Feature selection using ant colony optimization (ACOA new method and comparative study in the application of face recognition system,” in Proc. of Industrial Conf. on Data Mining, Leipzig, Germany, pp. 63–76, 2007. [Google Scholar]
31. G. A. Mary and R. Rajarajeswari, “Smart grid cost optimization using genetic algorithm,” International Journal of Research in Engineering and Technology, vol. 3, no. 7, pp. 282–287, 2014. [Google Scholar]
32. F. Shehzad, N. Javaid, S. Aslam and M. U. Javaid, “Electricity theft detection using big data and genetic algorithm in electric power systems,” Electric Power Systems Research, vol. 209, no. 4, pp. 107975, 2022. [Google Scholar]
33. K. Blazakis and G. Stavrakakis, “Efficient power theft detection for residential consumers using mean shift data mining knowledge discovery process,” arXiv preprint arXiv:1902.03296, 2019. [Google Scholar]
34. S. Li, Y. Han, X. Yao, S. Yingchen, J. Wang et al., “Electricity theft detection in power grids with deep learning and random forests,” Journal of Electrical and Computer Engineering, vol. 2019, no. 2, pp. 1–12, 2019. [Google Scholar]
35. L. Feng, S. Xu, L. Zhang, J. Wu, J. Zhang et al., “Anomaly detection for electricity consumption in cloud computing: Framework, methods, applications, and challenges,” EURASIP Journal on Wireless Communications and Networking, vol. 2020, no. 1, pp. 1–12, 2020. [Google Scholar]
36. J. Zheng, J. Wang, J. Li, S. Chen, L. Shu et al., “Deep neural networks for detection of abnormal trend in electricity data,” Proceedings of the Romanian Academy, Series A, vol. 22, no. 3, pp. 291–298, 2021. [Google Scholar]
37. J. Yeckle and B. Tang, “Detection of electricity theft in customer consumption using outlier detection algorithms,” in Proc. of 1st Int. Conf. on Data Intelligence and Security (ICDIS), South Padre Island, TX, USA, pp. 135–140, 2018. [Google Scholar]
38. Z. Chen, T. Lin, N. Tang and X. Xia, “A parallel genetic algorithm based feature selection and parameter optimization for support vector machine,” Scientific Programming, vol. 2016, no. 2, pp. 1–10, 2016. [Google Scholar]
39. S. Bhattacharya, R. Chengoden, G. Srivastava, M. Alazab, A. Javed et al., “Incentive mechanisms for smart grid: State of the art, challenges, open issues, future directions,” Big Data and Cognitive Computing, vol. 6, no. 2, pp. 47, 2022. [Google Scholar]
40. F. A. Khan, J. Ahmed, J. S. Khan, J. Ahmad and M. A. Khan, “A novel substitution box for encryption based on Lorenz equations,” in Proc. of Int. Conf. on Circuits, System and Simulation (ICCSS), London, UK, pp. 32–36, 2017. [Google Scholar]
41. J. Ahmad, H. Larijani, R. Emmanuel, M. Mannion, A. Javed et al., “An intelligent real-time occupancy monitoring system with enhanced encryption and privacy,” in Proc. of 17th Int. Conf. on Cognitive Informatics & Cognitive Computing (ICCI* CC), Berkeley, CA, USA, pp. 524–529, 2018. [Google Scholar]
42. S. M. Asad, J. Ahmad, S. Hussain, A. Zoha, Q. H. Abbasi et al., “Mobility prediction-based optimisation and encryption of passenger traffic-flows using machine learning,” Sensors, vol. 20, no. 9, pp. 2629, 2020. [Google Scholar]
43. J. Ahmad, A. Tahir, J. S. Khan, A. Jameel, Q. H. Abbasi et al., “A novel multi-chaos based compressive sensing encryption technique,” in Proc. of Int. Conf. on Advances in the Emerging Computing Technologies (AECT), Madinah, Saudi Arabia, pp. 1–4, 2020. [Google Scholar]
Cite This Article
 Copyright © 2023 The Author(s). Published by Tech Science Press.
This work is licensed under a Creative Commons Attribution 4.0 International License , which permits unrestricted use, distribution, and reproduction in any medium, provided the original work is properly cited.
 Downloads
 Citation Tools