
 Submit a Paper
 Propose a Special lssue
 Open Access
ARTICLE

Optimal Deep Learning Driven Intrusion Detection in SDN-Enabled IoT Environment
1 Department of Information Systems, College of Computer Science, King Khalid University, Abha, Saudi Arabia
2 Department of Information Systems, College of Computer and Information Sciences, Princess Nourah bint Abdulrahman University, P.O. Box 84428, Riyadh, 11671, Saudi Arabia
3 SAUDI ARAMCO Cybersecurity Chair, Networks and Communications Department, College of Computer Science and Information Technology, Imam Abdulrahman Bin Faisal University, P.O. Box 1982, Dammam, 31441, Saudi Arabia
4 Prince Saud AlFaisal Institute for Diplomatic Studies, Riyadh, Saudi Arabia
5 Department of Computer Sciences, College of Computing and Information System, Umm Al-Qura University, Saudi Arabia
6 Department of Computer Science, Warwick University, Covetry, UK
7 Department of Computer Science, Faculty of Computers and Information Technology, Future University in Egypt New Cairo, 11835, Egypt
8 Department of Computer and Self Development, Preparatory Year Deanship, Prince Sattam bin Abdulaziz University, AlKharj, Saudi Arabia
* Corresponding Author: Manar Ahmed Hamza. Email:
Computers, Materials & Continua 2023, 74(3), 6587-6604. https://doi.org/10.32604/cmc.2023.034176
Received 07 July 2022; Accepted 03 October 2022; Issue published 28 December 2022
 View Full Text
 Download PDF
Abstract
In recent years, wireless networks are widely used in different domains. This phenomenon has increased the number of Internet of Things (IoT) devices and their applications. Though IoT has numerous advantages, the commonly-used IoT devices are exposed to cyber-attacks periodically. This scenario necessitates real-time automated detection and the mitigation of different types of attacks in high-traffic networks. The Software-Defined Networking (SDN) technique and the Machine Learning (ML)-based intrusion detection technique are effective tools that can quickly respond to different types of attacks in the IoT networks. The Intrusion Detection System (IDS) models can be employed to secure the SDN-enabled IoT environment in this scenario. The current study devises a Harmony Search algorithm-based Feature Selection with Optimal Convolutional Autoencoder (HSAFS-OCAE) for intrusion detection in the SDN-enabled IoT environment. The presented HSAFS-OCAE method follows a three-stage process in which the Harmony Search Algorithm-based FS (HSAFS) technique is exploited at first for feature selection. Next, the CAE method is leveraged to recognize and classify intrusions in the SDN-enabled IoT environment. Finally, the Artificial Fish Swarm Algorithm (AFSA) is used to fine-tune the hyperparameters. This process improves the outcomes of the intrusion detection process executed by the CAE algorithm and shows the work’s novelty. The proposed HSAFS-OCAE technique was experimentally validated under different aspects, and the comparative analysis results established the supremacy of the proposed model.Keywords
Internet of Things (IoT) refers to a dynamic network that contains smartphones, sensor nodes, software, switches/routers and servers [1]. IoT was developed as a phenomenon. In this dynamic network, real-time data movements or activities are processed and sensed. The IoT network acts as a common platform for data transmission between the physical world and the Internet of conventional things. The idea of the IoT network has resulted in extensive consumption, production and processing of information [2]. The number of devices connected via the Internet has surpassed the global population and is expected to increase considerably in a few years [3,4].
On the other hand, the devices with constrained resources contribute to the security issues in the IoT network, which considerably augments it in terms of risks, vulnerabilities and threats [5]. In this background, an appropriate analysis of the information recorded in the IoT platforms assists in predictions and early detection of the threats [6]. The Intrusion Detection Systems (IDSs) can rectify malicious activities in the IoT network through real-time traffic analysis. The IDS takes measures to protect the system from getting damaged through attack detection and classification processes. Software-Defined Network (SDN) is a naïve concept in the networking domain that decouples the packet-forwarding plane and the control plane. The SDN approach provides a global view of the network and its centralized control [7,8]. Different authors have focused on developing novel IDSs for conventional networks in literature. These studies focused on the constrained devices in the IoT networks and the recognition of malicious activities in them [9]. Fig. 1 depicts the processes involved in the SDN environment. The concept of IDS-based software defines network systems as unique, especially in the IoT environment [6].
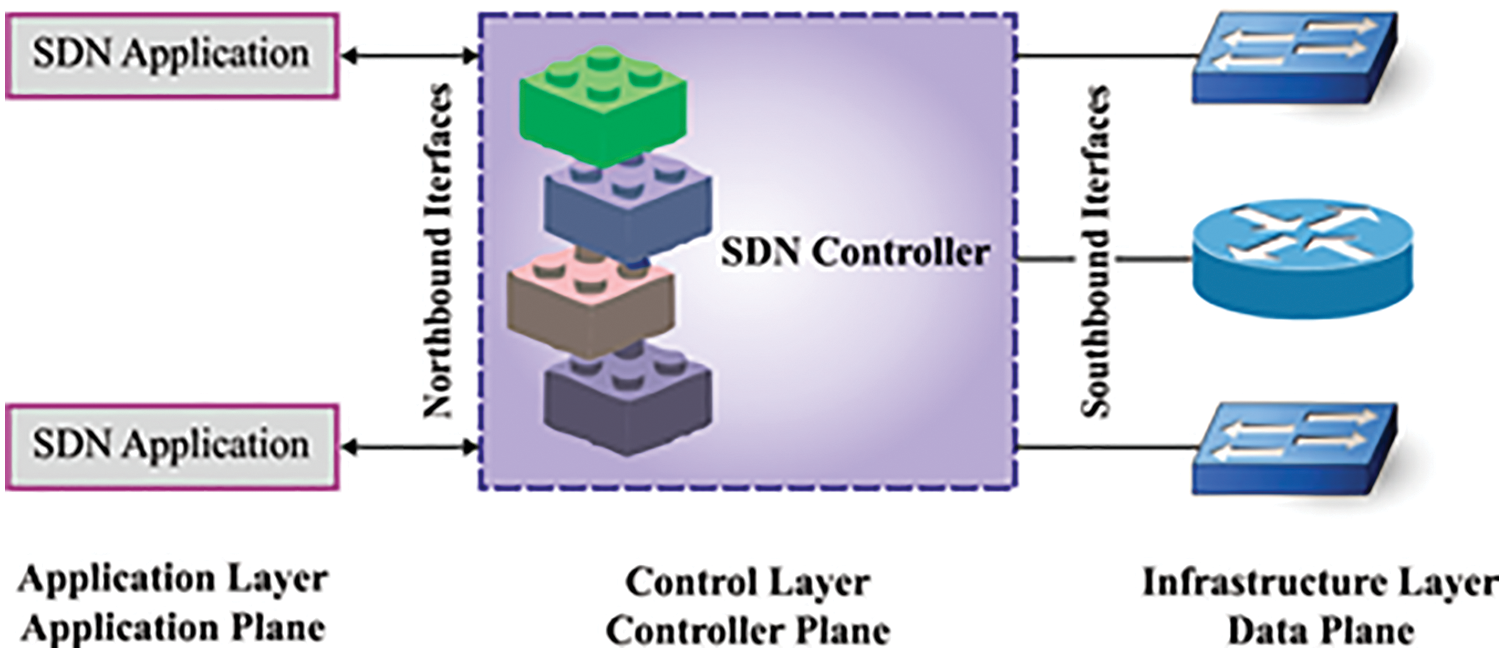
Figure 1: SDN environment
In conventional networks, network devices such as routers or switches can forward the data through different control mechanisms [10]. However, the SDN model conceived the network as a programmable entity and decouples both the control plane and the data plane. Here, the routers or switches simply act as a forwarding devices since the control module is operated from the centralized control. The SDN approach deals with the networks based on the abstraction of low-level functionality and maintains an Application Programmable Interface (API) to control the low-level devices [11]. In general, the SDN controller has a global view of the network, making it easy to configure it as and when required.
Furthermore, if there are any modifications to be done to the networking systems, the programmability feature of the SDN makes it relatively straightforward [9]. The security system and the associated features are programmed via an API module and are performed in a network by following the flow rules. These rules are administered through an OpenFlow protocol [12]. The programmability feature increases the flexibility of the network. As mentioned earlier, in case of a modification in the networking system, the control plane performs it instead of reconfiguring every device in the network individually.
In the study conducted earlier [13], an SDN-enabled deep-learning-driven structure was suggested for attack detection in the IoT environment. The existing classifiers such as the Cuda-Deep Neural Network (DNN), Cuda-Bidirectional Long Short Term Memory (Cu-BLSTM) and the Gated Recurrent Unit (Cu- DNNGRU) were efficiently leveraged for attack detection. In this study, a tenfold Cross-Validation (CV) was executed to display the unbiased results. Shu et al. [14] used a Deep Learning (DL) technique with generative adversary networks. They explored the distributed-SDN to devise a Collaborative IDS (CIDS) for the Vehicular Adhoc Network (VANET) model. In this model, multiple SDN controllers are allowed to train a global ID method mutually for the entire network without any direct interchange among the sub-network flows. Shrestha et al. [15] suggested a satellite-related, Unmanned Aerial Vehicle (UAV) 5G-network security method in which a Machine Learning (ML) technique was used to identify the cyberattacks and other vulnerabilities efficiently. The solution had two major phases: the model created for the intrusion detection process using several ML techniques and the application of the ML-related techniques in satellite or terrestrial gateways.
Aslam et al. [16] suggested an Adaptive ML-related SDN-enabled Distributed Denial of Service (DDoS) attack Detection and Mitigation (AMLSDM) structure. The suggested AMLSDM structure was an SDN-enabled security system for the IoT gadgets. An adaptive ML classification method was utilized to achieve fruitful mitigation and the detection of DDoS attacks. The presented structure used ML methods in an adaptive multi-layered feed forwarding method to identify the DDoS attacks in a successful manner. This was accomplished by probing the static attributes of the network traffic under review. Derhab et al. [17] suggested a security architecture in which the Software-Defined Network (SDN) model and the Blockchain technology were integrated. The suggested IDS security structure was created by integrating the K-Nearest Neighbor (KNN) technique and the Random Subspace Learning (RSL) technique. This was done to defend the forged commands that target the industrial control procedures and the Blockchain-related Integrity Checking System (BICS) that prevents the misrouting assault that meddles with the SDN-enabled industrial’s OpenFlow regulations IoT mechanisms.
The current study devises a Harmony Search algorithm-based Feature Selection with Optimal Convolutional Autoencoder (HSAFS-OCAE) for the purpose of intrusion detection in the SDN-enabled IoT environment. The presented HSAFS-OCAE method follows a three-stage process in which the Harmony Search algorithm-based FS (HSAFS) technique is first exploited for feature selection. Next, the CAE algorithm is used for the recognition and classification of the intrusions in the SDN-enabled IoT environment. Finally, the Artificial Fish Swarm Algorithm (AFSA) is used to fine-tune the hyperparameters to boost the intrusion detection performance of the CAE algorithm. The proposed HSAFS-OCAE technique was experimentally validated, and the results were assessed under different measures.
In this study, a new HSAFS-OCAE model has been proposed for a proficient recognition of intrusions in the SDN-enabled IoT environment. The presented HSAFS-OCAE model follows a three-stage process in which the HSAFS technique is exploited at first for feature selection. Next, the CAE approach is leveraged to recognize and classify intrusions in the SDN-enabled IoT environment. Finally, the AFSA-based hyperparameter fine-tuning process is executed to boost the intrusion detection performance of the CAE model. Fig. 2 shows the overall block diagram of the HSAFS-OCAE approach.
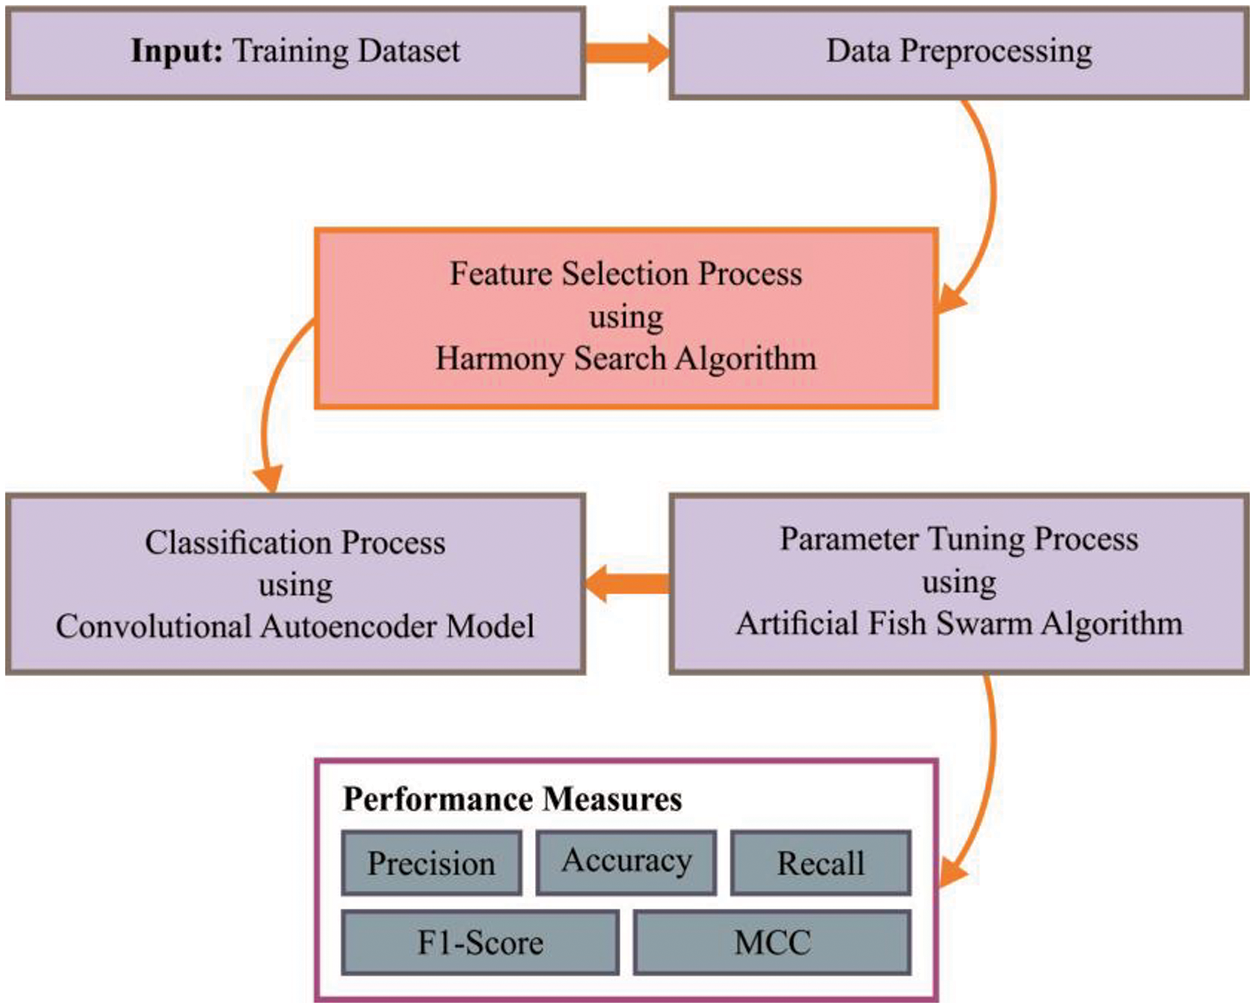
Figure 2: Overall block diagram of the HSAFS-OCAE approach
In this study, the HSAFS technique is exploited for feature selection. In the HSA method, the optimal solution (or component from the solution space) is named ‘harmony’ viz., n-dimensional real vector. An arbitrary value is assigned to the initial population and is loaded from the Harmony Memory (HM) [18]. Then, a novel candidate (following iteration or generation) is evaluated and the harmony is generated based on the component from HM, either by altering the pitch or through an arbitrary selection of the element from HM. Afterwards, the component from the harmony memory and the newly-evaluated candidate harmony are correlated with the least HM vector. This process is repeated to satisfy the ending criteria. The parameters of the HS optimization approach are as follows (i) Pitch Adjusting Rate (PAR) (ii) the size of the HM (iii) distance bandwidth (BW) (iv) HM Consideration Rate (HMCR), and (v) the number of iterations or improvisations (NI). It is crucial to configure the HM module (HMS Vector). Assume that
In HM matrix, i.e.,
The newly-generated
At last,
Either harmony or the solution employs a k element to decide the optimization system. The threshold value
Here, T characterizes the transpose of the matrix, and the maximum size of the HM is denoted by the HMS technique. Each element from the HM is denoted by
Here,
2.2 Design of CAE Classification Model
In this stage, the CAE technique is used to recognize and classify intrusions in the SDN-enabled IoT environment. Autoencoder is a self-supervised learning mechanism that exploits the Neural Network (NN) for representative learning [19]. Representative learning is a method in which a scheme learns how to encode the input dataset. The Autoencoder (AE) approach maps the input datasets to a compressed domain demonstration or a low-dimension space. In the current study, a bottleneck is proposed in which an algorithm is enforced to learn how to demonstrate the compressed domains of the input dataset. In general, the AE approach encompasses four elements such as the Reconstruction Loss, Encoder Network (EN), Bottleneck Layer and Decoder Network (DN). Encoder Network is a NN system that encodes the input dataset to a compressed domain. The bottleneck layer is the final layer of the Encoder Network, and its output is called the encoded input data.
In Eq. (5),
In Eq. (6),
2.3 Algorithmic Process of AFSA Based Hyperparameter Tuning
Finally, the AFSA hyperparameter tuning process is performed to boost the intrusion detection performance of the CAE model. The AFSA model is a kind of swarm intelligence technique that is simulated from the behaviour of the animals [20]. In this method, the fish’s clustering, collision and foraging behaviours are simulated along with its collective support in a fish swarm to realize the optimum global point. In this Artificial Fish (AF) technique, the maximum distance that passes through is referred to as
Further, the retry quantity is characterized by
Given that a fish observes the food via its eyes, the existing position is denoted by
In Eq. (9), rand (0-1) characterizes an arbitrary value between [0, 1]. If
If it does not fulfil the motion condition
In order to avoid the over-crowding issues, an artificial existing location
Then, it begins to follow the prey’s behaviour.
The existing place of the AF swarm is referred to as
It allows the AF to accomplish the company as well as the food over a large region. The location is chosen in a random manner based on which the AF moves towards them.
Using the search region of
In Eq. (14),
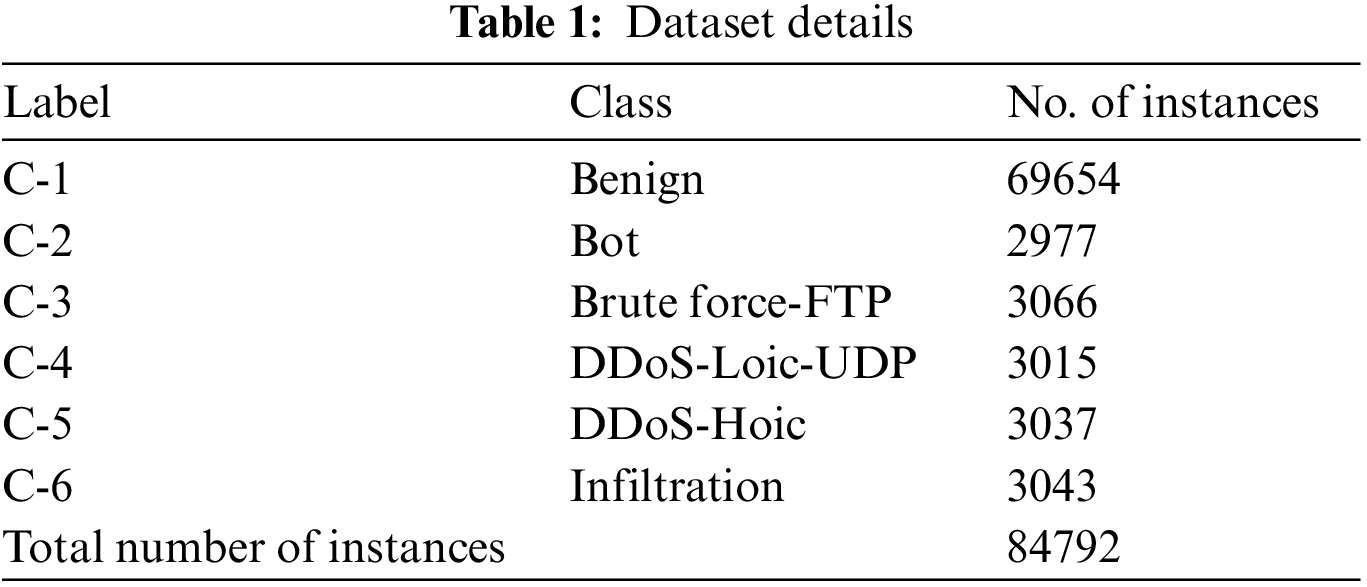
The performance of the proposed HSAFS-OCAE model was experimentally validated using a dataset with 84,792 samples under six class labels as tabulated in Table 1.
The classification results accomplished by the proposed HSAFS-OCAE model are portrayed as confusion matrices in Fig. 3. The figure reports that the proposed HSAFS-OCAE model effectually recognized and classified all the input data under six class labels.
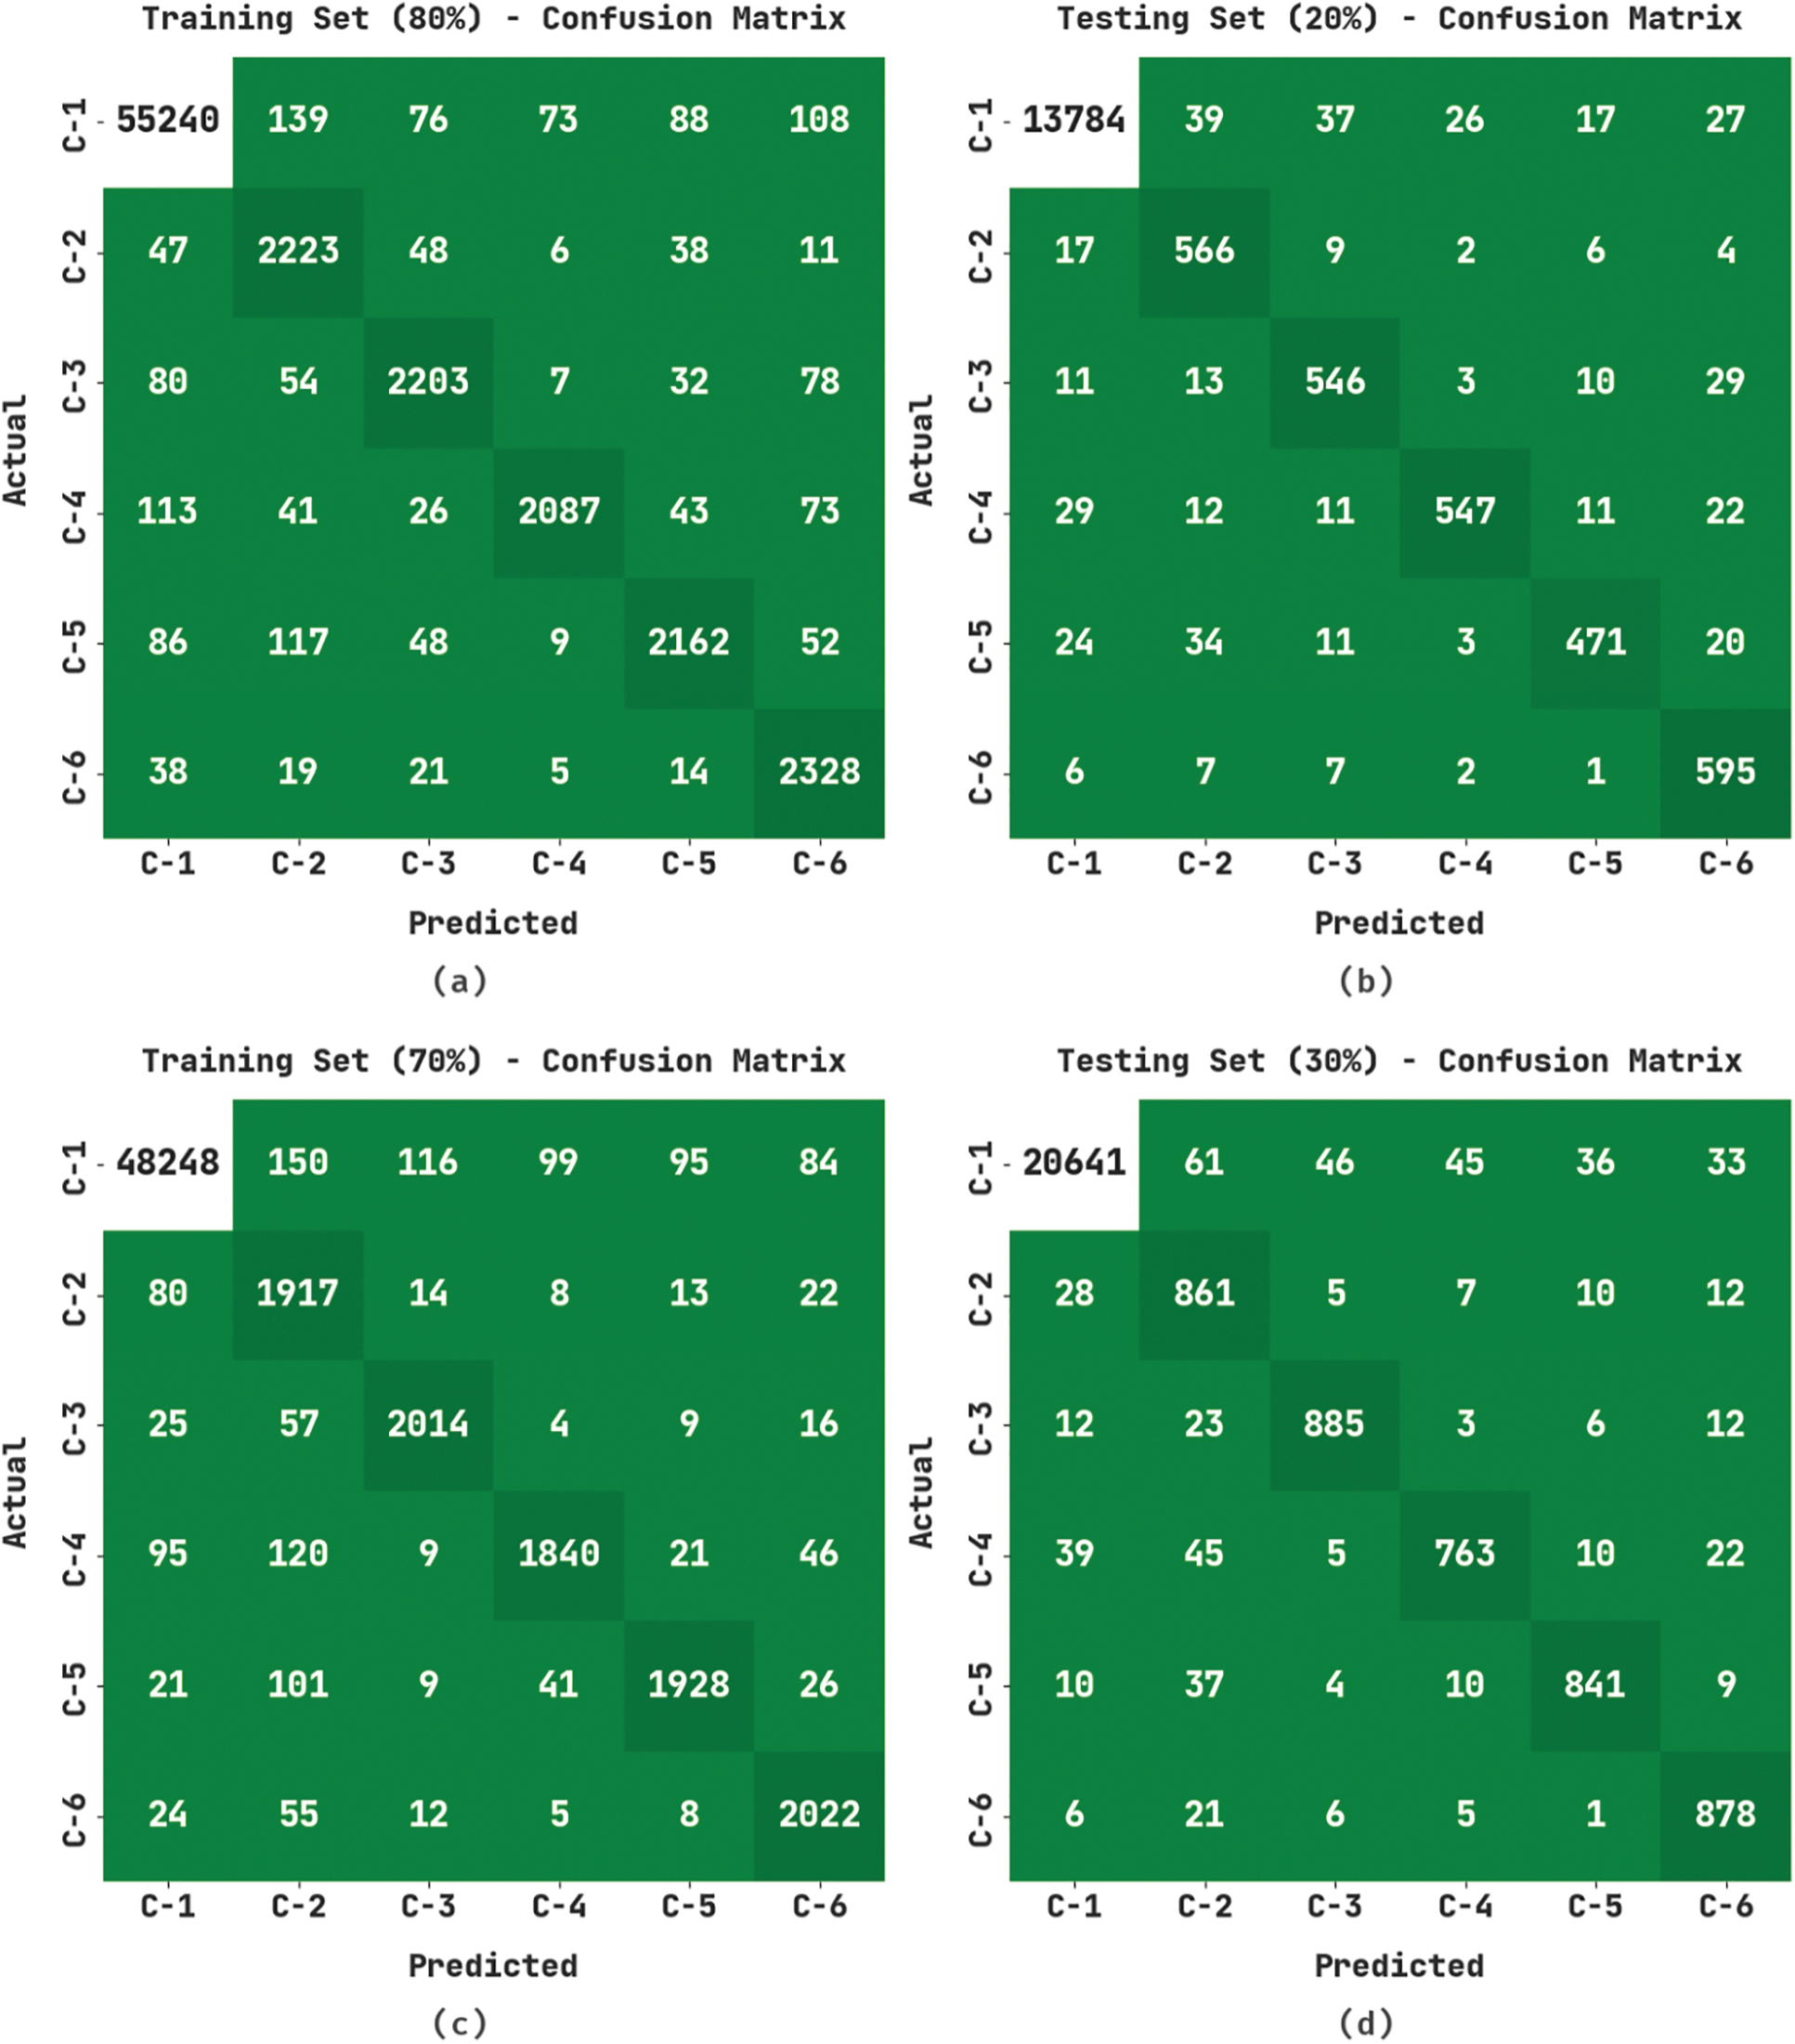
Figure 3: Confusion matrices of the HSAFS-OCAE approach (a) 80% of TR data, (b) 20% of TS data, (c) 70% of TR data, and (d) 30% of TS data
Table 2 and Fig. 4 highlight the classification outcomes achieved by the proposed HSAFS-OCAE model on 80% of the TR data. The results imply that the proposed HSAFS-OCAE model accomplished effectual outcomes under each class. For instance, on 80% of the TR data, the HSAFS-OCAE model gained an
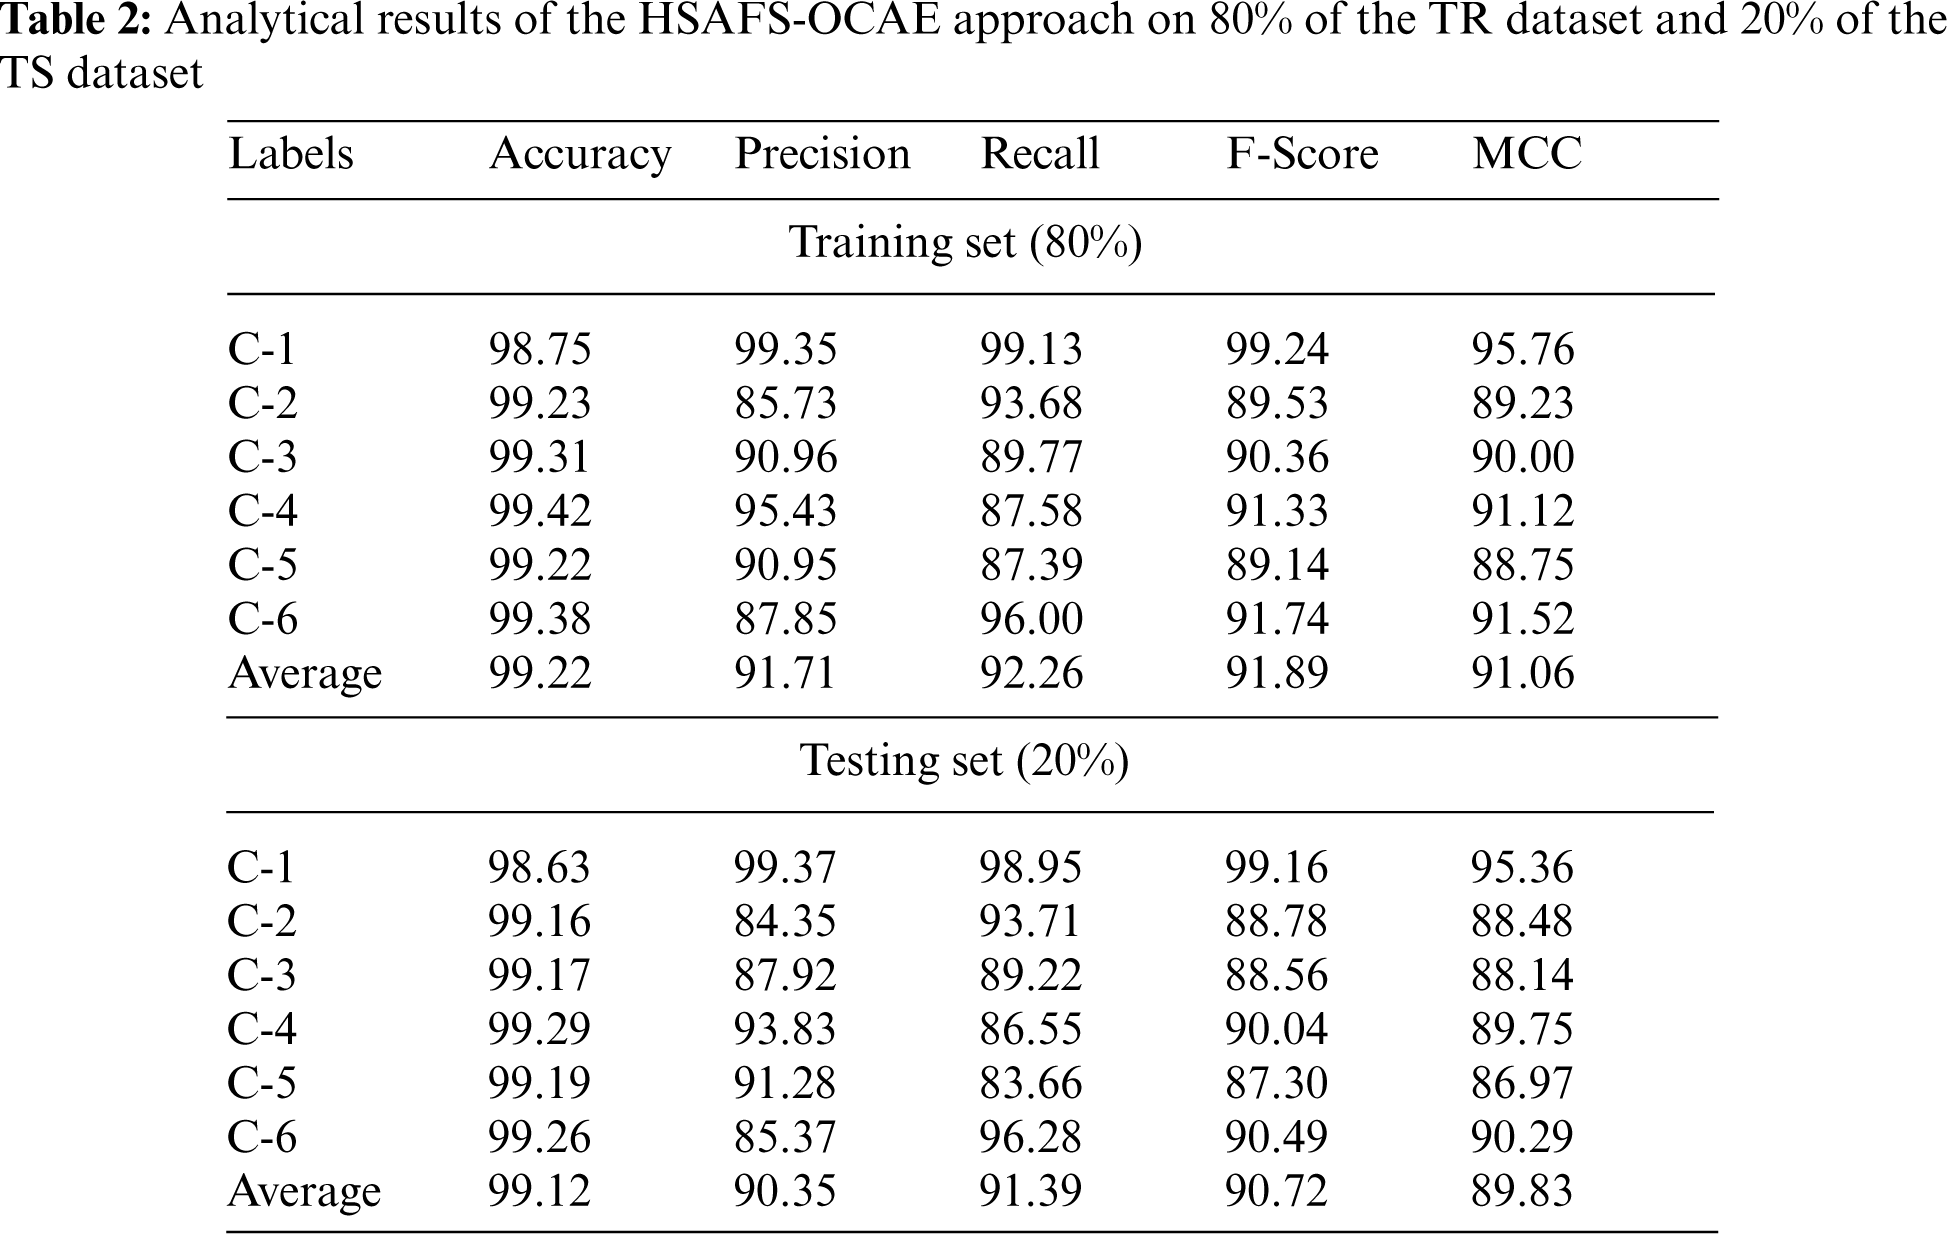
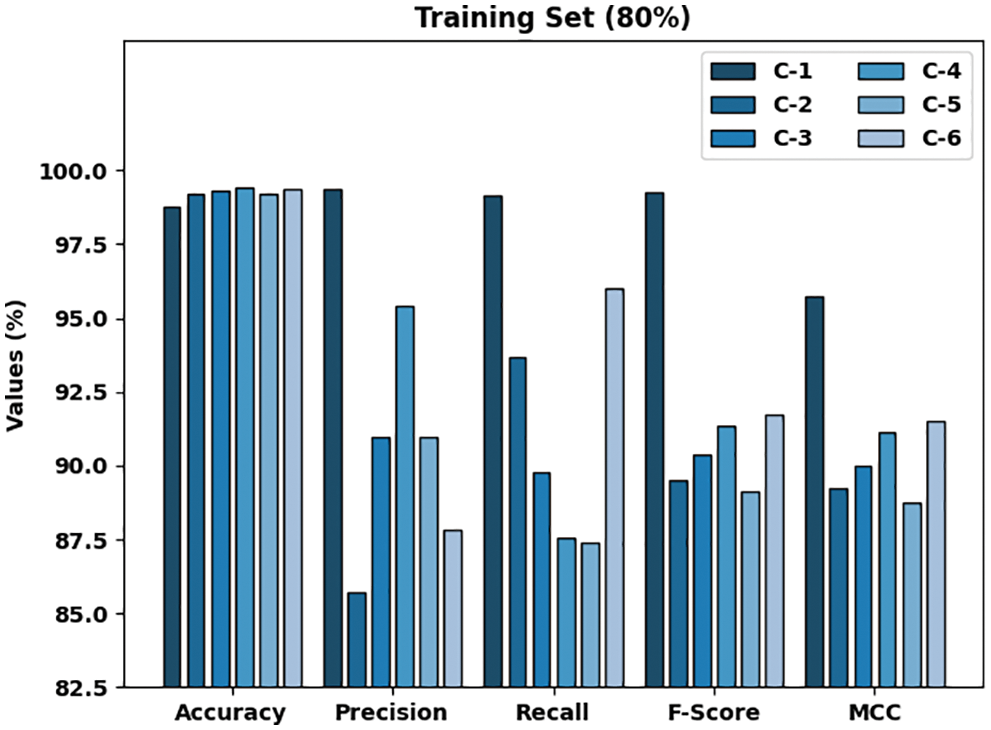
Figure 4: Analytical results of the HSAFS-OCAE approach on 80% of the TR data
Fig. 5 signifies the classification outcomes attained by the proposed HSAFS-OCAE technique on 20% of the TS data. The results denote that the HSAFS-OCAE method accomplished effectual outcomes under each class. For example, on 20% of the TS data, the HSAFS-OCAE model gained an
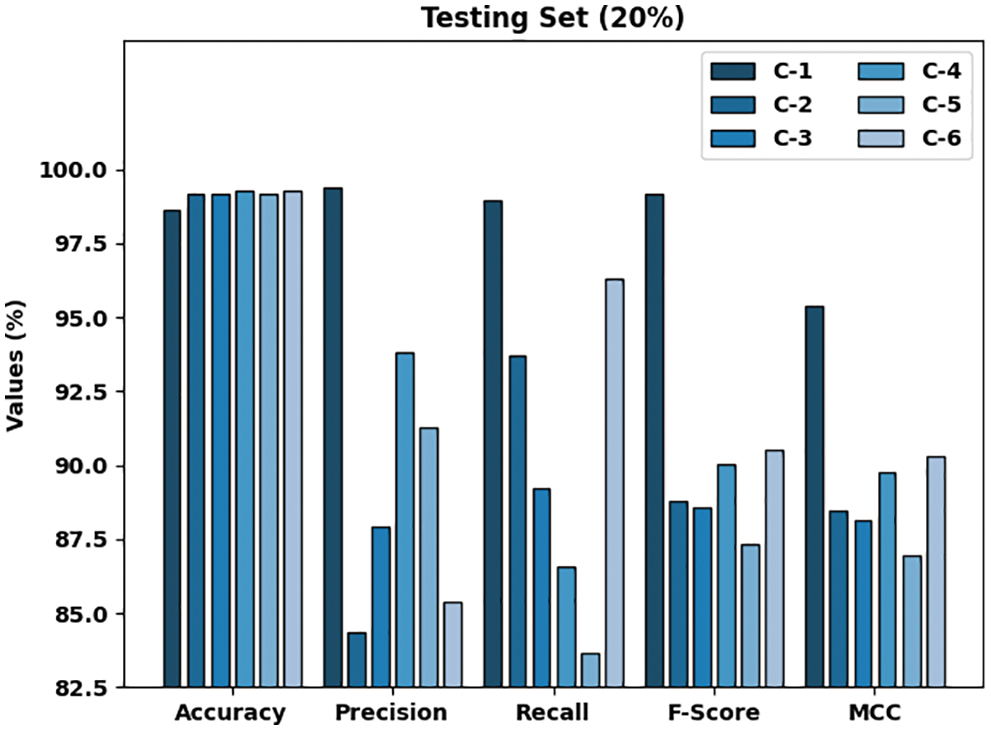
Figure 5: Analytical results of the HSAFS-OCAE approach on 20% of the TS data
Table 3 and Fig. 6 highlight the classification outcomes of the proposed HSAFS-OCAE model on 70% of the TR dataset. The results infer that the proposed HSAFS-OCAE method accomplished effectual outcomes under each class. For example, on 70% of the TR dataset, the presented HSAFS-OCAE model attained an
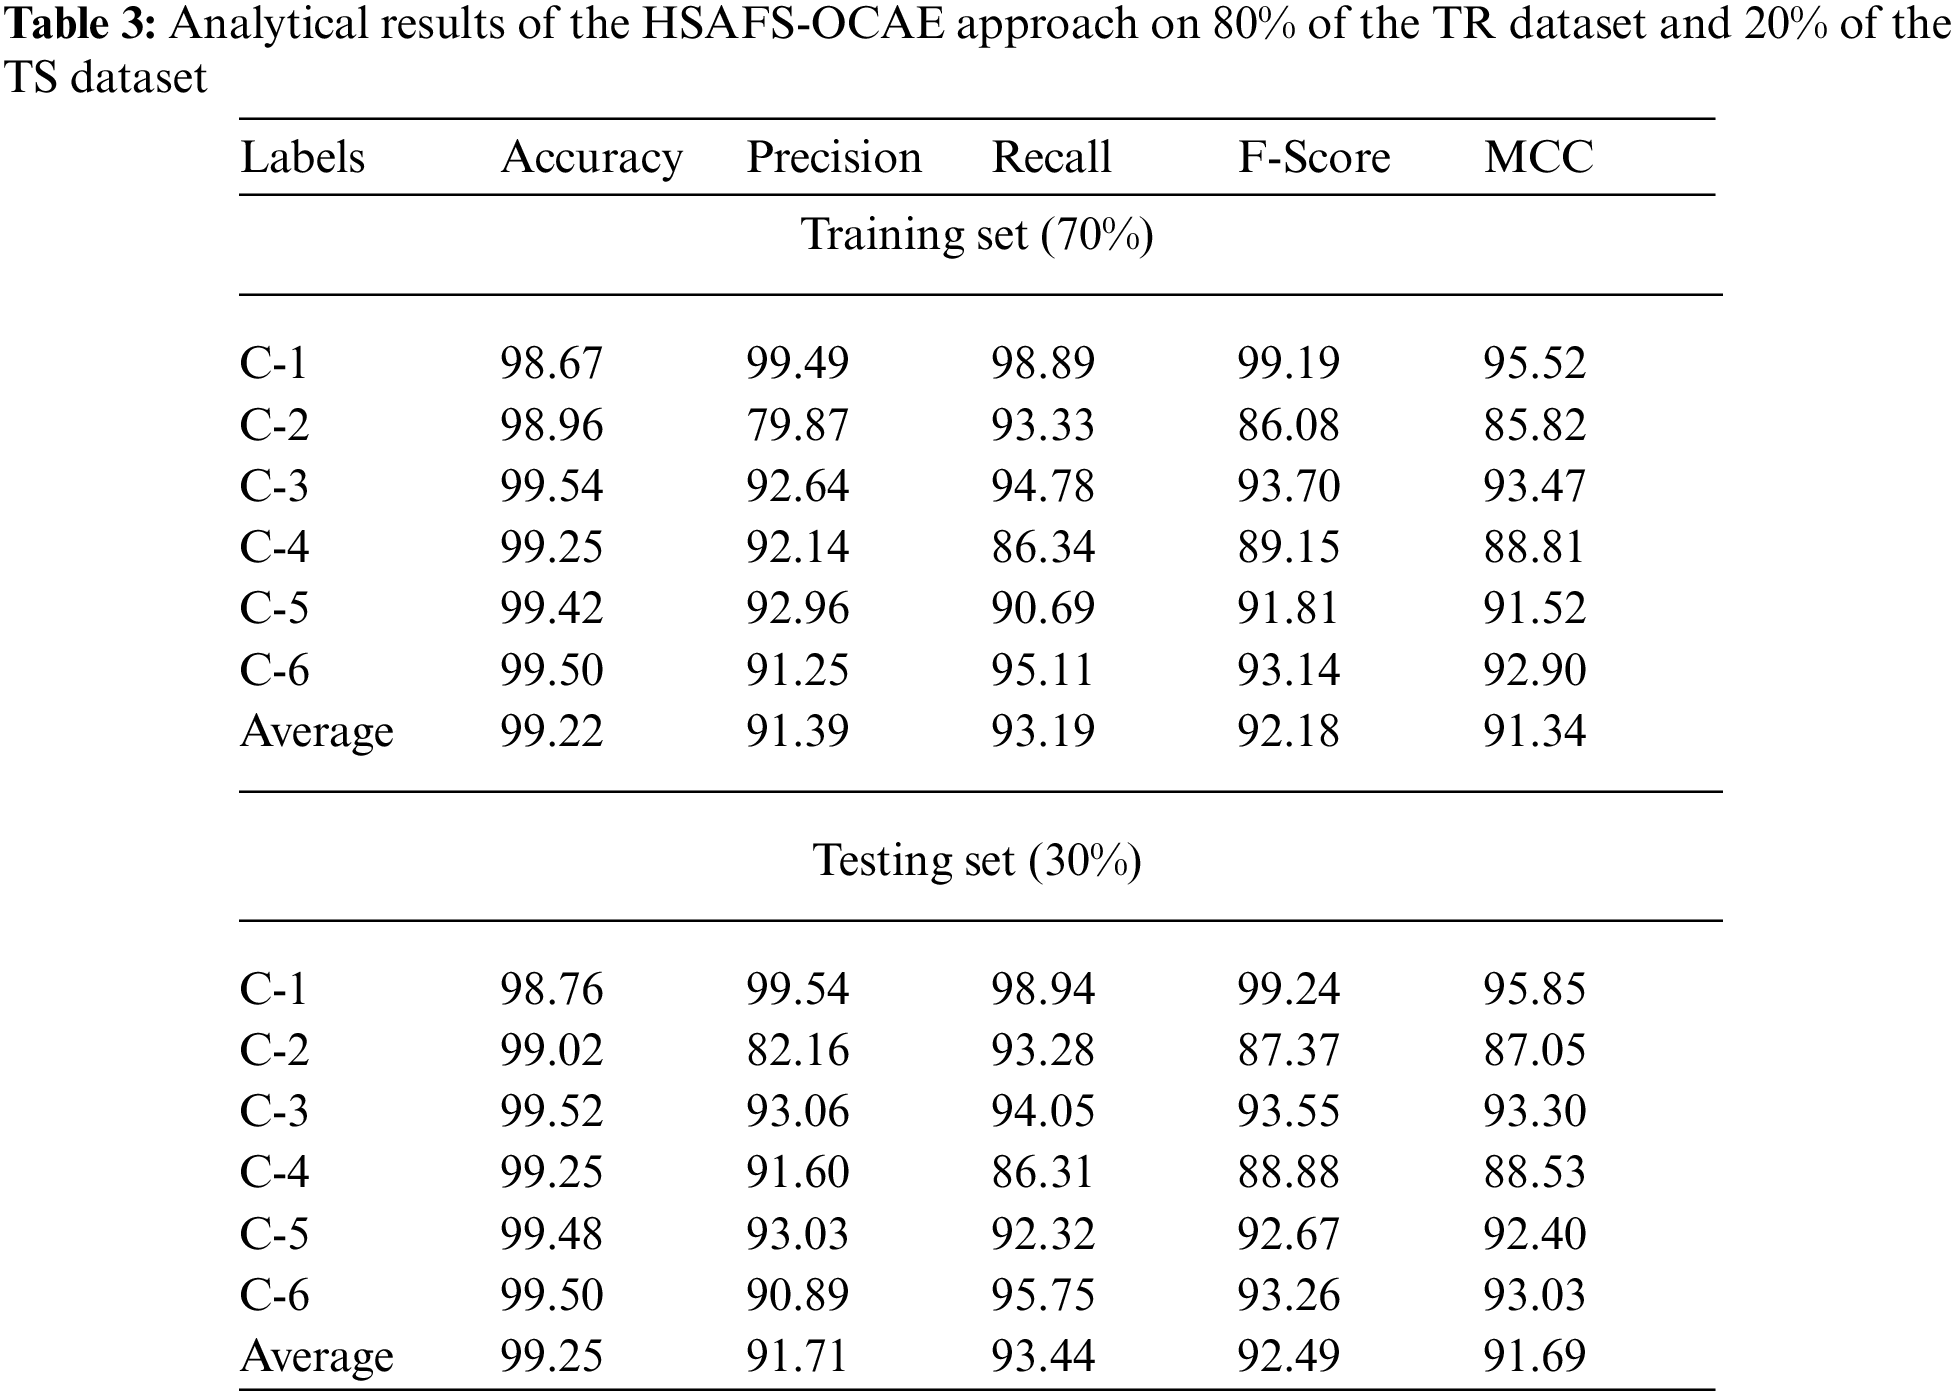
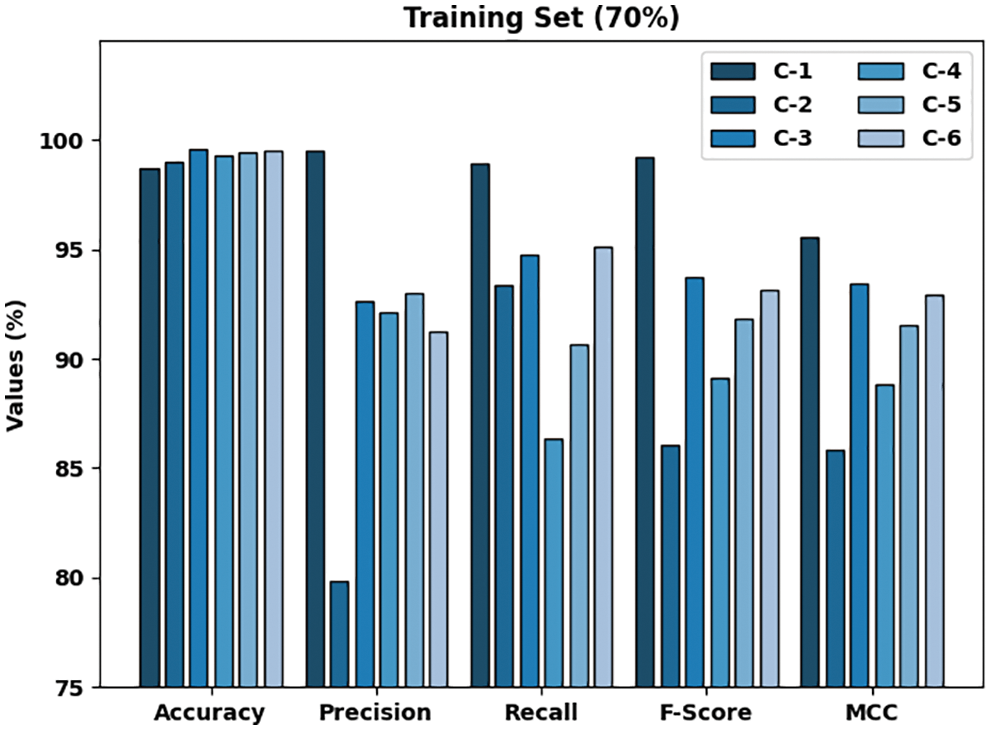
Figure 6: Analytical results of the HSAFS-OCAE approach on 70% of the TR dataset
Fig. 7 highlights the classification outcomes achieved by the proposed HSAFS-OCAE model on 30% of the TS dataset. The results infer that the proposed HSAFS-OCAE model established effectual outcomes under each class. For example, on 30% of the TS dataset, the HSAFS-OCAE algorithm reached an
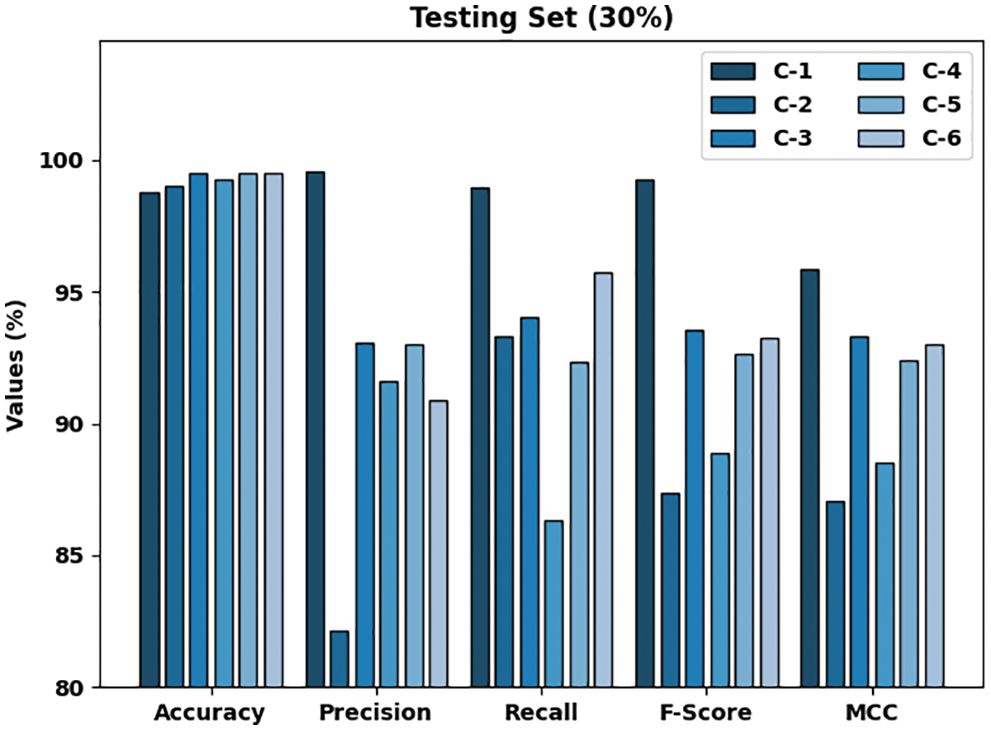
Figure 7: Analytical results of the HSAFS-OCAE approach on 30% of the TS data
Both Training Accuracy (TA) and Validation Accuracy (VA) values, acquired by the proposed HSAFS-OCAE method on test dataset, are shown in Fig. 8. The experimental outcomes imply that the proposed HSAFS-OCAE technique gained the maximal TA and VA values while the VA values were higher than the TA values.
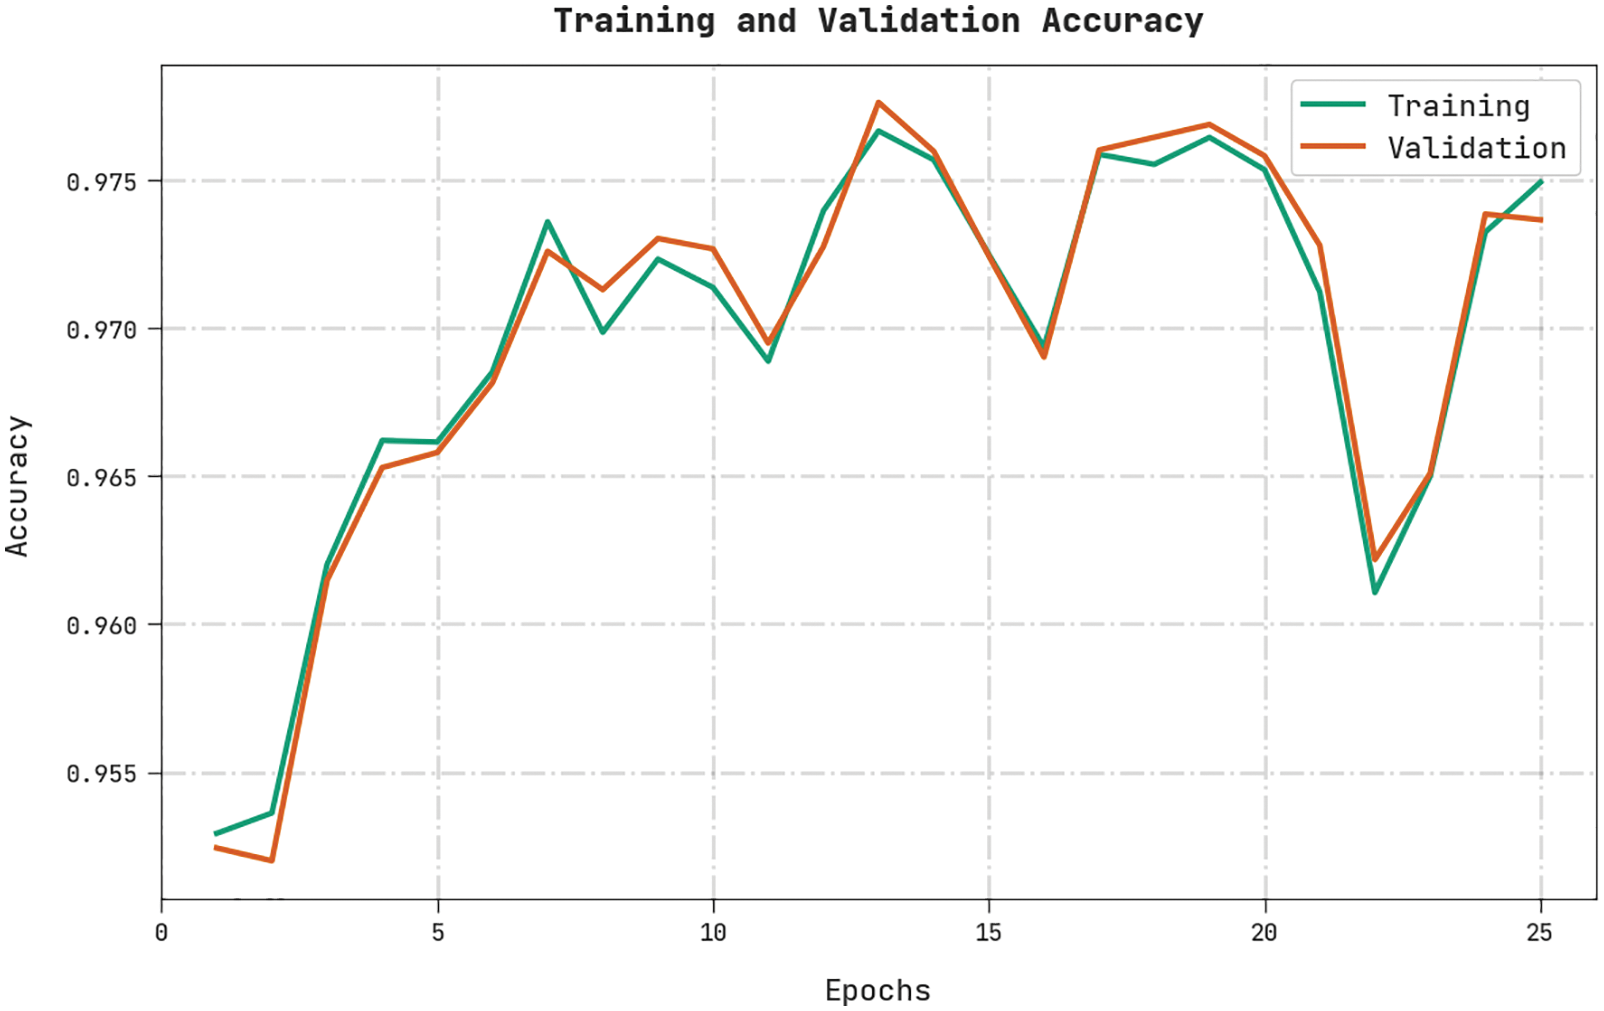
Figure 8: TA and VA analyses results of the HSAFS-OCAE methodology
Both Training Loss (TL) and Validation Loss (VL) values, attained by the HSAFS-OCAE approach on test dataset, are displayed in Fig. 9. The experimental outcomes denote that the proposed HSAFS-OCAE algorithm exhibited the least TL and VL values while the VL values were lower than the TL values.
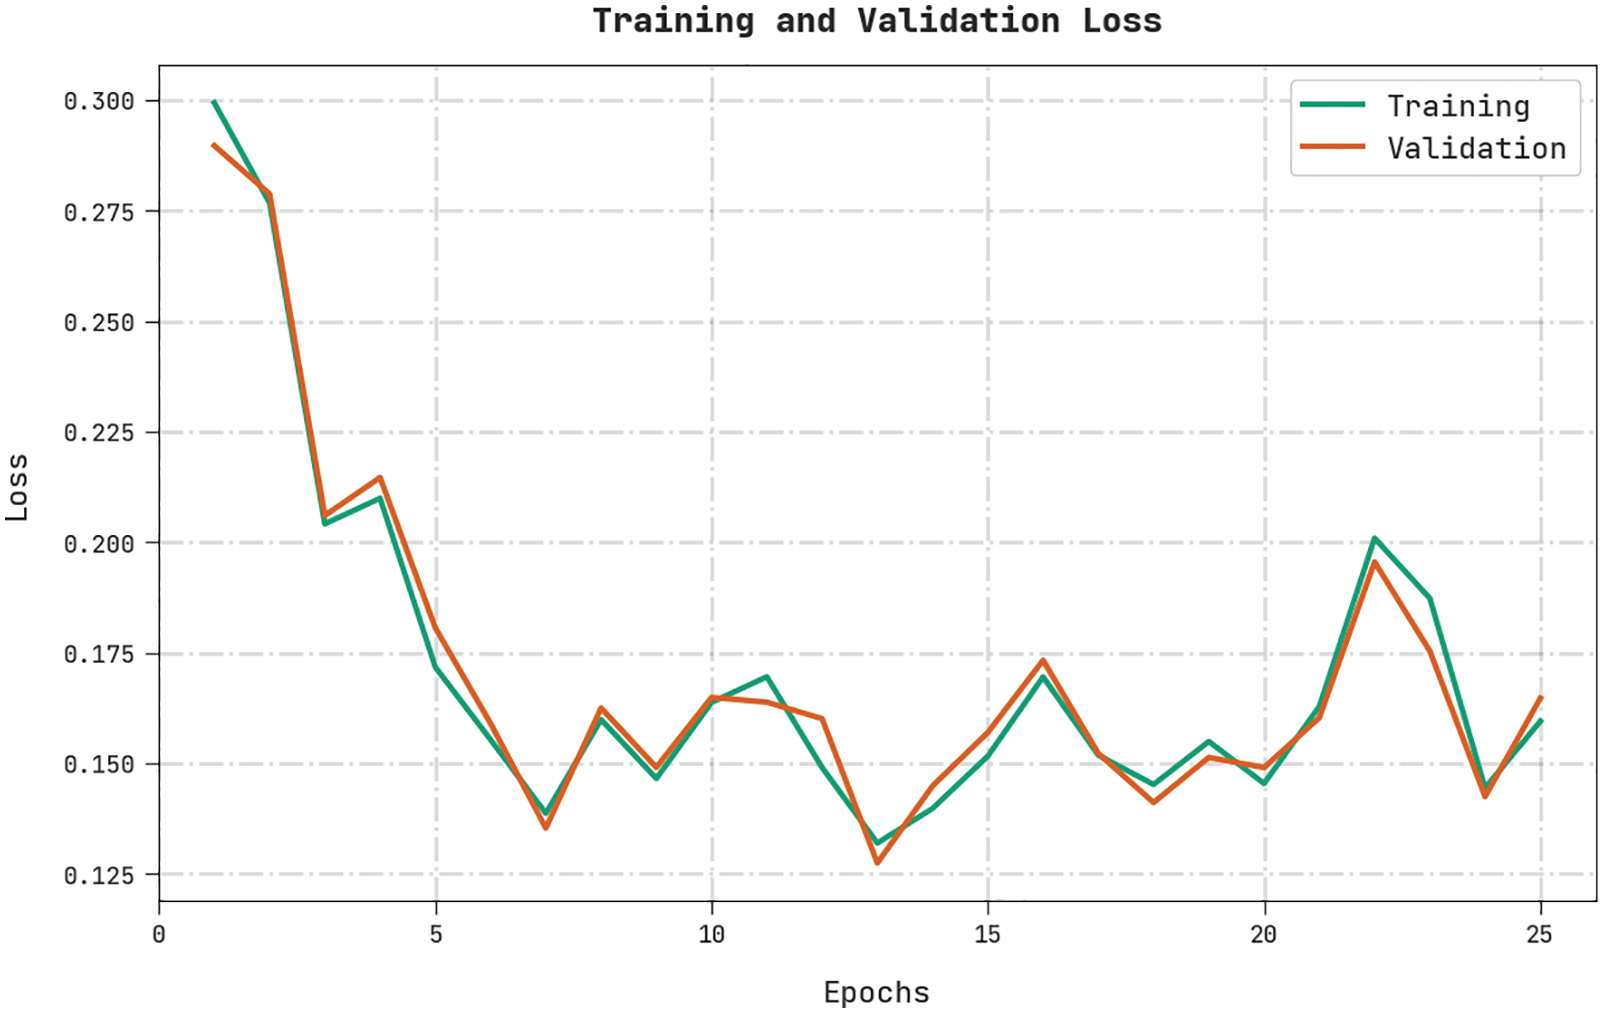
Figure 9: TL and VL analyses results of the HSAFS-OCAE methodology
A clear precision-recall analysis was conducted upon the HSAFS-OCAE method using the test dataset and the results are shown in Fig. 10. The figure represents that the proposed HSAFS-OCAE method produced enhanced precision-recall values under all the classes.
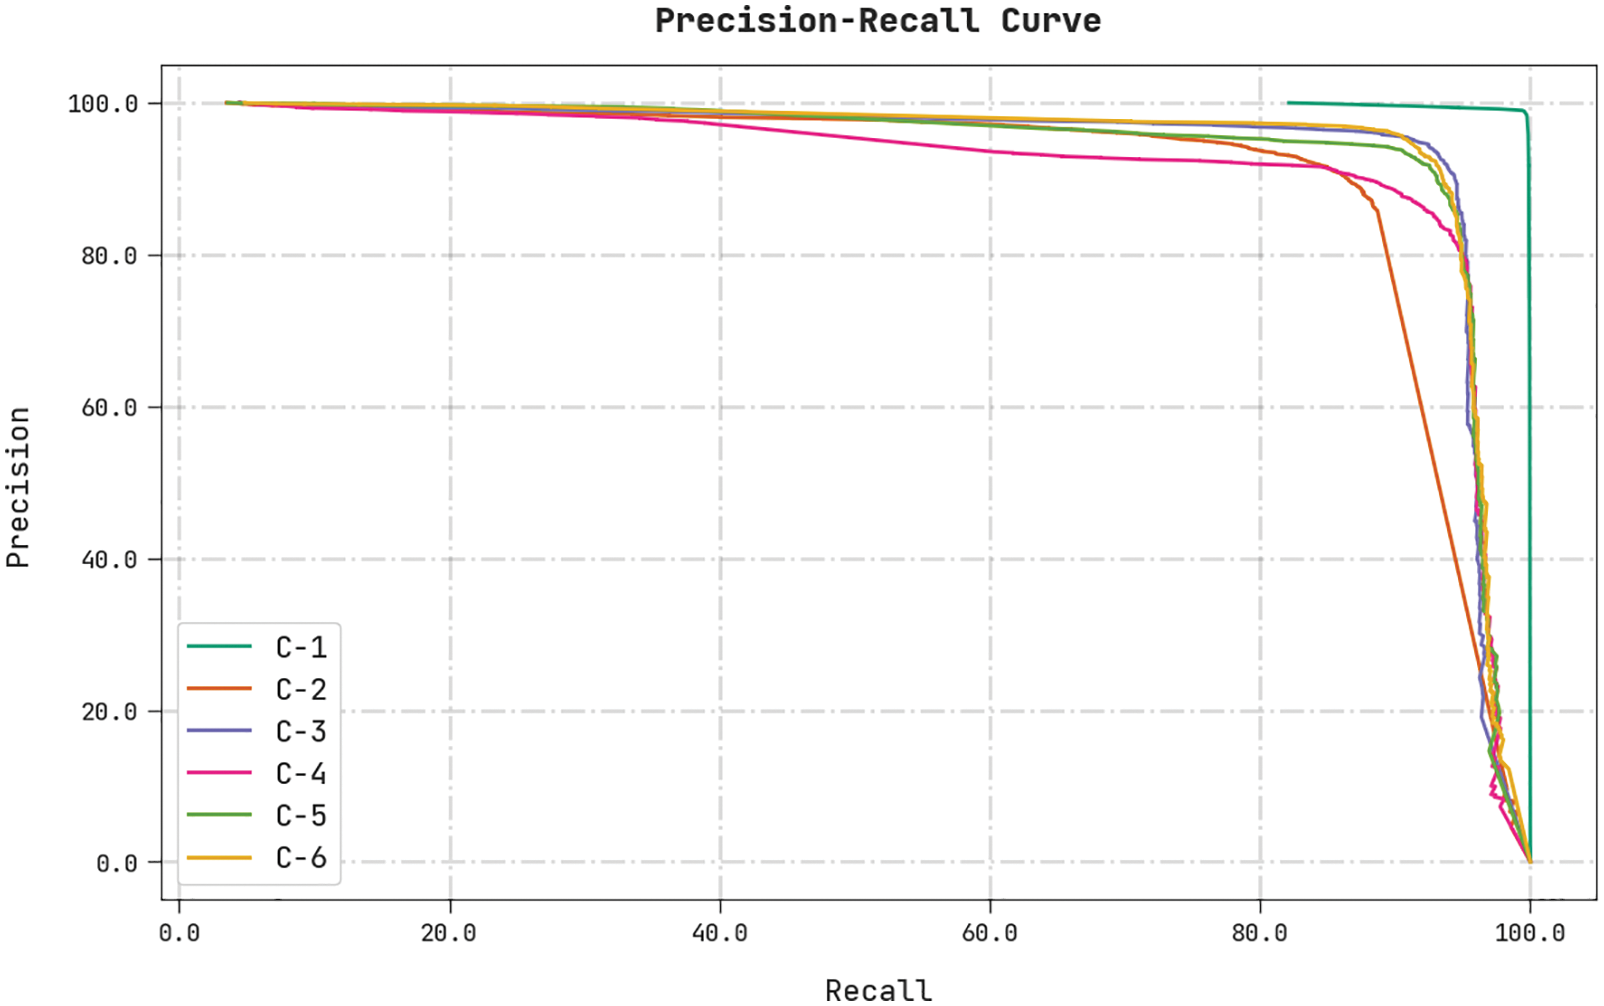
Figure 10: Precision-recall curve analysis results of the HSAFS-OCAE methodology
A brief ROC analysis was conducted upon the HSAFS-OCAE method using the test dataset and the results are depicted in Fig. 11. The results infer that the proposed HSAFS-OCAE technique established its supremacy in categorizing the test dataset under distinct classes.
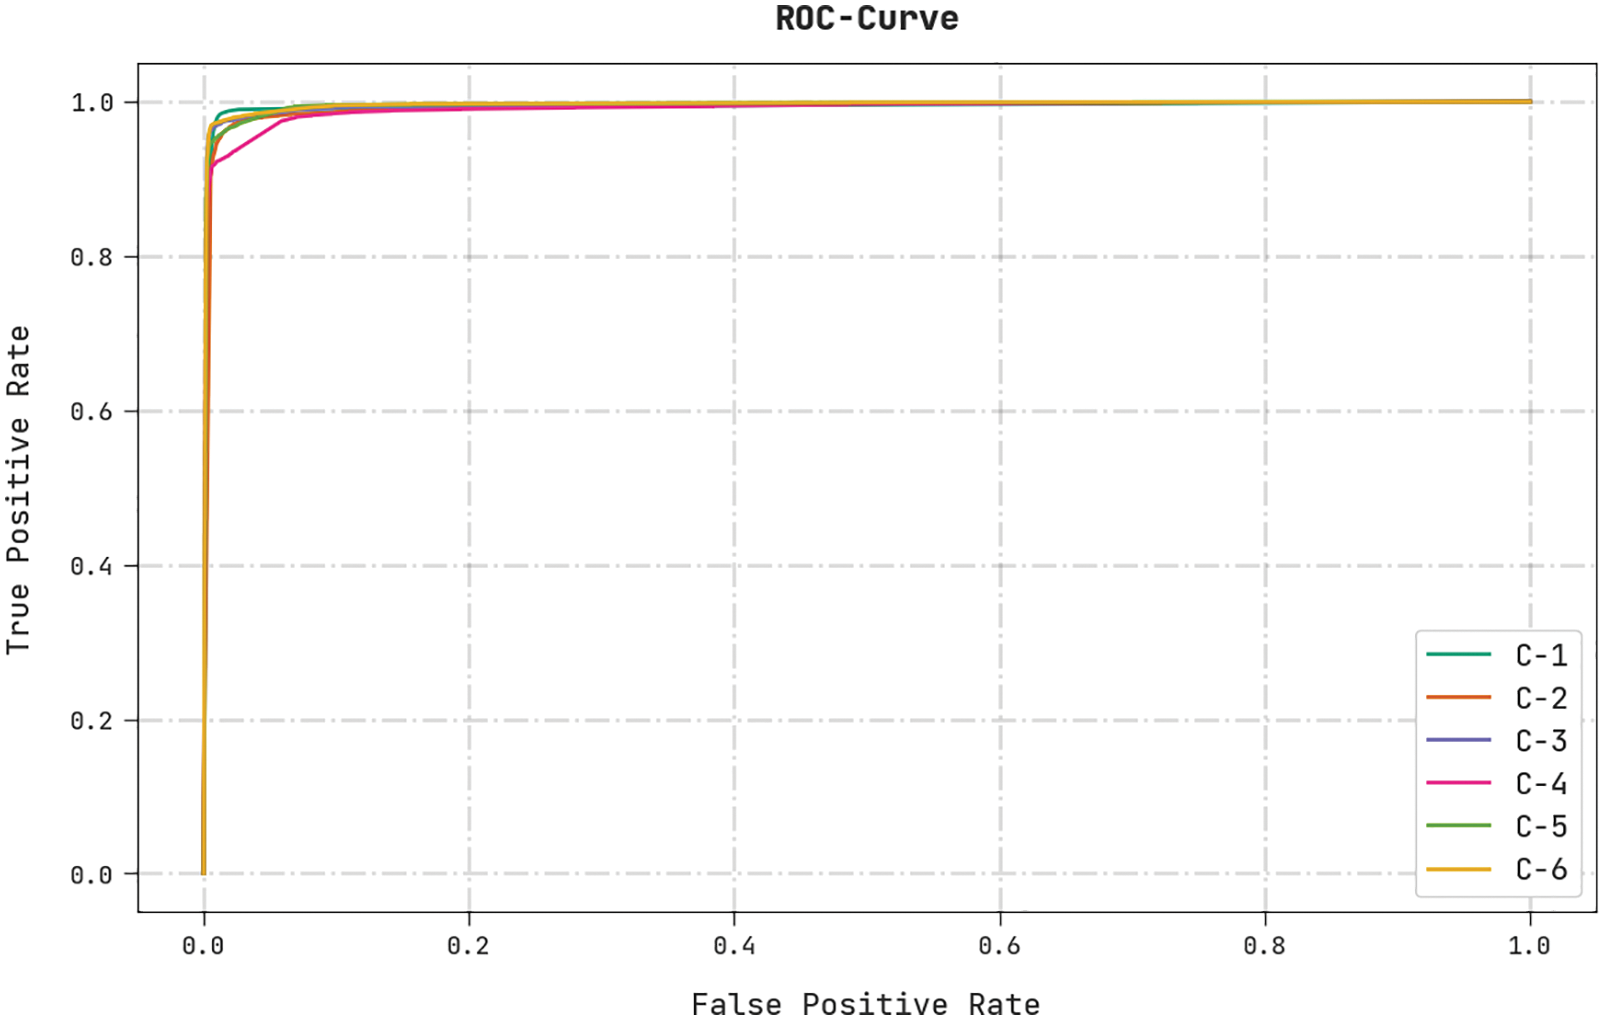
Figure 11: ROC curve analysis results of the HSAFS-OCAE methodology
To showcase the supremacy of the proposed HSAFS-OCAE model, a comparative study was conducted, and the results are shown in Table 4 [11].
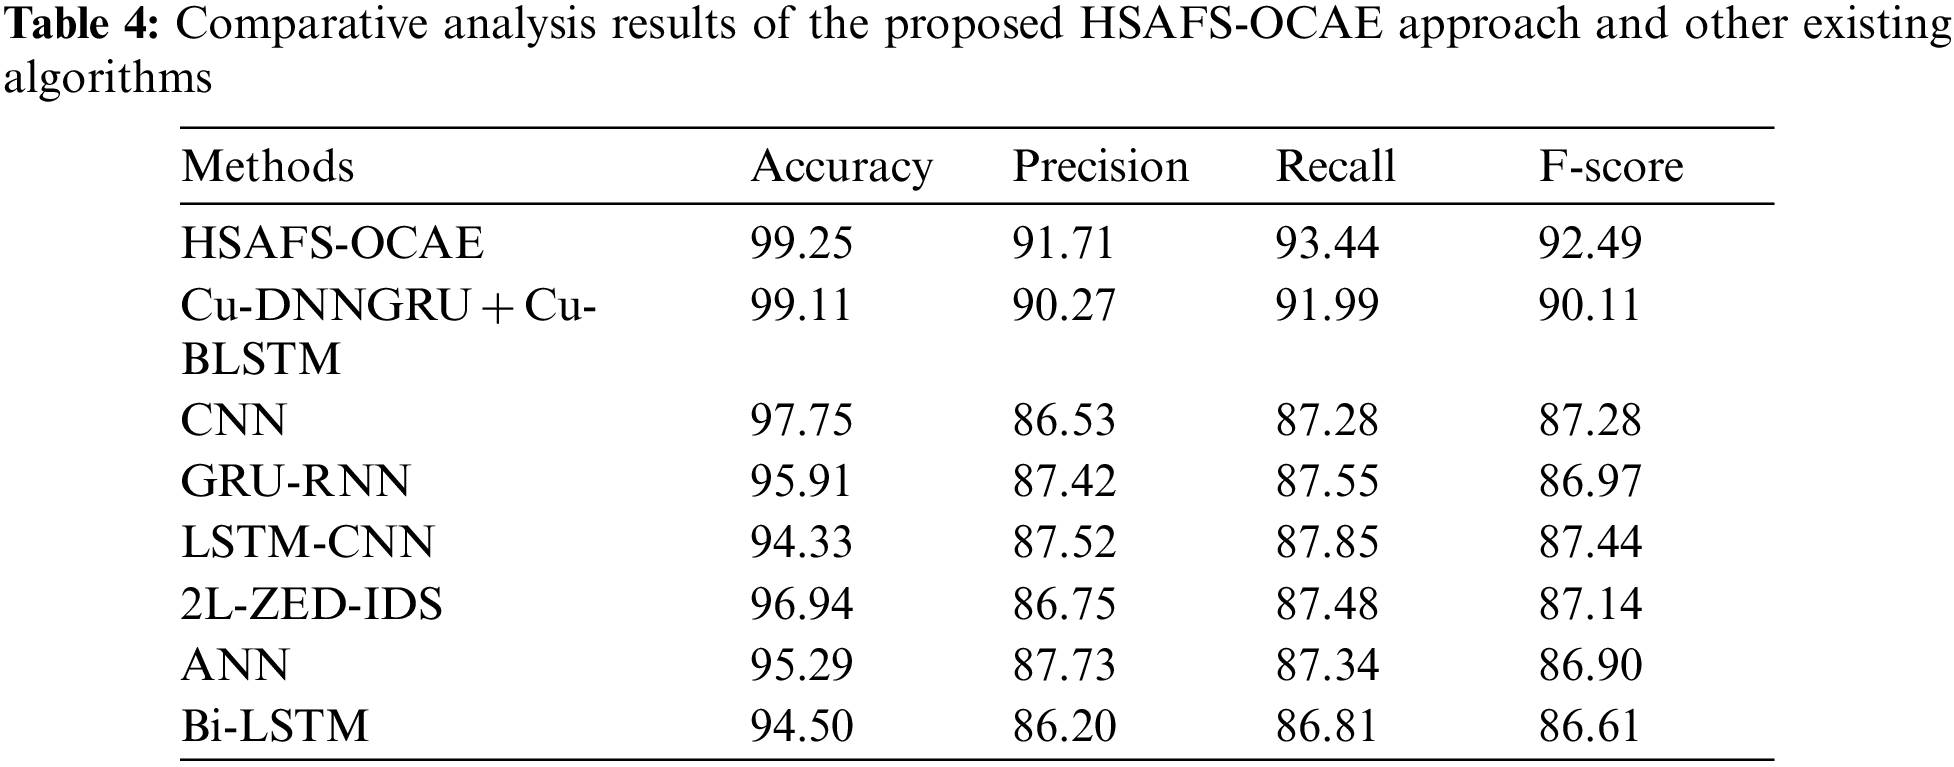
Fig. 12 demonstrates the comparison study results of the proposed HSAFS-OCAE model and other existing models in terms of

Figure 12:
Fig. 13 illustrates the comparative analysis results accomplished by the proposed HSAFS-OCAE model and other existing models in terms of

Figure 13:
Fig. 14 portrays the comparative analysis results achieved by the proposed HSAFS-OCAE method and other existing models in terms of
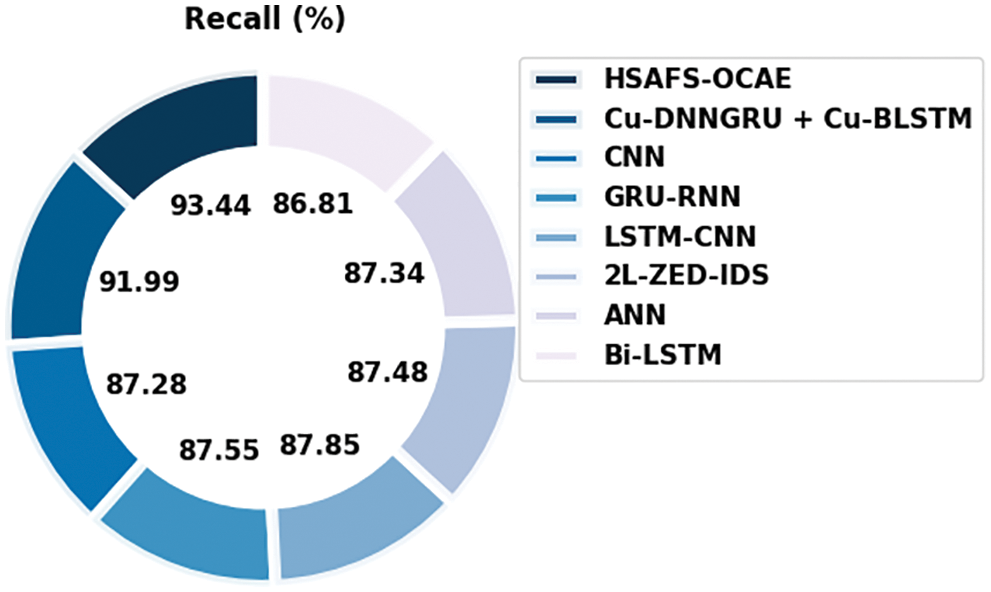
Figure 14:
In this study, a new HSAFS-OCAE model has been devised to recognize intrusions in the SDN-enabled IoT environment proficiently. The presented HSAFS-OCAE model follows a three-stage process in which the HSAFS technique is exploited for feature selection. Next, the CAE methodology is leveraged to recognise and classify intrusions in the SDN-enabled IoT environment. Finally, the AFSA-based hyperparameter tuning process is performed to boost the intrusion detection performance of the CAE approach. The proposed HSAFS-OCAE methodology was experimentally validated under several aspects. The comparison study outcomes established the improved outcomes of the HSAFS-OCAE model over other techniques. In the future, the HSAFS-OCAE model’s performance can be improved using hybrid metaheuristic approaches.
Funding Statement: The authors extend their appreciation to the Deanship of Scientific Research at King Khalid University for funding this work through Small Groups Project under Grant Number (168/43). Princess Nourah bint Abdulrahman University Researchers Supporting Project Number (PNURSP2022R237), Princess Nourah bint Abdulrahman University, Riyadh, Saudi Arabia. The authors would like to thank the Deanship of Scientific Research at Umm Al-Qura University for supporting this work by Grant Code: (22UQU4320484DSR01).
Conflicts of Interest: The authors declare that they have no conflicts of interest to report regarding the present study.
References
1. N. Sultana, N. Chilamkurti, W. Peng and R. Alhadad, “Survey on SDN based network intrusion detection system using machine learning approaches,” Peer-to-Peer Networking and Applications, vol. 12, no. 2, pp. 493–501, 2019. [Google Scholar]
2. J. C. S. Sicato, S. K. Singh, S. Rathore and J. H. Park, “A comprehensive analyses of intrusion detection system for IoT environment,” Journal of Information Processing Systems, vol. 16, no. 4, pp. 975–990, 2020. [Google Scholar]
3. S. K. Dey and M. Rahman, “Effects of machine learning approach in flow-based anomaly detection on software-defined networking,” Symmetry, vol. 12, no. 1, pp. 7, 2019. [Google Scholar]
4. A. A. Albraikan, S. B. H. Hassine, S. M. Fati, F. N. Al-Wesabi, A. Mustafa Hilal et al., “Optimal deep learning-based cyberattack detection and classification technique on social networks,” Computers, Materials & Continua, vol. 72, no. 1, pp. 907–923, 2022. [Google Scholar]
5. A. Wani, S. Revathi and R. Khaliq, “SDN-based intrusion detection system for IoT using deep learning classifier (IDSIoT-SDL),” CAAI Transactions on Intelligence Technology, vol. 6, no. 3, pp. 281–290, 2021. [Google Scholar]
6. T. A. Tang, L. Mhamdi, D. McLernon, S. A. R. Zaidi, M. Ghogho et al., “DeepIDS: Deep learning approach for intrusion detection in software defined networking,” Electronics, vol. 9, no. 9, pp. 1533, 2020. [Google Scholar]
7. A. O. Alzahrani and M. J. F. Alenazi, “Designing a network intrusion detection system based on machine learning for software defined networks,” Future Internet, vol. 13, no. 5, pp. 111, 2021. [Google Scholar]
8. M. A. Alohali, F. N. Al-Wesabi, A. M. Hilal, S. Goel, D. Gupta et al., “Artificial intelligence enabled intrusion detection systems for cognitive cyber-physical systems in industry 4.0 environment,” Cognitive Neurodynamics, 2022, https://doi.org/10.1007/s11571-022-09780-8. [Google Scholar]
9. P. Manso, J. Moura and C. Serrão, “SDN-based intrusion detection system for early detection and mitigation of ddos attacks,” Information, vol. 10, no. 3, pp. 106, 2019. [Google Scholar]
10. M. A. Ferrag, L. Shu, H. Djallel and K. K. R. Choo, “Deep learning-based intrusion detection for distributed denial of service attack in agriculture 4.0,” Electronics, vol. 10, no. 11, pp. 1257, 2021. [Google Scholar]
11. A. S. Reddy, B. R. Reddy and A. S. Babu, “An improved intrusion detection system for sdn using multi-stage optimized deep forest classifier,” International Journal of Computer Science & Network Security, vol. 22, no. 4, pp. 374–386, 2022. [Google Scholar]
12. P. R. Grammatikis, P. Sarigiannidis, G. Efstathopoulos and E. Panaousis, “ARIES: A novel multivariate intrusion detection system for smart grid,” Sensors, vol. 20, no. 18, pp. 5305, 2020. [Google Scholar]
13. D. Javeed, T. Gao, M. T. Khan and I. Ahmad, “A hybrid deep learning-driven sdn enabled mechanism for secure communication in internet of things (IoT),” Sensors, vol. 21, no. 14, pp. 4884, 2021. [Google Scholar]
14. J. Shu, L. Zhou, W. Zhang, X. Du and M. Guizani, “Collaborative intrusion detection for vanets: A deep learning-based distributed sdn approach,” IEEE Transactions on Intelligent Transportation Systems, vol. 22, no. 7, pp. 4519–4530, 2021. [Google Scholar]
15. R. Shrestha, A. Omidkar, S. A. Roudi, R. Abbas and S. Kim, “Machine-learning-enabled intrusion detection system for cellular connected uav networks,” Electronics, vol. 10, no. 13, pp. 1549, 2021. [Google Scholar]
16. M. Aslam, D. Ye, A. Tariq, M. Asad, M. Hanif et al., “Adaptive machine learning based distributed denial-of-services attacks detection and mitigation system for sdn-enabled IoT,” Sensors, vol. 22, no. 7, pp. 2697, 2022. [Google Scholar]
17. A. Derhab, M. Guerroumi, A. Gumaei, L. Maglaras, M. A. Ferrag et al., “Blockchain and random subspace learning-based ids for sdn-enabled industrial IoT security,” Sensors, vol. 19, no. 14, pp. 3119, 2019. [Google Scholar]
18. L. Abualigah, A. Diabat and Z. W. Geem, “A comprehensive survey of the harmony search algorithm in clustering applications,” Applied Sciences, vol. 10, no. 11, pp. 3827, 2020. [Google Scholar]
19. M. S. Seyfioglu, A. M. Ozbayoglu and S. Z. Gurbuz, “Deep convolutional autoencoder for radar-based classification of similar aided and unaided human activities,” IEEE Transactions on Aerospace and Electronic Systems, vol. 54, no. 4, pp. 1709–1723, 2018. [Google Scholar]
20. A. M. Kabir, M. Kamal, F. Ahmad, Z. Ullah, F. R. Albogamy et al., “Optimized economic load dispatch with multiple fuels and valve-point effects using hybrid genetic–artificial fish swarm algorithm,” Sustainability, vol. 13, no. 19, pp. 10609, 2021. [Google Scholar]
Cite This Article
 Copyright © 2023 The Author(s). Published by Tech Science Press.
This work is licensed under a Creative Commons Attribution 4.0 International License , which permits unrestricted use, distribution, and reproduction in any medium, provided the original work is properly cited.
 Downloads
 Citation Tools