
 Submit a Paper
 Propose a Special lssue
 Open Access
ARTICLE

Data-Driven Approach for Condition Monitoring and Improving Power Output of Photovoltaic Systems
1 Department of Electrical and Computer Engineering (ECE), King Abdulaziz University, Jeddah 21589, Saudi Arabia
2 Advance Power Electronics Research Lab, Department of Electrical Engineering, Jamia Millia Islamia, New Delhi, India
3 Computer Science Department, Faculty of Computing and Information Technology, King Abdulaziz University, Jeddah
21589, Saudi Arabia
* Corresponding Author: Nebras M. Sobahi. Email:
Computers, Materials & Continua 2023, 74(3), 5757-5776. https://doi.org/10.32604/cmc.2022.028340
Received 08 February 2022; Accepted 31 May 2022; Issue published 28 December 2022
 View Full Text
 Download PDF
Abstract
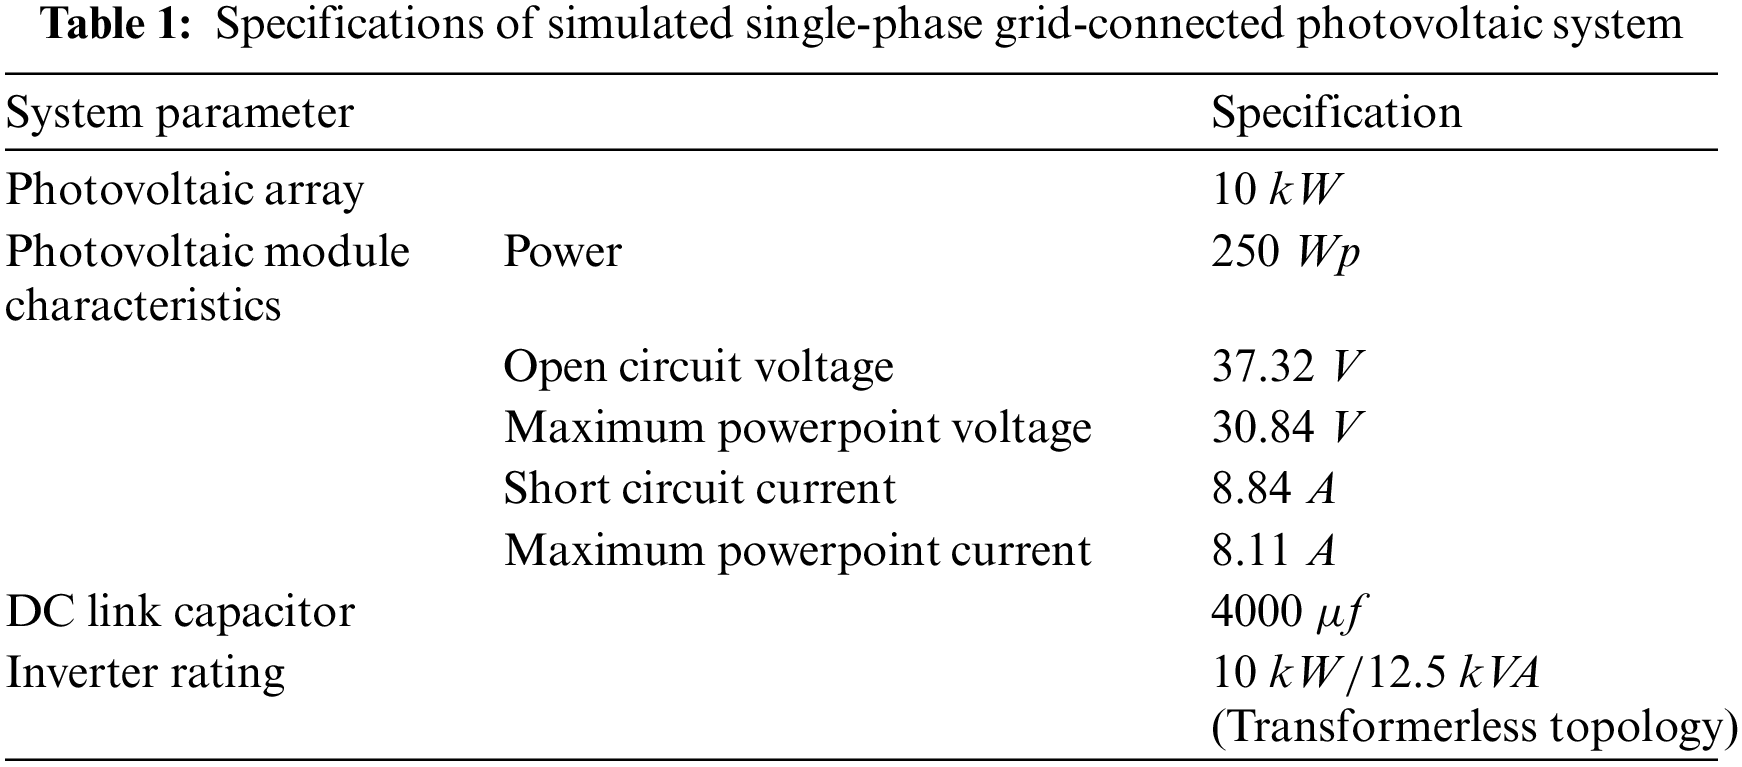
Increasing renewable energy targets globally has raised the requirement for the efficient and profitable operation of solar photovoltaic (PV) systems. In light of this requirement, this paper provides a path for evaluating the operating condition and improving the power output of the PV system in a grid integrated environment. To achieve this, different types of faults in grid-connected PV systems (GCPVs) and their impact on the energy loss associated with the electrical network are analyzed. A data-driven approach using neural networks (NNs) is proposed to achieve root cause analysis and localize the fault to the component level in the system. The localized fault condition is combined with a parallel operation of adaptive neurofuzzy inference units (ANFIUs) to develop a power mismatch-based control unit (PMCU) for improving the power output of the GCPV. To develop the proposed framework, a 10-kW single-phase GCPV is simulated for training the NN-based anomaly detection approach with 14 deviation signals. Further, the developed algorithm is combined with the PMCU implemented with the experimental setup of GCPV. The results identified 98.2% training accuracy and 43000 observations/sec prediction speed for the trained classifier, and improved power output with reduced voltage and current harmonics for the grid-connected PV operation.Keywords
Driven by environmental and political incentives, the transition of power generation from oil-based economies to renewable energy is increasing in Middle Eastern countries. The solar photovoltaic (PV) technology, which is a long-established renewable energy source in Saudi Arabia, has encouraged achieving carbon neutrality with
Initially, the literature on condition monitoring and power output improvement is mostly developed considering the climate data at the plant location [5]. This is a cost-effective approach due to readily available metrological data but the expected energy yield has low accuracy due to the uncertain climatic conditions [6,7]. Further, the metrological data measures are combined with soft computing techniques in [8–10] to estimate energy production. Both the approaches are developed from the PV module power generation data collected using a PV system operated for normal and faulty conditions. In [11,12], the authors developed artificial intelligence and statistical data [13] based on automatic fault detection and condition monitoring of PV systems. These techniques are not optimized for localizing the faults to the component level in the PV system. In an approach proposed by Mellit [14], a standalone photovoltaic system is modelled with an adaptive neuro-fuzzy inference system to improve the power output of the PV generation to the load. In addition to the metrological data-based approaches and intelligent techniques, the simulated models based on stochastic [12], parametric [15], and non-parametric techniques [16] for the individual components of the system are developed. It is observed that these models mostly rely on the static/dynamic thresholds of the grid-connected PV system network variables to achieve condition monitoring. This resulted in drawbacks due to misclassification of the transient operating conditions as abnormalities in the system which further led to unintended trips and maintenance of the PV system. In addition to the above methods, the signal processing- techniques, which are based on the time and frequency domain were investigated in the literature to extract the fault feature from the measured converter data [17–19]. Further, the neural network-based multiple open-circuit fault diagnosis for photovoltaic inverters is developed in [20]. The research utilized the multistate data processing, and subsection fluctuation analysis approaches for practical implementation of multiple switch fault diagnosis. In [21], a temporal convolutional network-based fault diagnosis approach is developed for eliminating the problems of data noise with the conventional approaches for fault diagnosis for power converters. In general, all the statistical, data-driven, and decision-making approaches, proved to be efficient in the converter fault detection. However, their relatively slow response and inability to identify the effect of multiple faults is identified as a major drawback.
The above-discussed approaches revealed a major scientific gap between the condition monitoring and power output improvement approaches by raising questions on “how the condition monitoring approaches localize the faults/abnormalities to component level” and “how the classified condition of the PV system helps in improving the power output of the electrical network”. In light of the above observations and drawbacks, this research aims at developing a data-driven framework capable of achieving performance evaluation and improving power output for the grid-connected PV systems. This is achieved by developing a root cause analysis approach developed with various statistical and intelligent techniques. The major aspects of the proposed framework involve:
• A data acquisition approach with a correlation approach for linear analysis between the data points to achieve efficient processing of the measured data.
• A normal behavior model through intelligent techniques for identifying the normal operation of the components.
• An anomaly detection mechanism to classify the abnormal and underperformance operation in the system and localize the faults to the component level. The anomaly data points are subjected to principal component analysis to assist in detecting the root of the anomaly.
The proposed framework is further tested with different scenarios of PV systems operated in a grid-connected environment. The remaining sections of the paper are organized as follows: Section II discusses the faults in grid-connected PV systems at the component level and their impact on the electrical network. Section III discusses the data-driven methodology for anomaly detection and performance evaluation of the grid-connected PV system. In Section IV the details of classification training for anomaly detection are discussed with measured data of various component faults in the grid-connected PV system. Section V develops the control mechanism for power output improvement with intelligent techniques and the conclusion is discussed in Section VI.
2 Failure Modes of Grid-Connected Photovoltaic Systems
Manufacturers today have addressed the technical challenges associated with the components of PV systems in grid-connected environments to achieve enhanced reliability and reduced size. But the field surveys for various grid-connected PV systems operating in different climatic zones [22,23] identified that a significant percentage of systems experience various faults and have potential performance problems [23,24]. Most of these faults are categorized in three different parts i.e., DC side, AC side, and the converter faults, for a convenient analysis [25–27]. Generally, faults on the DC side represent the PV module defects, failure of string and array interconnections, and uncertain effects of climatic conditions [28,29]. The AC side failures are registered either due to abnormalities and grid instability problems, or due to interconnection issues between the inverter, load, and grid. Further, the aging of power modules, internal failure mechanisms of converters, and control mechanism failures are categorized as the faults associated with the power electronics converters. A brief overview of commonly identified faults and their impact on the grid-connected PV systems are discussed in the further subsections.
Ranging from higher probability to lower probability of occurrence, the most common faults in a grid-connected PV system are identified from the literature [30] are, Inverter Internal Error (IIE), Data Acquisition System Fault (DAQF), Grid Instability (GI), and Module Fault (MF). The IIE can be observed in a PV system due to the various failure mechanisms associated with power modules such as short/open circuit failure modes, reduced dielectric strength, and increased leakage current. Generally, the fault detection system associated with the inverter can identify most of these failures with the help of the power module characteristics. This has significantly decreased the probability of inverter faults and improved its reliability. But the impact of faults on the terminal characteristics of the inverter during the aging/degradation process is difficult to identify with the integrated fault detection mechanism. Apart from the IIE, the DAQF occurs due to the failure of wired and wireless connections, and due to collateral damage to the sensors and other measurement components installed in the system. Further, the grid instability depends on the grid quality at the point of common coupling of the PV system. This fault has a very low probability in locations with high industrial loads and a high probability in rural areas. The high probability of grid instability may result in unintentional islanding of the PV system which further leads to continuous energization of the loads causing danger for the operation and maintenance processes. The last kind of common fault is the module fault which may occur due to short/open circuits between PV strings in an array, broken cells and aging of PV modules, and due to other external conditions like periodic shading. The short circuit faults happen due to the involvement of a short circuit between the PV strings in an array and the ground, whereas the broken cell and aging of modules are related to the accidental impact of objects and hotspots on the PV modules, and the average annual degradation of the PV module material respectively [31]. Further, the periodic shading is not a fault but it impacts the power generation capability of the PV module or array by shadows which can deteriorate the surface area of modules. Therefore, from the identified common faults, their effect in terms of energy loss in the grid-connected PV system is summarized in Fig. 1.
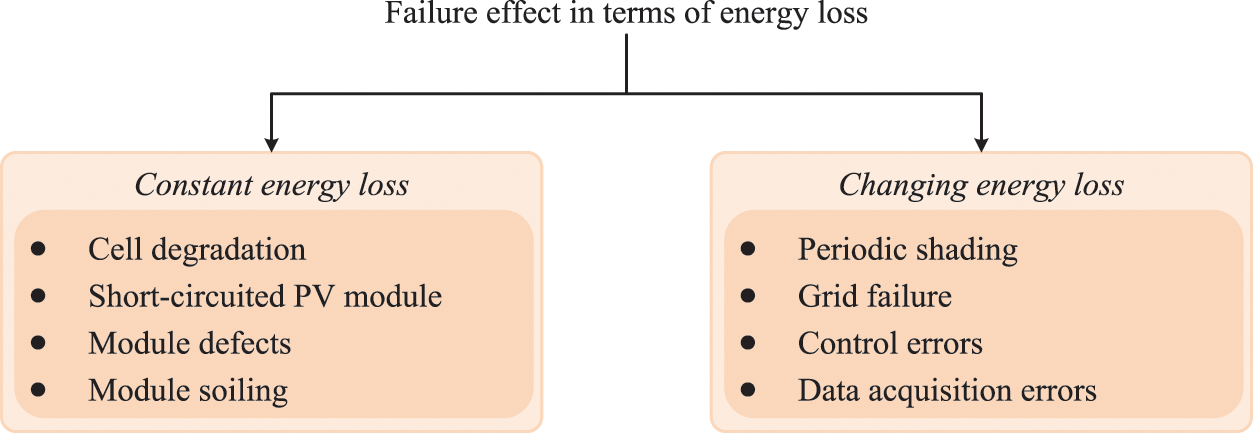
Figure 1: Effect of common faults in terms of energy loss on grid-connected photovoltaic system
2.2 Impact of PV System Faults on Electrical Network
The grid integration of PV systems is usually achieved to improve the performance of the electric network through grid feeding and grid supporting modes. This helped in improving the voltage profile and reducing the power loss in the network. However, the uncertain operation of PV systems due to varying metrological data, aging/degradation of components, and other external factors has imposed several negative impacts on the electrical network. These negative impacts resulted in voltage fluctuation problems, power mismatch, harmonics, overloading of feeder, and malfunctioning of relays and protection devices. The literature corresponding to the negative impacts of grid-connected PV system failures on the electrical network has classified the problem into three main categories as discussed in Fig. 2.
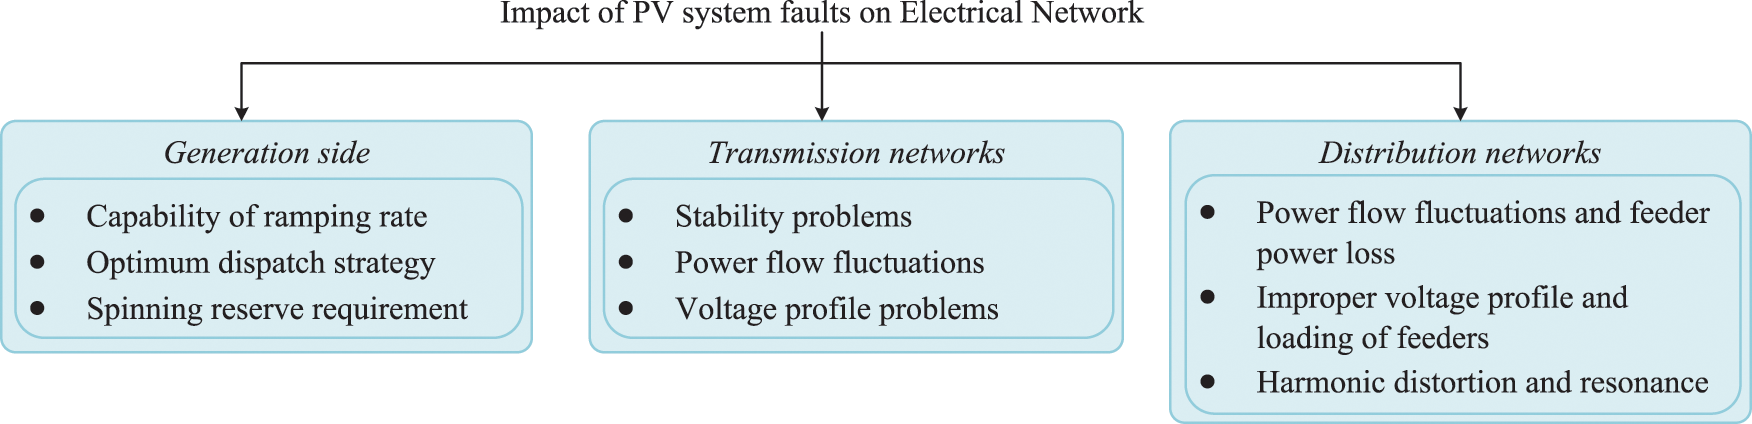
Figure 2: Negative impacts of grid-connected photovoltaic system faults on the electrical network
The failure modes of PV systems and their impact on the electrical network discussed in section II identified the need for the development of a condition monitoring and maintenance management approach. Considering this, a root cause analysis approach (RCAA) is proposed to improve the operation and maintenance activities of the grid-connected PV system. The proposed approach works by analyzing the current and past operating conditions of the PV systems and has advantages in localizing the abnormality in the system to the component level. This reduces the maintenance downtime and increases the system availability time for operation and hence, bringing out better efficiency and higher savings.
The RCAA is developed on a generic data-driven framework for anomaly detection and performance analysis as shown in Fig. 3. Initially, the data of abnormality conditions for different components of the PV system connected to the electrical network are identified from historical failure moments and simulated conditions. Further, a normal behavior model is derived through the data of all the components by using a data-driven model. Furthermore, the abnormal behaviors of the systems currently operating the electrical network are tested with the normal behavior model and the RCAA is performed on the identified condition of the system.
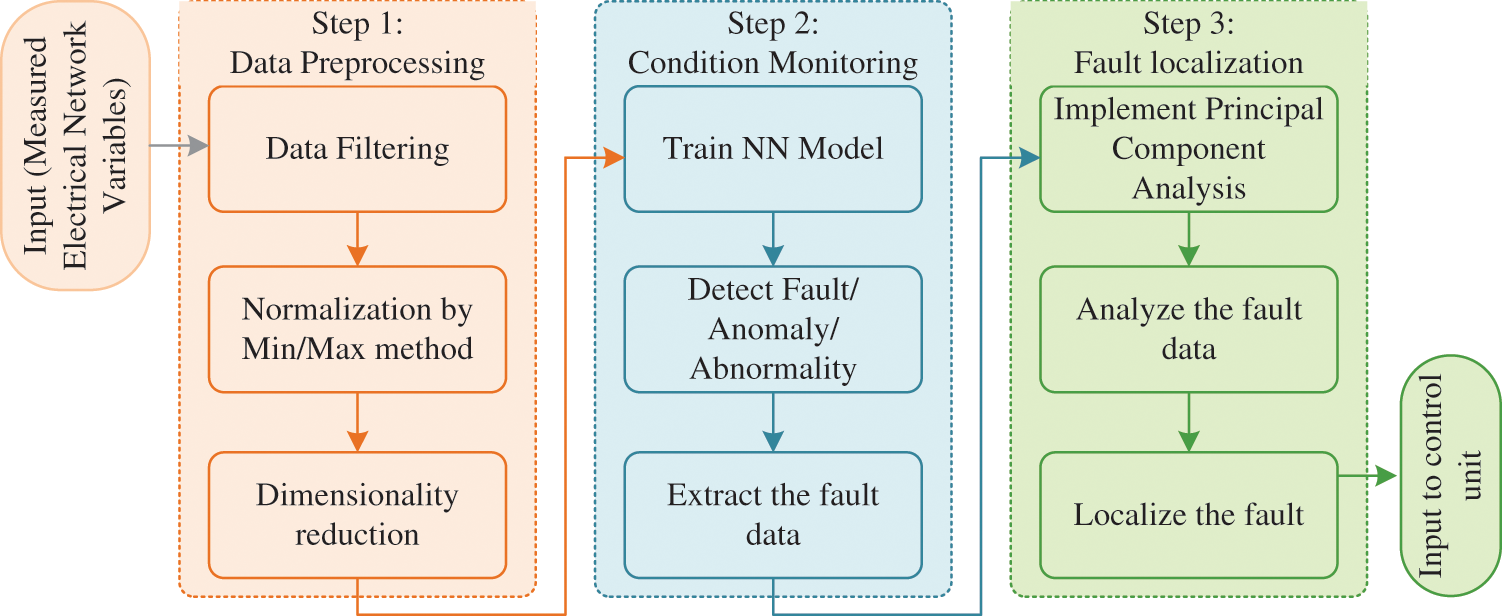
Figure 3: Generic data-driven anomaly detection and performance analysis framework
Step1: Pre-processing: The raw data recorded with the sensors installed on components of the grid-connected PV systems provide a large set of information and noise. These large data sets can be complex to train and may result in time-consuming and inefficient anomaly detection approaches. Hence, to enhance the computational efficiency of the RCCA, the data needs to be processed for achieving anomaly detection and performance analysis. For these reasons, different statistical, and cause and effect methods are discussed in the literature to improve the analysis. These approaches are proved to have higher efficiencies when applied with complex signals and also provide data protection (no loss of information) [32,33] which will be an added advantage especially while dealing with the aspects of condition monitoring. Further, it is identified that the statistical approaches have drawbacks with physical knowledge of the system and hence, the cause-and-effect relationship methods like Pearson correlation are used to improve the analysis. Before processing the raw data with the Pearson correlation approach, it is scaled to provide a positive normalization using (1) as
where
Further, the Pearson correlation provides a linear relationship between two variables to present a piece of elementary information [34] which is advantageous at the preliminary stage of the analysis. This information corresponds to the sign of the coefficient which signifies the linearly positive and negative output relationship among the variables, and the magnitude of the coefficient which signifies the small, medium, and large mean correlation level between the variables. The expression for achieving linear relation between variables using Pearson correlation is given as
where
Step2: Anomaly Detection: To analyze the component performance in the system, a normal behavior model is simulated, and its output is compared with the monitored behavior. This aids in differentiating and detecting the anomaly in the system operation. The generalized approach for the normal behavior model with the multilayer neural network perceptron approach is shown in Fig. 4.
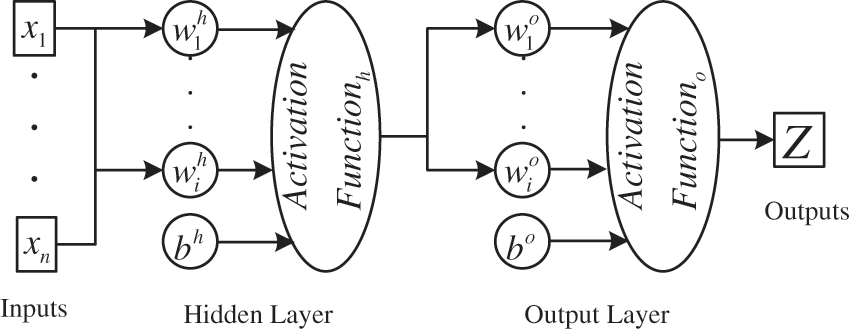
Figure 4: Structure of a feed-forward multilayer perceptron neural network
The neural network (NN) approach provides great flexibility while handling nonlinear complex systems and developing the normal behavior model for the component. The real-time measurements from the sensors at the grid-connected PV system components are the input variables of the NN and the target is labeled based on the objective of the model. The optimum configuration for developing the NN model is achieved by testing the various possible combinations and by using the pruning algorithm. Further, the optimum configuration is trained with the scaled conjugate gradient approach to tuning the biases and weights for minimizing the objective function of the NN. Further, the activation functions in the network structure are estimated as
where
Similarly, a linear function calculates the activation function
The normal behavior model developed with the trained NN structure provides a deviation signal
The
Step3: Root Cause Analysis: To deal with the correlated data and achieve root cause analysis, the principal component analysis (PCA) approach is adopted. This approach defines a new system of coordinates to transform the correlated data into uncorrelated linear data. The extracted data points from the anomaly detection are provided as input to the PCA. Initially, the PCA approximates a sufficient number of input variables to model the system without the loss of any information. This helps in improving the accuracy of analysis as the resultant variables are aimed at capturing the variability, and the highest level of change in the data. Further, PCA estimates the covariance matrix
From the covariance matrix, the eigenvectors and eigenvalues are extracted, and the eigenvector with the highest eigenvalue is defined as a principal component. Besides, the first principal component of the PCA handles the highest variability in the data [12,34]. Further, all the principal components are combined to create a matrix of vectors known as feature matrices. To get the outcome for the PCA, the transpose of original data is multiplied by the feature matrix, and the resultant new principal components are obtained. As an outcome of the PCA, the principal component coefficients, the variance of the newly defined principal components and their percentage, and the original data in the mapped coordinate system are obtained.
4 Photovoltaic System Anomaly Detection
To assess the operation of the proposed framework with the grid-connected PV systems, a single-phase grid-connected PV system is simulated with the MATLAB/Simulink environment. To model the system, the inputs to the PV array i.e., the irradiance and the temperature are considered to be constant. A degradation factor of
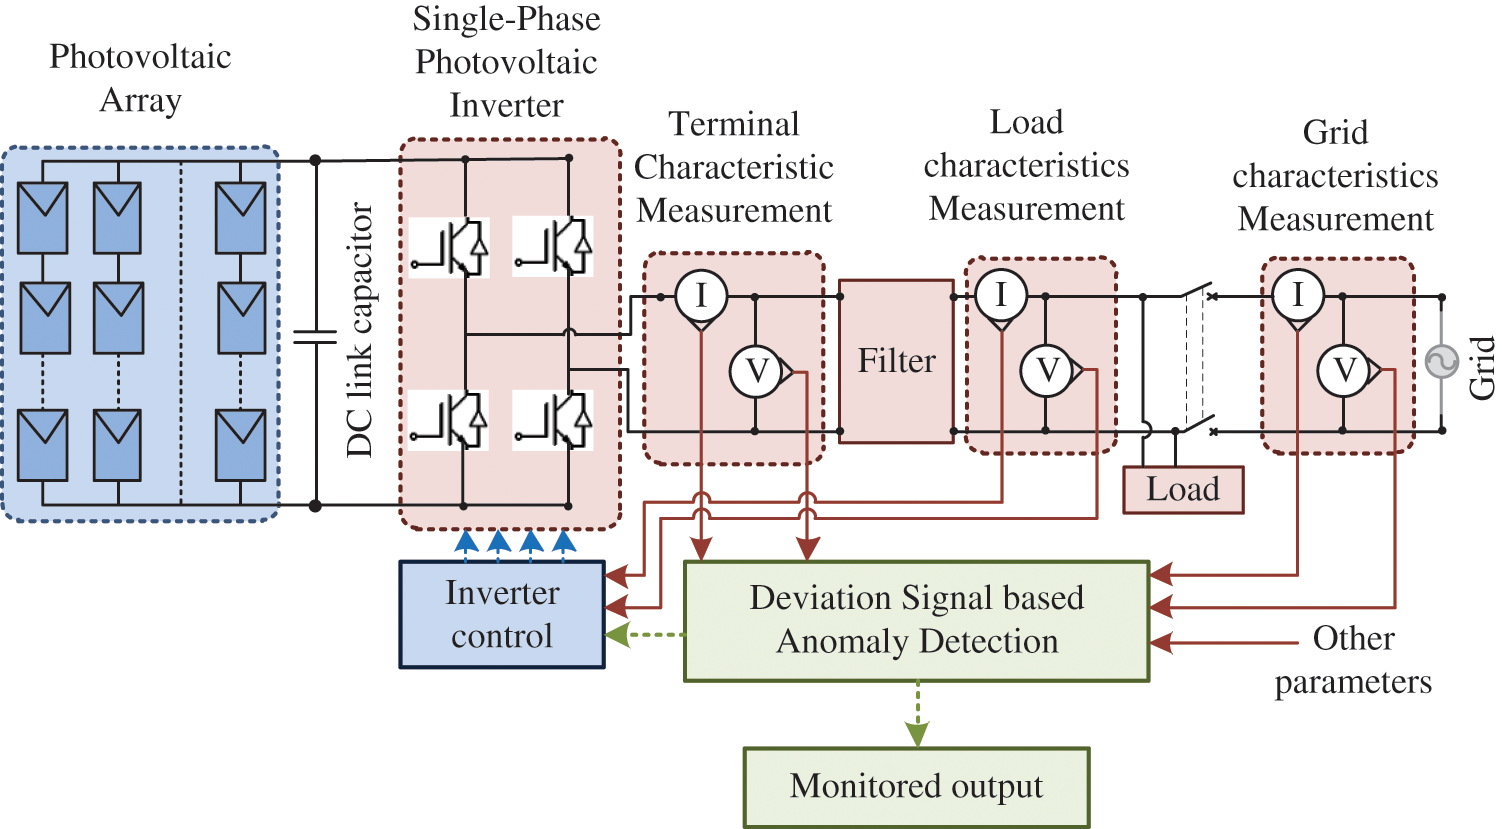
Figure 5: Schematic of single-phase grid-connected photovoltaic system with anomaly detection framework
Initially, four different faults and one normal behavior model of the grid-connected PV system are simulated to obtain the data required for training the NN classifier. To simplify the classification process, the rate of change of inverter terminal voltage
The identified deviation signals are trained with the NN classifier by adapting the structure shown in Fig. 4. The network structure consists of 14 inputs, one hidden layer, and one output layer. The output layer is targeted at classifying five different classes i.e., Module faults, Converter Faults, Grid Abnormality, and Control unit failure. All the deviation signal data and the target labels correspond to form a feature matrix of size
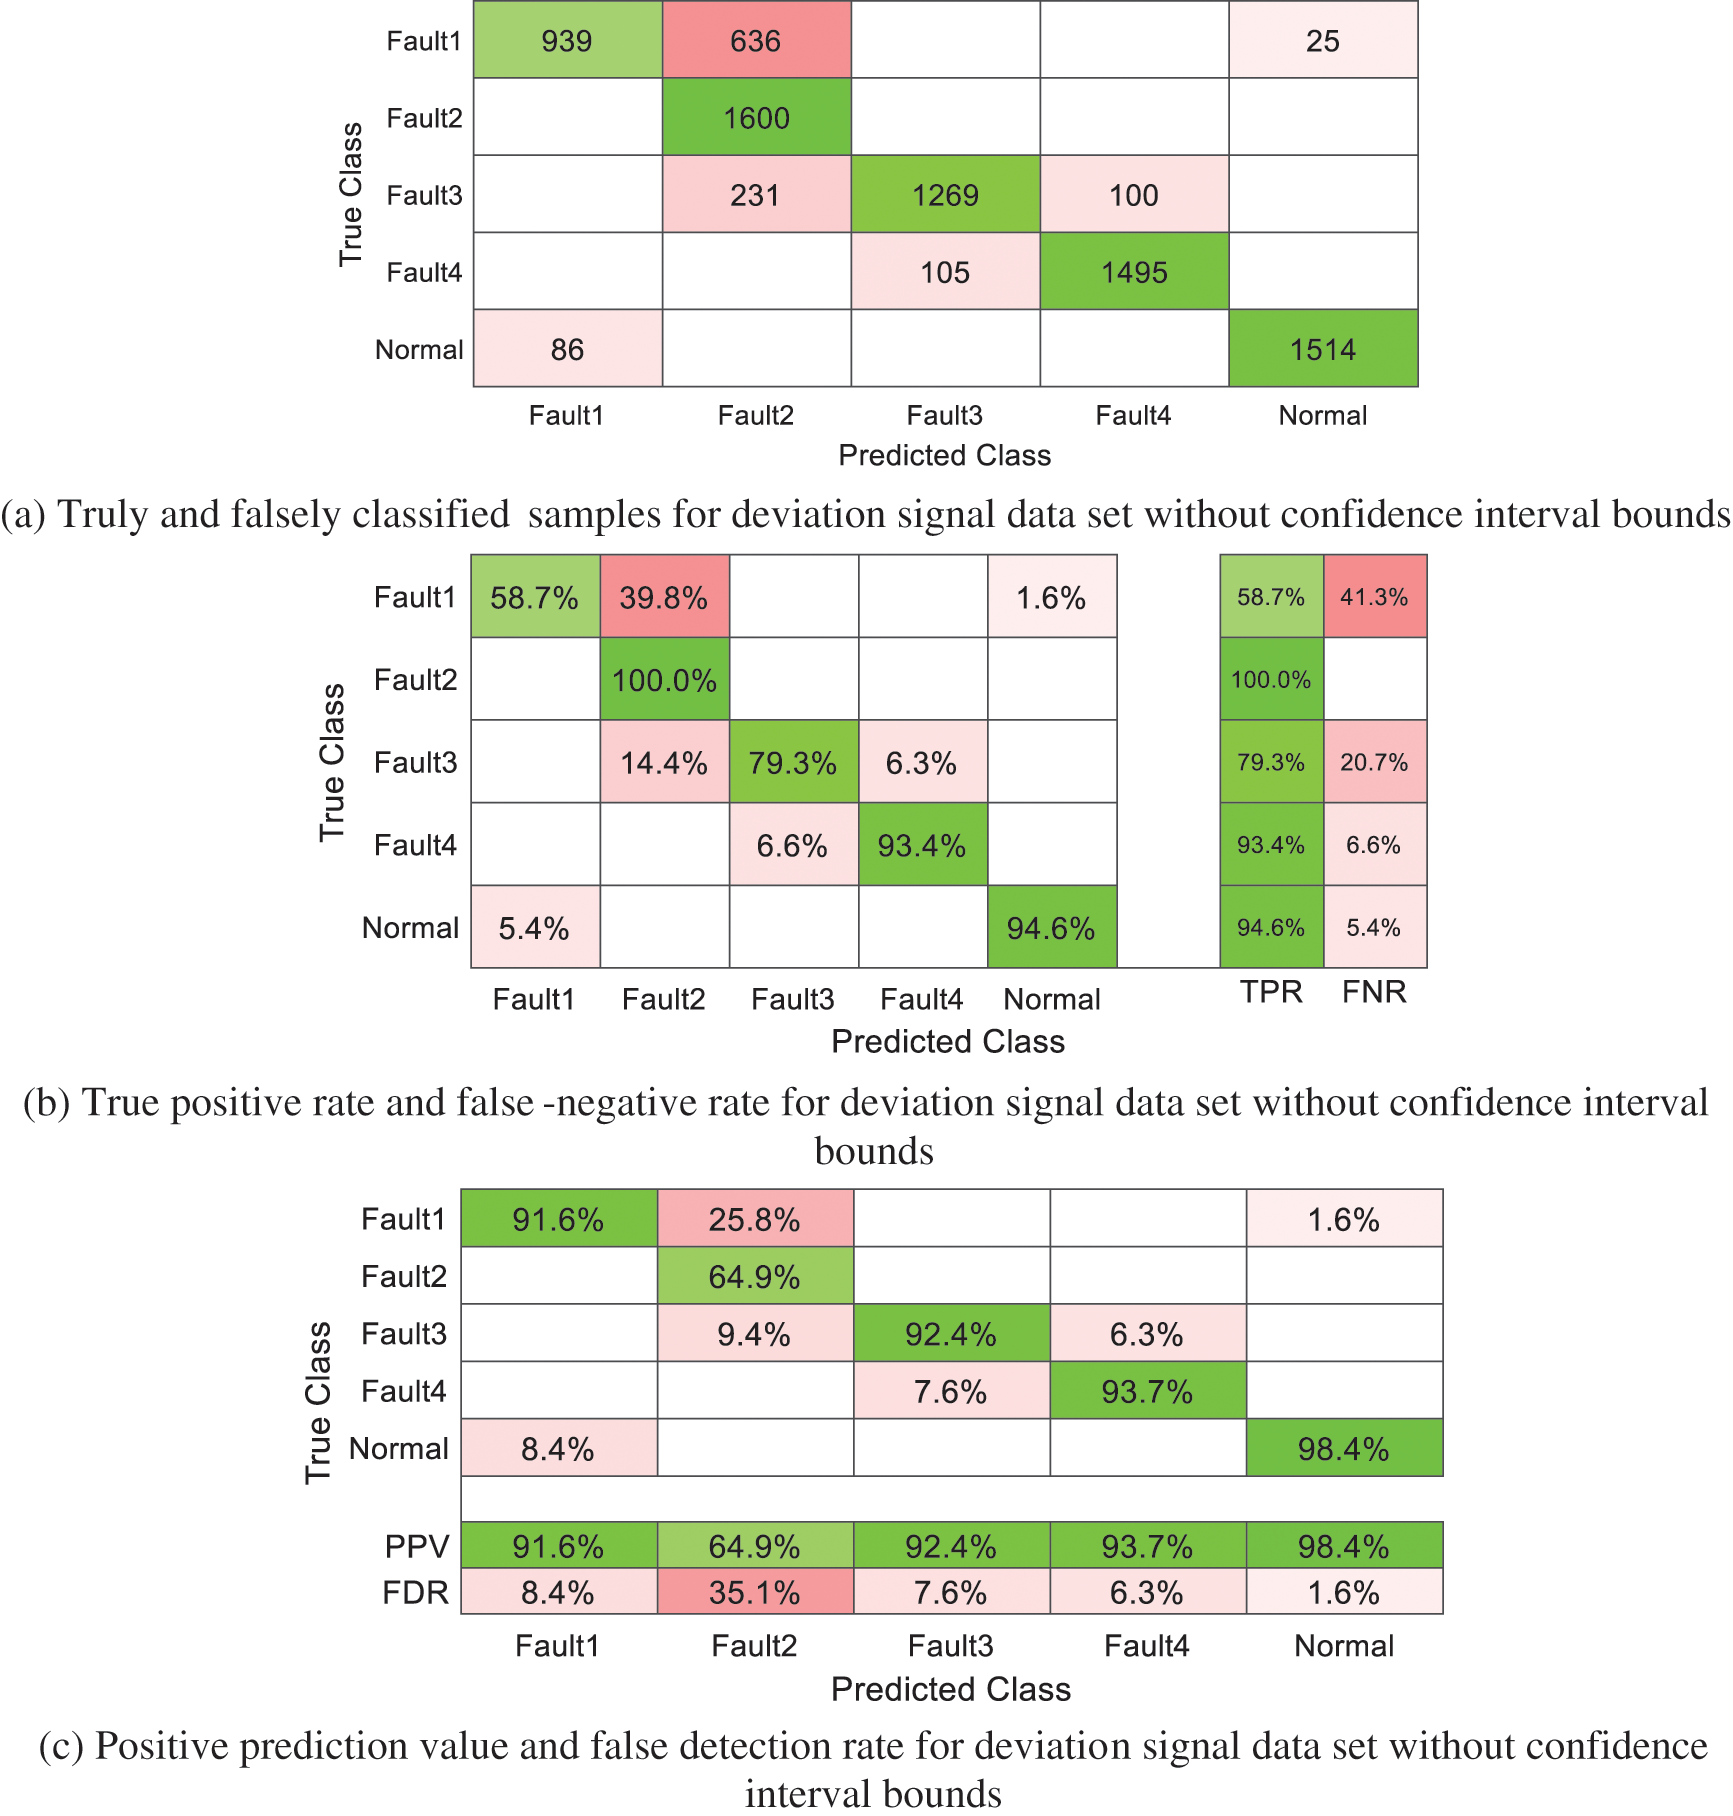
Figure 6: Feed-forward machine learning classifier training for deviation signal data set without confidence interval bounds
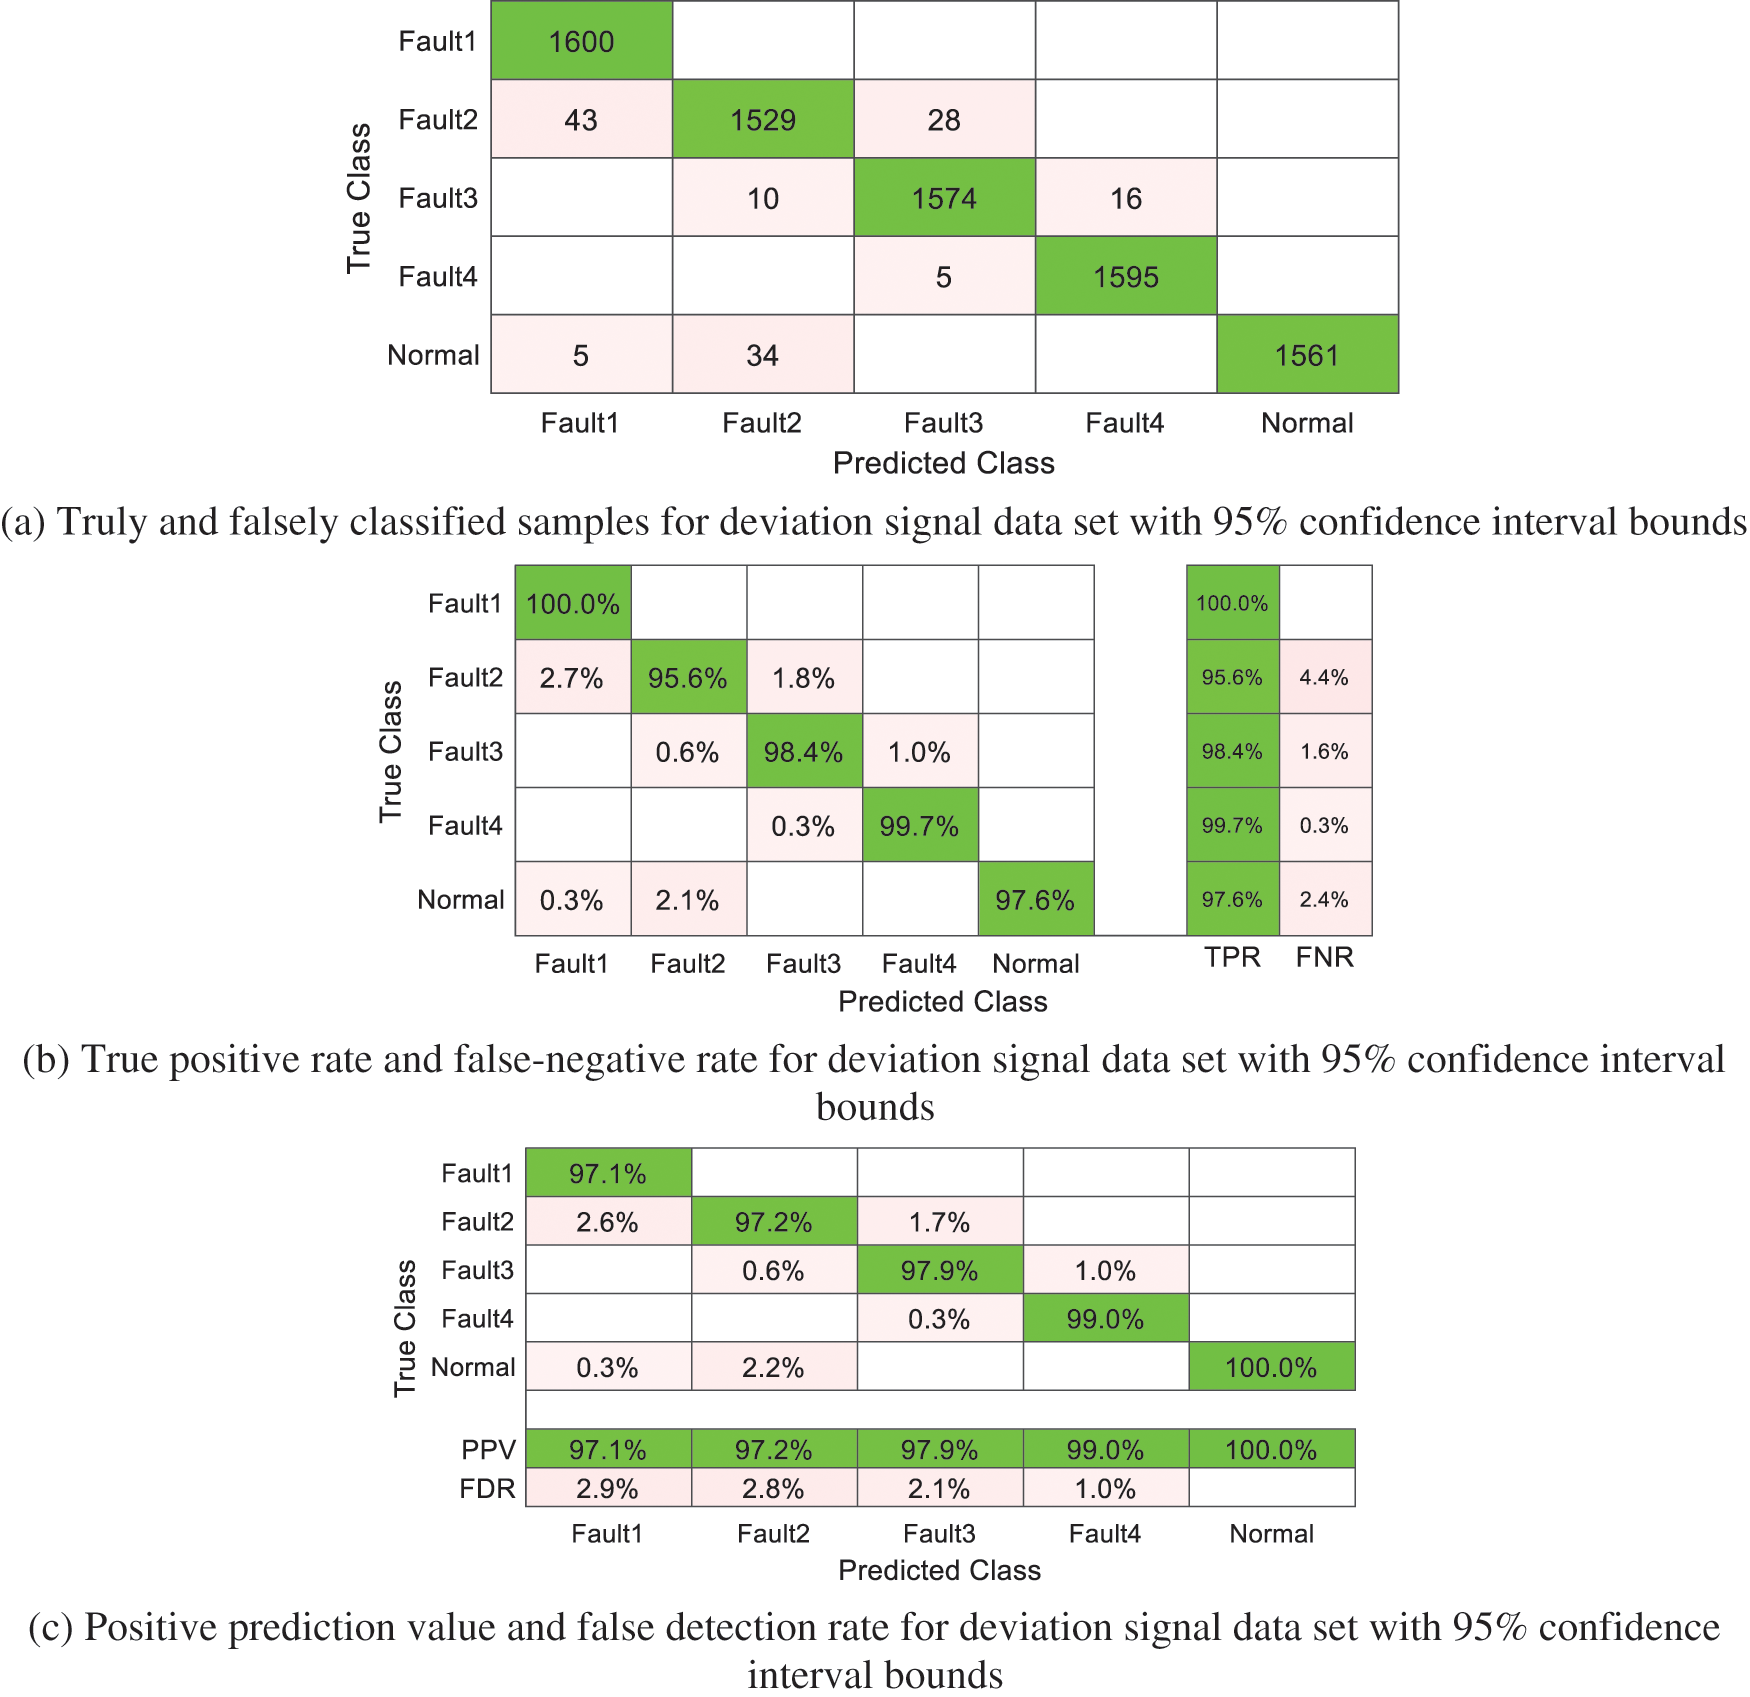
Figure 7: Feed-forward machine learning classifier training for deviation signal data set with 95% confidence interval bounds
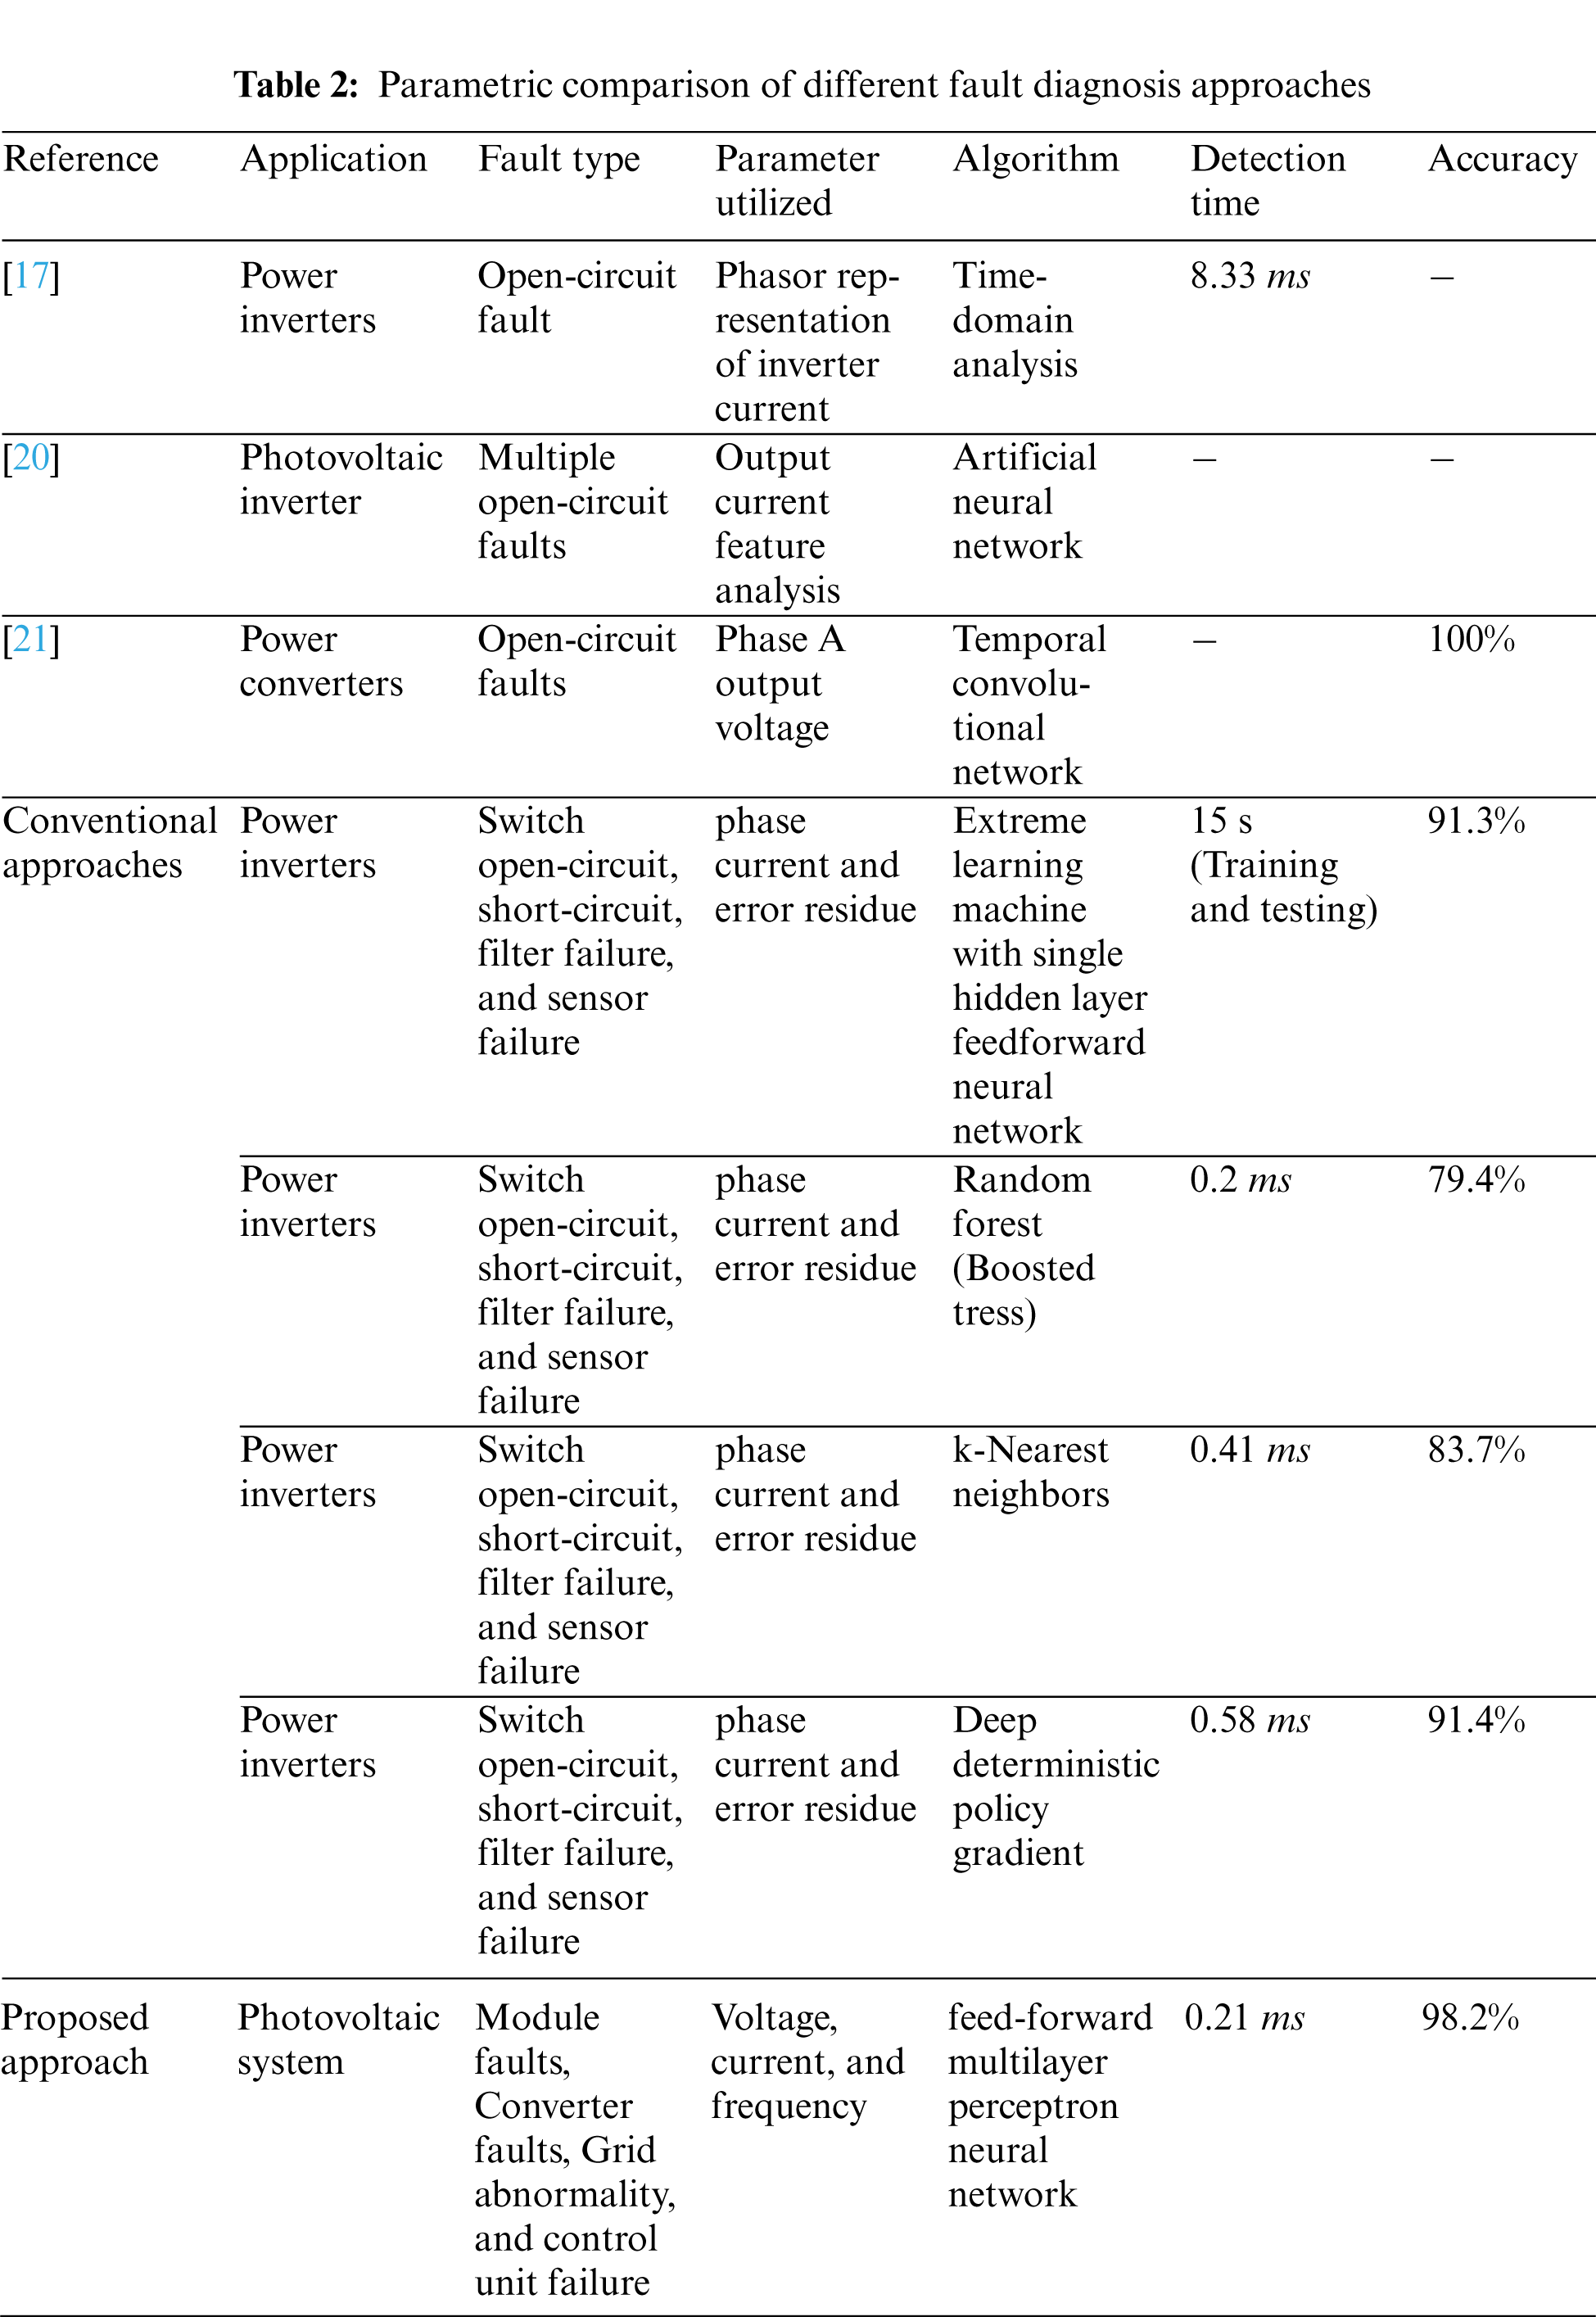
Similarly, the results are shown in Figs. 7a–7c identify the training accuracy of the classifier with a confidence interval trimmed data set. The trained classifier has an accuracy of 98.2% with a total misclassification cost of 141 samples. The truly classified samples in Fig. 7a are 7859 samples, and the falsely classified samples are 141 samples. Further, the true positive rate, false-negative rate, and positive predictive value, false detection rate are estimated as shown in Figs. 7b and 7c for analyzing the classifier training performance. The trained classifier with a confidence interval trimmed data set has a training time of 12.86 s and a prediction speed of 43000 observations per sec. To assess the superiority of the developed fault classification approach, a brief comparison between the different fault detection techniques in the literature is performed as shown in Tab. 2.
Further, the trained classifier is connected in a feedback loop with the power management and inverter control unit to stabilize the system operation and improve the power output of the grid-connected PV system.
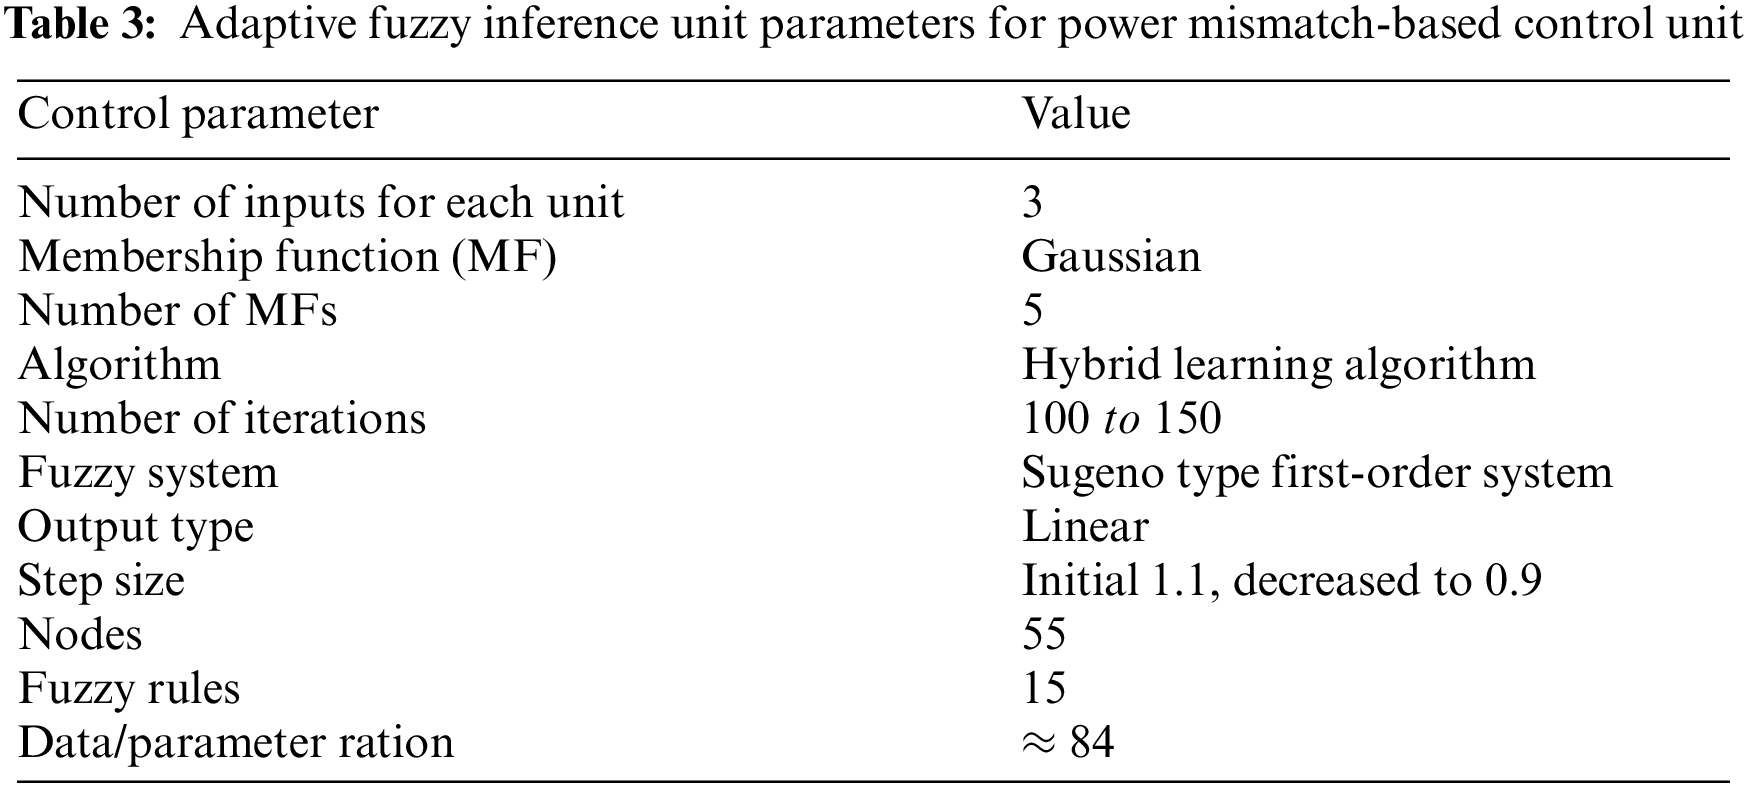
The trained classifier in the previous section can be used to identify the operating state of the grid-connected PV system. The identified operating state can be further provided as an input to the inverter control unit to achieve improved operation of the system. In this research, the classified state information is combined with the power mismatch-based control unit (PMCU) to achieve improved power output for the system. The PMCU is developed with two adaptive neuro-fuzzy inference units (ANFIUs) [37,38] by providing the difference between the measured and rated active and reactive power, and the rate of change of difference, along with the classified state of the system as an input. The internal operation of the ANFIU is similar to the structure and operation of NN but with two additional layers. These additional layers handle the information related to the fuzzy controller i.e., membership grade of linguistic variables, and firing strength of the rules. Further, the output of the ANFIU identifies the reference values for active and reactive current to improve the power output of the system [39,40]. The structure of the PMCU to achieve power output improvement with the monitored system operating condition is shown in Fig. 8, and the parameters for the operation of the ANFIU are discussed in Tab. 3.
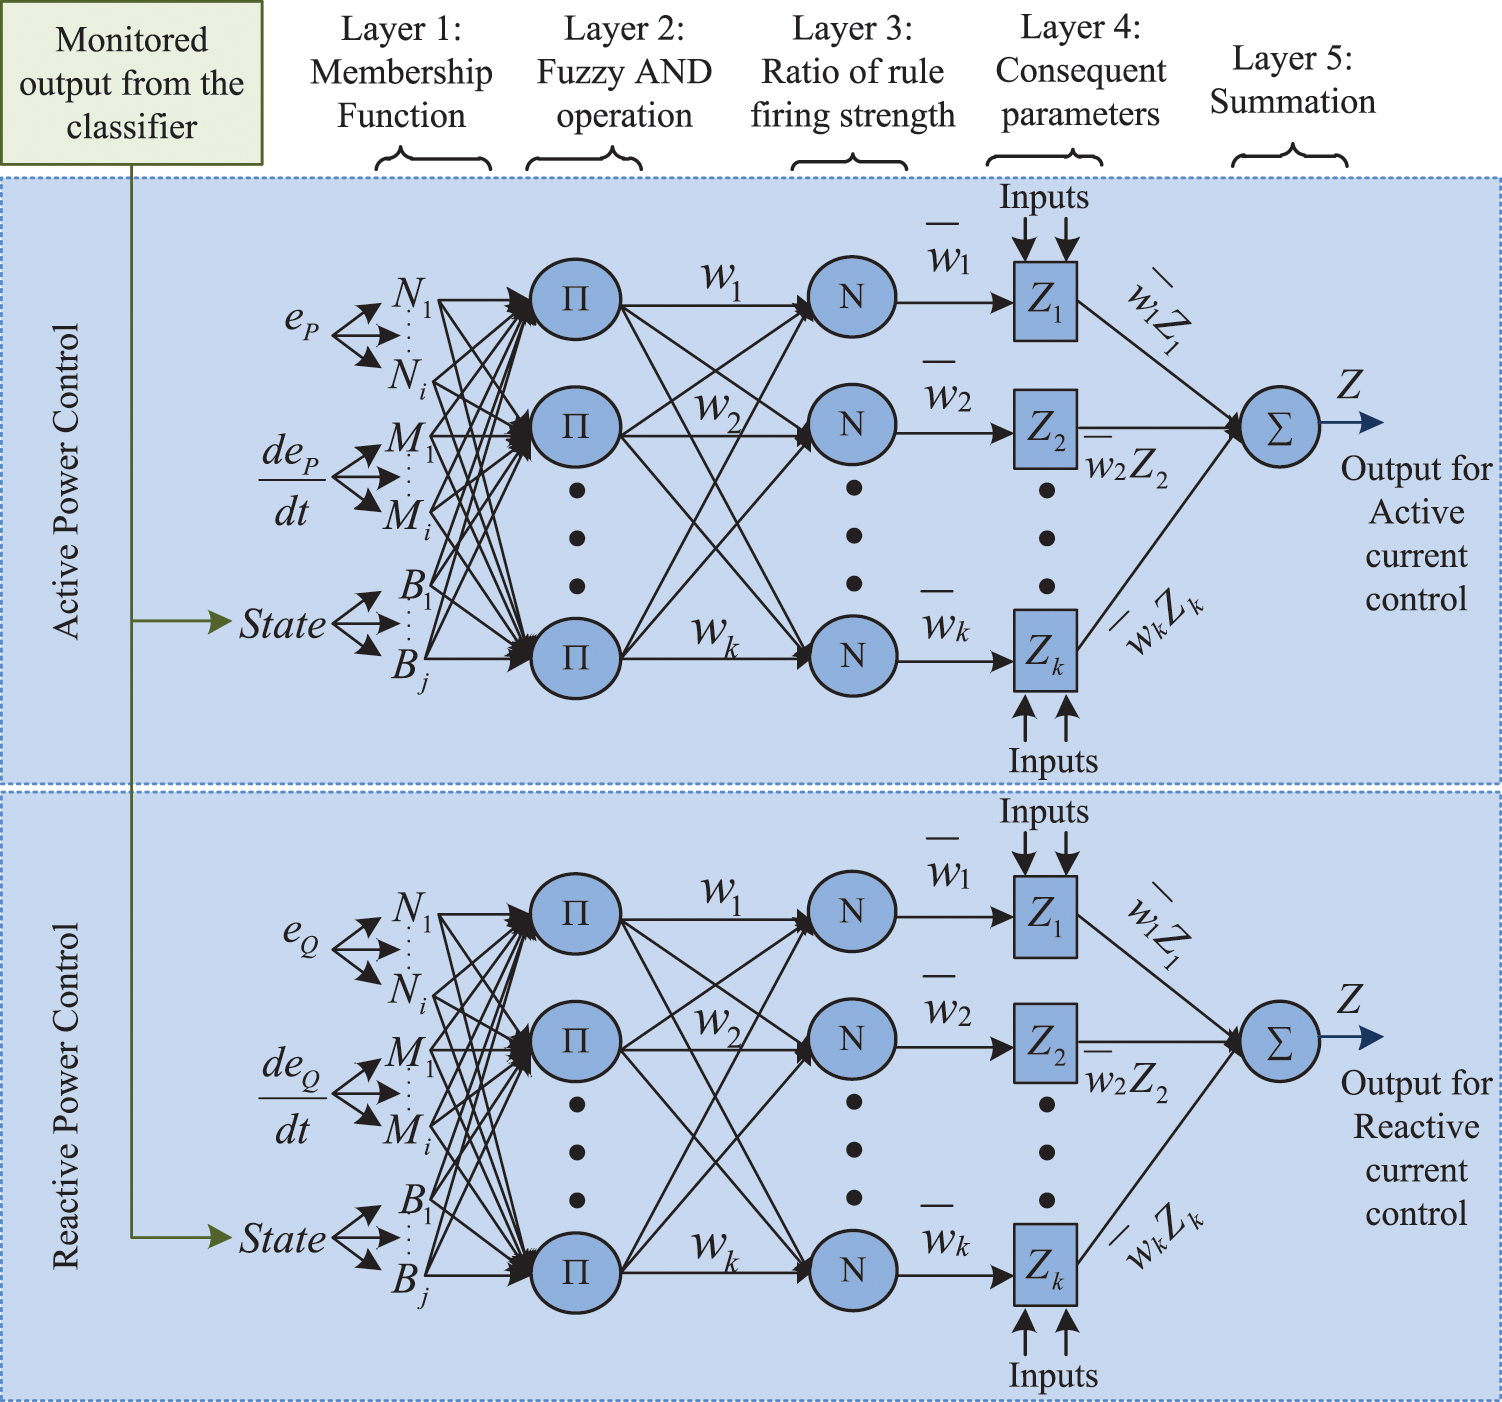
Figure 8: Adaptive fuzzy inference unit network structure for power mismatch-based control unit
Further, the trained classifier and the developed control unit are tested with a single-phase grid-connected laboratory setup as shown in Fig. 9. To realize the operation of the PV modules operating in an array of 10 kW, the Agilent Keysight solar simulator is connected to the network. The interconnection between the PV simulator and the grid is achieved with a Semikron bridge operating as an H-bridge inverter. The proposed condition monitoring framework is implemented with the Altera Cyclone IV field-programmable gate array and the control of the grid-connected inverter along with the PMCU is developed with the Typhoon Hardware-in-Loop. The voltage, current, and active/reactive during normal operation and a constant energy loss fault type are tested on the laboratory setup. To assess the superiority of the proposed monitoring and power output improvement framework, the results obtained are compared with the results from the action of the conventional inverter control unit. The results of the conventional inverter control unit are shown in Fig. 10. From Fig. 10a, the action of the controller for normal operation of the system operating with a
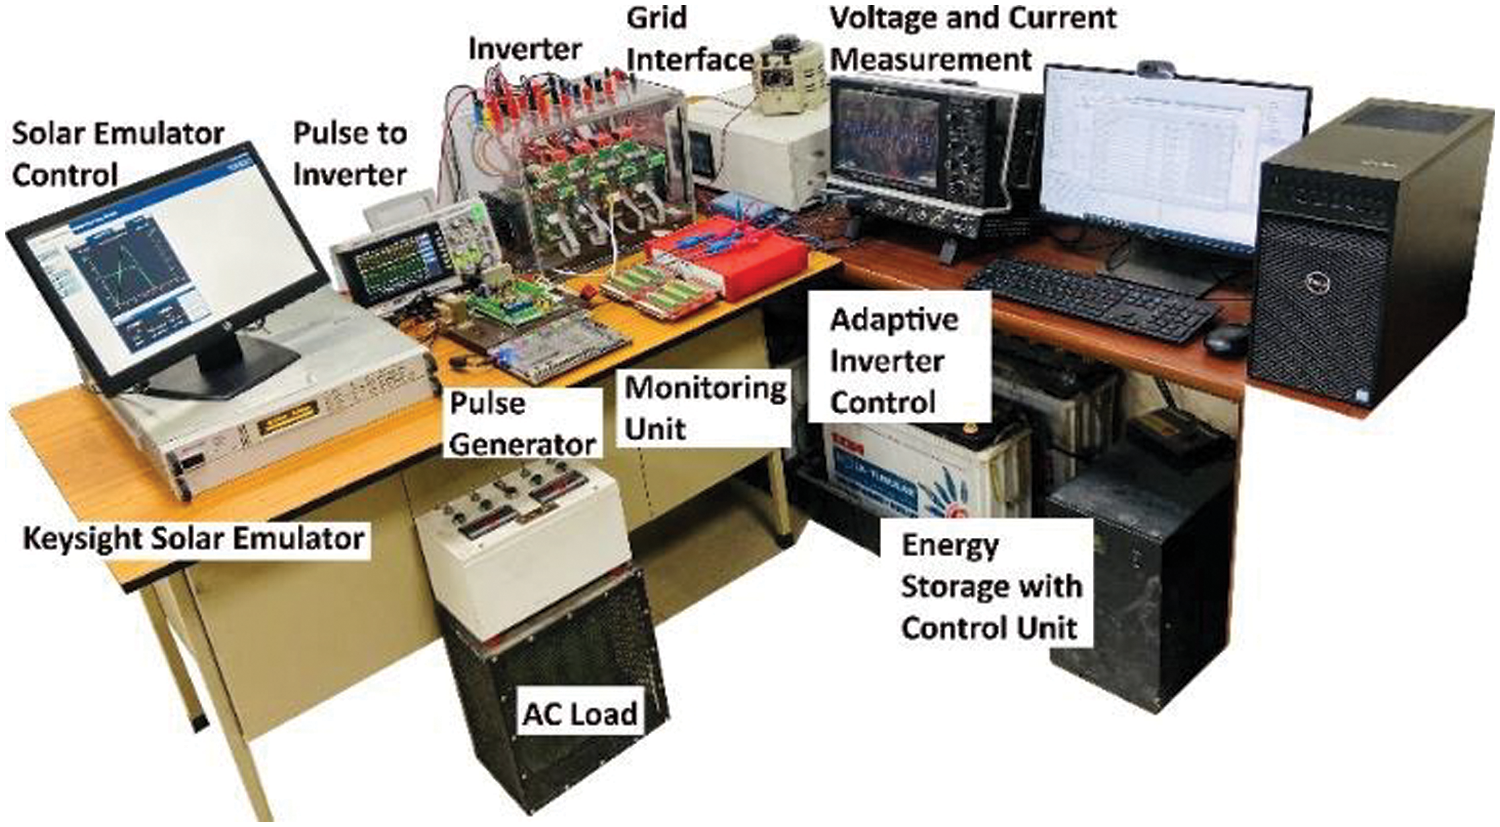
Figure 9: Experimental setup of single-phase grid-connected system with anomaly detection and power mismatch-based control unit
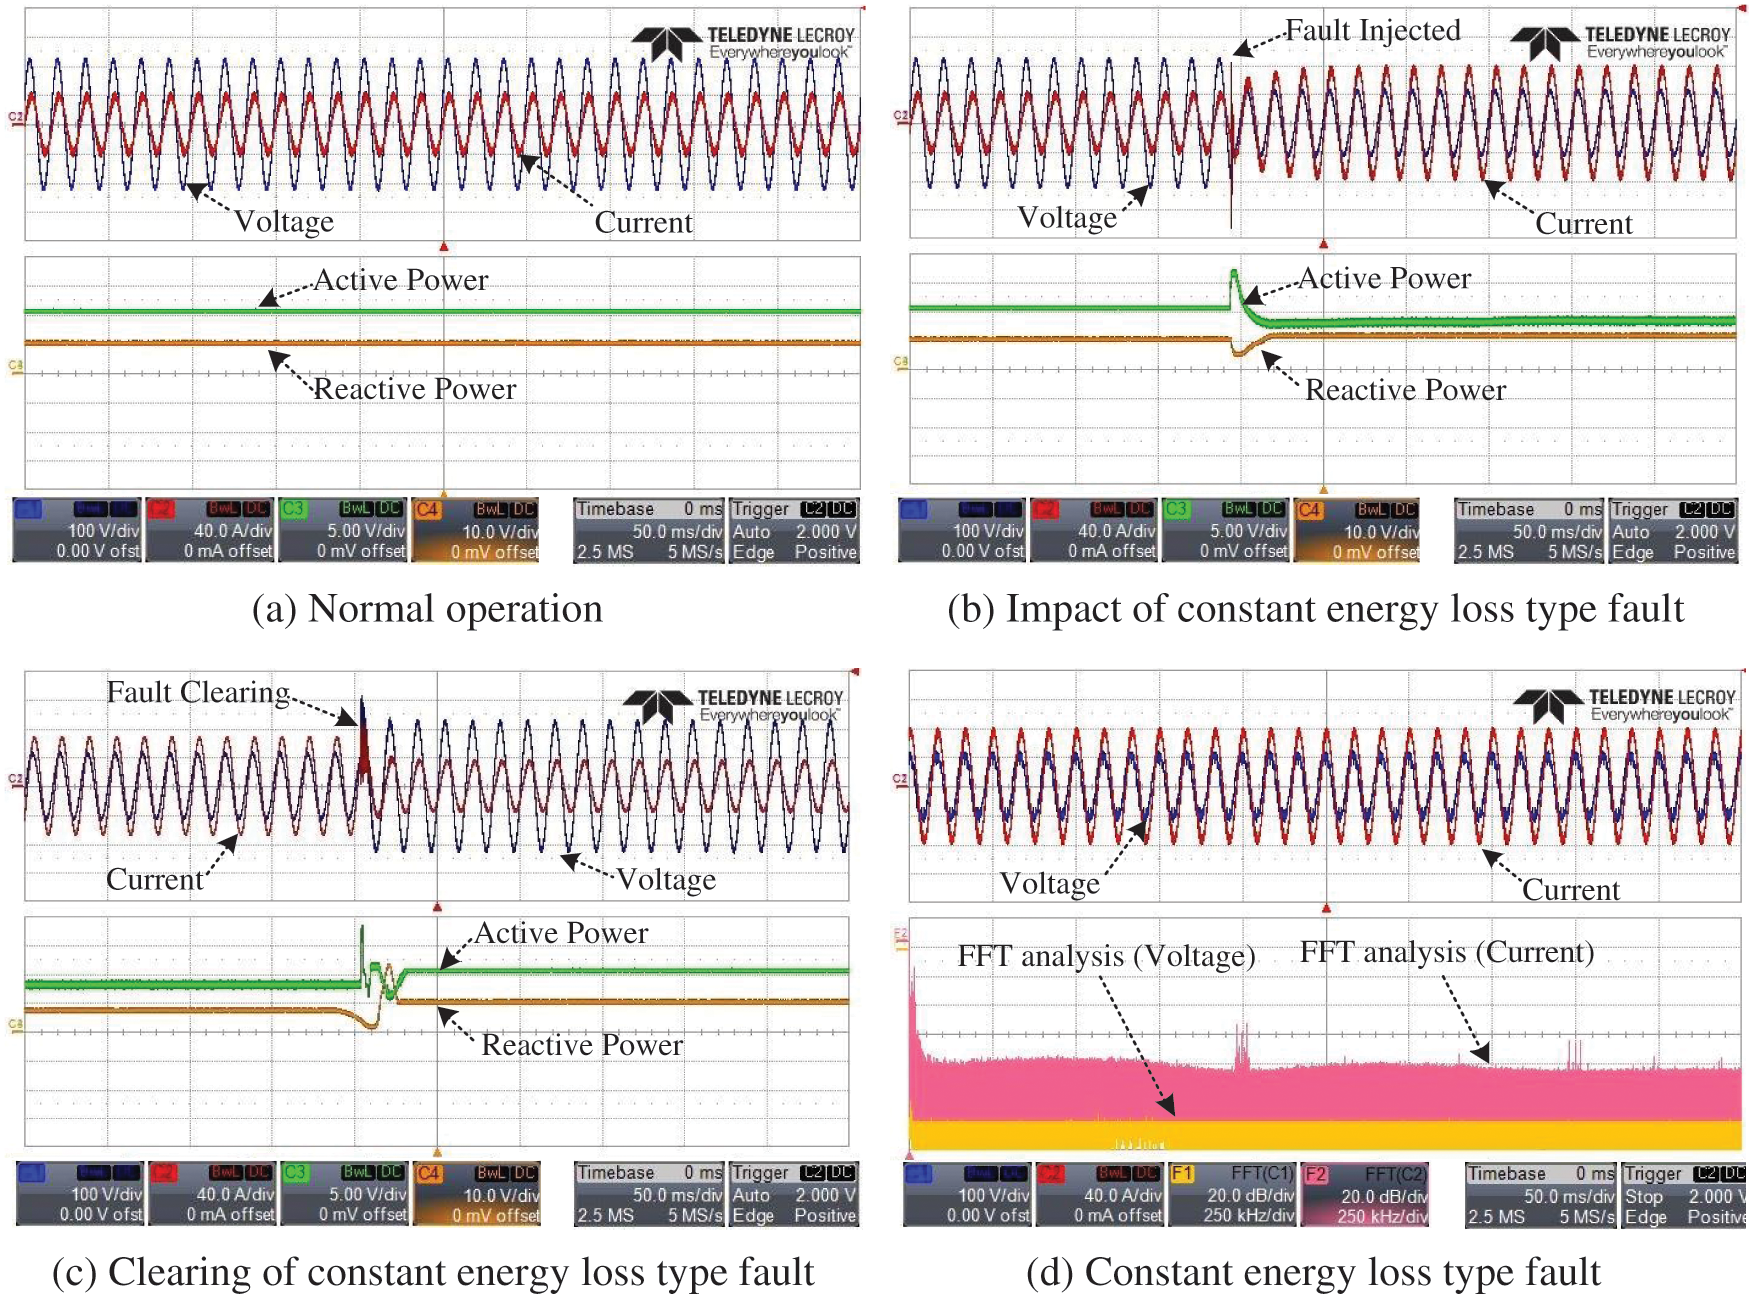
Figure 10: Electrical network variables of single-phase grid-connected photovoltaic system operating with the conventional inverter control approach. (a) Normal operation (b) impact of constant energy loss type fault (c) clearing of constant energy loss type fault and (d) constant energy loss type fault
From the result, it is identified that the action of the conventional control approach tries to improve the voltage amplitude but has no effect on the harmonics present in both the voltage and current. This heavily affects the power out of the system. A similar condition is tested in Fig. 10c where, the constant energy loss fault is cleared, and the controller operates with the system in a grid feeding mode. Here, it is observed that due to a sudden change in the condition of the system, the controller fails to accommodate the system operation with the restoration process and generates multiple transients. This operation has a severe impact on the active and reactive power output of the system and may result in the unstable operation of the system. Further, the Fast Fourier Transform spectrum of the voltage and current during the constant energy loss fault is shown in Fig. 10d. The results identified high harmonics with an average value of around 20 dB and 60 dB for voltage and current respectively throughout the fixed window length of 500 ms.
Further, the action of the developed framework with the PMCU connected in the feedback loop with the conventional inverter control is shown through the results in Fig. 11. The results in Fig. 11a identify the normal operation of the system operating with a
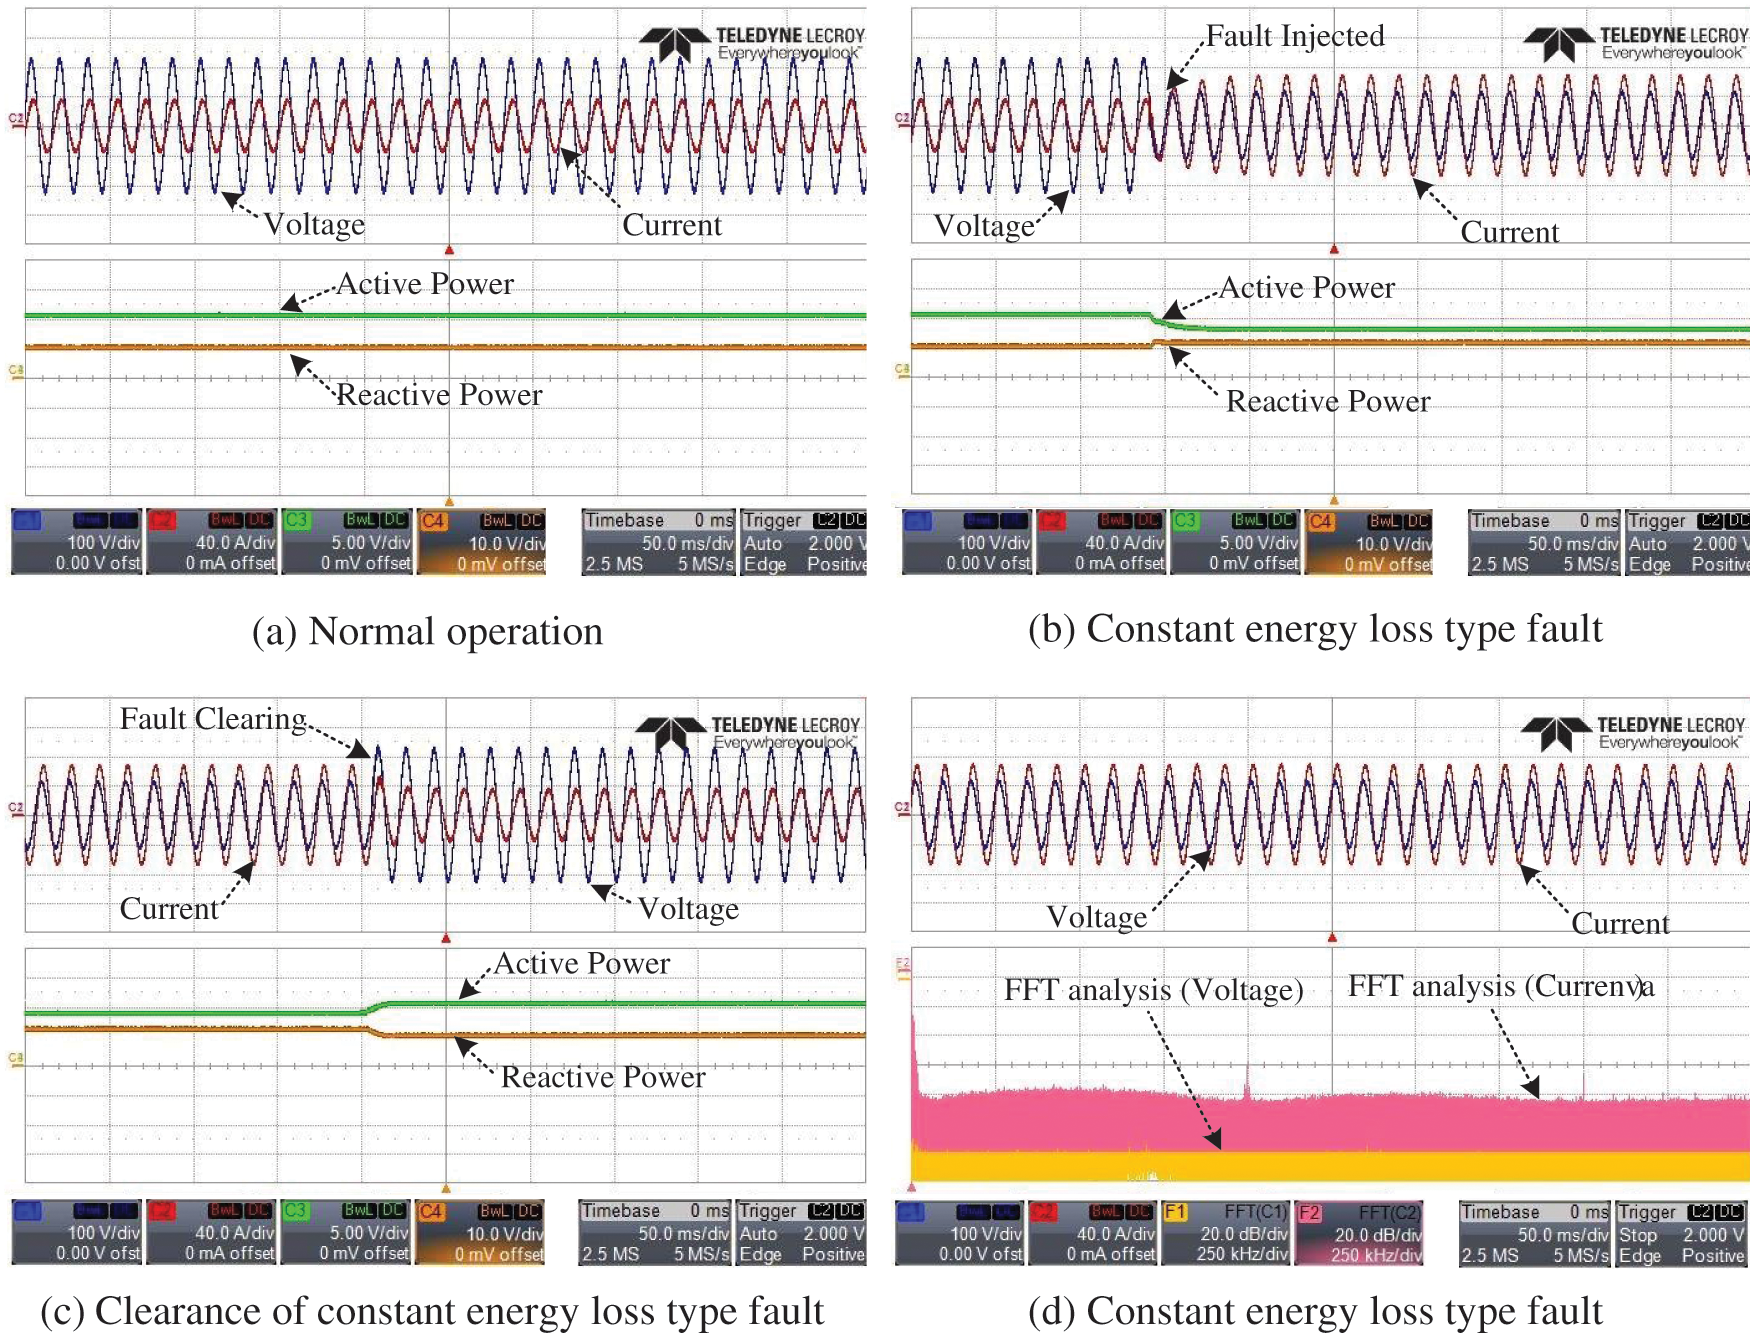
Figure 11: Electrical network variables of single-phase grid-connected photovoltaic system operating with the anomaly detection and power mismatch-based control unit framework. (a) Normal operation (b) constant energy loss type fault (c) clearance of constant energy loss type fault and (d) constant energy loss type fault
This paper establishes an approach for identifying faults at the component level in a grid-connected PV and utilizing the information for improving the operation and power output of the system. Initially, all the possible common faults, abnormalities, and degradation aspects associated with the components in a grid-connected PV system are categorized to differentiate their impact on normal behavior. Further, a
Acknowledgement: The authors extend their appreciation to the Deputyship for Research & Innovation, Ministry of Education in Saudi Arabia for funding this research work through the project number “IFPHI-021–135–2020” and King Abdulaziz University, DSR, Jeddah, Saudi Arabia.
Funding Statement: Funding for this study was received from the Deputyship for Research & Innovation, Ministry of Education in Saudi Arabia through the project number “IFPHI-021–135–2020” and King Abdulaziz University, DSR, Jeddah, Saudi Arabia.
Conflicts of Interest: The authors declare that they have no conflicts of interest to report regarding the present study.
References
1. E. M. Barhoumi, P. C. Okonkwo, M. Zghaibeh, I. Ben Belgacem, T. Abdullah Alkanhal et al., “Renewable energy resources and workforce case study Saudi Arabia: Review and recommendations,” J. Therm. Anal. Calorim., vol. 141, no. 1, pp. 221–230, 2020. [Google Scholar]
2. L. Collins, “We will be pioneering’: Saudi Arabia reveals 50% renewables goal by 2030, but is that realistic? | Recharge,” Recharge. https://www.rechargenews.com/energy-transition/we-will-be-pioneering-saudi-arabia-reveals-50-renewables-goal-by-2030-but-is-that-realistic-/2-1-954094 (accessed Mar. 06, 2021). [Google Scholar]
3. IRENA (2020“Power sector planning in arab countries: Incorporating variable renewables,” Abu Dhabi, 2019. [Google Scholar]
4. T. Yang, “ICT technologies standards and protocols for active distribution network,” in Smart Power Distribution Systems, vol. 1, Academic Press, Elsevier, pp. 205–230, 2019. [Google Scholar]
5. C. Ventura and G. M. Tina, “Development of models for on-line diagnostic and energy assessment analysis of PV power plants: The study case of 1 MW sicilian PV plant,” Energy Procedia, vol. 83, pp. 248–257, 2015. [Google Scholar]
6. M. Muselli, G. Notton, J. L. Canaletti and A. Louche, “Utilization of meteosat satellite-derived radiation data for integration of autonomous photovoltaic solar energy systems in remote areas,” Energy Conversion and Management, vol. 39, no. 1–2, pp. 1–19, 1998. [Google Scholar]
7. F. Tahri, A. Tahri and T. Oozeki, “Performance evaluation of grid-connected photovoltaic systems based on two photovoltaic module technologies under tropical climate conditions,” Energy Conversion and Management, vol. 165, pp. 244–252, 2018. [Google Scholar]
8. M. Shahzad, K. V. S. Bharath., M. A. Khan and A. Haque, “Review on reliability of power electronic components in photovoltaic inverters,” in 2019 Int. Conf. on Power Electronics, Control and Automation (ICPECA), New Delhi, India, pp. 1–6, 2019. [Google Scholar]
9. H. ur Rehman, T. Korvola, R. Abdurafikov, T. Laakko, A. Hasan et al., “Data analysis of a monitored building using machine learning and optimization of integrated photovoltaic panel, battery and electric vehicles in a central european climatic condition,” Energy Conversion and Management, vol. 221, pp. 113206, 2020. [Google Scholar]
10. V. S. B. Kurukuru, A. Haque, A. K. Tripathi and M. A. Khan, “Condition monitoring of IGBT modules using online TSEPs and data-driven approach,” International Transactions on Electrical Energy Systems, vol. 31, no. 8, pp. 1–23, 2021. [Google Scholar]
11. R. Fazai, K. Abodayeh, M. Mansouri, M. Trabelsi, H. Nounou et al., “Machine learning-based statistical testing hypothesis for fault detection in photovoltaic systems,” Solar Energy, vol. 190, pp. 405–413, 2019. [Google Scholar]
12. B. Taghezouit, F. Harrou, Y. Sun, A. H. Arab and C. Larbes, “Multivariate statistical monitoring of photovoltaic plant operation,” Energy Conversion and Management, vol. 205, pp. 112317, 2020. [Google Scholar]
13. F. Harrou, B. Taghezouit and Y. Sun, “Robust and flexible strategy for fault detection in grid-connected photovoltaic systems,” Energy Conversion and Management, vol. 180, pp. 1153–1166, 2019. [Google Scholar]
14. A. Mellit, “Development of an expert configuration of standalone power PV system based on adaptive neuro-fuzzy inference system (ANFIS),” in MELECON 2006–2006 IEEE Mediterranean Electrotechnical Conf., Malaga, Spain, pp. 893–896, 2006. [Google Scholar]
15. B. Taghezouit, F. Harrou, Y. Sun, A. H. Arab and C. Larbes, “A simple and effective detection strategy using double exponential scheme for photovoltaic systems monitoring,” Solar Energy, vol. 214, pp. 337–354, 2021. [Google Scholar]
16. A. Bakdi, W. Bounoua, A. Guichi and S. Mekhilef, “Real-time fault detection in PV systems under MPPT using PMU and high-frequency multi-sensor data through online PCA-KDE-based multivariate KL divergence,” International Journal of Electrical Power & Energy Systems, vol. 125, pp. 106457, 2021. [Google Scholar]
17. J. A. Reyes-Malanche, F. J. Villalobos-Pina, E. Cabal-Yepez, R. Alvarez-Salas and C. Rodriguez-Donate, “Open-circuit fault diagnosis in power nverters throughcurrents analysis in time domain,” IEEE Transactions on Instrumentation and Measurement, vol. 70, pp. 1–12, 2021. [Google Scholar]
18. S. Xu, S. Tao, W. Zheng, Y. Chai, M. Ma and L. Ding, “Multiple open-circuit fault diagnosis for back-to-back converter of pmsg wind generation system based on instantaneous amplitude estimation,” IEEE Transactions on Instrumentation and Measurement, vol. 70, pp. 1–13, 2021. [Google Scholar]
19. T. Kamel, Y. Biletskiy and L. Chang, “Real-time diagnosis for open-circuited and unbalance faults in electronic converters connected to residential wind systems,” IEEE Transactions on Industrial Electronics, vol. 63, no. 3, pp. 1781–1792, 2016. [Google Scholar]
20. Z. Huang, Z. Wang and H. Zhang, “Multiple open-circuit fault diagnosis based on multistate data processing and subsection fluctuation analysis for photovoltaic inverter,” IEEE Transactions on Instrumentation and Measurement, vol. 67, no. 3, pp. 516–526, 2018. [Google Scholar]
21. G. Yating, W. Wu, L. Qiongbin, C. Fenghuang and C. Qinqin, “Fault diagnosis for power converters based on optimized temporal convolutional network,” IEEE Transactions on Instrumentation and Measurement, vol. 70, pp. 1–10, 2021. [Google Scholar]
22. M. Halwachs, L. Neumaier, N. Vollert, L. Maul, S. Dimitriadis et al., “Statistical evaluation of PV system performance and failure data among different climate zones,” Renewable Energy, vol. 139, pp. 1040–1060, 2019. [Google Scholar]
23. L. B. Bosman, W. D. Leon-Salas, W. Hutzel and E. A. Soto, “PV system predictive maintenance: Challenges, current approaches, and opportunities,” Energies, vol. 13, no. 6, pp. 1398, 2020. [Google Scholar]
24. Z. Usman, J. Tah, H. Abanda and C. Nche, “A critical appraisal of pv-systems’ performance,” Buildings, vol. 10, no. 11, pp. 192, 2020. [Google Scholar]
25. K. V. S. Bharath, A. Haque and M. A. Khan, “Condition monitoring of photovoltaic systems using machine leaming techniques,” in 2018 2nd IEEE Int. Conf. on Power Electronics, Intelligent Control and Energy Systems (ICPEICES), Delhi, India, pp. 870–875, 2018. [Google Scholar]
26. K. Dadhich, V. S. B. Kurukuru, M. A. Khan and A. Haque, “Fault identification algorithm for grid connected photovoltaic systems using machine learning techniques,” in 2019 Int. Conf. on Power Electronics, Control and Automation (ICPECA), New Delhi, India, pp. 1–6, 2019. [Google Scholar]
27. V. S. B. Kurukuru, F. Blaabjerg, M. A. Khan and A. Haque, “A novel fault classification approach for photovoltaic systems,” Energies, vol. 13, no. 2, pp. 308, 2020. [Google Scholar]
28. S. Silvestre, A. Chouder and E. Karatepe, “Automatic fault detection in grid connected PV systems,” Solar Energy, vol. 94, pp. 119–127, 2013. [Google Scholar]
29. S. Ali, M. S. Khan, V. S. B. K., M. A. Khan and A. Haque, “Failure rate basics for a case study on grid connected photovoltaic plant,” in 2019 Int. Conf. on Power Electronics, Control and Automation (ICPECA), New Delhi, India, pp. 1–6, 2019. [Google Scholar]
30. L. M. Moore and H. N. Post, “Five years of operating experience at a large, utility-scale photovoltaic generating plant,” Progress in Photovoltaics: Research and Applications, vol. 16, no. 3, pp. 249–259, 2008. [Google Scholar]
31. W. Chine, A. Mellit, A. M. Pavan and S. A. Kalogirou, “Fault detection method for grid-connected photovoltaic plants,” Renewable Energy, vol. 66, pp. 99–110, 2014. [Google Scholar]
32. X. Zhang, W. Zhang, W. Sun, X. Sun and S. Kumar Jha, “A robust 3-D medical watermarking based on wavelet transform for data protection,” Computer Systems Science and Engineering, vol. 41, no. 3, pp. 1043–1056, 2022. [Google Scholar]
33. X. Zhang, X. Sun, X. Sun, W. Sun and S. Kumar Jha, “Robust reversible audio watermarking scheme for telemedicine and privacy protection,” Computers, Materials and Continua, vol. 71, no. 2, pp. 3035–3050, 2022. [Google Scholar]
34. A. C. Rencher and W. F. Christensen, in Methods of Multivariate Analysis, 3rd ed., vol. 33, no. 3, Hoboken, New Jersey, United States, Wiley, 2012. [Google Scholar]
35. P. de and B. Harrington, “Sigmoid transfer functions in backpropagation neural networks,” Analytical Chemistry, vol. 65, no. 15, pp. 2167–2168, 1993. [Google Scholar]
36. R. J. de Andrade Vieira and M. A. Sanz-Bobi, “Failure risk indicators for a maintenance model based on observable life of industrial components with an application to wind turbines,” IEEE Transactions on Reliability, vol. 62, no. 3, pp. 569–582, 2013. [Google Scholar]
37. H. M. Fekry, A. A. Eldesouky, A. M. Kassem and A. Y. Abdelaziz, “Power management strategy based on adaptive neuro fuzzy inference system for AC microgrid,” IEEE Access, vol. 8, pp. 192087–192100, 2020. [Google Scholar]
38. M. J. Usmani and A. Haque, “Power management of solar pv systems for peer load,” in 2020 IEEE Int. Conf. on Power Electronics, Smart Grid and Renewable Energy (PESGRE2020), Cochin, India, pp. 1–6, 2020. [Google Scholar]
39. M. A. Khan, A. Haque and V. S. Bharath, “Dynamic voltage support for low voltage ride through operation in single-phase grid-connected photovoltaic systems,” IEEE Transactions Power Electron., vol. 36, no. 10, pp. 12102–12111, 2021. [Google Scholar]
40. M. A. Khan, A. Haque, V. S. B. Kurukuru and S. Mekhilef, “Advanced control strategy with voltage sag classification for single-phase grid-connected photovoltaic system,” IEEE Journal of Emerging and Selected Topics in Power Electronics, vol. 3, no. 2, pp. 258–269, 2022. [Google Scholar]
Cite This Article
 Copyright © 2023 The Author(s). Published by Tech Science Press.
This work is licensed under a Creative Commons Attribution 4.0 International License , which permits unrestricted use, distribution, and reproduction in any medium, provided the original work is properly cited.
 Downloads
 Citation Tools