
 Submit a Paper
 Propose a Special lssue
 Open Access
ARTICLE

An Optimized Deep Learning Approach for Improving Airline Services
Faculty of Commerce and Business Administration, Business Information Systems Department, Helwan University, Cairo, Egypt
* Corresponding Author: Shimaa Ouf. Email:
Computers, Materials & Continua 2023, 75(1), 1213-1233. https://doi.org/10.32604/cmc.2023.034399
Received 16 July 2022; Accepted 04 December 2022; Issue published 06 February 2023
 View Full Text
 Download PDF
Abstract
The aviation industry is one of the most competitive markets. The most common approach for airline service providers is to improve passenger satisfaction. Passenger satisfaction in the aviation industry occurs when passengers’ expectations are met during flights. Airline service quality is critical in attracting new passengers and retaining existing ones. It is crucial to identify passengers’ pain points and enhance their satisfaction with the services offered. The airlines used a variety of techniques to improve service quality. They used data analysis approaches to analyze the passenger point data. These solutions have focused simply on surveys; consequently, deep-learning approaches have received insufficient attention. In this study, deep neural networks with the adaptive moment estimation Adam optimization algorithm were applied to enhance classification performance. In previous studies, the quality of the dataset has been ignored. The proposed approach was applied to the airline passenger satisfaction dataset from the Kaggle repository. It was validated by applying artificial neural networks (ANNs), random forests, and support vector machine techniques to the same dataset. It was compared with other research papers that used the same dataset and had a similar problem. The experimental results showed that the proposed approach outperformed previous studies. It has achieved an accuracy of 99.3%.Keywords
Passenger satisfaction is influenced by airport facilities and services [1]. As demand increases, demand for high-quality air services also increases [2]. In the current competitive environment, airlines must satisfy passengers’ needs by introducing distinguished services to outperform their competitors and gain a competitive advantage [3]. Consequently, scientific papers have investigated passenger evaluations of airline services to improve service quality and increase passenger satisfaction. Enhancing passenger satisfaction has significant importance to airline service providers [4]. It is not easy to quantify and understand the factors that affect passenger satisfaction. High-quality service is considered a competitive advantage for airlines. It is a key enabler in retaining passengers and attracting new ones [5].
This study aims to help airlines gain a competitive advantage by providing a high-quality service for their passengers. It focuses on classifying the impact of airline services on passenger satisfaction. Machine learning (ML) has been used to create intelligent systems for airlines with artificial intelligence capabilities. These systems can understand problem-specific training data. It simplifies the process of building analytical models and solves the associated tasks [6]. It is a subfield of artificial intelligence that includes all algorithms that allow machines to learn independently through mathematical models. It is used to extract knowledge from enormous datasets. The most popular ML techniques include fast learning networks, K-nearest neighbors (KNN), decision trees, support vector machines (SVM), K-mean clustering, random forest (RF), and ensemble techniques [7]. These techniques are used to analyze large datasets and develop accurate prediction models [8]. Support vector machines (SVM) have been considered important machine learning algorithms. They have been applied to classification to provide reliable results and have achieved high performance when applied to a large dataset with considerable time consumption [9]. A random forest is a popular machine learning classifier that includes a set of decision trees on different subsets of the provided dataset. It is applied to process large amounts of dimensional data while also being highly resistant to overfitting. It is used to solve complex problems and to improve the dataset’s prediction accuracy. It takes less time to train than other algorithms [10].
Deep learning is a subfield of machine learning that uses learning to build a model that mimics the human brain at its level. It addresses complicated issues in the real world using neural networks, a multilayered structure of algorithms [11]. The neural network works as a biological network of neurons in the human brain. It is used to extract patterns and classify different data types. It is a network of nodes (neurons) organized into connected layers [12]. Deep learning means the depth of layers in a neural network. Artificial neural networks (ANNs) are neural networks that use a set of techniques to imitate the human brain. A deep neural network (DNN) is an artificial neural network that has many depth layers between the input and output layers [13]. It considers a robust field of machine learning techniques executed by accumulating neural network layers with the depth and width of smaller structures. It has shown discriminative and representational abilities across many applications. It is feed-forward and only flows from input to output along one path [14]. Backpropagation is another method to train the model. It is used to move in a reverse direction from output to input. Backpropagation discovers and computes the error associated with each neuron [15]. To extract input data features successfully, DNNs calculate their internal variables in the forward pass and afterward, repeatedly improving them during backpropagation [16]. As a result, DNNs have learning capabilities and outperform methods such as self-driving cars, quantitative trading, genomics, computer vision, machine translation, natural language processing, and speech recognition [17]. DNNs have great benefits like feature extraction at multiple levels of abstraction and, therefore, learning more complicated patterns compared to machine learning techniques such as k-nearest neighbors, support vector machines, and decision trees [18]. It combines the feature extraction process and classification into learning. Fig. 1 depicts the structure of the DNN. It uses mathematical manipulation to transform the input into the output, even if it has a linear or nonlinear relationship. The network passes through the layers and calculates each output probability. Neurons have been created to respond to numerical inputs and generate a nonlinear output [19].

Figure 1: Multilayer neurons construct a fully connected network
Xi represents the inputs that are weighted individually (Wi), which is used to model the neurons’ way of modulating their response to different stimuli, and then summed to introduce ∑i wifi (total stimulus) as shown in Eq. (1) [20].
It represents the output of the neurons. They calculate it using a nonlinear activation function f, based on the weighted sum with an additional bias term (b). The input data and neurons are the sources of the inputs, whereas the biases and weights are attributes utilized to tune the neurons [21]. In a fully connected network, each node (neuron) in a layer receives input from every node (neuron) in the previous layer. Each node includes a set of biases and associated weights. As a result, the number of biases and weights in a layered network can be large, occasionally reaching hundreds of millions Finally, with the correct biases and weights, the network is trained to complete the task [22]. Multilayer neurons construct a fully connected network (input, hidden, and output layers). Each neuron’s output (Yj) is used as input for neurons (Yk) in the next layer. Each neuron includes an activation function (f) and an associated set of weights (w) and biases (b) shown in Eqs. (2)–(5) [23]. As a result, the number of weights and biases in a multilayer network might easily reach hundreds of millions. The rectified linear unit (ReLU) was used to select these parameters [24].
Deep learning transforms the way airlines interact with passengers, make strategic decisions, and build workflows. For example, it would seem uncommon today to do solely offline surveys. Real-time access to data enables airlines to take informed steps to improve service quality [25]. Scientific research on passenger satisfaction and service quality in the aviation sector has increased. High-quality service has become crucial to the survival and competitiveness of airlines. Previous studies have used structured survey methodologies [26] to collect passenger feedback. The construction of structured instruments requires significant investments in time and money. Additional studies have used data mining and machine learning algorithms to gather and analyze qualitative passenger posts and reviews that count and weigh the significance of words and symbols. The data-mining approach enables access to datasets and creates in-depth knowledge about passenger evaluations using the inductive method [27]. However, understanding the meaning of their text may be erroneous and biased. As a result, this study applies an optimized deep learning approach to improve passengers’ satisfaction. Deep learning approaches have recently been used to change the traditional methods of monitoring airline services. Optimization techniques are used to reduce losses [28].
There are different optimization techniques like Adaptive Moment Estimation (Adam), gradient descent algorithm, AdaDelta, AdaGrad, particle swarm optimization algorithm, and RMSProp. These algorithms are applied to support deep learning techniques and achieve better and faster results while increasing accuracy [29]. In this study, the Adam optimizer was used with deep learning models to improve passenger satisfaction. The Adam optimizer has many advantages: it combines the benefits of AdaGrad and RMSProp; is simple to implement; computationally efficient; requires little memory; and performs well in datasets. It improves the accuracy of the deep neural network, speeds up the training, and improves performance. It is used to update the neural network’s attributes and leads to minimizing the loss function and maximizing the accuracy [30]. The optimized approach achieved the highest accuracy compared with previous studies, which applied data mining, machine learning, and deep learning to airlines [31].
1.2 The Key Objectives of This Study
To develop an optimized deep learning approach by integrating deep learning with the adaptive moment estimation (Adam) optimization technique. The proposed approach helps airlines determine the impact of service quality on passenger satisfaction. In terms of accuracy, the results indicate that the proposed approach outperformed all other models in the previous studies. It enables airlines to take informed steps to improve operational effectiveness.
The literature review is presented in Section 2, the optimized deep learning approach in Section 3, the implementation of the proposed approach in Section 4, the evaluation and results in Section 5, and the conclusions in Section 6.
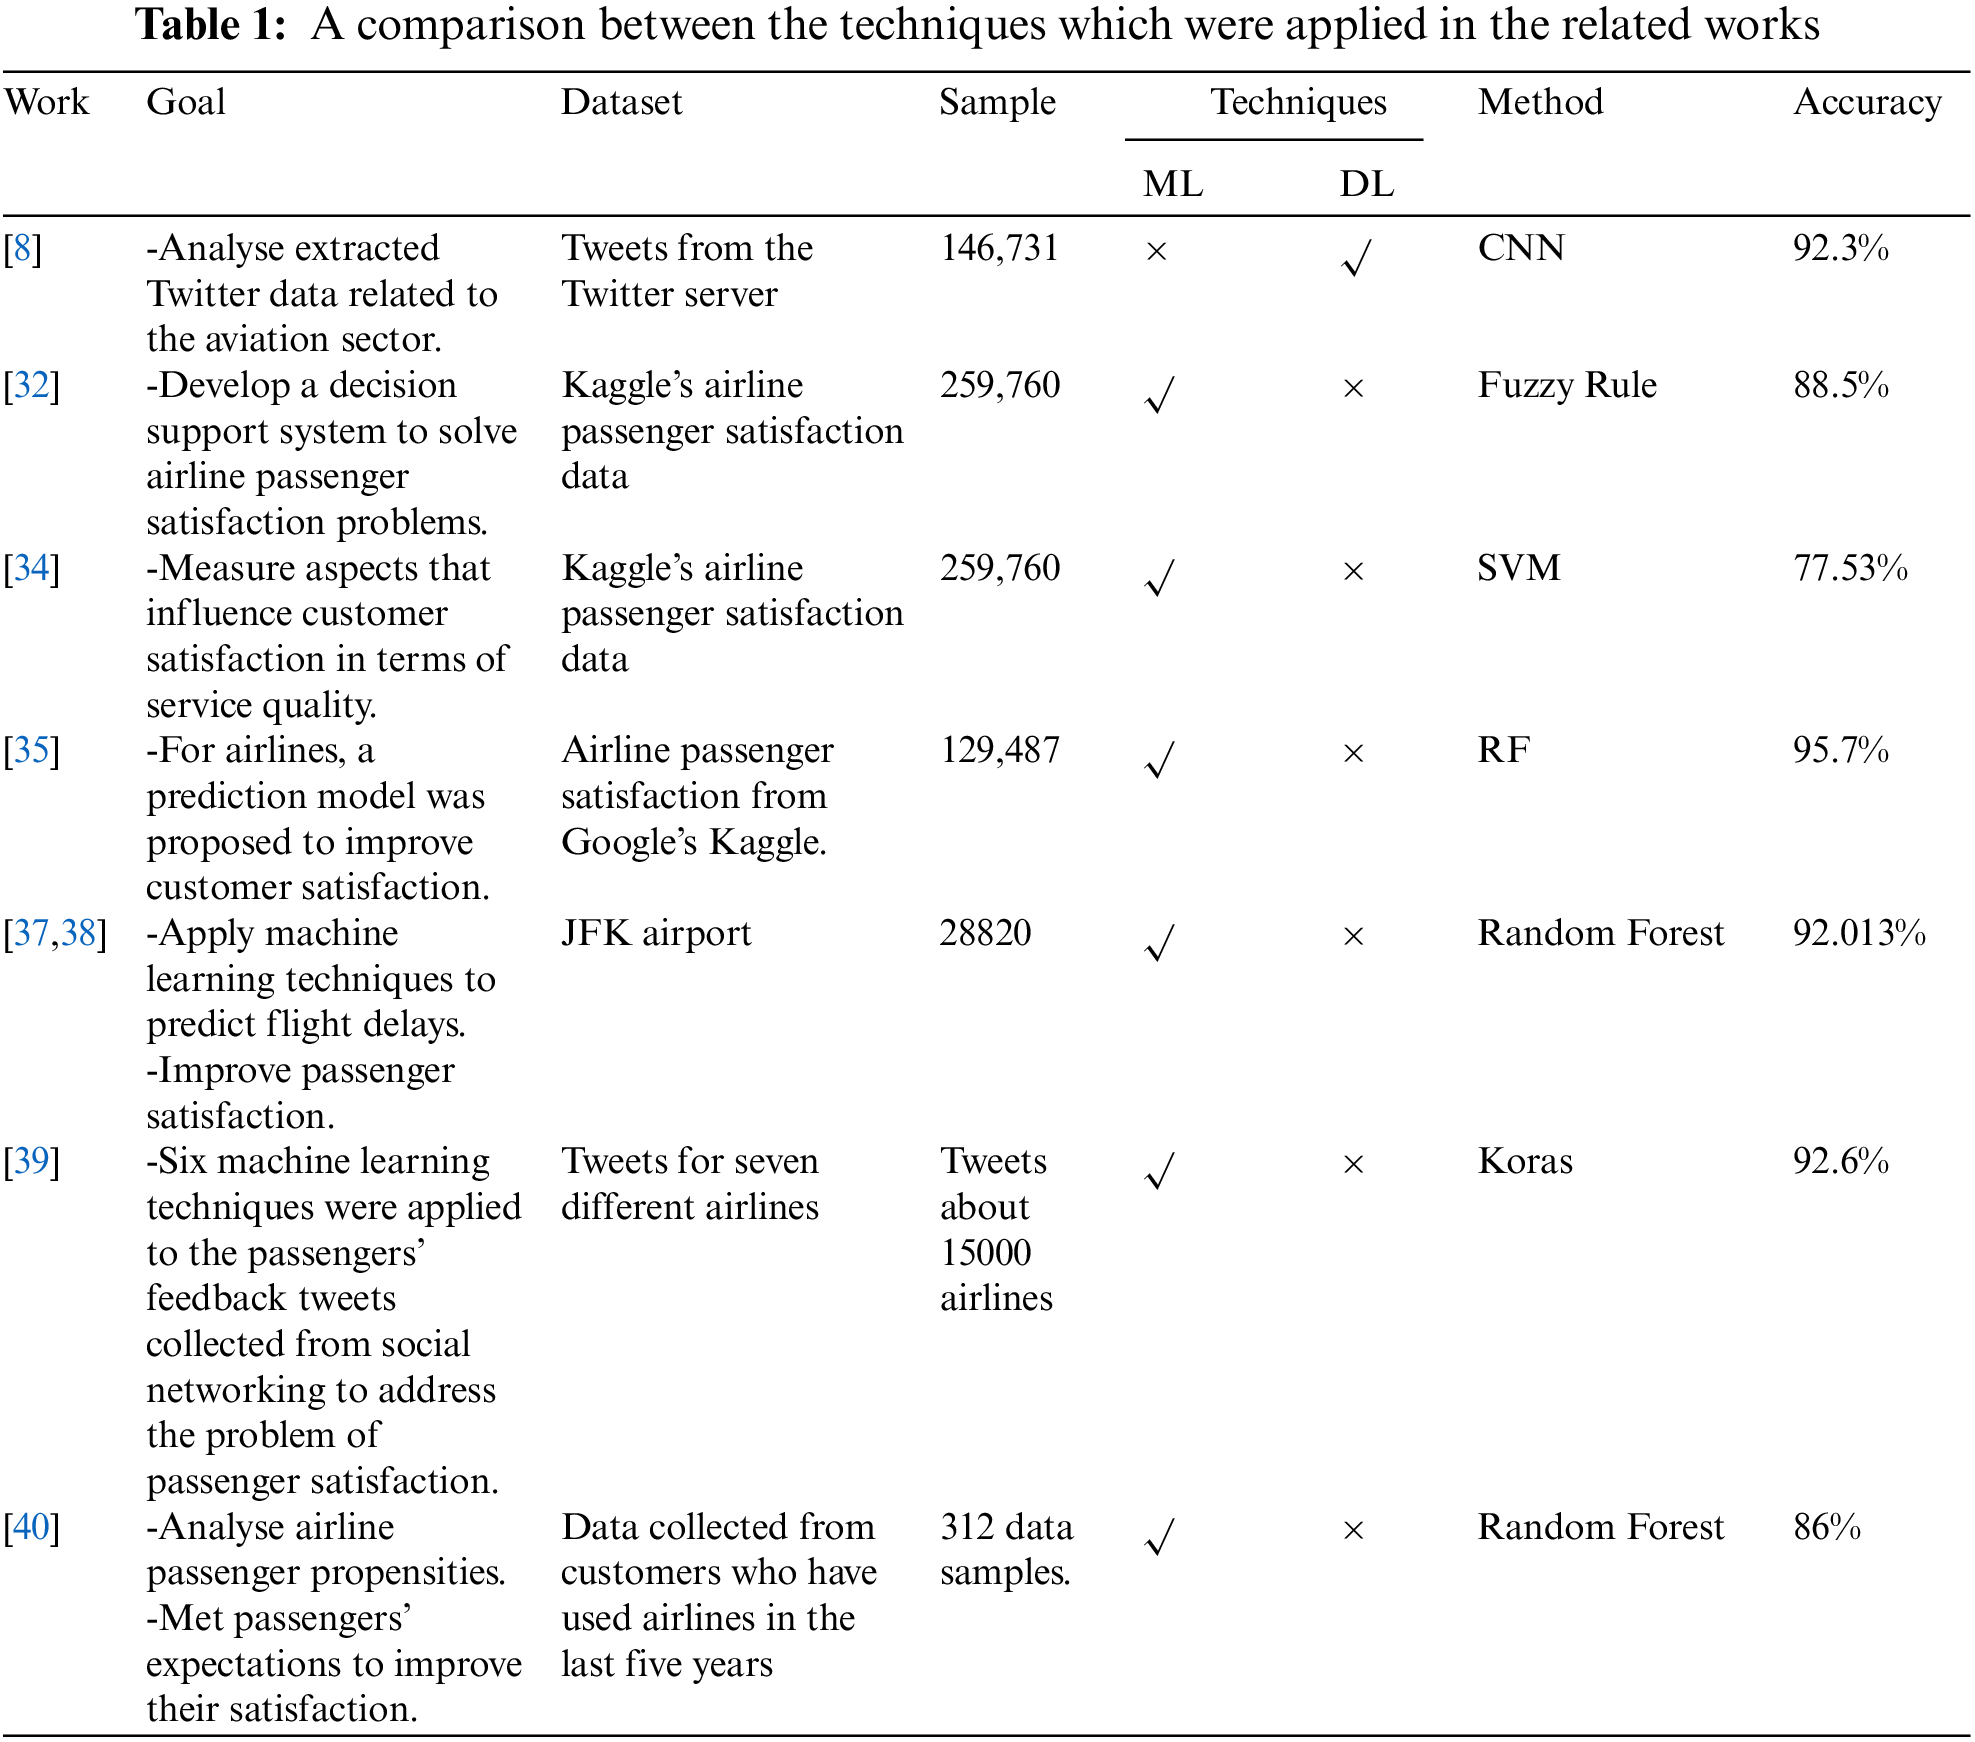
Gorzałczany et al. [32] developed a technique-based knowledge discovery method to overcome the problems associated with airline passenger satisfaction. The proposed technique uses fuzzy rule-based classification systems to build a decision support system. It achieves high customer satisfaction with an accuracy of 88.5%. It enhances the service quality and a company’s reputation. It satisfies customers’ needs and maximizes profits for the airline industry.
Neacşu et al. [33] evaluated customer satisfaction and how travelers’ interests and rights were respected in Romania. A total of 110 individuals were questioned as part of a quantitative exploratory empirical study. The findings assess the extent to which the airline met and exceeded expectations. Finally, they introduced instructions for airline management to overcome the challenges of customer satisfaction. Among these, build a successful strategy and develop a new business model to protect the rights and interests of travelers. These instructions are used to determine customers’ actual needs.
Noviantoro et al. [34] focused on the importance of analyzing the needs of passengers and the extent to which the services introduced by airlines satisfy them. Data mining techniques with feature selection were applied to determine the most important features to improve passenger satisfaction. The goal is to determine the precise prediction performance using different methods. The findings indicate that luggage handling, in-flight internet access, online mobile boarding, and in-flight entertainment were the most important features to be enhanced by airline companies.
Hong et al. [35] analyzed data taken from Kaggle to improve customer satisfaction with the airline. They found correlations between the customer evaluation data. The features with the highest correlation are used with three classification algorithms (SVM, random forest, and DNN). They are used to develop a prediction model of customer satisfaction. The Random Forest model achieved the highest accuracy of 95.7% and enabled the airlines to have a competitive advantage.
Riantama et al. [36] stated that satisfying customers’ needs is crucial for achieving loyalty. They evaluated the factors of service quality and customer satisfaction in the airline industry. They applied a feature selection approach. These features are used in online evaluations of passengers to prevent possible bias and hazards associated with traditional surveys, such as questionnaires. They allowed respondents to fill out the questionnaire in a random manner. Feature selection is used to determine the most crucial features of passenger satisfaction. The support vector machine is used to measure the performance of the feature selection algorithms. The results showed that responsiveness is considered the most crucial feature of airline customer satisfaction. This study introduced a roadmap for airline companies to ensure that passengers are satisfied with their services.
Shu and Alok [37,38] confirmed that cancellations and flight delays lead to concern for passengers and airlines’ loss of profit. Precise estimation of cancellations and flight delays is crucial for airlines to increase revenues and customer satisfaction. They applied machine-learning techniques like support vector machines, random forest, k-nearest neighbors, and long short-term memory (LSTM) to datasets to predict flight delays. These techniques are used to forecast whether the flight will be delayed or not depending on factors like “NASDelay”, “Weather Delay”, “Origin”, and “Destination”. These techniques were applied to the Bureau of Transportation Statistics (BTS) dataset. The random forest technique achieved the highest accuracy of 92.01% compared to other methods.
Bezek et al. [39] confirmed the importance of gathering feedback from passengers. Airlines use social networking like Twitter to collect feedback from passengers. The dataset includes tweets from seven airlines, all of which have open access to UCI. The dataset is divided using a holdout. The six classification and optimization algorithms were each applied to the dataset to select the best technique. The Keras Adam optimization achieved the highest accuracy (92.6%). The highest accuracy was achieved by the Keras technique. The quality of airline services attracts new customers and retains existing ones. Airlines improve their physical and social services using a variety of techniques.
Park et al. [40] applied machine learning and deep learning techniques to discover the relationship between different features affecting passengers’ churn risk and satisfaction. They applied these techniques to survey data gathered from passengers (340 Korean adults) who have used Korean airplanes. The random forest technique achieved the highest accuracies of 84% and 86%, respectively. The deep learning (CNN-LSTM) model outperformed machine learning. It achieved an accuracy of 94%.
Kumar et al. [8] focused on improving passenger satisfaction using Twitter. They used machine learning techniques to analyze tweets of travelers’ feedback about popular airlines. Word embedding with the Glove dictionary and n-gram approaches were applied to extract features from the tweets. The classification model was developed using a support vector machine (SVM), a convolutional neural network (CNN), and an artificial neural network to classify tweets as positive or negative. CNN outperformed the SVM in extracting knowledge from tweets. It supports the airline and enhances customer satisfaction.
Nghiêm-Phú [28] introduced the most crucial feature affecting airline customer satisfaction. Quantitative data was collected from reviews of airline passengers on Airlinequality.com. The dataset includes 127 airlines of all classifications (0, 2, 3, 4, and 5 stars) and categories (traditional and low-cost carriers). A quantitative data mining approach is used to choose the most crucial identifiers that affect customer satisfaction. He showed that services and products, such as drinks, food, seats, and entertainment, are more important to customers than newer ones (Wi-Fi).
Based on previous studies, Table 1 presents the accuracy of applying artificial intelligence techniques. Most of these studies focused only on applying different data mining and machine learning techniques. Limited studies used deep learning techniques like CNN. In addition, they did not focus on improving the data quality in the preprocessing layer. This study addressed the problem of dataset quality and proposed an optimized approach to classify the impact of airline service quality on passenger satisfaction.
The optimized approach was developed by integrating a deep neural network with the Adam optimization. It addresses the disadvantages of existing ones and maximizes the accuracy of passenger satisfaction in a highly competitive environment. Airlines have an intelligent system that helps in classifying the impact of service quality on passenger satisfaction, improving, and retaining their passengers. The results indicate that the proposed approach outperformed all other models in the previous studies. It allows airlines to make informed decisions about improving operational effectiveness.
3 An Optimized Deep Learning Approach for Classifying Passenger Satisfaction
The proposed approach for predicting passengers’ satisfaction includes four main phases: 1) data acquisition, 2) data preprocessing, 3) optimization phase, and 4) applying the proposed approach as shown in Fig. 2.
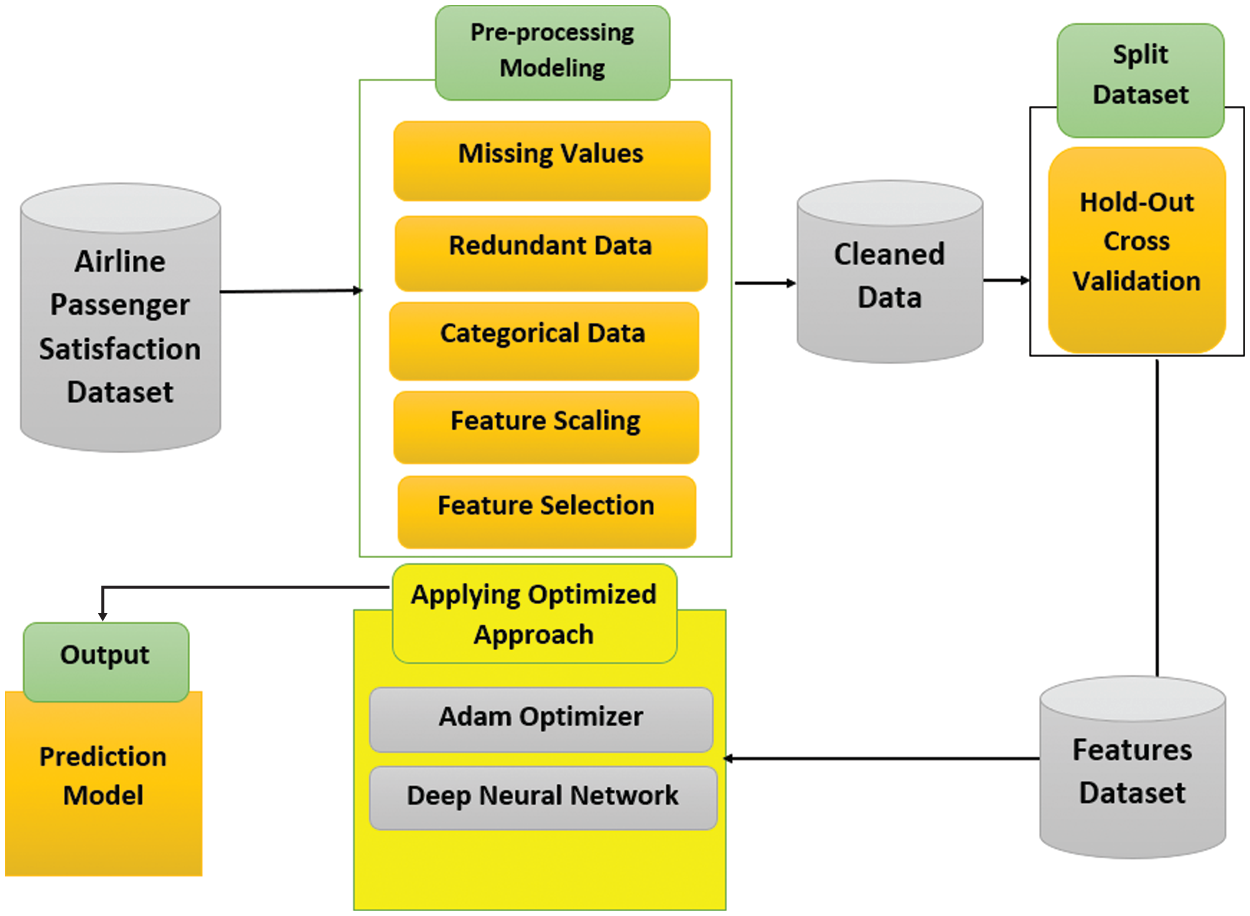
Figure 2: The proposed method for developing the prediction models
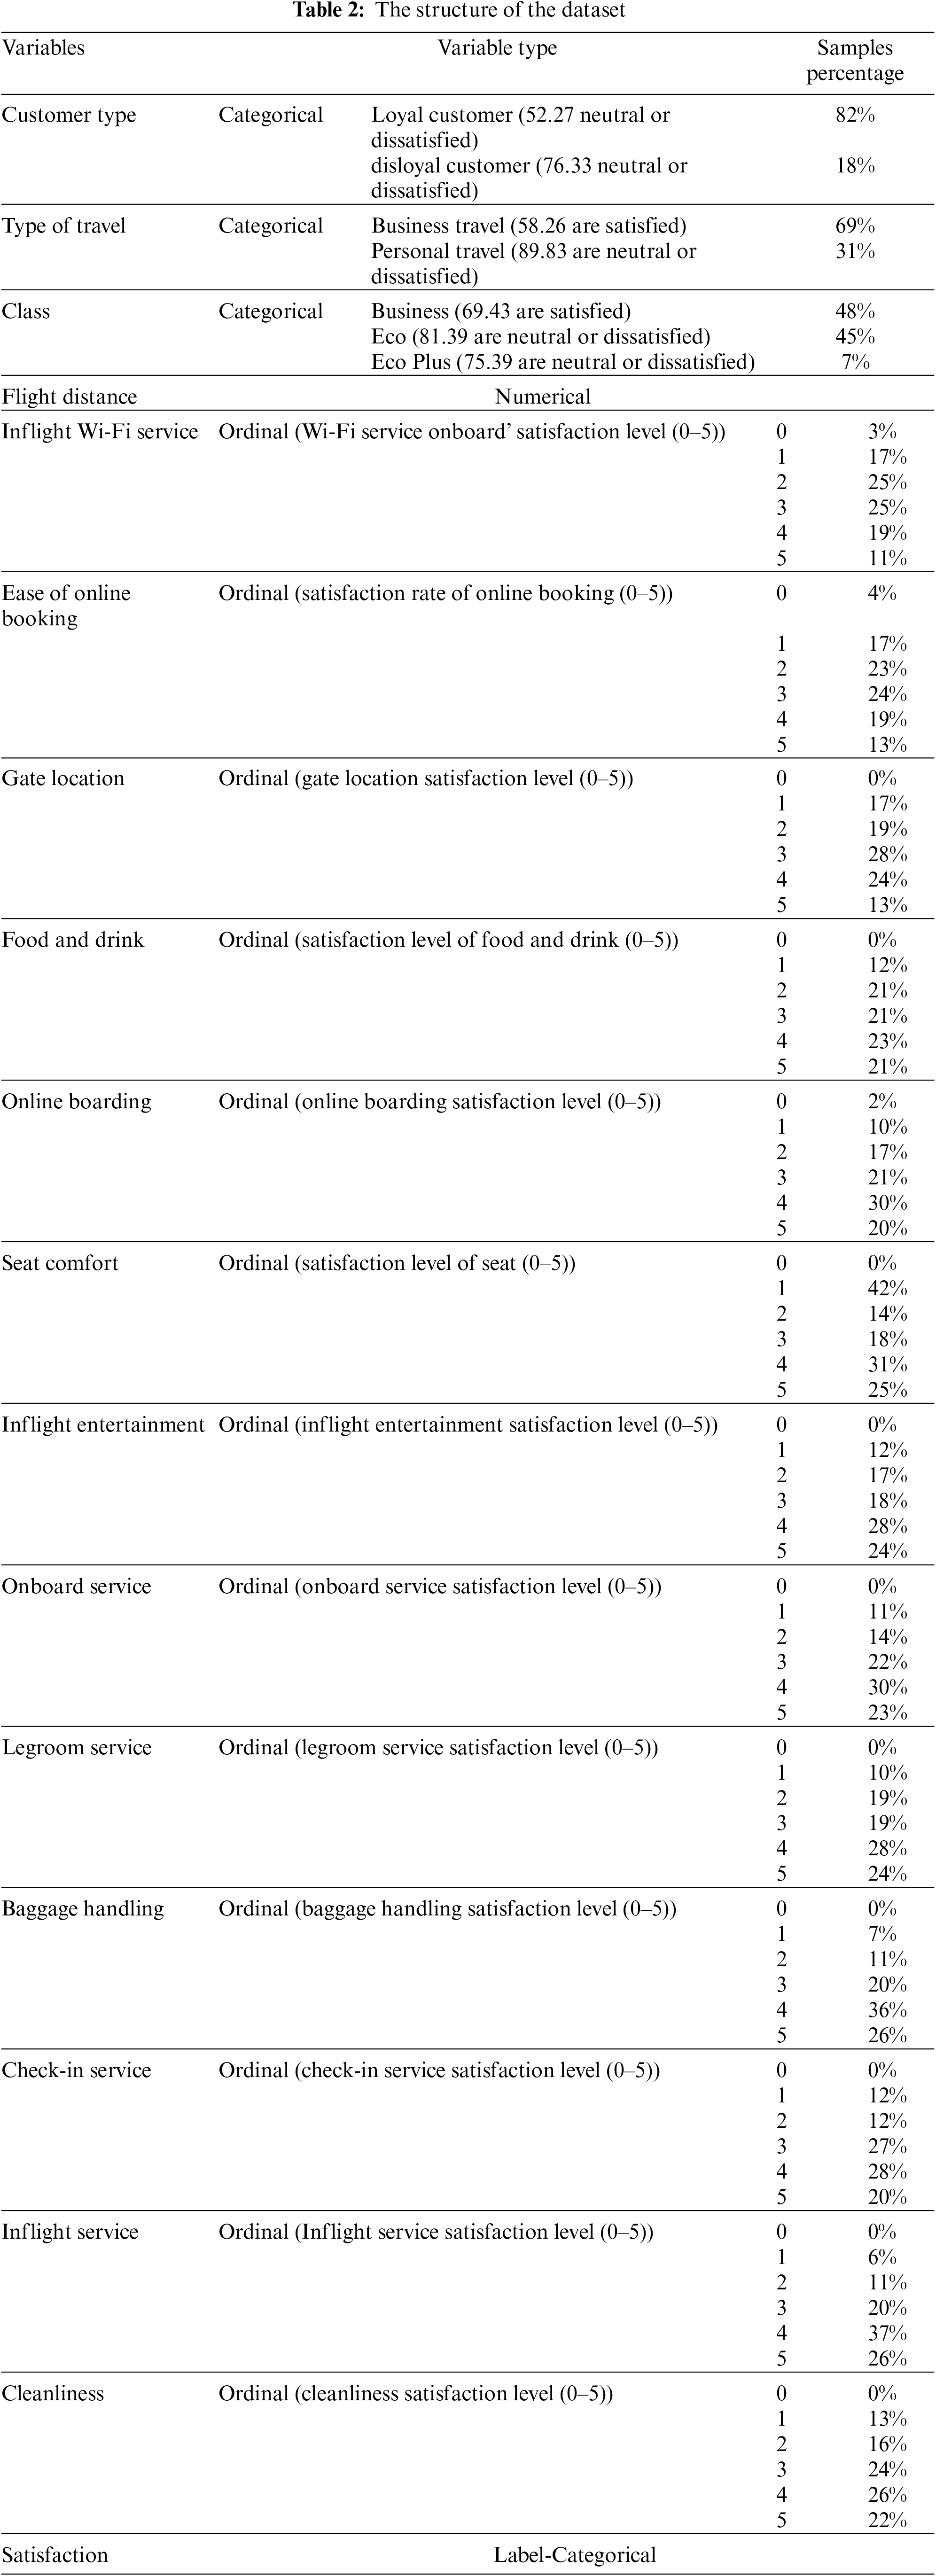
This study utilizes the well-known airline passenger satisfaction dataset from the Kaggle public repository. It contains 103903 records and introduces data for 24 features. A preliminary analysis of the dataset was conducted. It includes five categorical variables (gender, customer type, type of travel, class, and satisfaction) and 19 numerical variables (id, age, flight distance, inflight Wi-Fi service, departure/arrival time convenience, ease of online booking, gate location, food and drink, online boarding, seat comfort, inflight entertainment, onboard service, legroom service, baggage handling, check-in service, inflight service, cleanliness, departure delay in minutes, and arrival delay in minutes). Gender did not have an impact on satisfaction. The number of loyal customers is high, and the level of dissatisfaction is high, irrespective of loyalty. The airline must work hard to retain loyal customers. Business passengers appeared to be more satisfied with their flights than personal passengers. In the business class, passengers are highly satisfied, but in the economy class, they are the least satisfied. Table 2 represents the 18 selected features used in our study.
3.2 Phase 2: Data Preprocessing
This phase is introduced as the most crucial phase before applying our optimized approach. It includes all the transformations of the raw data to prepare it for the deep learning model. In this phase, two steps are applied to the dataset. Step 1 is to remove any redundant data; Step 2 is to deal with missing values. Step 3 is to implement feature engineering [41].
3.2.1 Step 1: Removing Redundant Data
Deleting duplicate and unneeded data from the passenger satisfaction dataset speeds up and simplifies the building of the prediction mode [42].
3.2.2 Step 2: Dealing with Missing Values
There are 310 missing values in the “Arrival Delay in Minutes” feature, and the missing values are filled by using the same departure delay values according to the linear relation between the arrival time and departure time in the minutes’ features.
3.2.3 Step 3: Applying Feature Engineering
Feature engineering is considered the most successful process for selecting, processing, and transforming data into features by handling categorical data, feature scaling, and feature selection [43].
Handling categorical data: This is accomplished by mapping the categorical data with the numbers 0 and 1 (Customer Type, Travel Type, Satisfaction) using ordinal encoding [44].
Feature scaling: scaling the features in the range of 0 to 1 to be more consistent using MinMax Scaler [45].
Feature Selection: it is used to improve the quality of the predictive model by selecting the most important features. The correlation matrix with the heatmap is used to determine the most important features, as depicted in Fig. 3. It introduces the relationship between the features and the target feature. The heatmap makes it simple to discover features that are most closely connected to the target feature. The Seaborn library was used to build a heatmap of the correlated features [46].
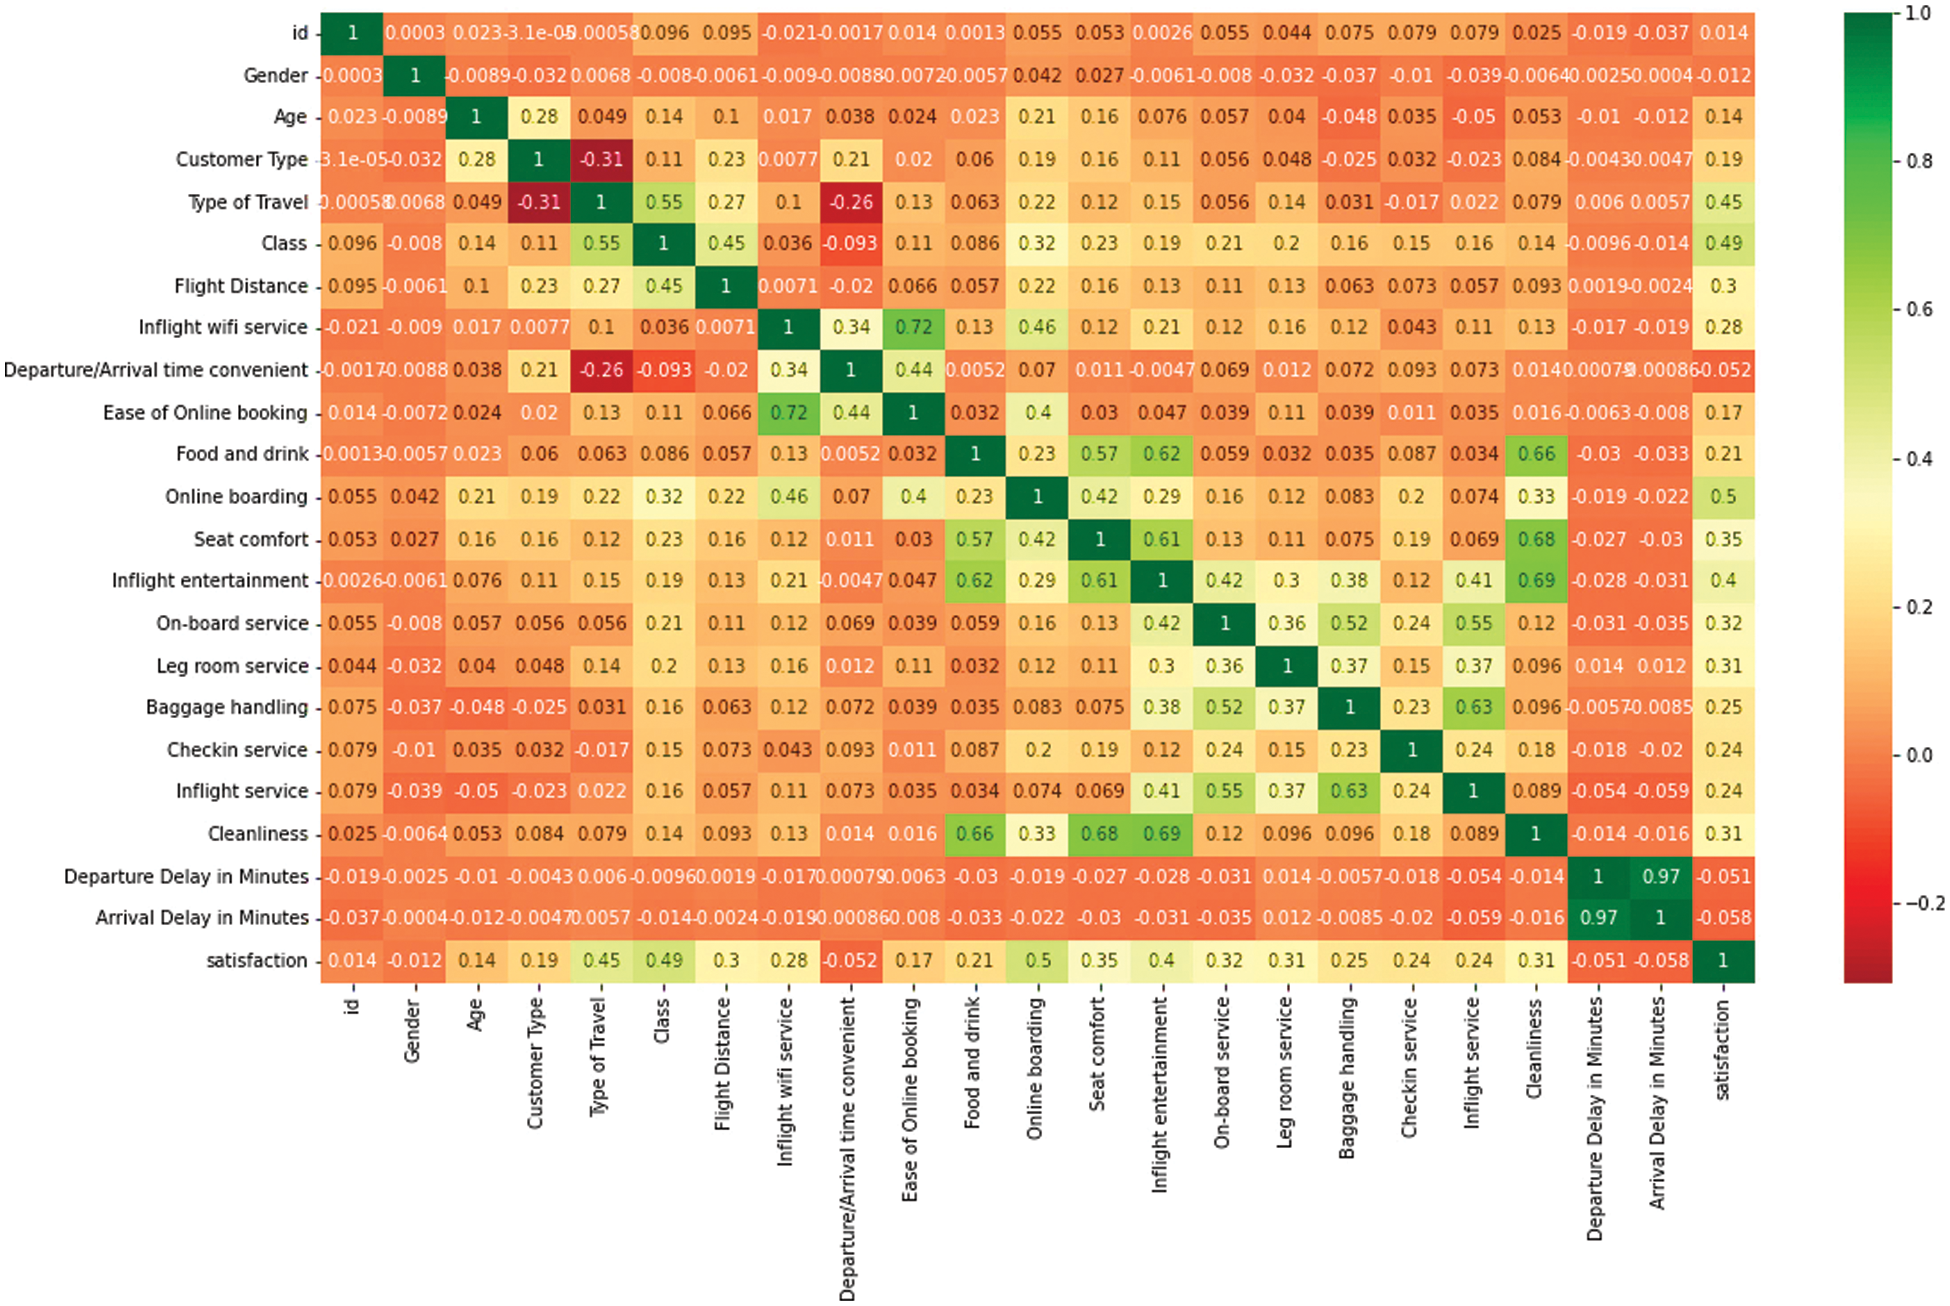
Figure 3: The correlation heatmap
The degree of relationship between two variables (that can be an independent and dependent variable or maybe two independent variables) was determined through correlation analysis. The correlation coefficient is a decimal value that is used to determine this relationship [47]. The power of the coefficient was determined based on its value within this range. A positive coefficient indicates a positive correlation between two features, and a negative coefficient indicates a negative correlation. A higher coefficient value indicates a strong correlation between the two variables, and a lower value indicates a weak correlation. This relationship assists in determining those independent variables that are most likely to have the greatest effect on the dependent variables [48]. The use of a heatmap simplifies the determination of which variables are most closely related to the target attribute. It is used to determine the most independent features that correlate with satisfaction-dependent features. Pearson’s correlation coefficient was used to calculate the differences between the values of the two separate variables. This is a statistical analysis of the collinear relationship between two variables. It involves the ratio of covariance and the standard deviation of the data values between two given variables. This refers to a statistical assessment of the collinear relationship between the two attributes. It is calculated according to Eq. (6), considering two attributes, A and B [49]:
where the correlation coefficient is represented by CA, B, the covariance is introduced by covariance (A, B), and σA and σB introduce the standard deviations of A and B, respectively. When there is a dataset with two sets, {a1, a2, an} and {b1, b2, bn}, the formula of the correlation is in Eq. (7) [50]:
n is used to represent the sample size, and ai and bi introduce various values of a and b. a represents the mean value of b and b represents the mean value of a. The coefficient (C) varies between −1 and +1. A strong positive correlation is dedicated to values close to +1, a strong negative correlation relates to values close to −1, and there is no relation when those values are closest to 0 [51].
For example, satisfaction is highly correlated with some features like online boarding, followed by class, type of travel, and in-flight entertainment. The id, age, gender, departure/arrival time convenience, departure delay, and arrival delay appear to be the least correlated with satisfaction. The unnecessary features that do not play a crucial role in satisfaction are removed from the dataset [52], and the dataset now has 18 rather than 24 features.
The dataset is divided using holdout cross-validation. It is divided into 90% training data and 10% test data.
3.3 Phase 3: Optimization Technique
The optimizers have a great impact on the neural networks’ performances. There are many optimization techniques, Adam (Adaptive Moment Estimation) is considered the most recommended optimizer in deep learning. Adam is used as the most popular adaptive step size method in neural networks. Kingma and Ba prove in practice that the Adam algorithm is better and faster than other optimizers [53]. Deep learning is used to minimize the diversity between actual and expected output. The need to use optimization training in the neural network helps for proper generalization of an algorithm and reduces the loss function by finding the optimized value of the weights. This enables accurate prediction of the new data [54].
In the proposed approach, the Adam optimizer, the most recommended optimizer for deep learning techniques, was used. Integrating the Adam optimizer with DNN improves performance. Adam’s does not require a good memory [55]. The weights in each level are optimized using the Adam algorithm. This algorithm is based on the first order and is computationally efficient. It reflects the correct bias ratings of the moving average gradient and the square gradient [56]. It provides the moving average gradients and square gradients with the correct bias ratings. It is simple to implement, needs little memory, and has efficient computation [57]. Furthermore, the Adam optimizer combines the best features of the AdaGrad and root mean square (RMS) Prop algorithms, as well as stochastic gradient descent (SGD), with the momentum algorithm [58]. The Adam optimizer works according to the following steps:
The first moment m0 starts with zero; the second moment n0 starts with zero, and the first time T starts with zero.
1. The first-moment bias is updated according to the following Eq. (8):
2. The second-moment bias is updated according to the following Eq. (9):
3. β the bias-corrected first moment is calculated in Eq. (10):
4. The bias-corrected second raw moment is calculated in Eq. (11):
5. The parameters are updated in Eq. (12):
The hyperparameters β1 and β2 have values of 0.9 and 0.999 respectively.
3.4 Phase 4: Applying Deep Neural Networks with the Adam Optimizer
The deep neural networks (DNN) technique is used to build predictive models for the classification of the passenger’ satisfaction (satisfied or dissatisfied).
The DNN is considered a deep learning algorithm that is built on neurons. It is a type of ANN that has numerous hidden layers between the input and output layers [60].
4 Implementing the Proposed Optimized Approach
The proposed approach consists of five layers (the input layer, three hidden layers, and the output layer). The input layer in DNN includes 18 neurons, which refers to 18 features for training data, three hidden layers, and a dense layer that includes 200 neurons. The DNN classifier is made up of layers of neurons that work together using a rectified linear unit (ReLU) as an activation function [61]. This is accomplished by using Eq. (13). The success of the ReLU function is predicated on its high level of training over other activation functions. It is the most utilized activation function [62]. The output layer has a two-neuron dense layer (these neurons refer to the passengers satisfied or not satisfied with airlines) with a sigmoid function. This is accomplished by using Eq. (14) [63]. The sigmoid function is simple to compute, and the output values are confined between 0 and 1, so the output is normalized for each neuron [64].
Different combinations of hyperparameters that include different numbers of epochs (150,200), hidden layers (5, 6, 7), and neurons (30,200) are addressed. In addition, several activation functions (ReLU, Tanh) were applied as shown in Table 3.

There is no rule to determine how many epochs, hidden layers, and neurons there are for the model hyperparameters. In this study, experimentation (testing DNN techniques with different hidden layers, epochs, neurons, and activation functions), the study problem, dataset size, processing time, and computing power were used to find the best combination of hyperparameters. The research community has shown that using more than one hidden layer can be fruitful in solving the prediction problem [65]. When the number of neurons and epochs increased, the loss decreased, and the accuracy increased [66]. The Tanh activation function takes more computing time than ReLU in Attempt 4. ReLU is the most used and successful activation function for deep learning over tanh functions. In this study, the best combinations of these components that achieved the highest accuracy of 99.3% (Attempt 5) were selected. The fully connected DNN model for predicting airline passenger satisfaction consists of five layers: the input layer, three hidden layers, and the output layer. Analysis of the training data for 2500 batch sizes and 200 epochs using the Adam optimizer, which attentively modifies the network’s weights, applying the loss function called Mean Squared Error. A loss function was applied to measure the effectiveness of the proposed approach.
This section introduces the results of applying the proposed approach to the satisfaction dataset. Identification of performance metrics is an important step in determining the significance of the proposed approach. A variety of metrics can be used to evaluate the performance of predictive models [67]. Accuracy is the most important measure. It is essential for determining the best classifier. The measurement of the performance of each classification technique was conducted independently, and all findings were documented for a deeper examination. These measures were applied to evaluate the quality of the trained classifiers [68–70]. A critical metric, the confusion matrix, reflects four expected values: (TP) true positives, which are events in which the prediction is yes, and passengers are satisfied. (TN) true negatives: the results predict no, and passengers are not satisfied. (FP) false positives: the prediction is yes, but passengers are not satisfied. (FN) false negatives: the prediction is no, but passengers are satisfied. Accuracy was determined by calculating true positives and true negatives divided by the total values of the confusion matrix [36,37]. This value was calculated using Eq. (15).
The proposed approach’s accuracy is measured in the optimized deep neural network using the sigmoid activation function, 200 neurons, and 200 epochs for classifying the outputs. The results achieve a high accuracy of 99.3% as introduced in Fig. 4 and a 0.0028 loss that uses the function of the mean squared error as presented in Fig. 5. The loss function is a method of measuring the efficiency of the proposed approach to processing the dataset. When the loss function shows a higher value, this means that the predictions are incorrect and vice versa.
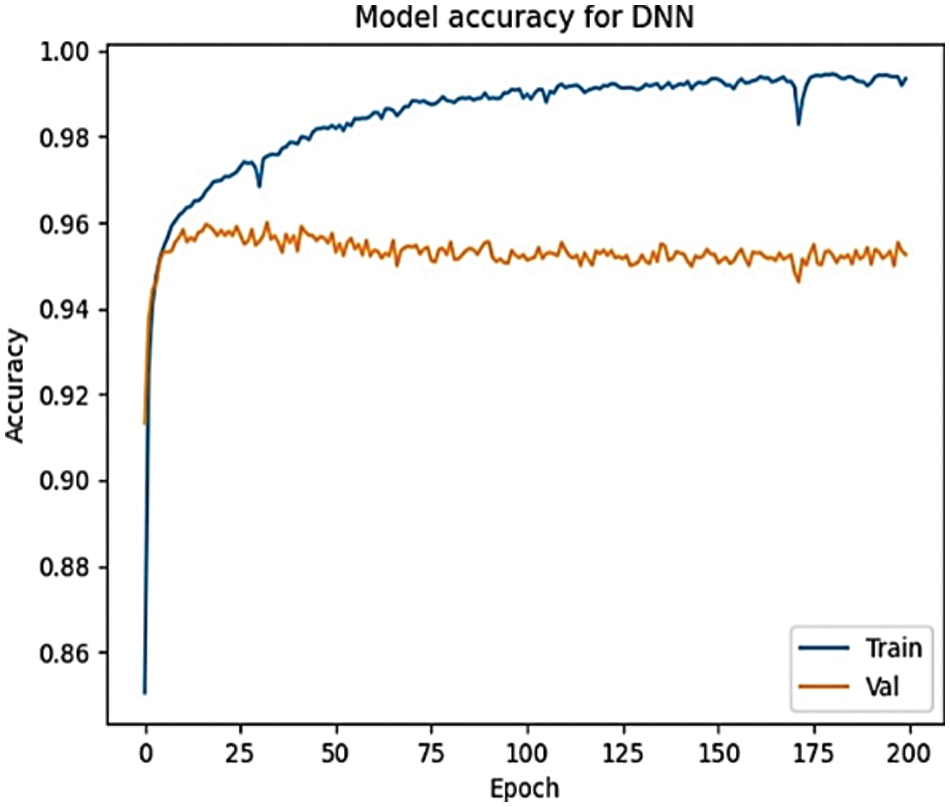
Figure 4: The accuracy of the DNN model
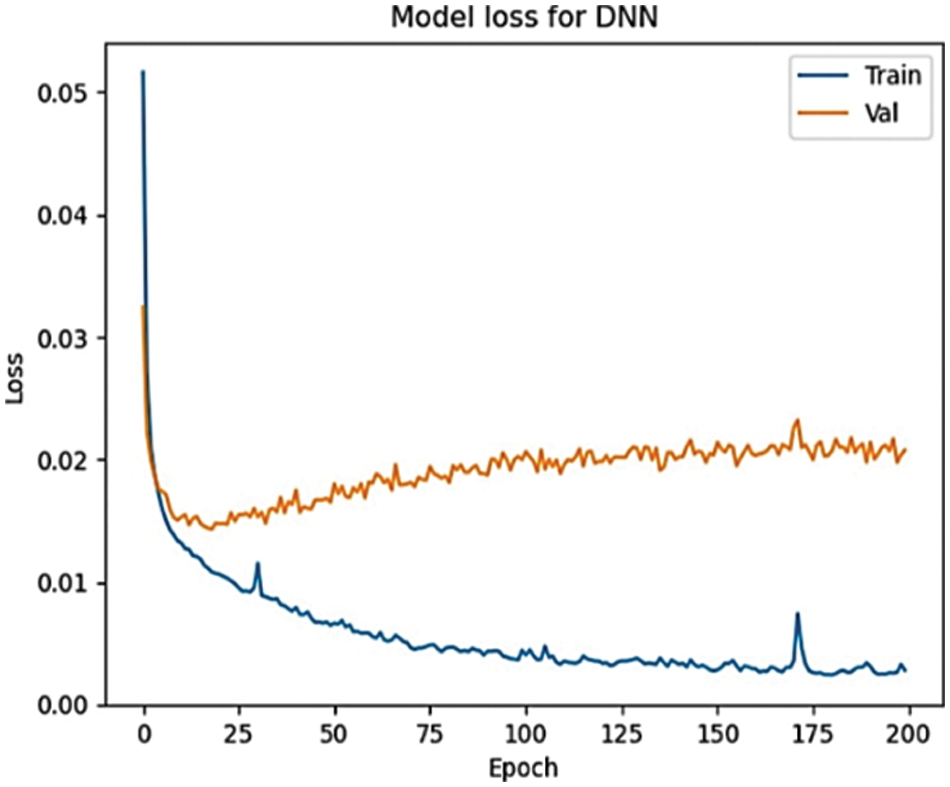
Figure 5: The loss of the DNN model
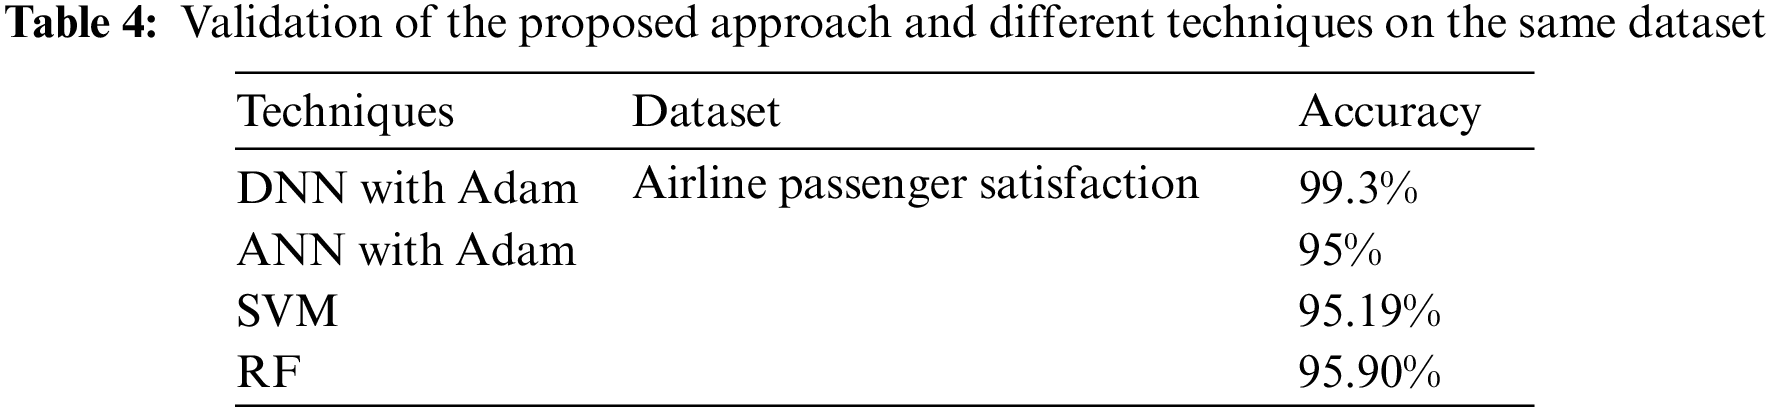
5.1 Validate the Proposed Approach with Other Techniques
Other techniques should be used to validate the proposed approach. The accuracy of applying different ML techniques (such as SVM and RF) and deep learning techniques (such as ANN with Adam optimizer) to the same dataset was discussed. Then, the best technique for predicting passenger satisfaction is selected. The ANN technique with the Adam optimizer achieved an accuracy of 95%. The accuracy of applying machine learning techniques such as SVM and RF achieved an accuracy of 95.19% and 95.90%, respectively, as shown in Table 4. The proposed approach (DNN with an Adam optimizer) achieved the highest accuracy of 99.3%.
5.2 Validate the Proposed Approach with Previous Studies
A comparison between the proposed approach and other scientific papers [22,25], and [26] that apply machine-learning techniques (SVM, fuzzy rule, and random forest) to the same dataset to predict passenger satisfaction. They achieved an accuracy of 88.5%, 77.53%, and 95.7%, respectively. A comparison of some models’ accuracy with the proposed approach is presented in Table 5. The proposed approach increases the accuracy of classifying passenger satisfaction by 22% compared to the SVM, achieves better classification accuracy by 3.6% compared to the RF algorithm, and improves the accuracy by 10.8% compared to the Fuzzy Rule. The results show that the proposed approach achieves the highest accuracy and outperforms the previous studies in terms of accuracy.

Machine learning and deep learning are unique and powerful approaches for airlines that have massive amounts of passenger data. This study highlights the importance of applying data preprocessing and the proposed approach (DNN with Adam optimizer) with mean squared error, loss function, and the ReLU activation function to analyze airline passenger data and improve competitiveness in airlines. Application of the proposed approach to the airline passenger dataset and the accuracy performance were computed to evaluate the proposed approach with different techniques and previous studies. The experimental results revealed that the proposed approach’s accuracy (99.3%) is higher than that of other studies that used the same dataset to solve the same problem. In addition, it also achieved the highest accuracy when applying the SVM, RF, and ANN techniques to the same dataset. The proposed approach represents a perfect solution for retaining airline passengers. It increases profits for airlines.
Funding Statement: The author received no specific funding for this study.
Availability of Data and Materials: Data is contained within the article.
Conflicts of Interest: The author declares that she has no conflicts of interest to report regarding the present study.
References
1. F. Monsuur, M. Enoch, M. Quddus and S. Meek, “Modelling the impact of rail delays on passenger satisfaction,” Transportation Research Part A: Policy and Practice, vol. 152, no. 10, pp. 19–35, 2021. [Google Scholar]
2. Y. Wang, T. Liu, M. Hu, S. Alam and V. Duong, “Temporal patterns underlying domestic departure passengers behavior in the airport,” IEEE Access, vol. 8, no. 7, pp. 127969–127980, 2020. [Google Scholar]
3. J. Pappachan, “Airport service quality dimensions and its influence on airline passengers’ satisfaction in India,” J. Business Manag Stud, vol. 5, no. 1, pp. 10–18, 2020. [Google Scholar]
4. M. Yazdi, S. Kamel, S. Chabok and M. Kheirabadi, “Flight delay prediction based on deep learning and levenberg-marquart algorithm,” J. Big Data, vol. 7, no. 1, pp. 1–28, 2020. [Google Scholar]
5. N. Abdullah, M. Prabhu and M. Othman, “Analysing driving factors of customer satisfaction among telecommunication service providers in kurdistan region,” International Journal of Engineering Business Management, vol. 14, no. 6, pp. 18479790221111436, 2022. [Google Scholar]
6. C. Janiesch, P. Zschech and K. Heinrich, “Machine learning and deep learning,” Electronic Markets, vol. 31, no. 3, pp. 685–695, 2021. [Google Scholar]
7. Z. Ahmad, A. Khan, C. Shiang, J. Abdullah and F. Ahmad, “Network intrusion detection system: A systematic study of machine learning and deep learning approaches,” Transactions on Emerging Telecommunications Technologies, vol. 32, no. 1, pp. 4150, 2021. [Google Scholar]
8. S. Kumar and M. Zymbler, “A machine learning approach to analyze customer satisfaction from airline tweets,” Journal of Big Data, vol. 6, no. 1, pp. 1–16, 2019. [Google Scholar]
9. Y. Guo, Z. Zhangab and F. Tangbc, “Feature selection with kernelized multi-class support vector machine,” Pattern Recognition, vol. 117, pp. 107988, 2021. [Google Scholar]
10. G. Teles, J. Rodrigues, R. Rabêlo and S. A. Kozlov, “Comparative study of support vector machines and random forests machine learning algorithms on credit operation,” Software: Practice and Experience,vol. 51, no. 12, pp. 2492–2500, 2021. [Google Scholar]
11. K. Aggarwal, M. M. Mijwil, A. Al-Mistarehi and S. Alomari, “Has the future started? the current growth of artificial intelligence, machine learning, and deep learning,” Iraqi Journal for Computer Science and Mathematics, vol. 3, no. 1, pp. 115–123, 2022. [Google Scholar]
12. R. Das, C. Biswas and S. Majumder, “Study of spiking neural network architecture for neuromorphic computing,” in Proc. of 11th Int. Conf. on Communication Systems and Network Technologies (CSNT), Indore, India, pp. 373–379, 2022. [Google Scholar]
13. H. Ly, T. Nguyen, H. Mai and V. Tran, “Development of deep neural network model to predict the compressive strength of rubber concrete,” Construction and Building Materials, vol. 301, no. 9, pp. 124081, 2021. [Google Scholar]
14. J. Lee, Y. Roh, H. Song and S. E. Whang, “Machine learning robustness, fairness, and their convergence,” in Proc. of the 27th ACM Sigkdd Conf. on Knowledge Discovery & Data Mining, Singapore, pp. 4046–4047, 2021. [Google Scholar]
15. C. Chen and G. Gu, “Generative deep neural networks for inverse materials design using backpropagation and active learning,” Advanced Science, vol. 7, no. 5, pp. 1902607, 2020. [Google Scholar]
16. M. A. Elaziz, A. Dahou, L. Abualigah, L. Yu, M. Alshinwan et al., “Advanced metaheuristic optimization techniques in applications of deep neural networks: A review,” Neural Computing and Applications, vol. 33, no. 21, pp. 14079–14099, 2021. [Google Scholar]
17. H. Nguyen and N. Hoang, “Computer vision-based classification of concrete spall severity using metaheuristic-optimized extreme gradient boosting machine and deep convolutional neural network,” Automation in Construction, vol. 140, no. 6, pp. 104371, 2022. [Google Scholar]
18. F. Bozkurt, “A comparative study on classifying human activities using classical machine and deep learning methods,” Arabian Journal for Science and Engineering, vol. 47, no. 2, pp. 1507–1521, 2022. [Google Scholar]
19. M. Yousefnezhad, J. Hamidzadeh and M. Aliannejadi, “Ensemble classification for intrusion detection via feature extraction based on deep learning,” Soft Computing, vol. 25, no. 20, pp. 12667–12683, 2021. [Google Scholar]
20. T. T. Dufera, “Deep neural network for system of ordinary differential equations: Vectorized algorithm and simulation,” Machine Learning with Applications, vol. 5, no. 3, pp. 100058, 2021. [Google Scholar]
21. P. S. Kumara, H. S. Beheraa, A. Kumari, J. Nayakc and B. Naikd, “Advancement from neural networks to deep learning in software effort estimation: Perspective of two decades,” Computer Science Review, vol. 38, no. 1, pp. 100288, 2020. [Google Scholar]
22. L. Hagyeong and S. Jongwoo, “Introduction to convolutional neural network using keras; an understanding from a statistician,” Communications for Statistical Applications and Methods, vol. 26, no. 6, pp. 591–610, 2019. [Google Scholar]
23. C. Liu, Q. Ma, Z. J. Luo, Q. R. Hong, Q. Xiao et al., “A programmable diffractive deep neural network based on a digital-coding metasurface array,” Nature Electronics, vol. 5, no. 2, pp. 113–122, 2022. [Google Scholar]
24. A. Ghildiyal, S. Sharma and A. Kumar, “Street cleanliness monitoring system using deep learning,” in Proc. of Third Int. Conf. on Intelligent Communication Technologies and Virtual Mobile Networks (ICICV), Tirunelveli, India, pp. 868–873, 2021. [Google Scholar]
25. H. Magsi, A. H. Sodhro, M. S. Al-Rakhami, N. Zahid, S. Pirbhulal et al., “A novel adaptive battery-aware algorithm for data transmission in IoT-based healthcare applications,” Electronics, vol. 10, no. 4, pp. 367, 2021. [Google Scholar]
26. M. Mariani, G. Di Fatta and M. Difelice, “Understanding customer satisfaction with services by leveraging big data: The role of services attributes and consumers’ cultural background,” IEEE Access, vol. 7, pp. 8195–8208, 2018. [Google Scholar]
27. A. Akgün, B. Çizel and E. Ajanovic, “Mining excursion tourist profile through classification algorithms,” Quality & Quantity, vol. 56, no. 4, pp. 2567–2588, 2022. [Google Scholar]
28. B. Nghiêm-Phú, “What determines the loyalty of airline passengers? findings of a quantitative data-mining study,” Market/Tržište, vol. 31, no. 1, pp. 23–37, 2019. [Google Scholar]
29. S. Tuchen, M. Arora and L. Blessing, “Airport user experience unpacked: Conceptualizing its potential in the face of COVID-19,” Journal of Air Transport Management, vol. 89, no. 8, pp. 101919, 2020. [Google Scholar]
30. H. Hijry and R. Olawoyin, “Predicting patient waiting time in the queue system using deep learning algorithms in the emergency room,” International Journal of Industrial Engineering, vol. 3, no. 1, pp. 33–45, 2021. [Google Scholar]
31. W. Aljedaani, F. Rustam, M. W. Mkaouer, A. Ghallab, V. Rupapara et al., “Sentiment analysis on twitter data integrating TextBlob and deep learning models: The case of US airline industry,” Knowledge-Based Systems, vol. 255, no. 11, pp. 109780, 2022. [Google Scholar]
32. M. Gorzałczany, F. Rudziński and J. Piekoszewski, “Business intelligence in airline passenger satisfaction study—a fuzzy-genetic approach with optimized interpretability-accuracy trade-off,” Applied Sciences,vol. 11, no. 11, pp. 5098, 2021. [Google Scholar]
33. N. Neacşu and A. Madar, “The influence of consumer protection on the satisfaction of airline passengers,” in Proc. Int. Conf. on Business Excellence, Bucharest, Romania, vol. 13, no. 1, pp. 112–124, 2019. [Google Scholar]
34. T. Noviantoro and J. Huang, “Investigating airline passenger satisfaction: Data mining method,” Research in Transportation Business & Management, vol. 43, no. 2, pp. 100726, 2022. [Google Scholar]
35. S. Hong, B. Kim and Y. Jung, “Correlation analysis of airline customer satisfaction using random forest with deep neural network and support vector machine model,” International Journal of Internet, Broadcasting and Communication, vol. 12, no. 4, pp. 26–32, 2020. [Google Scholar]
36. D. Riantama, A. Tsai, S. Lin and H. Lin, “Evaluating airline passengers’ satisfaction during the COVID-19 pandemic: A text mining approach,” in Proc. of ICTeSSH, Virtual/Online, Netherlands, pp. 1–13, 2021. [Google Scholar]
37. Z. Shu, “Analysis of flight delay and cancellation prediction based on machine learning models,” in Proc. 3rd Int. Conf. on Machine Learning, Big Data and Business Intelligence (MLBDBI), Taiyuan, China, pp. 260–267, 2021. [Google Scholar]
38. D. Alok, “Airline delay prediction using machine learning algorithms,” Ph.D. Dissertation, University of Wichita State, US, 2020. [Google Scholar]
39. U. Bezek and P. Güneş, “Analysis of airline tweets by using machine learning methods,” International Journal of Engineering Research and Applications, vol. 10, no. 7, pp. 42–45, 2020. [Google Scholar]
40. S. Park, M. Kim, Y. Kim and Y. Park, “A deep learning approach to analyze airline customer propensities: The case of South Korea,” Applied Sciences, vol. 12, no. 4, pp. 1916, 2022. [Google Scholar]
41. S. Y. Lee, S. Byeon, H. S. Kim, H. Jin and S. Lee, “Deep learning-based phase prediction of high-entropy alloys: Optimization, generation, and explanation,” Materials & Design, vol. 197, no. 1, pp. 109260, 2021. [Google Scholar]
42. E. Samunderu and M. Farrugia, “Predicting customer purpose of travel in a low-cost travel environment—a machine learning approach,” Machine Learning with Applications, vol. 9, no. 3, pp. 100379, 2022. [Google Scholar]
43. N. Shehab, M. Badawy and H. A. Ali, “Toward feature selection in big data preprocessing based on hybrid cloud-based model,” The Journal of Supercomputing, vol. 78, no. 3, pp. 3226–3265, 2022. [Google Scholar]
44. P. Kumar and A. Kanavalli, “A Similarity-based K-means clustering technique for categorical data in data mining application,” Int. J. Intell. Eng. Syst., vol. 14, no. 2, pp. 43–51, 2021. [Google Scholar]
45. N. Z. Alshahrani, S. M. Alshahrani, A. M. Alshahrani, P. A. Leggat, H. Rashid et al., “Compliance of the gulf cooperation council airlines with COVID-19 mitigation measures,” Journal of Travel Medicine, vol. 28, no. 2, pp. 205, 2021. [Google Scholar]
46. E. O. Omuya, G. O. Okeyo and M. W. Kimwele, “A survey on intrusion detection system: Feature selection, model, performance measures, application perspective, challenges, and future research directions,” Artificial Intelligence Review, vol. 174, no. 1, pp. 1–111, 2021. [Google Scholar]
47. S. Mokhtari, A. Abbaspour, K. Yen and A. Sargolzaei, “A machine learning approach for anomaly detection in industrial control systems based on measurement data,” Electronics, vol. 10, no. 4, pp. 407, 2021. [Google Scholar]
48. J. Papenbrock, P. Schwendner, M. Jaeger and S. Krügel, “Matrix evolutions: Synthetic correlations and explainable machine learning for constructing robust investment portfolios,” The Journal of Financial Data Science, vol. 3, no. 2, pp. 51–69, 2021. [Google Scholar]
49. J. Deng and Y. Deng, “Cheong combining conflicting evidence based on Pearson correlation coefficient and weighted graph,” International Journal of Intelligent Systems, vol. 36, no. 12, pp. 7443–7460, 2021. [Google Scholar]
50. S. Vanlangendonck, N. Severijns, L. Hayen and F. Glück, “Influence of the recoil-order and radiative correction on the β decay correlation coefficients in mirror decays,” Physical Review C, vol. 106, no. 1, pp. 015506, 2022. [Google Scholar]
51. D. Chicco, N. Tötsch and G. Jurman, “The matthews correlation coefficient (MCC) is more reliable than balanced accuracy, bookmaker informedness, and markedness in two-class confusion matrix evaluation,” BioData Mining, vol. 14, no. 1, pp. 1–22, 2021. [Google Scholar]
52. P. Lalwani, M. Mishra, J. Chadha and P. Sethi, “Customer churn prediction system: A machine learning approach,” Computing, vol. 104, no. 2, pp. 271–294, 2022. [Google Scholar]
53. I. Khan, M. Jais, A. Ismail and S. Nisa, “Adam optimization algorithm for wide and deep neural network,” Knowledge Engineering and Data Science, vol. 2, no. 1, pp. 41–46, 2019. [Google Scholar]
54. A. Mustapha, L. Mohamed and K. Ali, “Comparative study of optimization techniques in deep learning: Application in the ophthalmology field,” Journal of Physics: Conference Series, Khouribga, Morocco, Ser. vol. 1743, no. 1, pp. 012002, 2021. [Google Scholar]
55. G. Jain, T. Mahara, S. C. Sharma, S. Agarwal and H. Kim, “Td-dnn: A time decay-based deep neural network for recommendation system,” Applied Sciences, vol. 12, no. 13, pp. 6398, 2022. [Google Scholar]
56. K. K. Chandriah and R. V. Naraganahalli, “Rnn/lstm with modified adam optimizer in deep learning approach for automobile spare parts demand forecasting,” Multimedia Tools and Applications, vol. 80,no. 17, pp. 26145–26159, 2021. [Google Scholar]
57. R. Jaiswal, G. K. Jha, R. R. Kumar and K. Choudhary, “Deep long short-term memory based model for agricultural price forecasting,” Neural Computing and Applications, vol. 34, no. 6, pp. 4661–4676, 2022. [Google Scholar]
58. S. H. Haji and A. M. Abdulazeez, “Comparison of optimization techniques based on gradient descent algorithm: A review,” PalArch’s Journal of Archaeology of Egypt/Egyptology, vol. 18, no. 4, pp. 2715–2743, 2021. [Google Scholar]
59. H. A. AbdElAal, S. A. Taie and N. El-Bendary, “An optimized RNN-LSTM approach for Parkinson’s disease early detection using speech features,” Bulletin of Electrical Engineering and Informatics, vol. 10, no. 5, pp. 2503–2512, 2021. [Google Scholar]
60. K. Amasyali and N. El-Gohary, “Machine learning for occupant-behavior-sensitive cooling energy consumption prediction in office buildings,” Renewable and Sustainable Energy Reviews, vol. 142, no. 5, pp. 110714, 2021. [Google Scholar]
61. T. Zhang, Y. Zeng, Y. Zhang, X. Zhang and M. Shi, “Neuron type classification in rat brain based on integrative convolutional and tree-based recurrent neural networks,” Scientific Reports, vol. 11, no. 1, pp. 1–14, 2021. [Google Scholar]
62. M. M. Lau and K. H. Lim, “Review of adaptive activation function in deep neural network,” in Proc. of IEEE-EMBS Conf. on Biomedical Engineering and Sciences (IECBES), Sarawak, Malaysia, pp. 686–690, 2018. [Google Scholar]
63. M. A. Jafari and A. Aminataei, “Some applications of sigmoid functions,” Iranian Journal of Numerical Analysis and Optimization, vol. 11, no. 1, pp. 221–233, 2021. [Google Scholar]
64. S. Yang, X. Wang, Q. Yang, E. Dong and S. Du, “Instance segmentation based on improved self-adaptive normalization,” Sensors, vol. 22, no. 12, pp. 4396, 2022. [Google Scholar]
65. S. Kassaymeh, S. Abdullah, M. Al-Laham, M. Alweshah, M. A. Al-Betar et al., “Salp swarm optimizer for modeling software reliability prediction problems,” Neural Processing Letters, vol. 53, no. 6, pp. 4451–4487, 2021. [Google Scholar]
66. R. Jader and S. Aminifar, “Fast and accurate artificial neural network model for diabetes recognition,” NeuroQuantology, vol. 20, no. 10, pp. 2187–2196, 2021. [Google Scholar]
67. D. Bowes, T. Hall and J. Petrić, “Software defect prediction: Do different classifiers find the same defects?” Software Quality Journal, vol. 26, no. 2, pp. 525–552, 2018. [Google Scholar]
68. M. J. Manasa, S. Usha, D. Sivakumar, K. Janaki and T. Kamalraj, “Recommendation-based sales performance improvement for business perspective via classification model,” Journal of Contemporary Issues in Business and Government, vol. 27, no. 3, pp. 1877–1892, 2021. [Google Scholar]
69. R. Surendran, O. Khalaf and C. Romero, “Deep learning based intelligent industrial fault diagnosis model,” CMC-Computers, Materials & Continua, vol. 70, no. 3, pp. 6323–6338, 2022. [Google Scholar]
70. H. Ji, S. Oh, J. Kim, S. Choi and E. Park, “Integrating deep learning and machine translation for understanding unrefined languages,” CMC-Computers Materials & Continua, vol. 70, no. 1, pp. 669–678, 2022. [Google Scholar]
Cite This Article
 Copyright © 2023 The Author(s). Published by Tech Science Press.
This work is licensed under a Creative Commons Attribution 4.0 International License , which permits unrestricted use, distribution, and reproduction in any medium, provided the original work is properly cited.
 Downloads
 Citation Tools