
 Submit a Paper
 Propose a Special lssue
 Open Access
ARTICLE

Deep Learning Model Ensemble for the Accuracy of Classification Degenerative Arthritis
Department of Computer Science, Kyonggi University, Suwon, Korea
* Corresponding Author: Sang-min Lee. Email:
Computers, Materials & Continua 2023, 75(1), 1981-1994. https://doi.org/10.32604/cmc.2023.035245
Received 13 August 2022; Accepted 14 December 2022; Issue published 06 February 2023
 View Full Text
 Download PDF
Abstract
Artificial intelligence technologies are being studied to provide scientific evidence in the medical field and developed for use as diagnostic tools. This study focused on deep learning models to classify degenerative arthritis into Kellgren–Lawrence grades. Specifically, degenerative arthritis was assessed by X-ray radiographic images and classified into five classes. Subsequently, the use of various deep learning models was investigated for automating the degenerative arthritis classification process. Although research on the classification of osteoarthritis using deep learning has been conducted in previous studies, only local models have been used, and an ensemble of deep learning models has never been applied to obtain more accurate results. To address this issue, this study compared the classification performance of deep learning models, including VGGNet, DenseNet, ResNet, TinyNet, EfficientNet, MobileNet, Xception, and ViT, on a dataset commonly used for osteoarthritis classification tasks. Our experimental results verified that even without applying a separate methodology, the performance of the ensemble was comparable to that of existing studies that only used the latest deep learning model and changed the learning method. From the trained models, two ensembles were created and evaluated: weight and specialist. The weight ensemble showed an improvement in accuracy of 1%, and the proposed specialist ensemble improved accuracy, precision, recall, and F1 score by 5%, 6%, 6%, and 6%, respectively, compared with the results of prior studies.Keywords
The human body is composed of numerous joints that allow it to move. Articular cartilage, which is the most vital tissue for maintaining normal joint function, is located between the joints to prevent the bones from colliding. The cartilage is indispensable for body movement and is one of the largest and most complex joints in the body. Cartilage is consistently used in everyday life, thus natural wear and tear during childhood, adolescence and old age can lead to symptoms based on a variety of causes; and physical-contact athletes, as well as age, are at increased risk of cartilage rupture. Activity and age are common causes, and degenerative arthritis (also known as osteoarthritis) may occur based on a combination of additional factors, including family history, obesity, diabetes, synovitis, systemic inflammatory mediators, innate immunity, lower body alignment, joint shape, and inflammation due to dysplasia, trauma and metabolic syndrome. It is the most common joint disease that can occur in anyone, and it is a major cause of disability worldwide, and the number of people suffering from the disease will continue to grow owing to aging populations and increased obesity. These causes can be divided into correctable and uncorrectable causes. Among the modifiable factors, the most common symptom is obesity, with 1 pound (0.45 kg) of weight applying 2 to 4 pounds (0.9 to 1.8 kg) to the knee, and excessive body weight increases joint loading causing detrimental and adverse effects on the weight-bearing joints. Uncorrectable causes include genetic variants and congenital factors, and the most common risk factor is age. In Korea, more than 80% of patients over the age of 55 or almost all patients over the age of 75 are diagnosed with osteoarthritis of the knee through radiographic examination, as shown in Fig. 1. The diagnosis is based on the visual changes shown in Fig. 2, such as localized articular cartilage and joint deformity, and is based on the patient's opinion of chronic pain, stiffness, and limited range of movement of the joint. If the cartilage suffers from severe wear and tear, it will cease to function normally, necessitating surgical or nonsurgical treatment. Nonsurgical treatment includes methods such as physical therapy, exercise therapy, and medication. Surgical treatments, such as knee osteotomy and artificial joint replacement, are performed in cases in which the pain is too severe to maintain the lifestyle, the pain does not improve even after six months of nonsurgical treatment, the structural deformation or instability of the joint is severe, or restrictions in range of motion are severe. However, there is a risk of infection during surgical treatment, which could necessitate re-surgery. Particularly in the case of artificial joint replacement treatment, as shown in Fig. 3, side effects, such as pain and functional failure, may be accompanied by structural instability after treatment. Owing to the limitations of surgical treatment, it is less burdensome to seek improvement through nonsurgical treatment with low side effects, and accurate diagnosis of arthritis is critical for early treatment to prevent surgical treatment. However, owing to the significant cost and time required to receive a diagnosis and a doctor’s opinion through the simple X-ray imaging process, most patients often go to the hospital only after a severe course and when everyday life is not possible. The scientific and logical evidence for the diagnosis and treatment of knee osteoarthritis is therefore increased, and evidence for standardized diagnostic and treatment methods that can be used in clinical settings must be performed [1–4].
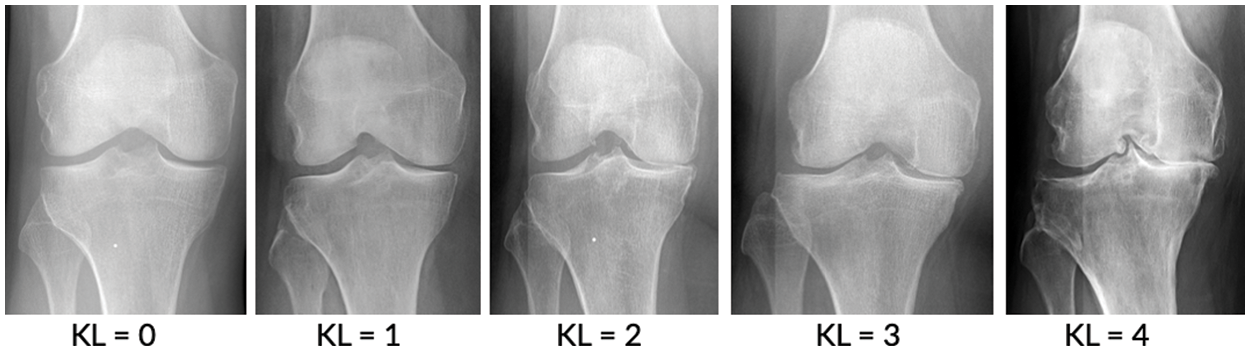
Figure 1: Stage of knee osteoarthritis [7]
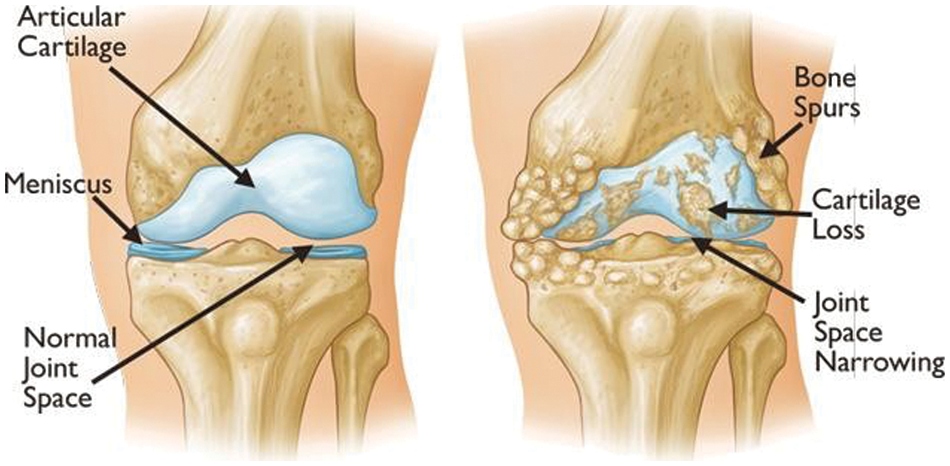
Figure 2: Examples of visual symptoms that may appear during the onset of knee OA [1]
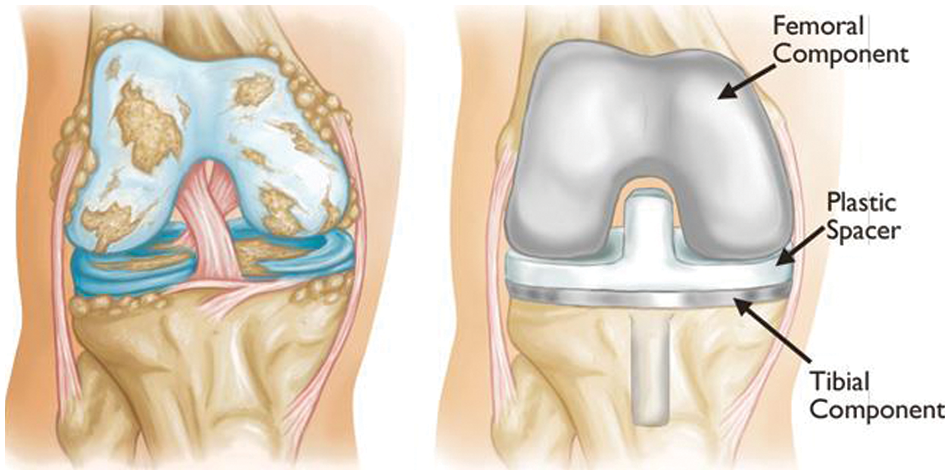
Figure 3: Example of knee artificial joint replacement [1]
To apply deep learning to the actual medical world, it is necessary to show considerable accuracy, and scientific and logical evidence is required in the diagnosis process. Deep learning models for segmenting lesion areas or classifying lesion grades using X-ray images have been popularly adopted not only for degenerative arthritis problems but also for other problems, such as tuberculosis diagnosis [4]. Currently, research into medical artificial intelligence is actively being conducted. It is expected that through the various standardized diagnosis methods proposed in studies [5,6], doctors will be able to use more objective indicators to make faster and more accurate diagnoses. Therefore, if more accurate predictions can be made, deep learning can be used to prevent disease caused by degenerative arthritis. The existing procedure for diagnosing osteoarthritis is to first take radiographic images, as shown in Fig. 1, and then to consider the resulting images, which show the gradual reduction of joint spacing and deepening shadows of the bones under the cartilage. Furthermore, a questionnaire is administered to patients when determining the grade of osteoarthritis. Because this procedure allows for the diagnosis of osteoarthritis based on visual changes similar to those shown in Fig. 2, studies have been widely conducted to determine the grade of osteoarthritis using accumulated knee radiology images to train a deep learning model. Although deep learning models based on these visual changes enable information transfer to objective indicators, extensive research has been performed to improve the accuracy of osteoarthritis classification, which is necessary for practical use.
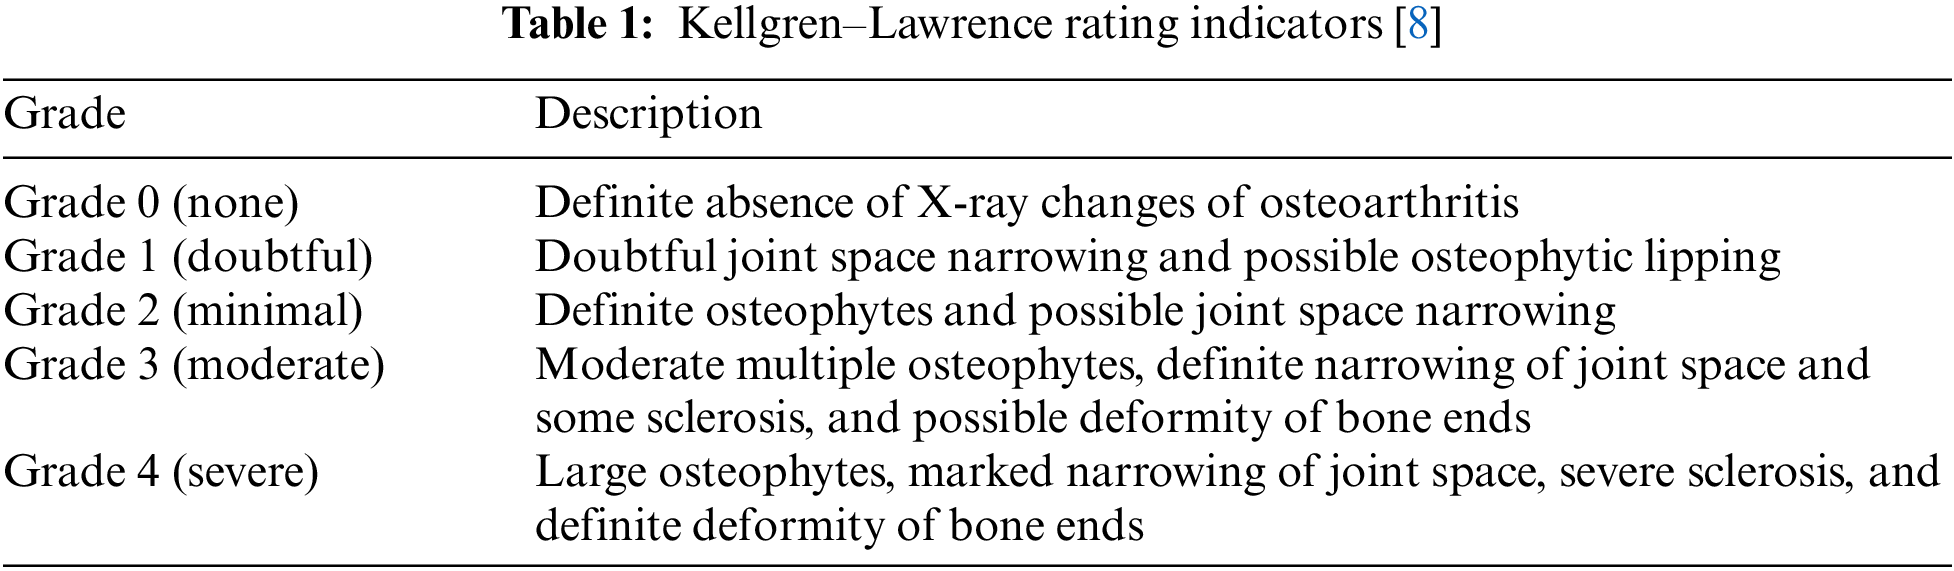
This study focused on degenerative arthritis, and the Kellgren–Lawrence (K–L) grade, which is the most commonly used grade classification index for degenerative arthritis diagnosis according to cartilage wear in the knee joint, was used as a reference. The K–L grade is divided into five classes, as shown in Fig. 1 and Table 1.
To increase the accuracy in the classification of degenerative arthritis, the accuracies of deep learning models used in previous studies and those of recent models that were not used in previous studies were first compared. Then, the models with the highest accuracy for each class were selected as the specialist models for that class and combined to create an ensemble model to improve the classification performance.
Much research using deep learning is being conducted in the medical field. Deep learning models tend to expand the size of the model on an ongoing basis, such as increasing the number of parameters or adding depth to achieve higher accuracy. The Visual Geometry Group Network (VGGNet) [9] claims that the accuracy of the image classification area can be increased by further stacking layers and has conducted a study to increase the depth of the model over conventional studies. It was the best performance at the time when it came in second place with ILSVC’14. However, if the depth of the layer becomes more than 20 layers, a degradation problem occurs. To overcome this problem, the Residual Neural Network (ResNet) [10] was developed to allow learning even if the depth of the model deepens through the concept of residual learning. By extending the depth of the model to 152 floors, they won the image classification competitions ILSVRC’15 and COCO’15. This is the first AI model to surpass human accuracy. Densely Connected Convolutional Networks (DenseNet) [11] is composed of deep networks for high performance such as 121 layers and 161 layers similar to ResNet. By concatenating the feature maps of all layers and concatenating the feature maps of the previous layer to the feature maps of all subsequent layers, it showed better performance with fewer parameters than ResNet. The size of these deep learning models increases the amount of training proportionally, which increases the learning time. This increase in learning cost increases energy consumption, which can be sacrificed if there is a significant improvement in accuracy. However, the accuracy of the existing method was only about 70%, and the performance was not significantly improved when using the deep network model. In this way, it was also difficult to re-train models in limited environments or with increasing additional training data if the learning costs were high. To improve the way these deep networks learn, deep learning models have been actively studied to reduce the capacity of the models and to make efficient use of parameters, and MobileNet has contributed significantly to the field. In addition, research on ways to optimize models, such as pruning, is being actively conducted [12,13].
The high accuracy of deep learning models requires much data, and as Table 3 shows, the total data is 8,260, which is significantly less than the data used by other deep learning models. To address this problem, random small changes are applied to the training data in the original to generate new learning data and use it for training to solve the learning data shortage. The data used in this study were obtained from a previous study using the You Only Look Once-V2 (Yolo-V2) model for radiographic joint detection, detecting cartilage in radiographic images and cutting out only the joint portion from radiographic images of the knee to obtain a knee osteoarthritis dataset. For classification of the produced dataset, performance comparison between models including ResNet, VGGNet, DenseNet, and InceptionV3 was conducted, and the results showed that the VGG19 model provided the best performance, with an accuracy of 69.69% on the test images [14,15].
In previous model loss optimization studies, the originality of the K–L grading was maintained by using DenseNet161 and adding an ordinary regression module (ORM) for optimization of the error back-propagation process; thus, the model loss was minimized while the model was optimized. To verify this, a comparison of VGGNet, ResNet DenseNet, ResNeXt, and Inception-V1 was conducted, and the best accuracy was achieved by the model developed by grafting DenseNet161 + ORM. This showed that using DenseNet161 + ORM for degenerative osteoarthritis classification problems is effective [16].
In previous studies for optimal model development, a fully connected network as used for detection in a study on reducing parameters, and a classification model most suitable for knee osteoarthritis classification with approximately 540,000 parameters was developed through an analysis of the number of convolution layers and other parameters. The model performance after training was approximately 63.5% [17].
In a study that used data augmentation and lightweight models, the DenseNet model with an architecture that learned only small portions of the entire image was predicted to show robust performance on the K–L grade classification problem. First, DenseNet-169 and Inception-V3 models were used for training, but the Inception-V3 model was excluded due to poor performance. ImageNet was used for pre-training of the DenseNet-169 model to solve the problem of lack of training data. Cropping, upscaling, adding noise, flipping, and randomizing contrast were successively applied to 80% of the training data, and only cropping was applied to the remaining 20%. Training based on augmented data showed performance above 71%. Given that the accuracy of radiologists on the same test dataset was above 61%, the study verified that the accuracy of the deep learning model exceeded that of radiologists in osteoarthritis grade diagnosis [18].
In a study using the attention module, the high-resolution network (HRNet) was utilized as the backbone network to maintain the high-resolution features of images and improve the classification performance. Subsequently, the osteoarthritis high-resolution network (OsteoHRNet) was proposed, in which a convolutional block attention module was integrated into the trained HRNet to improve its prediction results. The performances of VGG19 [7] used in previous studies and the proposed OsteoHRNet were visualized using gradient-weighted class activation maps. The study found that the VGG19 model tends to focus on the overall knee. The proposed model showed that joint space stenosis and Golgi lipids were well identified, and OsteoHRNet achieved state-of-the-art classification accuracy of 71.74% [19].
Various studies have been conducted to improve accuracy through data processing and techniques that efficiently use the parameters of deep learning models, such as model loss optimization, optimal model development, data expansion and lightweight models, using attention modules, etc. In previous studies involving models, image classification performance was primarily compared using ResNet, VGGNet, and DenseNet, and was selectively applied to a few models rather than to a variety of models. In a recent deep learning study, a variety of models, such as lighter-weight models that can learn more efficiently than traditional deep learning models or transformer-based models, reportedly performed well in the area of computer vision. There is a caveat in that the models used by the authors showed the best performance because they did not use the most recent research models or a variety of models and only some models were used. This study compared the performance of MobileNet, which significantly impacted lightweight deep learning models, with the latest deep learning models such as Xception, TinyNet, and Vision in Transformer (ViT), which have been effective in the latest vision applications.
Xception has an efficient convolutional layer called a depthwise separable convolution, which reduces the calculation volume to approximately 1/9 of the typical convolutional network model calculations, allowing the training rate to be nine times faster. A depthwise separable convolution enables filtering of each channel to extract the spatial features [20]. MobileNet provides a lightweight structure that can operate on mobile devices or applications using a depth-separable convolutional structure. Its structure has been improved up to version 3, and further research is still actively underway [21,22]. TinyNet achieved a deep neural network with minimal model size and calculation cost through improvements in EfficientNet, while TinyNet-E achieved 59.9% top-1 accuracy with only 24M FLOP, which claims to be about 1.9% higher than the previous best MobileNetV3 with similar calculation costs [23]. In addition, an accuracy comparison experiment was conducted to check the accuracy of the ViT model, which has recently become the focus of transformer-based techniques in computer vision research, in the classification of degenerative osteoarthritis.
The data used in the experiments were those prepared in previous studies: KneeXray [10], a dataset commonly used for osteoarthritis classification problems (see Table 2 for details), was used.
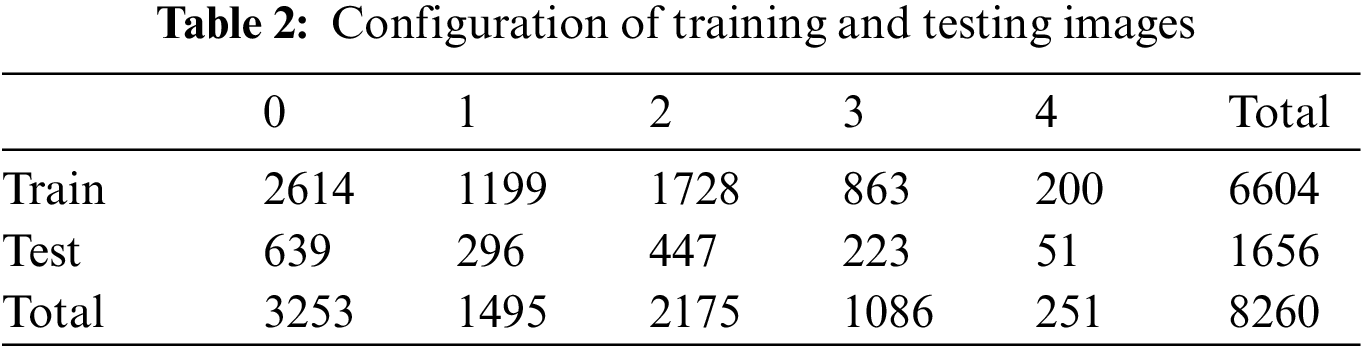
A total of 8,260 data instances were initially available, with 6,604 for training and 1,656 for testing. However, the amount of training data was considered insufficient. To overcome this, techniques to increase the amount of data are used, such as data augmentation. However, in such cases, it is difficult to objectify the accuracy and compare the performance of the deep learning model because of the randomness of the dataset. Therefore, data augmentation techniques were not applied in this study, and overcoming the problem of data shortage was attempted through training methods. The training methods are described in Section 4.
In the overall experimental process, the data were first divided into five sets in equal proportions and training conducted five times with a different set of validation data for the same model. After obtaining a generalized model through the average ensemble of the predicted values of the five models obtained from these results, the model with the highest accuracy among each class was selected. Using these five selected models, three different ensembles were created, and the accuracy was evaluated according to the ensemble method.
The size of the training images used was 224 × 224 × 3, and training was conducted on a computer running Ubuntu 18.04, with the PyTorch 1.7.1 + cu110 library and an Nvidia GeForce RTX3090 GPU. In general, designing a new model in the field of image classification is very difficult. The reason is that it is not possible to efficiently upgrade the model by simply adding and pasting more layers, and it is not usually possible to configure a batch size in a hundred units without sufficient hardware resources to use a 224 × 224 image input size. Reducing the batch size means that it takes days to learn a model, which makes the research and development process too long. Therefore, in the image classification field, excellent models that have already been developed are mainly imported and used. Because the Timm library provides an excellent model that has already been pre-trained, performance comparison experiments between models were conducted using the Timm 0.6.7 version library. The sklearn 0.23.2 version library was used to represent the performance evaluation index of the models conveniently and accurately. Further, the performance comparison was performed for each model using the same specific experimental method, and training was conducted using the five-fold cross-validation method to overcome the insufficiency of the training data. Through this method, all data were used for training without designating separate validation data, and each model was trained five times with five different validation datasets; then, the test was conducted.
The above process was conducted to average the differences in performance when the model was trained and to understand the objective model performance through performance generalization. The data were divided into batch sizes of 32 and processed for 100 epochs. Early stops were applied during the learning process to stop learning if there was no change or improvement in the validation loss for 20 epochs. This is because observations made during various experiments show that over-fitting occurs when there is no change in learning rates of 20 epochs or more.
F1 scores were used as a metric for the model's learning process. Simple accuracy was not used as a metric because the data were severely imbalanced; thus, the evaluation was conducted using the F1 score. If learning is carried out only with the data one has to solve the problem of degenerative arthritis classification, issues like over-fitting or poor learning may occur therefore transfer learning was performed to avoid this. In transfer learning, weights are adjusted by taking the weights of the trained model to solve other problems and applying them to the problem to be solved. Even with a small dataset, it is much more accurate and faster than learning without transfer learning. ImageNet was used to do this transfer learning, and to reduce the variation between ImageNet and KneeXray, normalization (mean = [0.485, 0.456, 0.406], std = [0.229, 0.224, 0.225]) was performed and AdamW (learning rate = 1e−4; weight_decay = 1e−3) was used as the optimization function.
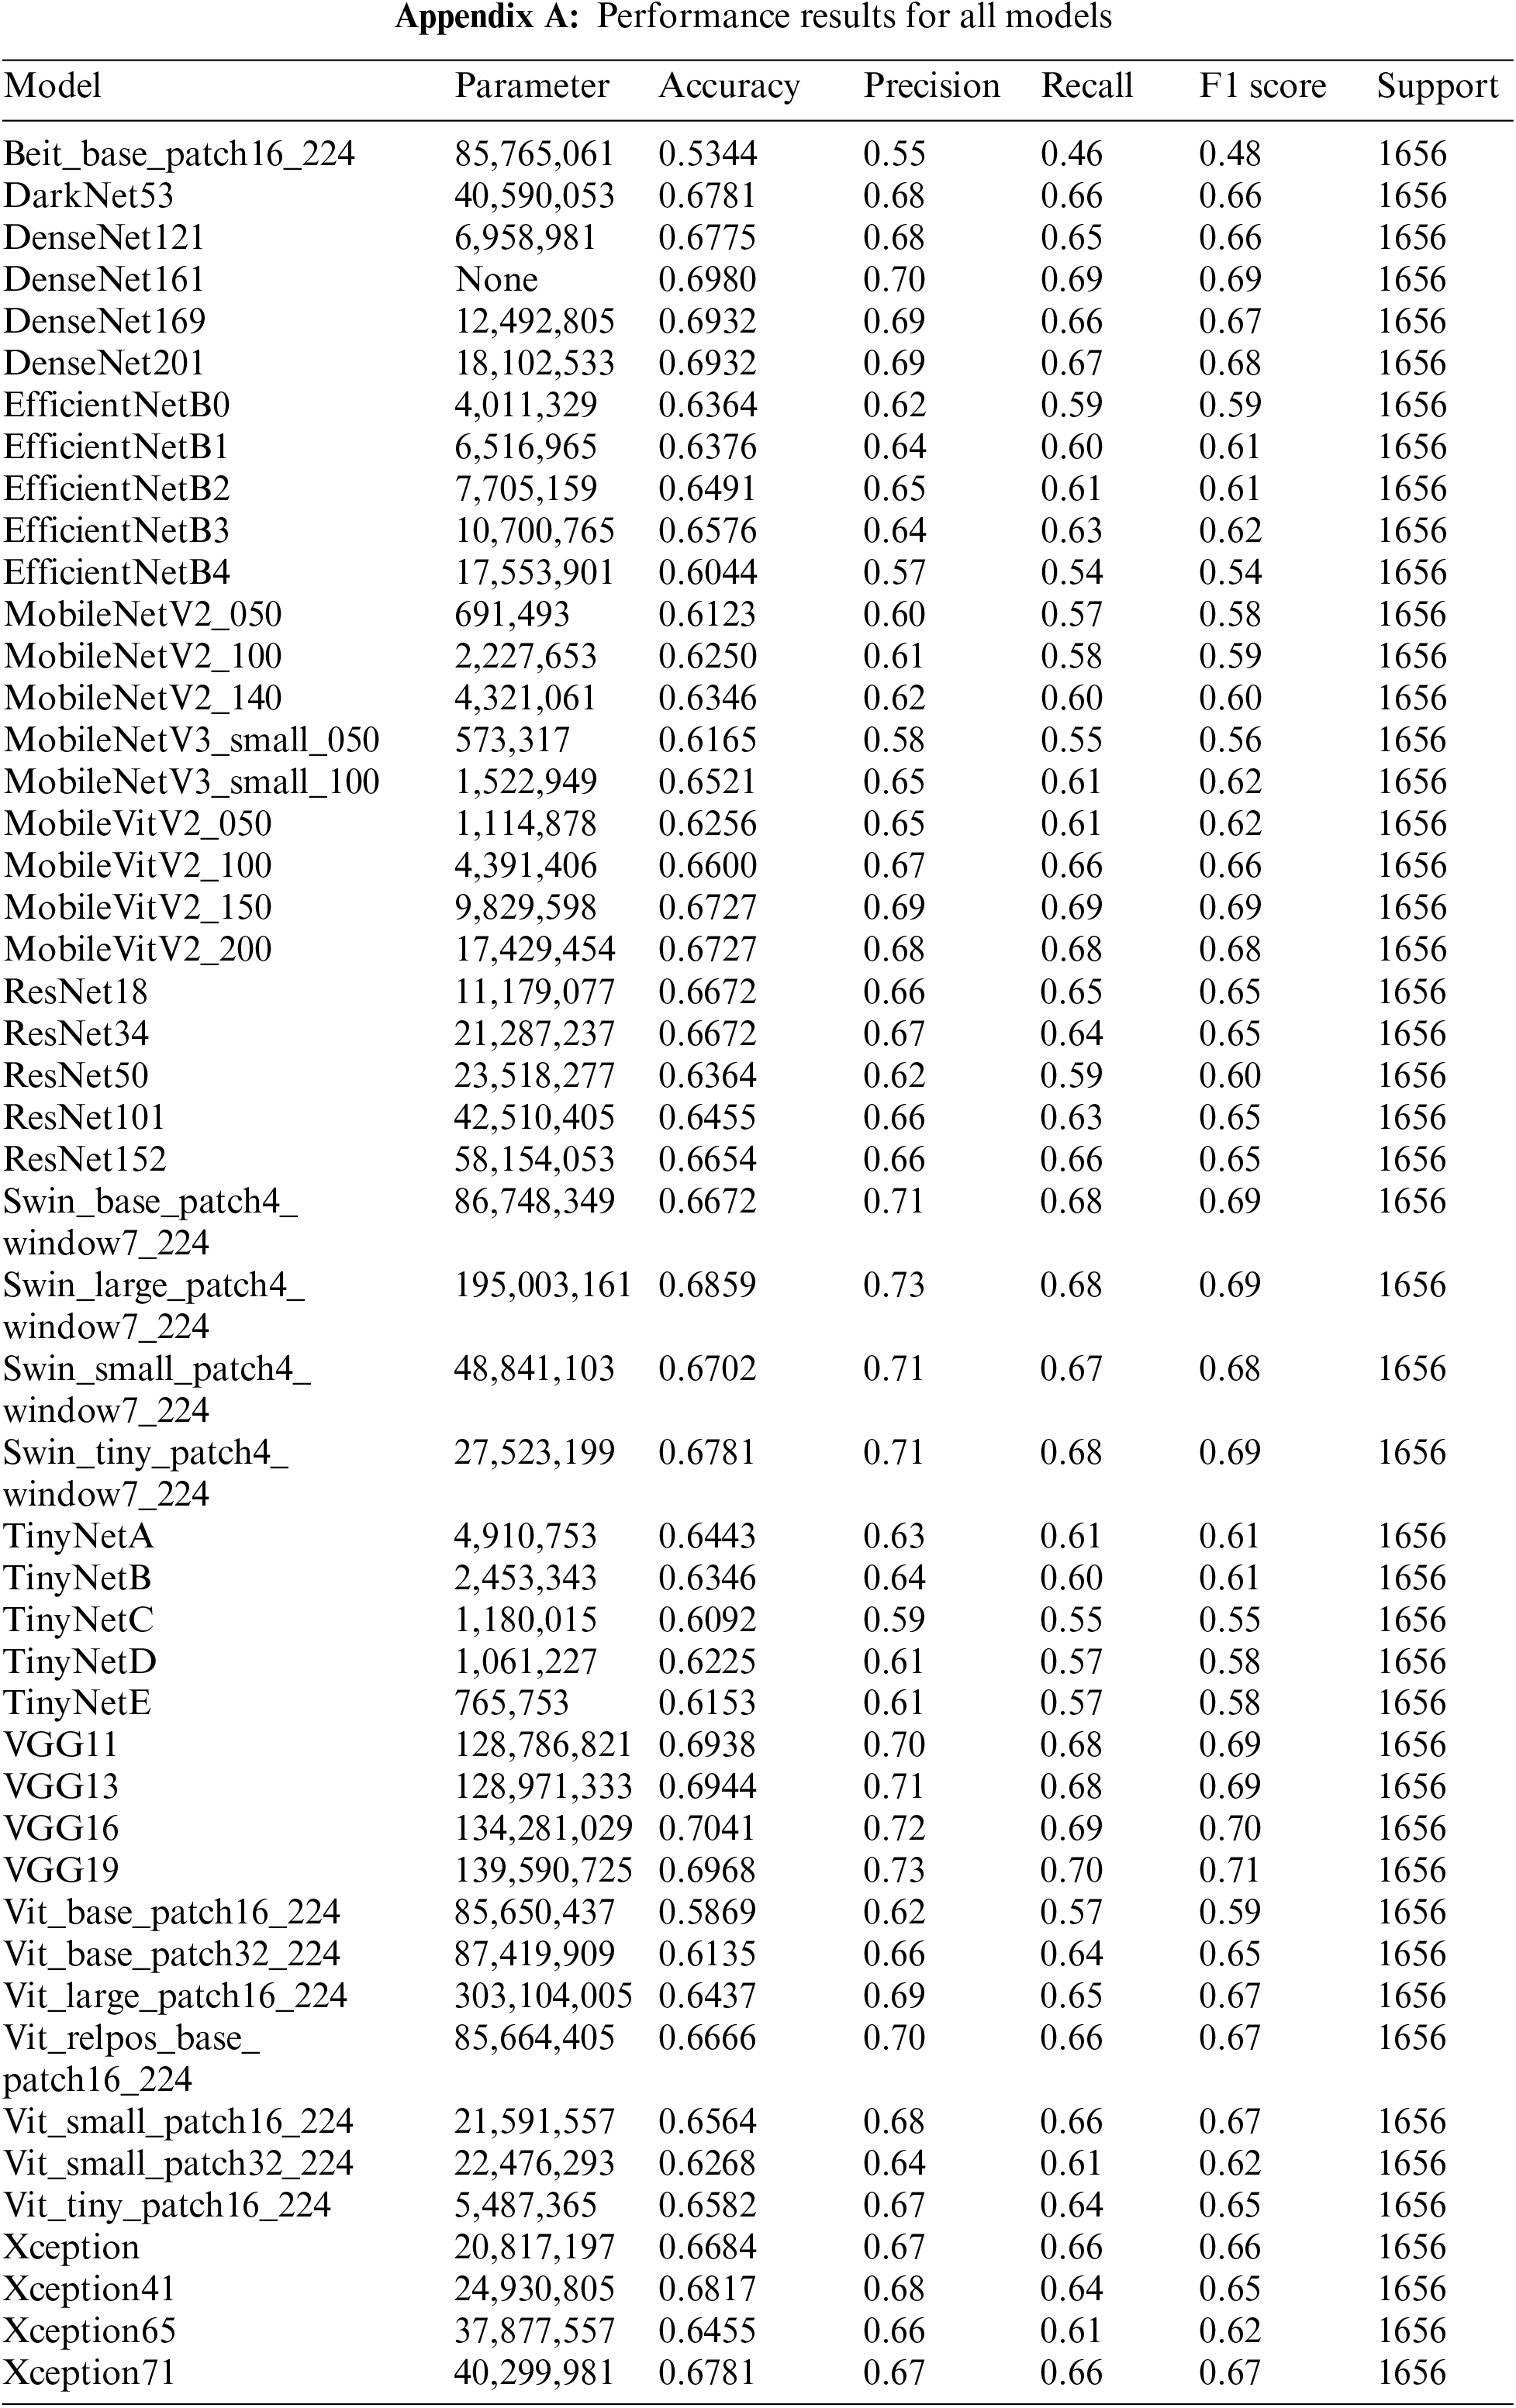
The results of the performance evaluation experiment for the individual models are shown in Appendix A. VGG19 did not employ any model optimization, data enhancement, or methodology, but the single model produced performance comparable to OsteoHRNet. The VGG19-ordinal, which has a separate methodology, and the VGG19, which has only a change in learning methods, used the same model, but better performance by the VGG19 model was observed through only a change in the learning methods. It has been proven that the accuracy can be increased only by improving the model, rather than applying a separate methodology to the degenerative arthritis classification problem. It can also be seen that the performance of DenseNet161 without applying the methodology is slightly lower than the accuracy of the ORM + DenseNet161 study using the same model, which suggests that the method of optimizing model loss is significant during the learning process.
This study aimed to achieve higher accuracy than the existing accuracy. After observing the experiment results of each model, it was clear that each model had strengths. To exploit these strengths, two ensemble methods were applied. The two ensembles were compared by applying weight ensemble and the suggested specialist ensemble. To do this, the most accurate model was selected from each class and utilized in the ensemble based on the results obtained through the experiment. The selection of the most accurate models for each class was tested with a confusion matrix drawing and validation of the accuracy of each model. As a result, the accuracy of the most accurate models for each class is shown in Table 3. Classes except for Classes 1 and 2 show accuracies of 80% or higher. Fig. 4 visualizes the process, and the results are shown in Figs. 5, 6. Appendix A shows the performance of each model for model selection, and the model for each class was selected based on the experimental results.
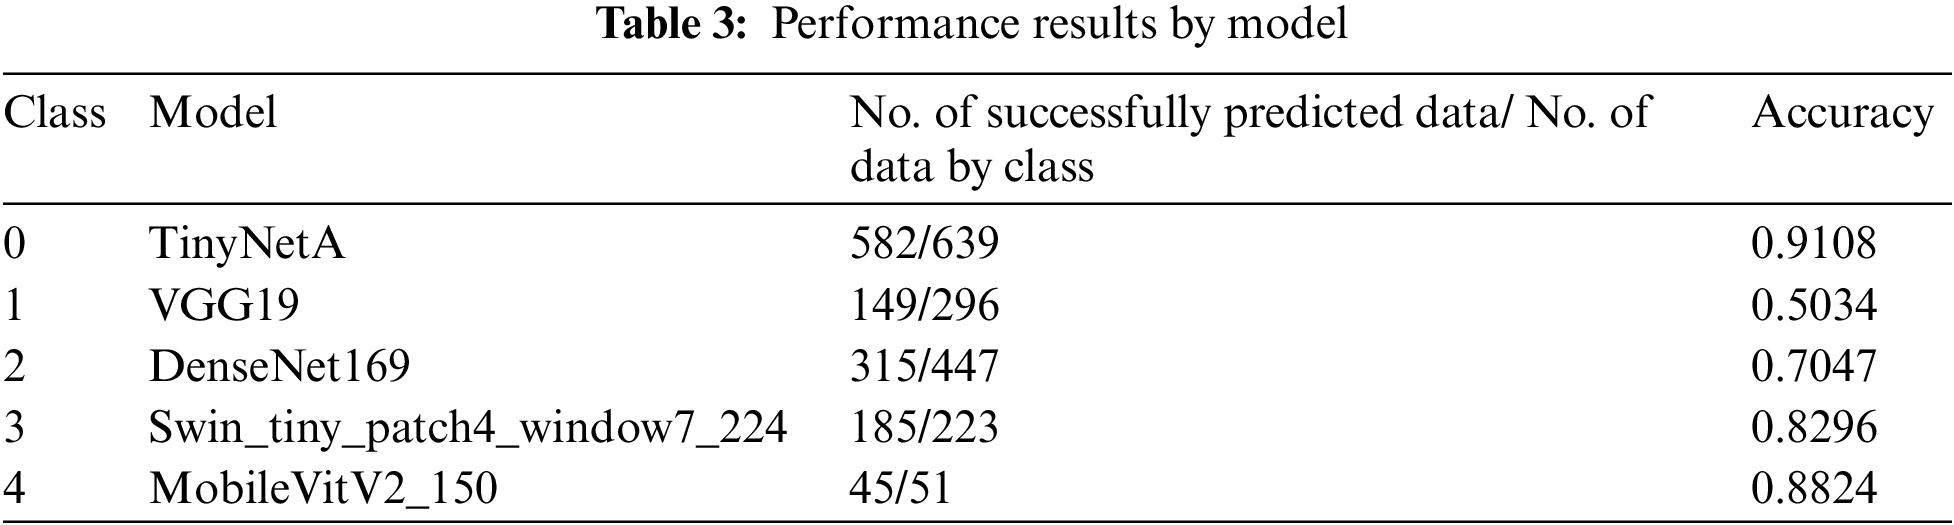
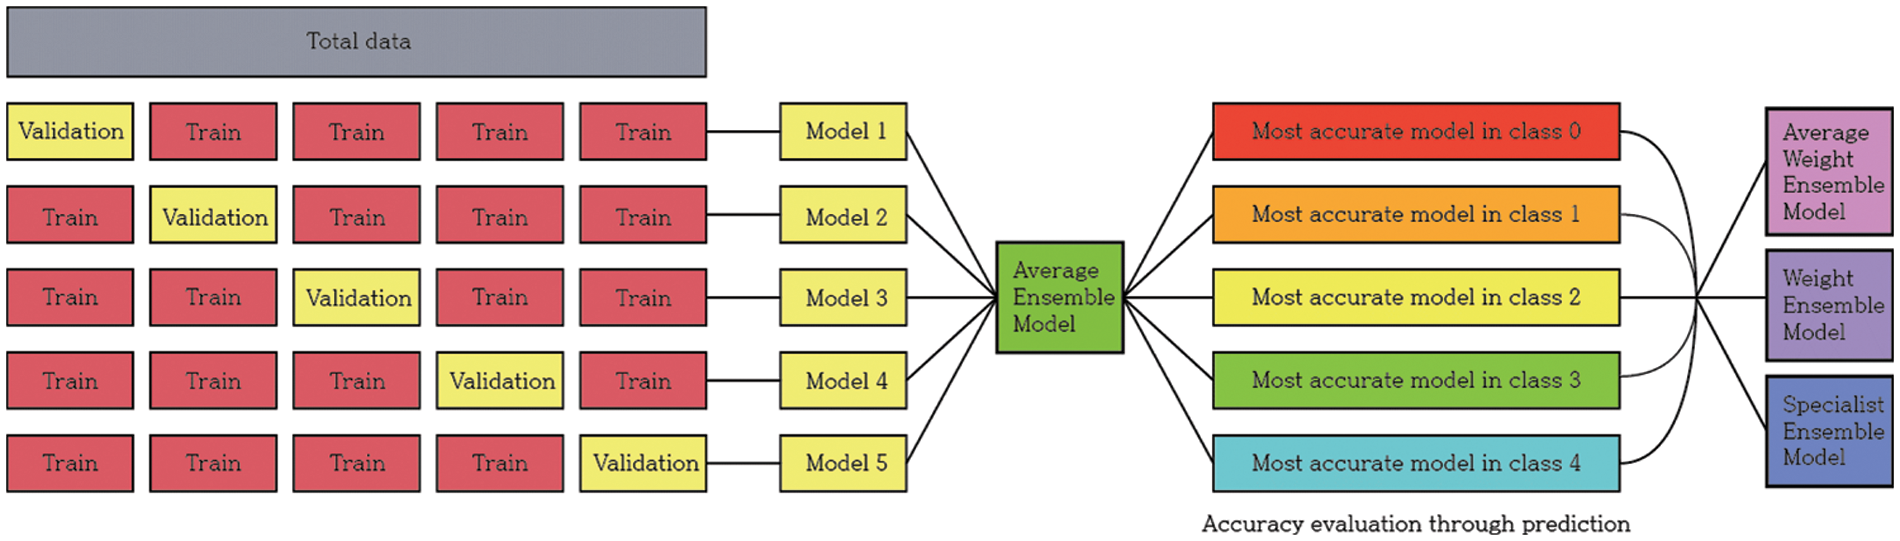
Figure 4: Model training and selection process
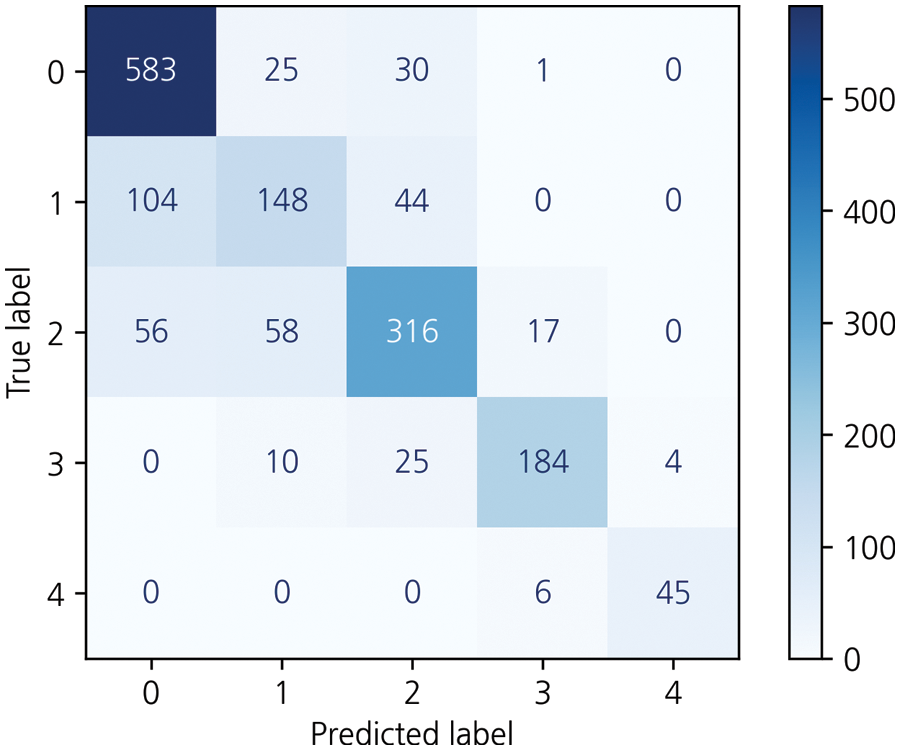
Figure 5: Results for the specialist ensemble model on the KneeXray dataset
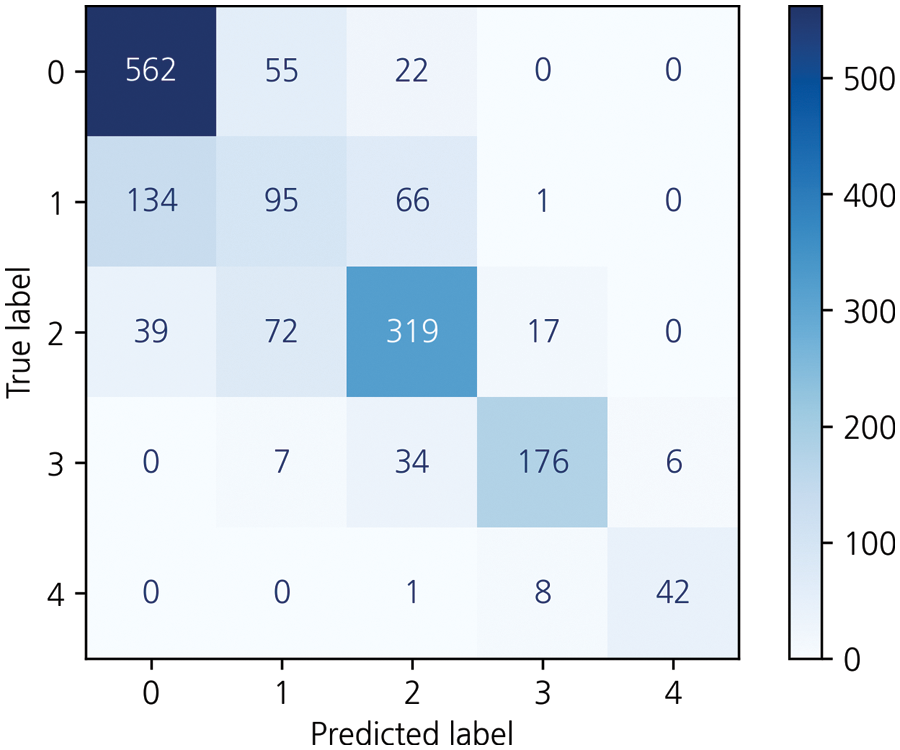
Figure 6: Results for the weighted ensemble model on the KneeXray dataset
For models with the highest accuracy for each class, the weight averaging ensemble adds all the predicted values of the models shown in Table 3 and is divided by the number of models to obtain one predicted value. Deviations can be corrected through another model, thus completing a generalized model. The result of this is that the performance of the model with the highest accuracy in each class was degraded, achieving 71.4% accuracy. Weight Averaging ensemble can be said to have listened to everyone's opinions fairly because the predicted value was divided by the number of models. However, it did not show good performance. To better reflect the opinion of models with higher accuracy, the weight ensemble was performed by assigning different weights according to the accuracy: 0.95 for VGG19, 2.1 for DenseNet161, 1.15 for VGG16, 0.35 for Swin_large_patch4_window7_224, 0.95 for DenseNet201, 0.535 for pred_mobilevitv2_150, and 0.1 for TinyNetA. Subsequently, as a result of the different weights for each model, the accuracy was approximately 72.8%. Fig. 6 shows the corresponding results.
Then, to obtain a more efficient ensemble, the ensemble in this study was weighted to give more weight to the probability distribution value of the model with the highest accuracy for each class. This method applies more weight to the opinions of experts in each of the five grades, using five professional models to predict five classes and has been applied based on overall effective classification performance [24]. Consequently, an accuracy of 77.05% was achieved. Table 4, Fig. 5 shows the comparison results of the proposed and previous models; the accuracy was improved by about 6% and the F1 score was improved by 0.06.
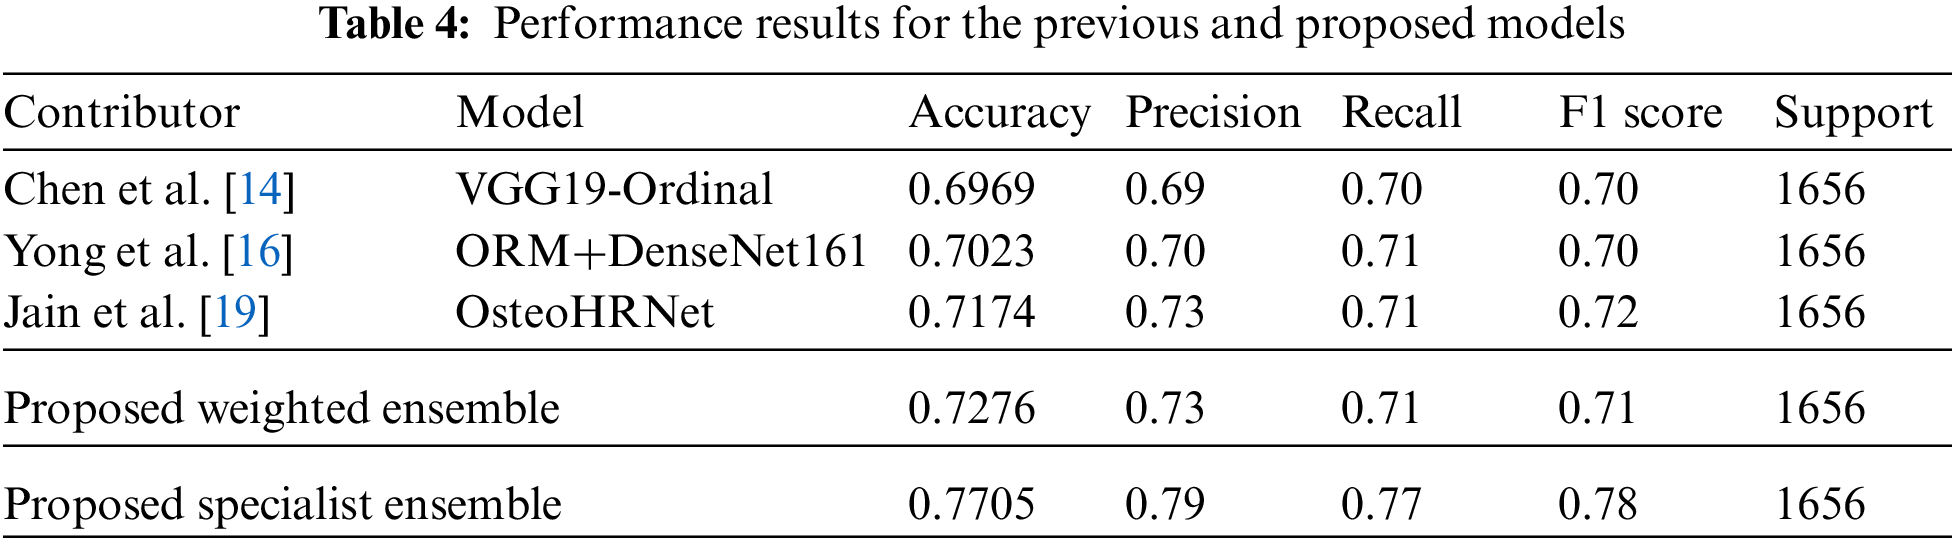
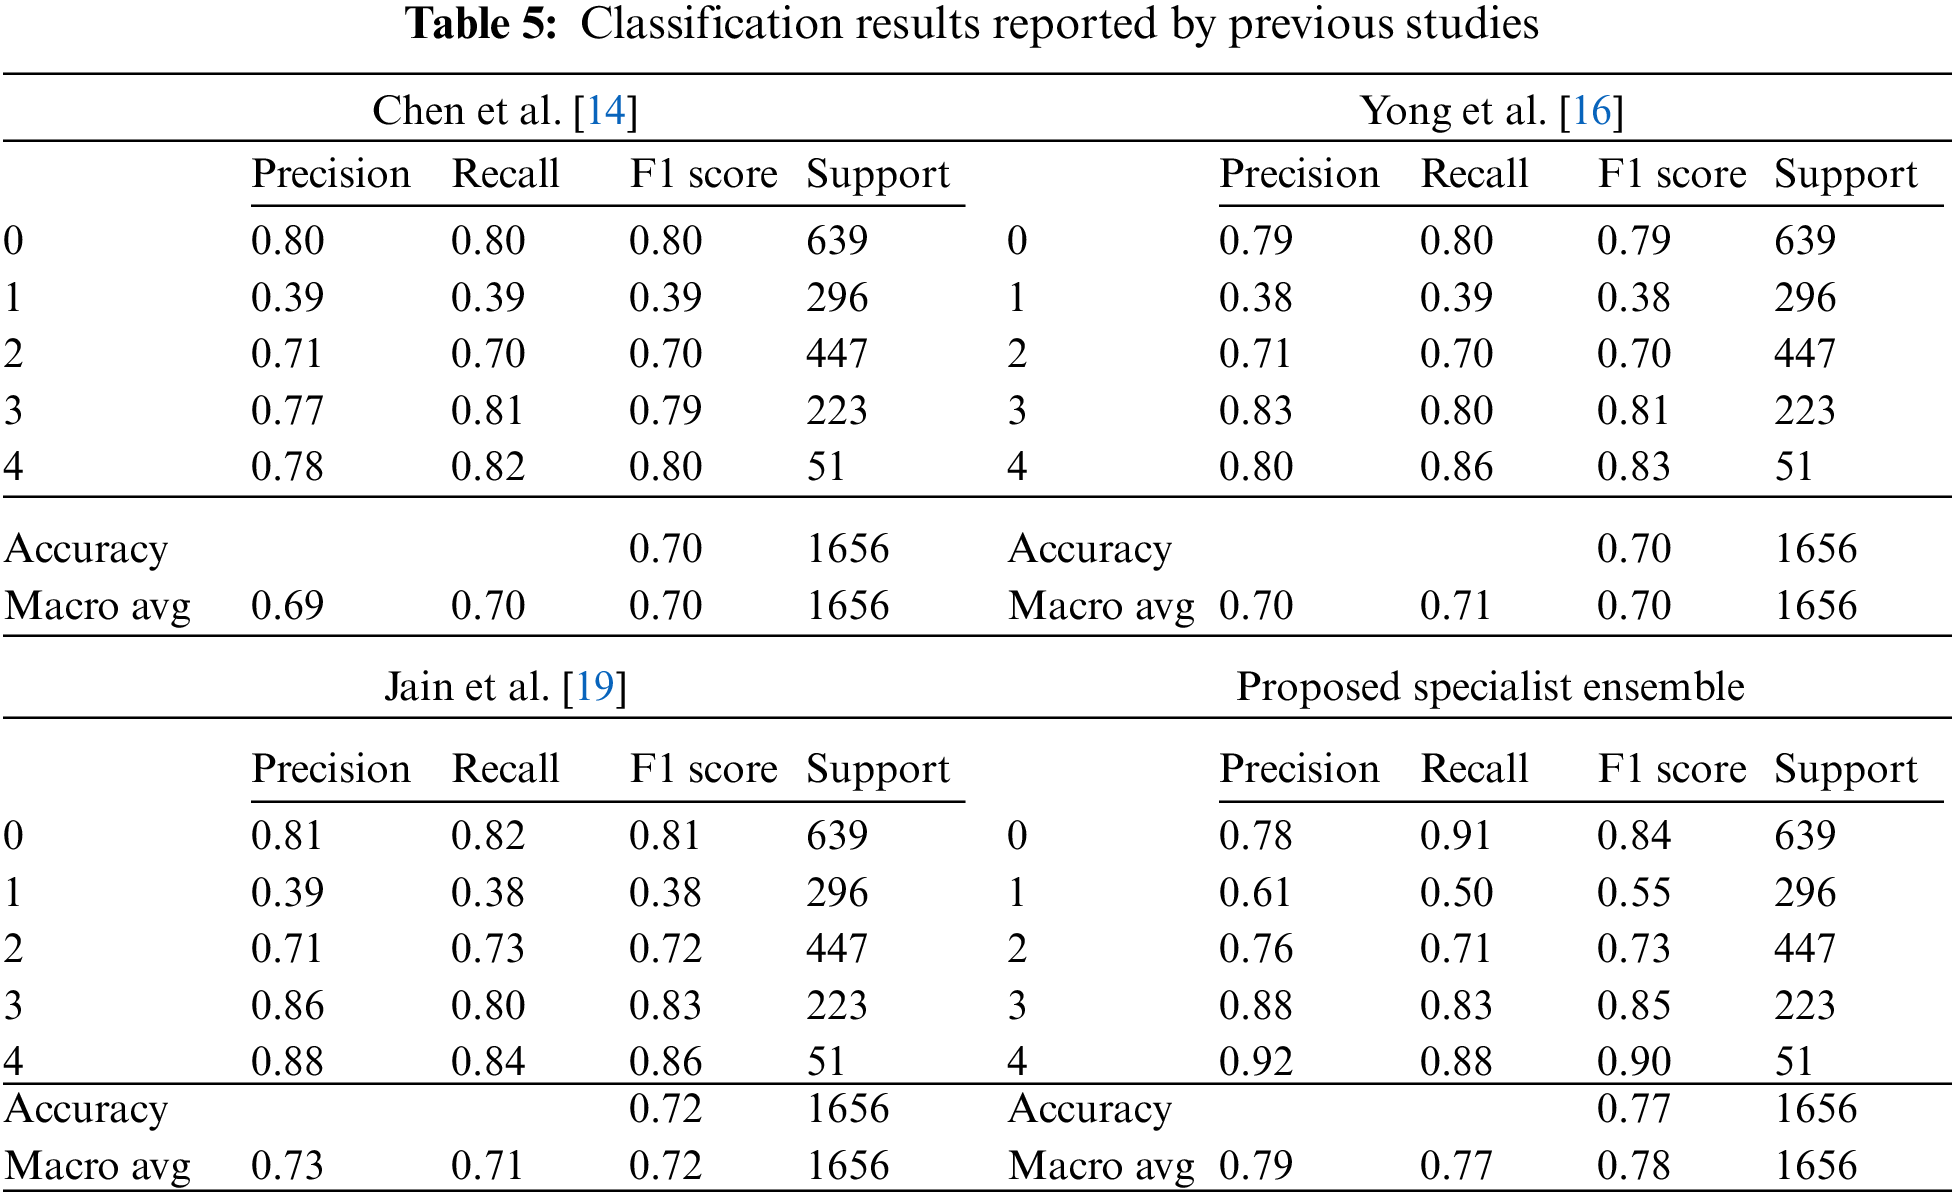
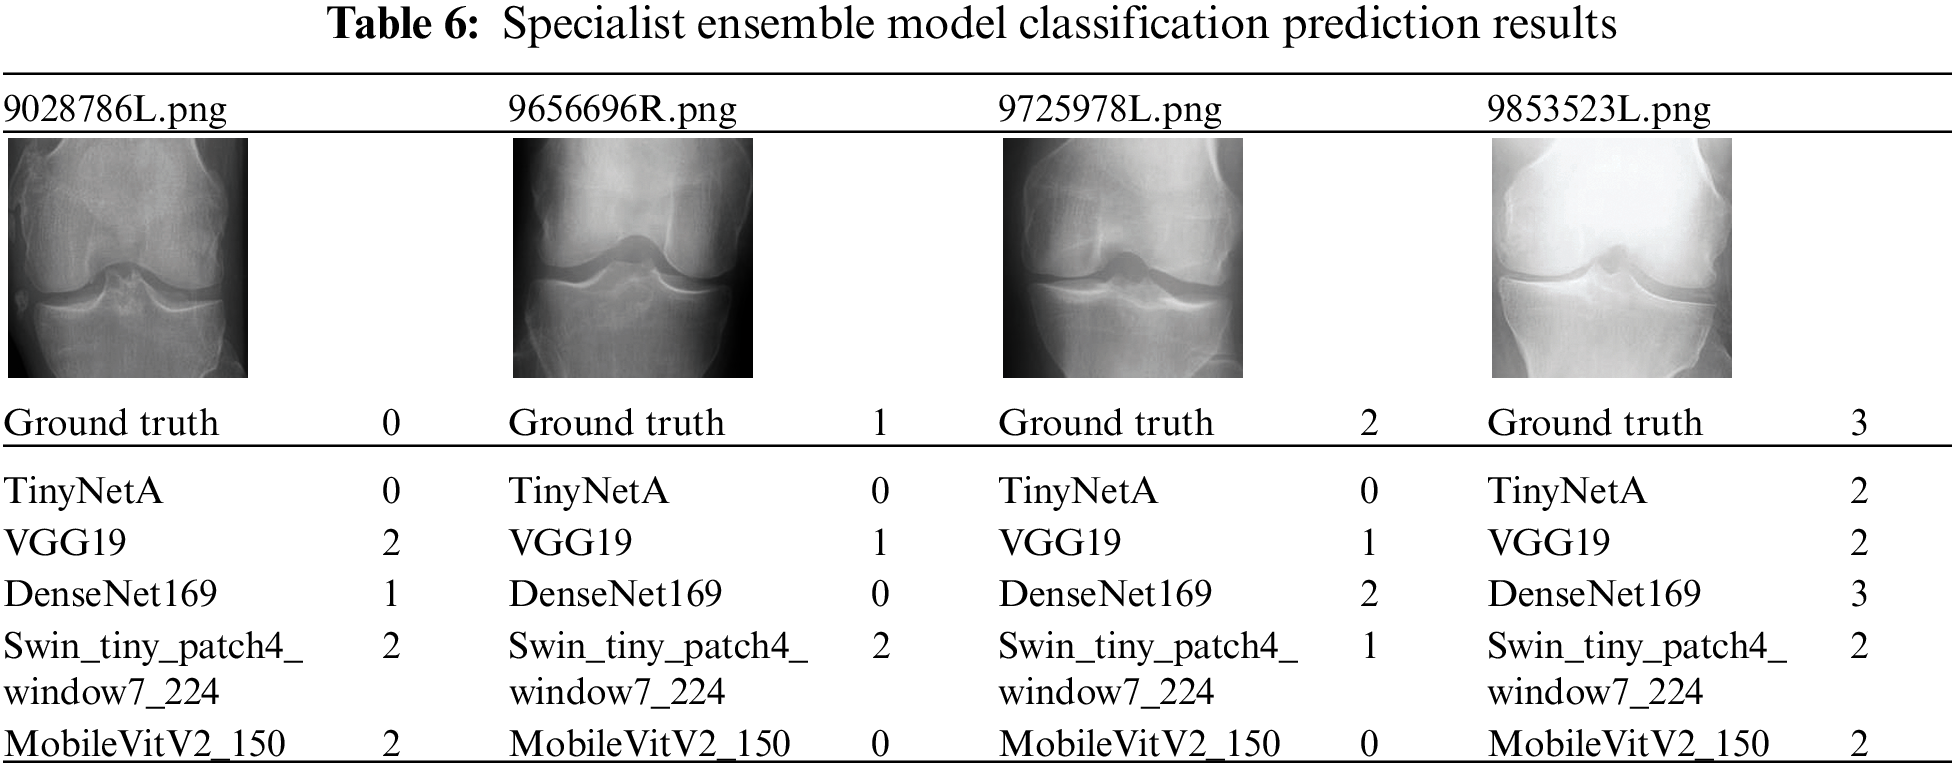
The data for a more detailed model comparison with previous studies are presented in Table 5, where the scores corresponding to each class and the average scores are compared. Table 6 shows a representative image of the specialist model of each class. The results show that the accuracy is reduced when the average ensemble is applied.
In this study, to find a more effective deep learning model for degenerative arthritis classification, experiments were conducted to compare the accuracy of various deep learning models, including those used in previous studies and recently studied classification models. Training was conducted using empirically proven methods in deep learning. Through the experiments, it was shown that deep learning models other than those corresponding to ResNet, DenseNet, and VGGNet can also be effectively used for classification. As a result, previous studies have often suggested model improvements or new methodologies. However, as no noticeable performance gains were observed in this study, the latest deep learning models were applied to degenerative arthritis, without applying a separate methodology and with greater accuracy. In previous studies, multiple learning methods were used to solve the data problem that was lacking, and the system did not apply random learning methods such as data augmentation to assess the objective performance of the model. In an experiment, the performance of pure models without the methodology of the previous study was evaluated. The results showed that some of the newer models have similar performance. Consequently, a weighted ensemble combination and a new ensemble method were proposed to take advantage of these models. The trained models listed in Appendix A were used for the weight ensemble; several combinations were tested to obtain the most appropriate weight ensemble model. The weight ensemble showed 72.8% accuracy in the overall test data, which is an improvement of about 1% over the traditional SOTA performance. In addition, the proposed specialist ensemble method provided accurate numerical data, as shown in Table 6. By applying the specialist ensemble, the results of the previous SOTA performance improved in terms of accuracy, precision, recall, and F1 scores by 0.0531, 0.06, 0.06, and 0.06, respectively. This shows that the proposed specialist ensemble is effective in the degenerative arthritis problem and may be more accurate in the future with further improvements in specialist ensemble models, performance improvements in the models used, and through data augmentation techniques.
Funding Statement: This research was conducted with the support of the Korea Research Foundation and was funded by the Ministry of Education of Korea in 2020 (No. 2020R1A6A1A03040583) and Kyonggi University’s Graduate Research Assistantship 2022.
Conflicts of Interest: The authors declare that they have no conflicts of interest to report regarding the present study.
References
1. J. R. H. Foran, “American Academy of Orthopaedic Surgeons,” Total knee replacement, 2020. [Online]. Available: https://orthoinfo.aaos.org/en/treatment/total-knee-replacement/ [Google Scholar]
2. S. Oh, E. Jang, Y. Oh, W. Kang, E. Lee et al., “An exploratory study on the reliability of degenerative knee arthritis dialectics and the correlation between knee ROM, VAS, and WOMAC,” Journal of Korean Medicine Rehabilitation, vol. 29, no. 3, pp. 113–128, 2019. [Google Scholar]
3. K. Jung, “Diagnosis and treatment of arthritis,” Journal of the Korean Neurological Association, vol. 35, no. 4, pp. 25–30, 2017. [Google Scholar]
4. J. Seo and S. Lee, “Current state of total knee arthroplasty,” Journal of the Korean Medical Association, vol. 63, no. 8, pp. 452–461, 2020. [Google Scholar]
5. J. Zhu, L. Sun, Y. Wang, S. Subramani, D. Peng et al., “A ResNet based multiscale feature extraction for classifying multi-variate medical time series,” KSII Transactions on Internet and Information Systems, vol. 16, no. 5, pp. 1431–1445, 2022. [Google Scholar]
6. X. Xu, J. Zhang, X. Cheng, L. Lu, Y. Zhao et al., “A tuberculosis detection method using attention and sparse R-CNN,” KSII Transactions on Internet and Information Systems, vol. 16, no. 7, pp. 2131–2153, 2022. [Google Scholar]
7. N. Bayramoglu, M. T. Nieminen and S. Saarakkala, “A lightweight CNN and joint shape-joint space (JS2) descriptor for radiological osteoarthritis detection,” Medical Image Understanding and Analysis, vol. 1248, pp. 331–345, 2020. [Google Scholar]
8. V. Pai and H. Knipe, “Kellgren and Lawrence system for classification of osteoarthritis,” Reference article, Radiopaedia.org, 2014. [Online]. Available: https://doi.org/10.53347/rID-27111. [Google Scholar]
9. K. Simonyan and A. Zisserman, “Very deep convolutional networks for large-scale image recognition,” arXiv preprint arXiv: 1409.1556, 2015. [Online]. Available: https://arxiv.org/abs/1409.1556. [Google Scholar]
10. K. He, X. Zhang, S. Ren and J. Sun, “Deep residual learning for image recognition,” arXiv preprint arXiv: 1512.03385, 2015. [Online]. Available: https://arxiv.org/abs/1512.03385. [Google Scholar]
11. G. Huang, Z. Liu, L. V. D. Maaten and K. Q. Weinberger, “Densely connected convolutional networks,” arXiv preprint arXiv: 1608.06993, 2018. [Online]. Available: https://arxiv.org/abs/1608.06993. [Google Scholar]
12. K. Lee and E. Kim, “Deep learning model lightweight technology analysis,” Korea Institute of Science and Technology Information, pp. 1–89, 2020. https://doi.org/10.22648/ETRI.2019.J.340205. [Google Scholar]
13. H. B. Baydargil, J. Park, D. Kang, H. Kang and K. Cho, “A parallel deep convolutional neural network for Alzheimer’s disease classification on PET/CT brain images,” KSII Transactions on Internet and Information Systems, vol. 14, no. 9, pp. 3583–3597, 2020. [Google Scholar]
14. P. Chen, L. Gao, X. Shi, K. Allen and L. Yang, “Fully automatic knee osteoarthritis severity grading using deep neural networks with a novel ordinal loss,” Computerized Medical Imaging and Graphics, vol. 75, no. 9, pp. 84–92, 2019. [Google Scholar]
15. P. Chen, “Knee osteoarthritis severity grading dataset,” Mendeley Data, vol. V1, 2018. https://doi.org/10.17632/56rmx5bjcr.1. [Google Scholar]
16. C. W. Yong, K. Teo, B. P. Murphy, Y. C. Hum, Y. K. Tee et al., “Knee osteoarthritis severity classification with ordinal regression module,” Multimedia Tools and Applications, 2021. https://doi.org/10.1007/s11042-021-10557-0. [Google Scholar]
17. J. Antony, K. McGuinness, K. Moran and N. E. O'Connor, “Automatic detection of knee joints and quantification of knee osteoarthritis severity using convolutional neural networks,” Machine Learning and Data Mining, vol. 10358, pp. 376–390, 2017. [Google Scholar]
18. K. A. Thomas, Ł. Kidziński, E. Halilaj, S. L. Fleming, G. R. Venkataraman et al., “Automated classification of radiographic knee osteoarthritis severity using deep neural networks,” Radiology: Artificial Intelligence, vol. 2, no. 22020. https://doi.org/10.1148/ryai.2020190065. [Google Scholar]
19. R. K. Jain, P. K. Sharma, S. Gaj, A. Sur and P. Ghosh, “Knee osteoarthritis severity prediction using an attentive multi-scale deep convolutional neural network,” arXiv preprint arXiv: 2106.14292, 2021. [Online]. Available: https://arxiv.org/abs/2106.14292. [Google Scholar]
20. F. Chollet, “Xception: Deep learning with depthwise separable convolutions,” in Proc. 2017 IEEE Conf. on Computer Vision and Pattern Recognition, Honolulu, HI, USA, pp. 1800–1807, 2017. [Google Scholar]
21. A. G. Howard, M. Zhu, B. Chen, D. Kalenichenko, W. Wang et al., “MobileNets: Efficient convolutional neural networks for mobile vision applications,” arXiv preprint arXiv:1704.04861, 2017. [Online]. Available: https://arxiv.org/abs/1704.04861. [Google Scholar]
22. L. Zhao and L. Wang, “A new lightweight network based on MobileNetV3,” KSII Transactions on Internet and Information Systems, vol. 16, no. 1, pp. 1–15, 2022. [Google Scholar]
23. K. Han, Y. Wang, Q. Zhang, W. Zhang, C. Xu et al., “Model Rubik’s cube: Twisting resolution, depth and width for TinyNets,” arXiv preprint arXiv.2010.14819v2, 2020. [Online]. Available: https://arxiv.org/pdf/2010.14819.pdf. [Google Scholar]
24. S. Meyen, F. Goppert, H. Alber, U. V. Luxburg and V. H. Franz, “Specialists outperform generalists in ensemble classification,” arXiv preprint arXiv: 2107.04381v1, 2021. [Online]. Available: https://arxiv.org/abs/2107.04381v1. [Google Scholar]
Appendix A
Cite This Article
 Copyright © 2023 The Author(s). Published by Tech Science Press.
This work is licensed under a Creative Commons Attribution 4.0 International License , which permits unrestricted use, distribution, and reproduction in any medium, provided the original work is properly cited.
 Downloads
 Citation Tools