
 Submit a Paper
 Propose a Special lssue
 Open Access
ARTICLE

Deep Learning Method to Detect the Road Cracks and Potholes for Smart Cities
1 College of Civil Engineering, Hunan University, Changsha, 410082, China
2 Department of CS, University of Okara, Okara, 56310, Pakistan
3 Department of CS&SE, Islamic International University, Islamabad, 44000, Pakistan
4 Department of IT Services, University of Okara, Okara, 56310, Pakistan
5 Department of CS, Government College University, Faisalabad, 38000, Pakistan
6 Department of Automation Science, Beihang University, Beijing, 100191, China
* Corresponding Author: Javed Rashid. Email:
Computers, Materials & Continua 2023, 75(1), 1863-1881. https://doi.org/10.32604/cmc.2023.035287
Received 15 August 2022; Accepted 17 November 2022; Issue published 06 February 2023
 View Full Text
 Download PDF
Abstract
The increasing global population at a rapid pace makes road traffic dense; managing such massive traffic is challenging. In developing countries like Pakistan, road traffic accidents (RTA) have the highest mortality percentage among other Asian countries. The main reasons for RTAs are road cracks and potholes. Understanding the need for an automated system for the detection of cracks and potholes, this study proposes a decision support system (DSS) for an autonomous road information system for smart city development with the use of deep learning. The proposed DSS works in layers where initially the image of roads is captured and coordinates attached to the image with the help of global positioning system (GPS), communicated to the decision layer to find about the cracks and potholes in the roads, and eventually, that information is passed to the road management information system, which gives information to drivers and the maintenance department. For the decision layer, we projected a CNN-based model for pothole crack detection (PCD). Aimed at training, a K-fold cross-validation strategy was used where the value of K was set to 10. The training of PCD was completed with a self-collected dataset consisting of 6000 images from Pakistani roads. The proposed PCD achieved 98% of precision, 97% recall, and accuracy while testing on unseen images. The results produced by our model are higher than the existing model in terms of performance and computational cost, which proves its significance.Keywords
Cities are becoming densely populated because of the massive migration toward urban areas. With the growth of the population worldwide, many governments face a significant challenge in managing such a population effectively, with most people moving from rural to urban areas. With the rise of this challenge, many countries plan to bring technological advancements, such as deploying intelligent sensors around the cities, automatic water management systems, and automating transportation systems to meet Smart Cities’ requirements [1–4]. A daily rise in road traffic accidents (RTA) made driving around the smart city’s roads a concern.
Pakistan ranks first in Asia in road accident deaths. In Pakistan, only four hundred cases were reported to RTA in Punjab; according to the “World Health Organization” report, 2.9% of deaths are caused by the RTAs [5]. The primary reason for these incidents is the poor conditions of roads and the presence of cracks and potholes. Therefore, there is a need for an automated system that helps detect the road surface’s cracks and potholes [5].
Road cracks and potholes are essential indications of road faults among many types of pavement discomfort, and they should be identified promptly for asphalt-surfaced pavement repair and reconstruction tasks [6]. The explanation is that this type of fault significantly slows traffic and creates an unsafe situation for drivers in smart cities.
A pothole is generally defined as a bowl-shaped depression with a minimum plane diameter of 150 mm on the pavement surface [7]. Cracks created in the direction of the traffic flow are referred to as longitudinal cracks, and transverse cracks are those created perpendicular to the traffic flow. The causes of cracks and potholes can usually be infrastructure aging, intense traffic levels, inadequate drainage, thin pavement surface substructure, and poor substructure [8]. In developing nations, during annual field inspections, pavement potholes are frequently manually identified by inspectors from municipal transport authorities. While this traditional approach can help achieve detailed pothole measurement, data collection and analysis often have poor efficiency. The observation is that less than 10 km a day can only be examined by a pavement inspector [9]. Transport authorities need to automate potholes and crack identification since many road parts need to be inspected periodically. In addition, the effective pavement surveying process contributes dramatically to economic benefits. This is because pavement repair costs can be saved by up to 80 percent if reconstruction is carried out promptly [10].
The use of deep learning (DL) can play a vital role in solving real-life problems after the advancements in computer systems, especially graphical processing units (GPUs). DL automation in areas of various domains is straightforward, such as medical [11,12], agriculture [13–15], proper water resources supply [16], facial expression identification [17] and in cities surveillance [18]. In recent years, the most exciting topic has been damage, cracks, and pothole detection of road surfaces using artificial intelligence. In particular, deep learning provides many research approaches to identify damage to road surfaces.
Many studies have also been carried out with neural networks to solve road-related problems. However, it is concluded that these approaches suffer from three significant shortcomings compared to traditional inspection methods that rely on image processing. Firstly, there is no standard publicly available dataset to analyze results. The authors used their own images to train each presented study’s road damage identification model. Although some object recognition datasets are available, such as PASCAL VOC [19] and ImageNet [20], they are not related to road damage assessment. It is decided that a common dataset on road pavement damage detection is required. Secondly, the state-of-the-art object detection methods exercise deep learning with limited approaches and are used for limited damage issues. Thirdly, road surface damage has varied into various categories; some studies have been contained only in the longitudinal or lateral direction to identify or classify damage [21,22]. To address this dilemma, an automated is needed, with low-cost road inspection system that allows the government to overcome road safety issues.
In light of these drawbacks, this stduy developed a new dataset of the road damage caused by road traffic which contains 6000 images. The dataset is developed using multiple devices from the different roads of Lahore district, the capital of Punjab province of Pakistan. Afterward, this paper proposed a new model based on a convolutional neural network (CNN) named the Pothole Crack Detection (PCD) model to aid in building Smart Cities. The proposed technique detects cracks and potholes, the location of damaged areas, etc. It is helpful for the drivers and road management departments to urgently detect and repair the roads.
It consists of sections: the input phase, where data is fed; the pre-processing block, where operations like white balance, image resizing, and data distribution are applied for training, validation, and testing; Data from the pre-processing block is attached to the model for training/validation. Eventually, PCD is accompanied by a decision support system (DSS) to automate the process for crack detection and record the geo-coordinates to locate the damaged area in no time. The result is executed to ensure the concept section and, later, the model hypothesis. Our main contributions are:
1. This study proposed a decision support system that facilitated the drivers and different road services providers to the various road safety departments in Smart City.
2. Developed a deep learning-based CNN model named Pothole Detection Crack Detection (PCD) system that can detect cracks, potholes, and normal road patches in Smart City.
3. The proposed model contained fewer parameters than other state-of-the-art models, which reduces time and computational cost while maintaining competitive performance.
4. In detecting road damage, no single large-scale dataset is available like other object detection datasets. This study presented the largest self-collected dataset for road cracks, as per our knowledge, consisting of 6000 photographs from the roads in Punjab, Pakistan.
Road surface potholes and road crack detection became general research areas in pavement crack detection. Several researchers showed keen interest in working in the area of automation of road surfaces in smart cities. In developing countries, automation in construction gets very popular, and many works have been performed on it. Previous research has adopted many techniques and methodologies for smart cities using deep learning. Research conducted by Khan et al. [23] proposed a traffic congestion system using data fusion in smart cities to predict the region-based traffic flow. They trained the CNN and long short-term memory (LSTM) models on CityPulse Pollution and CityPlus Traffic dataset and achieved 92.3% accuracy and an RMSE value of 49. In [24], a cloud-assisted internet of things intelligent transportation system (CIoT-ITS) monitors traffic flow and controls traffic signals. The proposed CIoT-ITS improved smart city transport management and vehicle speed calculation by reducing energy utilization (23.8%), prediction (94.2%), fuel consumption (31.5%), green transportation (93.1%), traffic congestion (27.1%), traffic management (96.4%), cost ratio (28.2%), and high performance (96.7%). Rowe et al. [25] presented a crowd data gathering strategy that used smartphone sensors and 1D-CNN inference to detect road faults like potholes. A car’s dashboard-mounted iOS smartphone ran a specialized program to collect data. The proposed method obtained 98% precision.
Many studies were employed to detect cracks and potholes in deep learning. CrackDN was proposed in a study [26] to see sealed and unsealed cracks on complicated roads. CrackDN was based on Fast-RCNN architecture by inserting a sensitivity detection network parallel to the feature extraction CNN. CrackDN’s detection means average precision (mAP) was over 90%. CrackDN can still identify above 0.85. Sealed and unsealed marking cracks were the hardest to detect. A novel detection approach [27] based on Faster R-CNN was used to autonomously recognize and locate pavement distress. Six thousand four hundred ninety-eight pavement photos trained 20 Faster R-CNNs. Training performance was assessed to choose the best faster R-CNN. In testing, the superior accuracy, recall, and location error rates were 90.4% and 89.1%, comparable to training and validation averages. Dung et al. [28] suggested a fracture detection approach based on fully convolutional network (FCN) for semantic segmentation on concrete crack images. The encoder-decoder FCN network was trained end-to-end on 500 crack-labeled pictures for semantic segmentation. FCN network accuracy was 90%. Three pre-trained network topologies on a public concrete crack dataset serve as the FCN encoder’s backbone. The study [29] used CNN to detect concrete cracks without calculating defect attributes. As CNN’s can automatically learn picture features, the proposed method worked without conjugating image processing techniques (IPTs). The 40 K-image CNN has 98% accuracy. The findings revealed that the proposed method could locate actual concrete cracks.
The study [30] tested the accuracy and practicality of thermal imaging for pothole identification. After gathering sufficient data containing photographs of potholes under various conditions and weather and augmenting the data, the convolutional neural networks strategy of deep learning was applied, a new solution in this issue domain employing thermal imaging. The self-built convolutional neural model was compared to pre-trained models. One of the pre-trained convolutional neural networks based residual network models correctly detected photos with 97.08% accuracy. Hoang [31] proposed an automatic asphalt patch recognition method based on image texture analysis and hybrid machine learning methods. The least squares support vector machine (LSSVM) utilized image texture features based on color channel statistics and the gray-scale co-occurrence matrix to distinguish patched from non-patched areas. Differential flower pollination (DFP) was employed to optimize LSSVM training. A dataset of 1000 image samples was used to train and evaluate the integration of LSSVM and DFP. Experimental results showed that the proposed model has a high classification accuracy rate (95.30%), positive predictive value (0.96), and negative predictive value (0.95). Liu et al. [32] developed a U-Net-based model to detect and segment concrete cracks. U-Net was more elegant than deep convolutional neural network (DCNN), with better robustness, effectiveness, and accurate detection. The current U-Net achieved higher accuracy with a smaller training set than prior FCNs.
Ye et al. [33] proposed two CNNs techniques to detect the pavement. The proposed model was trained and tested on a self-created dataset. The main difference between the CNNs was the pre-pooling CNN pre-processed pavement photos before the first convolutional layer. The optimized pre-pooling CNN got 98.95% recognition accuracy. The stability study showed the optimized CNN model’s robustness in real-world scenarios (e.g., light conditions and pavement materials). Research conducted by Naddaf-Sh et al. [34] proposed a CNN model to detect different cracks. The classifier and mapping algorithm is tested using drone-captured photos and videos of damaged pavement. The proposed CNN classified fractures 97% accurately in both cases. In real-time, the mapping technique can map surface fractures at 11.1 km/h. Maeda et al. [35] developed a dataset from seven cities in Japan having eight different classes. The dataset consisted of categories such as wheel mark, joint construction, equal interval, joint construction, alligator crack (Rutting, bump, pothole, separation), white line blur, and crosswalk blur. They employed different deep learning models single-shot detector (SSD), using InceptionV2 and MobileNet. The proposed model achieved 75% precision and inference of 1.5 s. Manalo et al. [36] developed a transfer learning-based model to detect the pothole based on You Only Look Once (Yolov3). The detection model had an average precision of 95.43%, while recognized potholes had accuracies ranging from 33% to 69%, which is expected given the many forms and sizes of potholes. Three models were investigated, such as Yolov3, mask region-based convolutional neural network (Mask RCNN), and CNN, to detect the potholes [37]. Chen et al. [38] proposed a CNN model to identify potholes. They replaced the transfer connection block with a multi-level feature fusion block and a cascading block detector with a multi-step one. The proposed method achieved 75.24% accuracy. Anandhalli et al. [39] developed a pothole dataset from different Indian cities. They trained and tested the dataset on CNN and YOLOv3 deep learning models. The proposed models achieved 83% accuracy on YOLOv3% and 98% on CNN. Kavita [40] detected and segmented the potholes using the transfer learning Mask RCNN model. The proposed method performed well in varying weather and lighting conditions.
The previous approaches had three major flaws: first, there’s no public standard dataset for outcome analysis. In each study, the authors used photos to train the model. PASCAL VOC [19] and ImageNet [20] were objected recognition datasets but not related to road damage assessment. This study agreed a common pavement damage dataset was needed. Third, road surface damage has been categorized in various ways; some researchers focused on longitudinal or lateral damage [21,22]. An automated, low-cost road inspection system to improve traffic safety is needed.
Several machines and deep learning-based methods have already been proposed for road crack detection. Some of them achieve good results. However, one standard limitation of these models is that they are not trained on an extensive dataset. Moreover, these models’ time and computational costs are also high due to the vast parameters. The menuscript proposed a decision support system for road cracks and pothole detection in this study. For the training, a self-composed dataset of road images through multiple capturing devices is used.
No large-scale public dataset for road damage detection is available for other object detection tasks, such as CIFAR10 [41] and LISA Traffic Sign Detection Dataset [42]. However, a dataset for pothole detection with only 665 images is available, which is insufficient to train a robust model to detect road cracks. In this work, developed a dataset of 6000 images having three classes normal, crack, and pothole, as shown in Fig. 1. These images were acquired from different sources with the help of smart city cameras, using smartphones fixed on the vehicle and drone camera. For this research, images were collected from the different roads of the Lahore district.
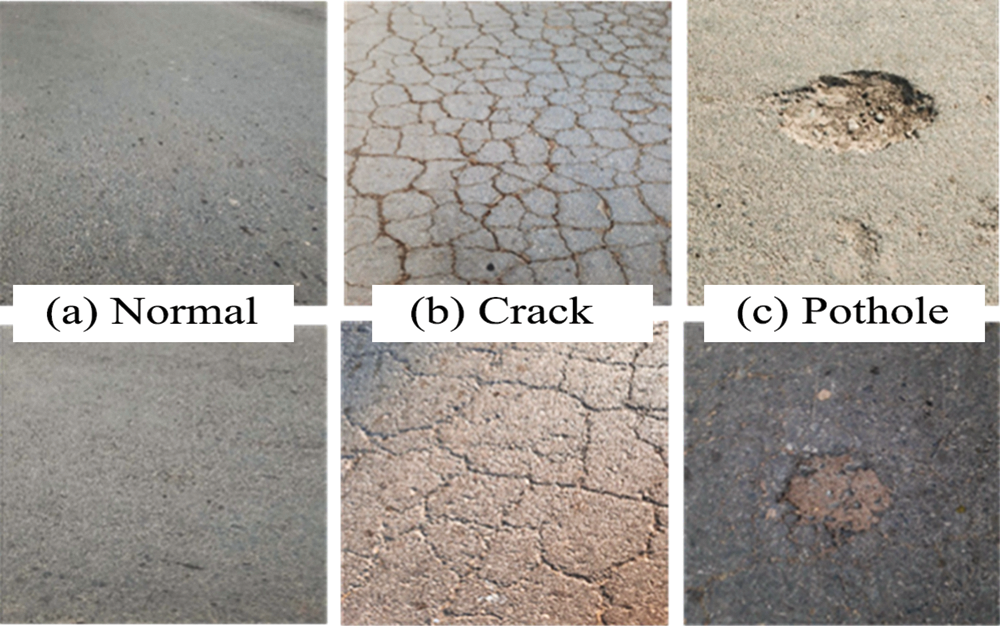
Figure 1: Examples of images in database
These images are captured from different angles, under weather conditions such as overcast, rainy, low light, and few at night. After collecting these images, they are manually labeled into three classes: Pothole, crack, and normal images. The normal class consists of 2000 images, the crack class has 2000 images, and the pothole class consists of 2000 images, as shown in Table 1. This dataset is shared for future research to expand research in this field.
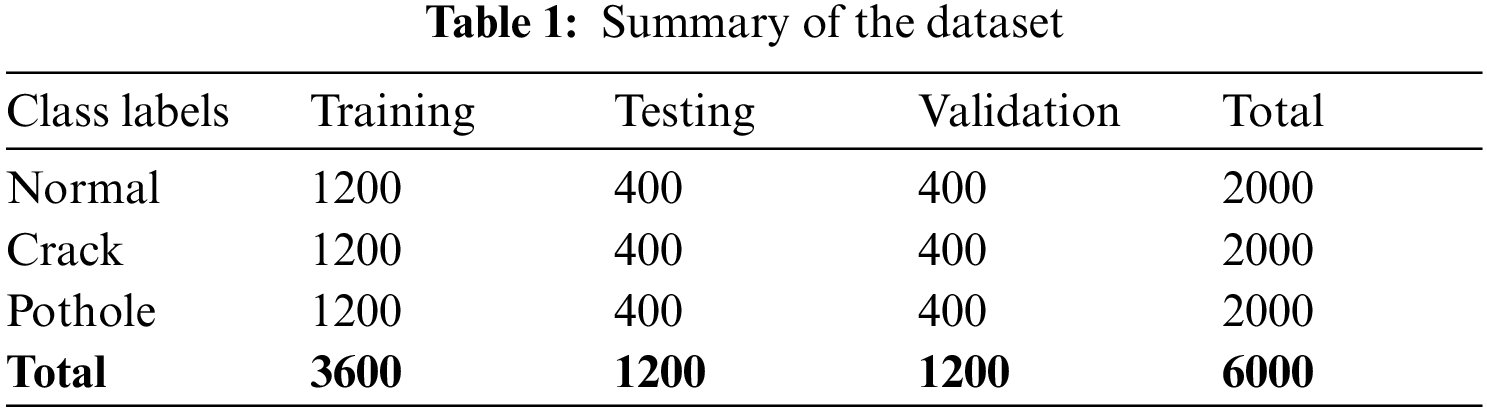
Our dataset can be found on the google drive link https://bit.ly/3scBvlG (accessed Aug. 24, 2022). The dataset of 6000 images (RGB, Jpeg type) is divided into three parts: training, testing, and validation, with 60%, 20%, and 20% ratios, respectively. Therefore, 3600 images are used to train PCD, 1200 images are used for testing, and the remaining 1200 images are used for validation, as shown in Table 1. The images used in training and validation do not include in testing. In this way, the perforamcne can be determined of the proposed model.
Data augmentation is always recommended to train the deep learning model to achieve better accuracy [43]. The different data augmentation techniques are applied using the Image Data Generator method in Keras [44] to fulfill the need for maximum data for training to avoid overfitting or underfitting. The featurewise_centre, which transforms the images to 0 means for object invariance, is frozen to True in our case. The rotation_range is a value in degrees (0–180) to rotate pictures randomly; and set the rotation range at 20. The contrast enhancement is also primed to True, which adjusts objects’ relative brightness and darkness in the scene to improve their visibility. The horizontal_flip, which randomly flips images horizontally, and the vertical_flip, which randomly flips images vertically, are set to True. The size for each image is set to 256 × 256 dimensions of the pixel.
Classification using Artificial Neural networks is embraced as the best approach to solving pattern recognition problems. Hence, this study used entirely related CNN for the detection of potholes and cracks. PCD persists on multiple blocks; consider these blocks working as sequential from the inside because every block takes the input from the previous block to proceed further. The flow of our proposed PCD model and block definitions are presented in Fig. 2.
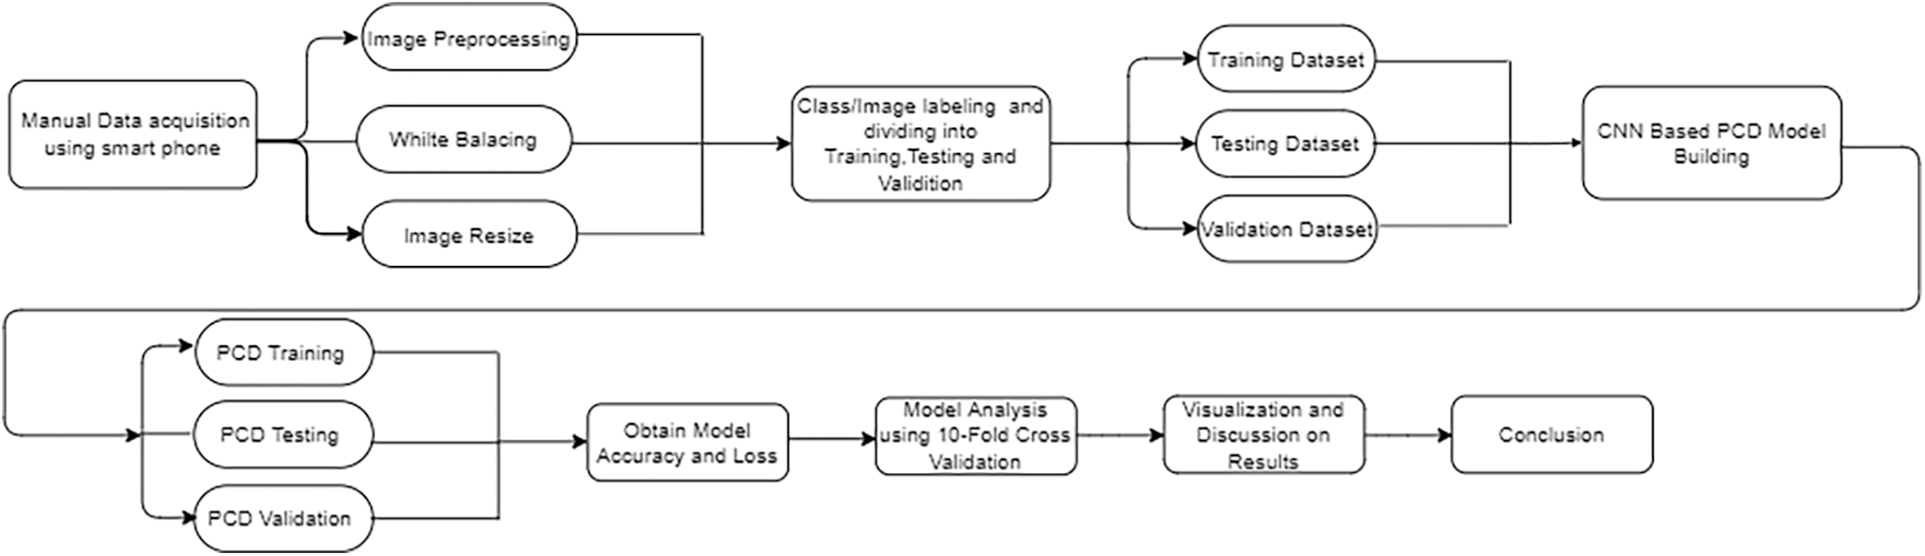
Figure 2: Flow chart of the proposed methodology
The complete architecture for an automated intelligent Pothole Cracks Detection system for smart road condition prediction is shown in Fig. 3; the basic concept is derived from the automobile parking system [4] and focuses on improving road maintenance through viable predictions. It is called the decision support system (DSS) for our proposed model PCD. The PCD encompasses layers; the first layer is for capturing images from the road using multiple recording devices and store on a cloud server using multiple communication channels. At the first layer, a geotagging API is used to hoard the coordinates of captured images and pass them to the cloud server, where information for images and their GPS location are stored. Different transport management systems are already studied for smart cities to predict road conditions, such as road management systems, road supervision services, road location services, etc. Decision-making is the most critical part of these systems; hence, a deep learning-based decision-support system was constructed. PCD model is placed at the decision-making layer in our proposed network and is linked to a road information system that provides data on road conditions in various locations. The road information system is connected to various end-user devices, including smartphones and tablets.
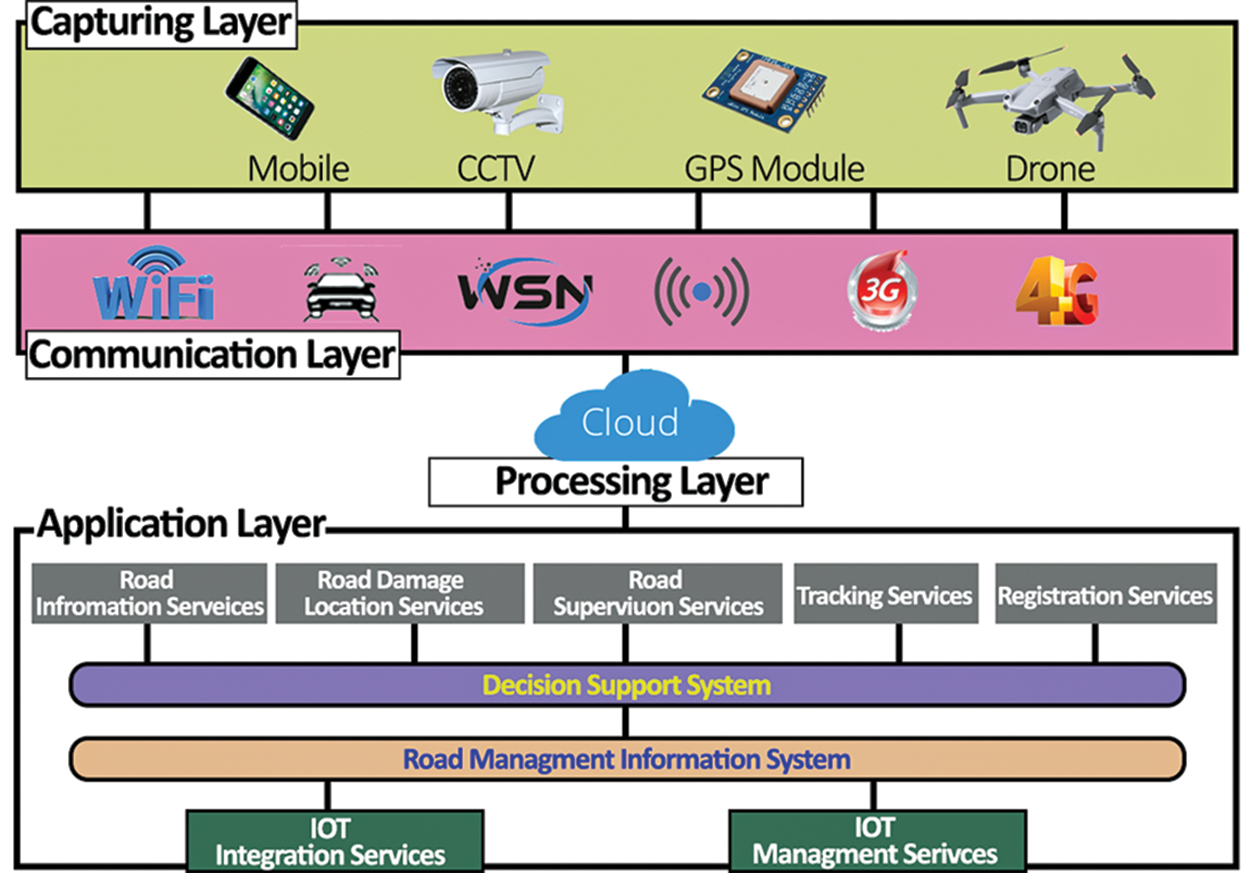
Figure 3: Decision support system for the proposed PCD
3.3.1 Road Information System (RIS)
The RIS provides drivers and the road maintenance department with information about road conditions. The RIS’s ability to provide reliable information about the road to drivers and the road maintenance department highly depends on the decision support system’s efficiency. Data is collected from various roads using various capturing devices and then transmitted to the processing layer through the communication layer, where it is processed for road condition detection. This decision support system retrieves stored data of different roads from the processing layer in response to a car driver’s question seeking information about a particular road’s condition. Before being sent to RIS to alert the driver to the road situation, the collected data is analyzed by a deep learning algorithm based on a decision support system.
The decision support method proposed for road condition prediction uses data from collecting photographs to predict the state of various roads. This paper used a CNN to estimate the road situation of a particular road after obtaining the captured image data. Convolution, pooling, and activation layers are convolutional neural networks’ main components and blocks (CNNs). In order to increase the efficiency and generalization of neural networks, the layers mentioned above extract features of images, augment nonlinearity and keep feature dimensionality to a minimum.
The CNNs convolution layer is primarily used to extract image features, but it also keeps the spatial relationship of pixels in the original pictures. The kernel of a CNN Model is only a filter used to find interesting parts of an image. The kernel is a matrix that iteratively does a dot product with a sub-region of the input data and obtains the result as a matrix of dot products. The kernel will move forward on the input data depending on the stride value. After performing the above process, a matrix is obtained, which is called a feature map. A convolution kernel or filter is a series of 2D arrays of weights used in deep learning. Each 2D array of weights is applied to the previous layer’s input channels to build multiple channels, which are then added together to form one output feature map. In order to create several function maps of the output layer, this procedure gets repeated for all two-dimension arrays of weights. As a result, different feature maps are generated using different convolution kernels with varying weights for the same input picture, implying that various convolution kernels extract multiple features. Lower convolution layers extract structural details and position information from a photo, whereas higher convolution layers’ feature maps provide more semantic context and less location information. An error backpropagation algorithm is used to learn and refine convolution kernels with weights during the training phase.
During the convolution stage of neural networks, an activation function introduces nonlinearity. The Rectified Linear Unit (ReLu) is a piecewise linear function that outputs only when it is positive. ReLu is favored in most cases; it trains the neural network even faster than others. All values set to zero in ReLu are also an operation performed elementwise. Since most learning data is nonlinear, the function activation guarantees that the feature map can be used for nonlinear operations after linear convolution.
After convolution and activation, the function of the pooling layer is to reduce the dimensionality of the feature maps by downsampling them; however, important information or background information is preserved. As a consequence, the pooling kernel’s outputs at the feature map are confined to a single value in the upcoming layer, thus expanding each neuron’s receptive field. Each pooling kernel’s maximum value is used in the max-pooling layer, and in the average pooling layer, each pooling kernel’s average value is used. The pooling layer decreases the number of model parameters and overfitting, resulting in improved generalization and resistance to minor transformations, scaling, and distortions.
Fully connected layers in CNNs lack image pixel location information and only have category information. Although CNN’s are effective instruments for producing feature hierarchies for the classification of an image, resulting in reasonably consistent crack and pothole images, the images lack spatial clarity and detailed crack delineation. Overall, using CNNs for image-based fine crack segmentation remains a significant obstacle.
3.3.3 Pothole Cracks Detection (PCD)
As shown in Fig. 4, PCD consists of 4 convolutional and four pooling layers as input layers. Every convolutional layer is attached to the activation function ReLU. In our model, a max pooling was used. Flatten, fully connected, and SoftMax are the three layers for output in our PCD network. In this model, the Adam optimizer is used to optimize our algorithm. The input shape of our images on the x-axis and y-axis is 256 × 256 in this model.
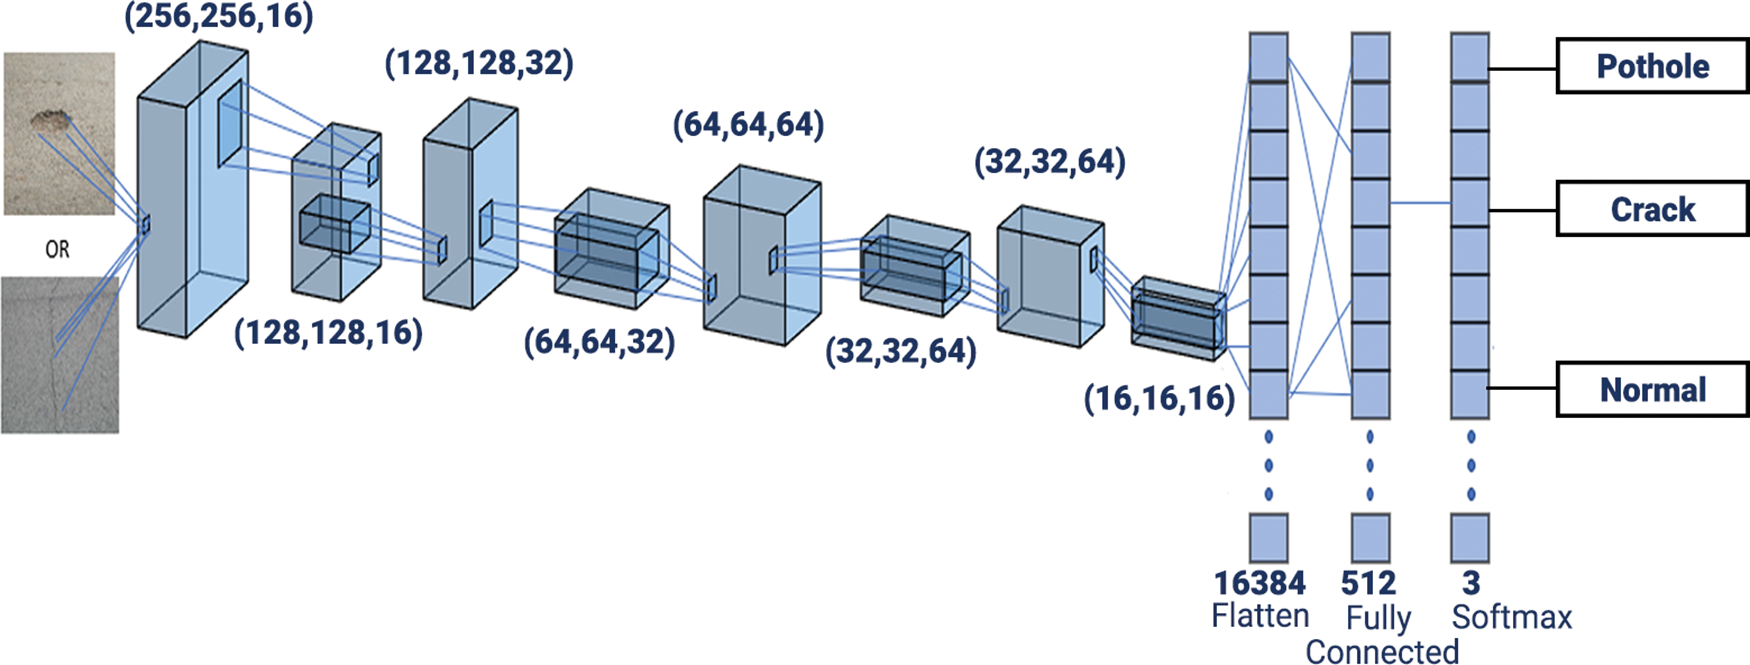
Figure 4: Architecture diagram of the PCD model
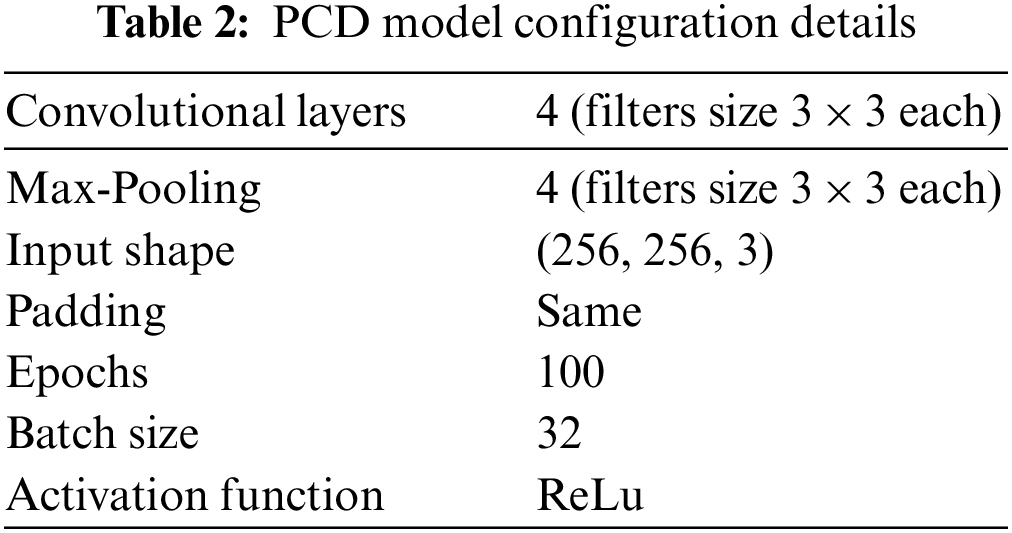
In Table 2, insights for our PCD model and the configuration details are represented to have a better understanding.
For evaluating the model after training and validation, different metrics are used to experience the performance. Our goal is to find out the model prediction. The learning effect of any model can be obtained using accuracy, but this is not enough metric. This is the main reason calculated recall, precision, and f1 score to know how well our model performs. The f1 score is the average of recall of the model and model precision. One is the maximum, and zero is the minimum value. The model is considered to be good if the value is maximum. The performance measures are described as follows:
Accuracy is the proportion of accurately predicted authentic and forged images. Accuracy is computed as:
True positive (TP) is correctly classified tampered images, and false negative (FN) is the misclassified tampered images. True negative (TN) represents the correctly classified original images, and false positive (FP) represents the misclassified original images. A tampered image is misclassified if it is recognized as authentic, and an authentic image is misclassified if it is recognized as tampered.
The model that makes all the incorrect predictions is called an error. This is used to know about all the wrong predictions.
The total of positive predictions that were accurate; is also known as positive predictive value (PPV).
A recall is the ratio of a positive sample taken by the model; it is also pronounced as the model’s sensitivity.
The f1 score is the average of recall of the model and model precision. One is the maximum, and zero is the minimum value. The model is considered to be good if the value is maximum.
Cross-validation (CV) is a resampling technique used to evaluate machine learning models on a limited dataset. Additionally, it protects prediction models from overfitting. K-Fold CV is a technique in which a given data set is spliced into K sections/folds, where each fold serves as a testing set at some point. Consider the 10-fold cross-validation case (K = 10). The data set is divided into ten folds in this case. The first fold tests the model in the first iteration, and the rest are used to train the model. In the second iteration, 2nd fold is used as the testing set while the rest serve as the training set. This process is repeated until each fold of the ten folds has been used as the testing set.
The proposed model was implemented by using Python language with the Keras library. The training and testing experiments were run using Google Colab [45], commonly available with powerful graphical processing unit (GPU) support. A 10-fold cross-validation technique was employed for the model’s training, which is known for offering better model performance, especially when the datasets are not comparatively enormous. Our model’s performance was evaluated using accuracy, positive predictive value (PPV), sensitivity, and f1 score evaluation matrices. The metric accuracy determines the data correctly classified in the testing set. PPV refers to how close two or more measurements are to each other irrespective those measurements are accurate or not; in short, the quality of being exact. Sensitivity measures the numeral of a category correctly classified from all the corresponding types in the testing set. The f1 score merges the recall and precision score into one metric by taking the harmonic mean.
4.1 Performance of the Proposed Pothole Cracks Detection (PCD)
The projected methodology was tested using a self-created dataset for road cracks and potholes. This study tried to find the other dataset for the specific problem for the comparison, but unfortunately, there is no public data available now; hence sole data samples were used. As mentioned in the previous section, a 10-fold cross-validation was used, which means the value of the K was set to 10 to distribute the validation of the dataset evenly to 20%. The results for each fold are shown in Table 3.
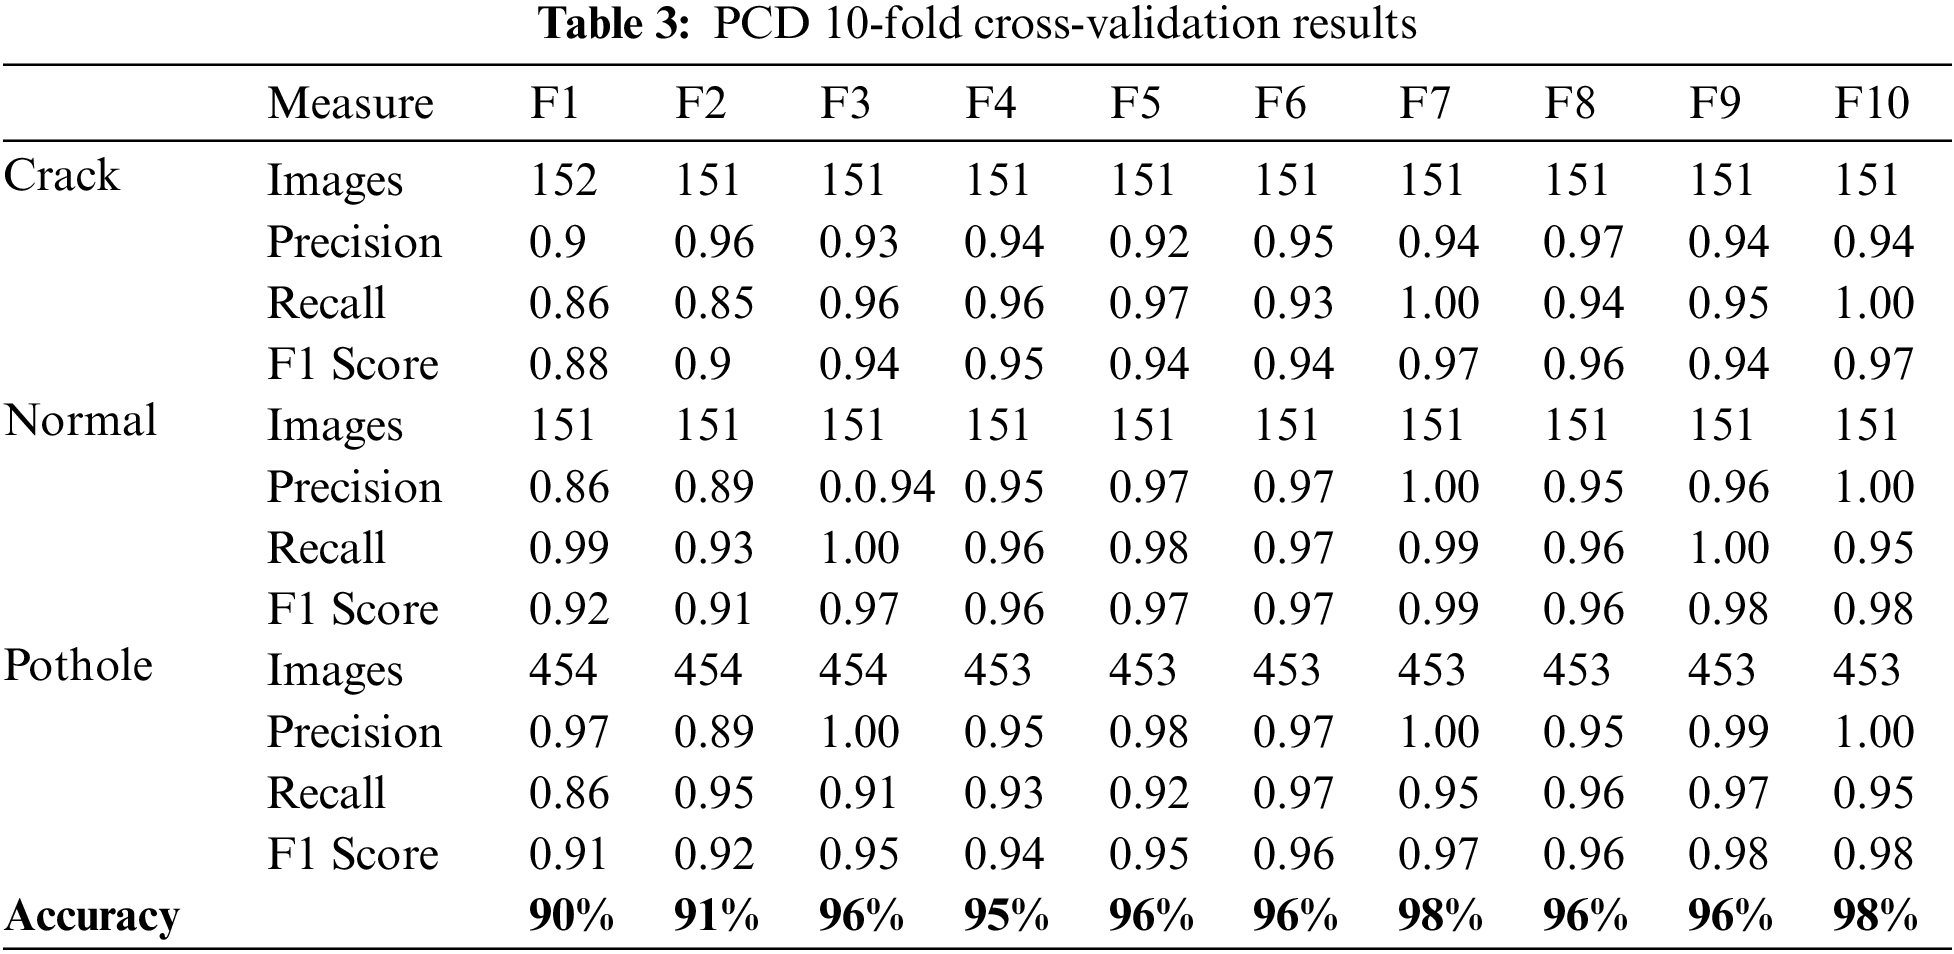
As seen in Table 3, the accuracy produced in fold one was 90%. The number of images for each fold was even by randomly chosen samples from the dataset. As shown in Table 4, the module gradually improved its performance and grew the highest values of accuracy and f1 score to 98% in the seventh and 10th fold. The values of the seventh fold and last fold were almost identical. The performance drops after the seventh fold due to trying new parameters, but it did inverse. And finally, on the last fold model produces the same highest values, and since the model will produce the same value if trained further, the training process stopped here. 80% of all data was used in training, and the remaining 20% of unseen images were used for testing purposes. The confusion matrix for each iteration is presented in Fig. 5.
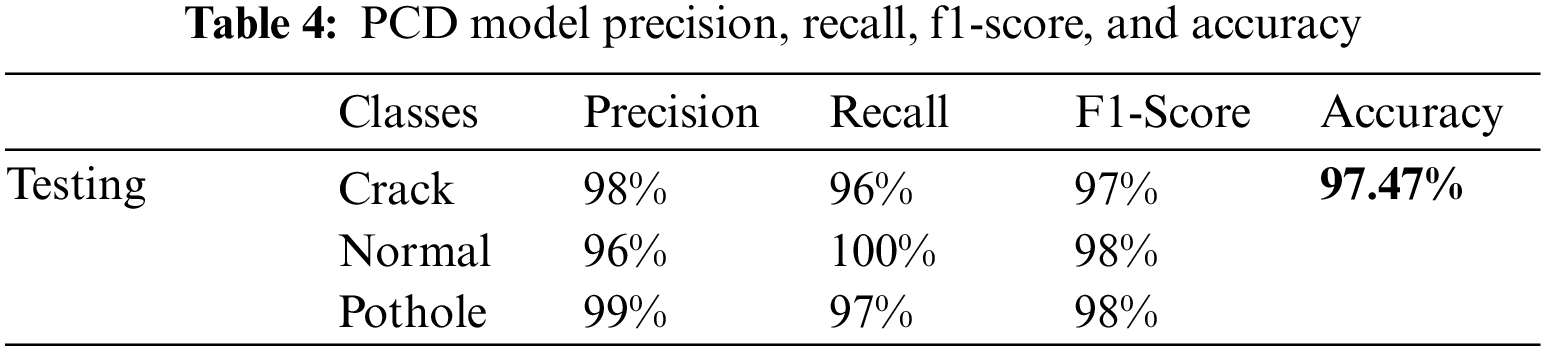
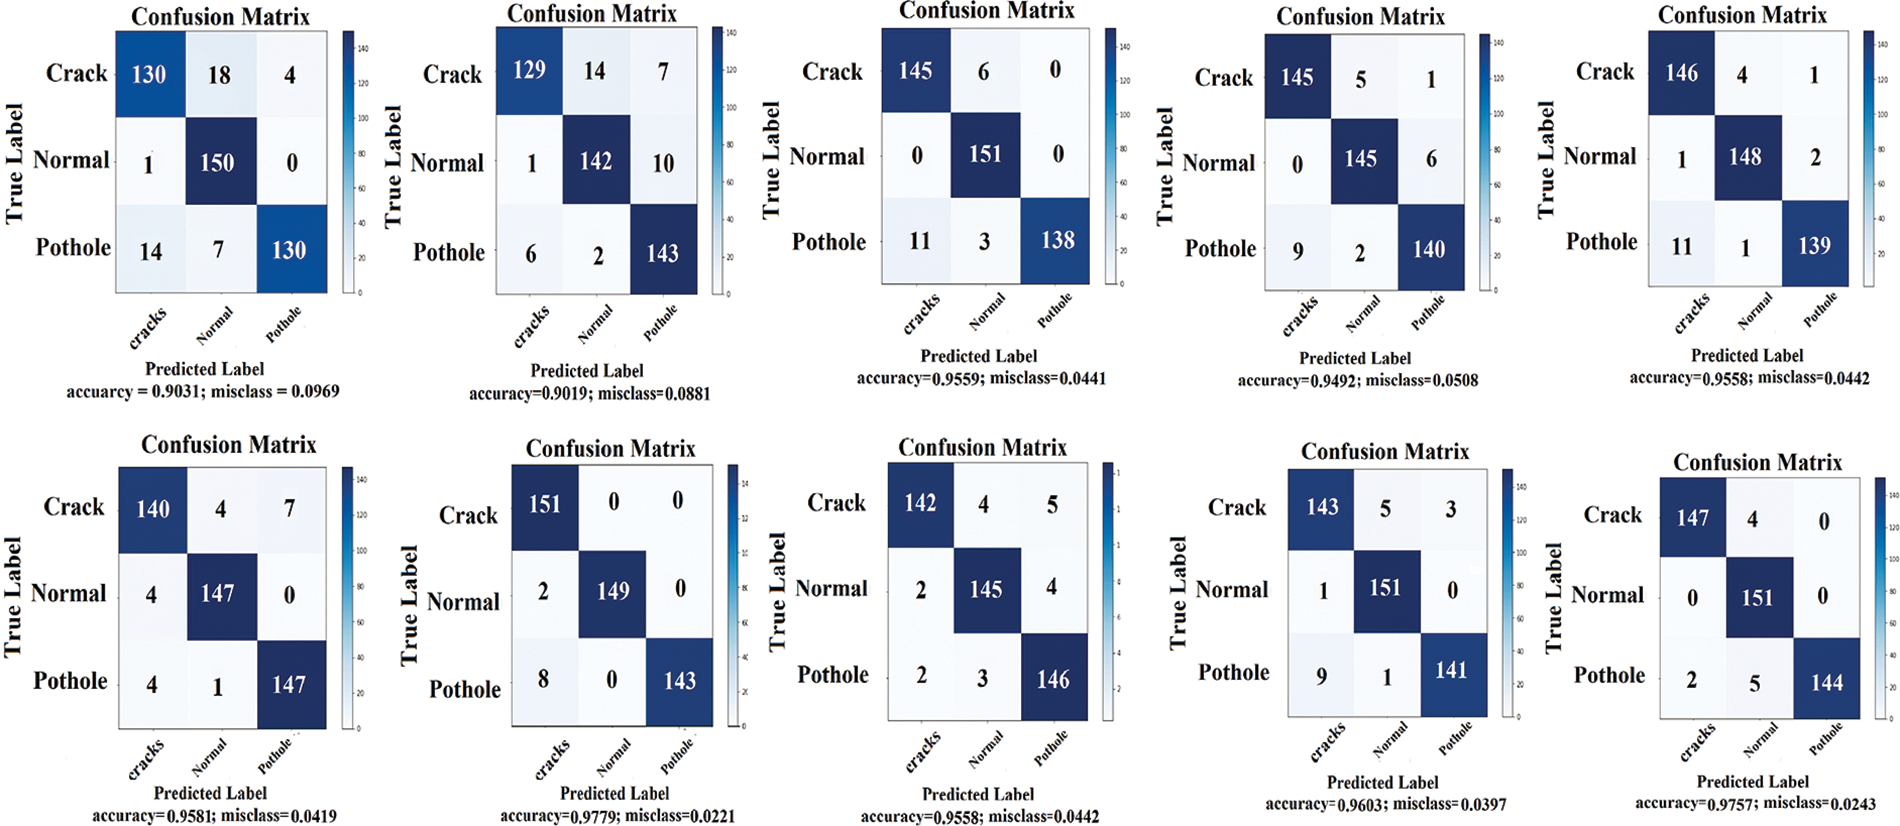
Figure 5: Confusion matrix of the proposed PCD model
The summary of validation and testing for all three classes of cracks, potholes, and normal are depicted in Table 4. The overall accuracy of our proposed model is 97.47%, which is quite good. The reason for stating good accuracy is that our model has a meager computation cost compared to the state-of-the-art (SOTA) models for the classification problem. Only four layers were used in our method, while the others used dozen and hundreds of layers, increasing time and cost with minor improvements. Other SOTA models used millions of parameters for in training process of similar classification problems, but the proposed method took fewer parameters. The confusion matrix for training and testing of the projected method is presented in Fig. 6. The blue boxes in the matrix represent how many times the model predicted the sample in the correct category. At the same time, the other boxes refer to how many times the category is predicted into the wrong class.
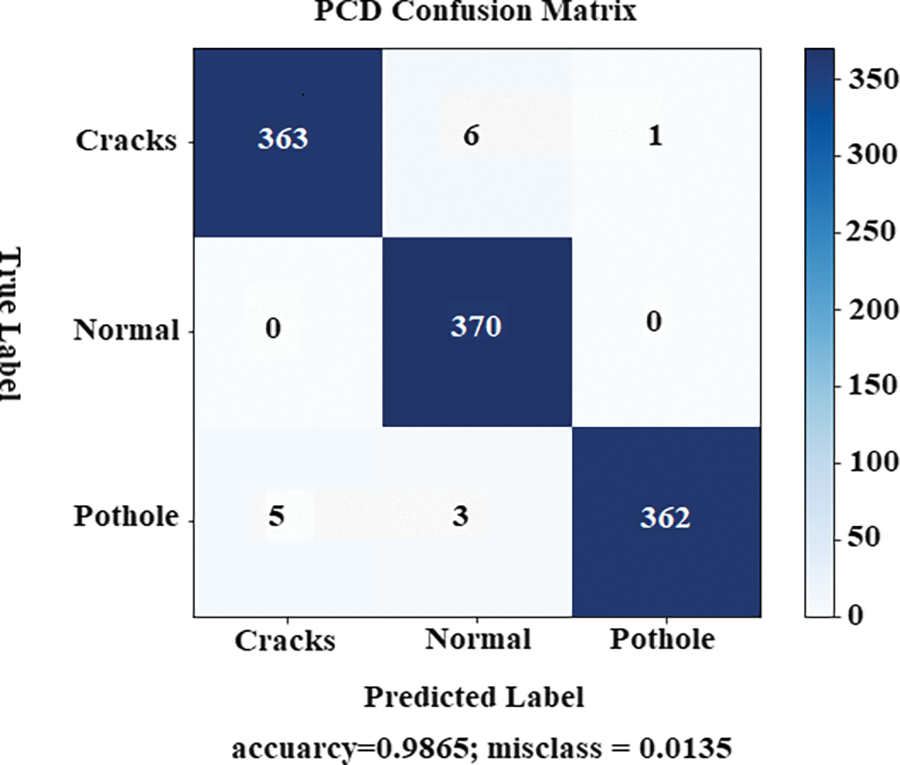
Figure 6: Confusion matrix or the proposed PCD model
In the given Fig. 7, training losses and accuracy are displayed. As the number of epochs increased, the losses decreased with each iteration while the accuracy increased. The right side of Fig. 7 refers to train and test accuracy, how many times it extracted the right features during training and how many times it predicted the correct category in testing. The other side explained the selection of wrong characteristics in training data and forecasted the wrong classes in testing data.
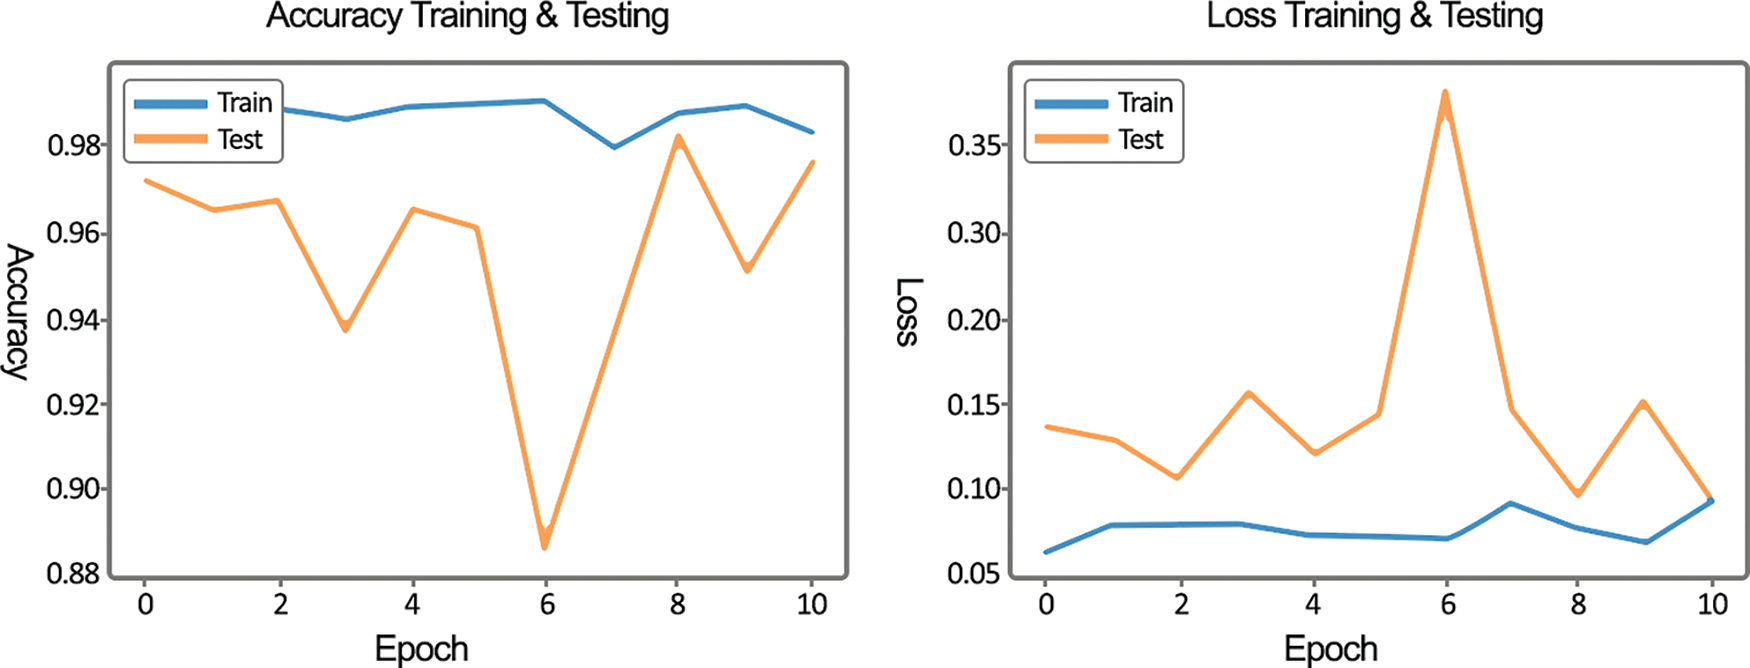
Figure 7: Cross-validation accuracy and loss of the proposed PCD model
The receiver operating characteristic (ROC) is illustrated by plotting the true positive rate (TPR) against the false positive rate (FPR) at different thresholds. In Fig. 8, the ROC curve is exhibited; it is a performance measurement for classification problems at various threshold settings. According to [46], the value of area under the curve (AUC) between 80:90 in a ROC curve can be interpreted as good, while 90:100 can refer to as excellent in classification problems. The testing ROC curve clearly shows an average AUC of 98%, which is a decent score for the given problem set.
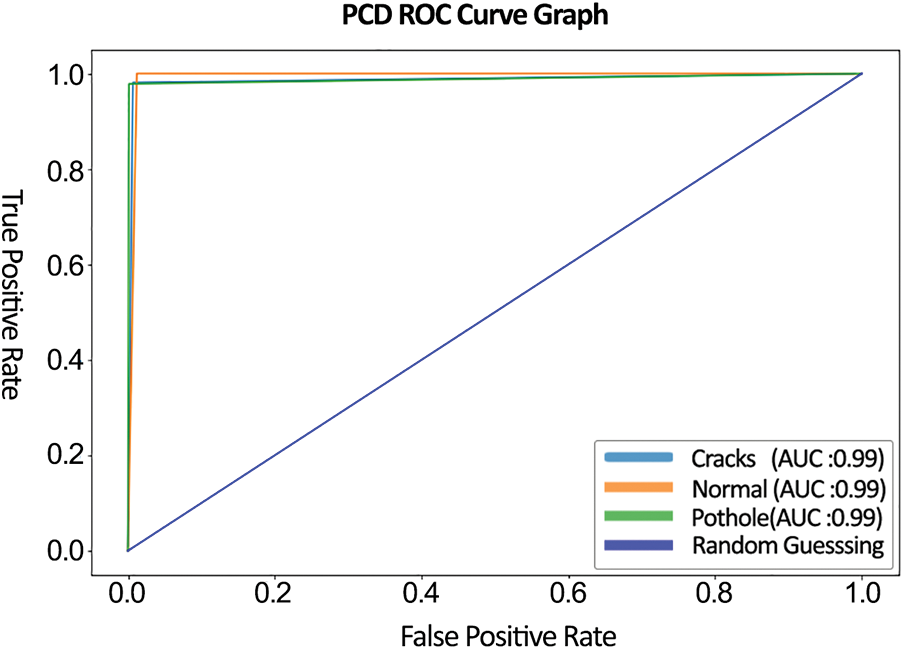
Figure 8: ROC curve of the proposed model
4.2 Results Comparison with State-of-the-Art Models
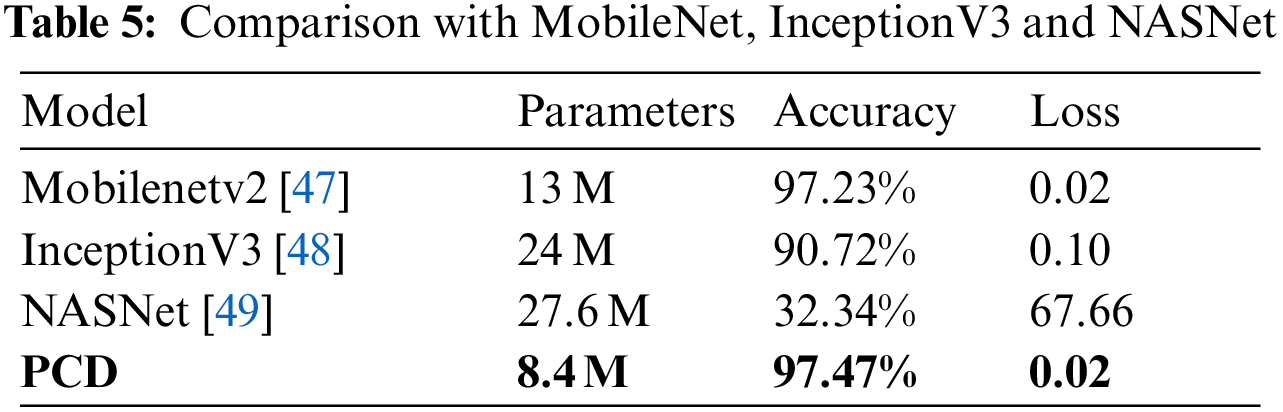
The best method to measure the performance of a proposed model is to train other models on the same dataset. In this study, to compare our model with other existing networks, This study devoted three pre-trained models and trained them on our dataset. The models were MobileNetV2 [47], InceptionV3 [48], and NASNet [49]. In most studies, MobileNetV2 is utilized for multiclassification and considered SOTA architecture in the object detection sphere. The results of all models mentioned above are presented in Table 5 to depict their corresponding performances. The first model was MobileNetV2 which produced almost identical results with 97.23% accuracy but embodied thirteen million parameters. The InceptionV3 model achieved a total accuracy of 90.72% with twenty-four million parameters. On the other hand, NASNet could only be offered the accuracy of 32.34% utilizing twenty-seven million parameters, a comparatively huge number of parameters. In contrast to these three models, our proposed model presented an accuracy of 97.47% using only 8.4 million parameters. The MobileNetV2 performance is close to our model, and there is a trade between computing cost and time. Hence, in the comparative analysis, our system is better than other networks in terms of accuracy by taking very few learning parameters. In general, it is a perception that having a greater number of parameters produces good results. Still, the excessive number of learning parameters makes a network slow, especially when powerful GPUs are missing, and increases the time in performing a given task. A large number of parameters could also lead to overfitting with small datasets, which is an even bigger problem in model training to perform classification tasks.
In the proposed method, the overfitting enigma was not experienced. It is a state in which the model fits too well on the training samples and does not have good generalization ability, producing low accuracy results on new data. To Keep a check on overfitting, a validation process can be conducted on each iteration of a deep learning model. In Fig. 7, graphs for the loss and accuracy during the training process of our model are presented. Overfitting can be noticed by looking at these graphs. An overfitting network’s feature is that it performs well in categorizing the training data samples but poorly in classifying new data, like the validation data. It can be observed from the presented graphs that both training losses and validation losses keep decreasing over iterations of the training process. Hence, a decrease in the number of no-training losses but an increase in validation loss is experienced as the training iteration continues. Consequently, it can be concluded that our proposed model does not overfit and has a good generalization ability.
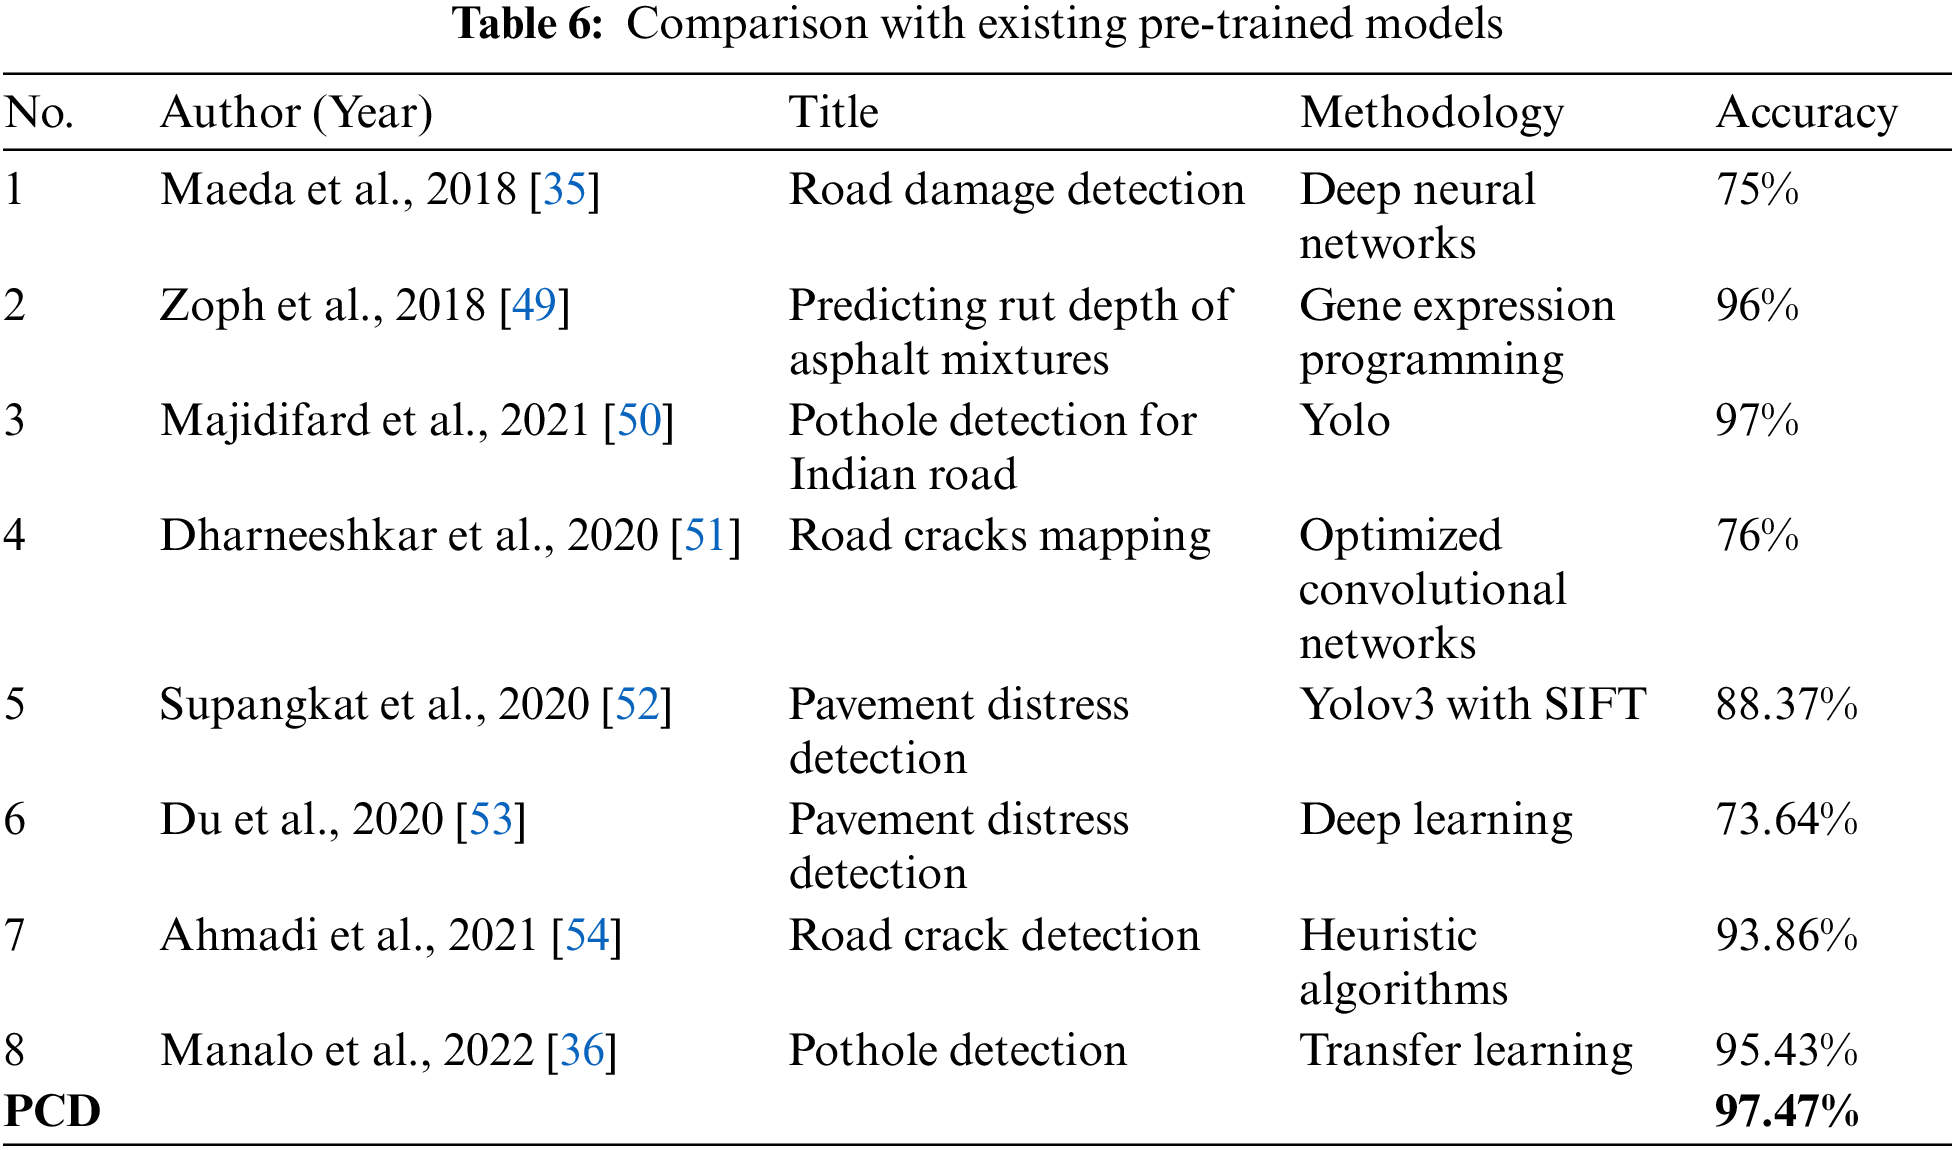
Other researchers studied classification problems related to road cracks and potholes using machine learning/deep learning models. The model was compared closely with other existing studies in Table 6. For the comparison, the accuracy metric is chosen and stated the in the table. There are only four studies that cross the accuracy above 90%. The highest accuracy from the existing research is for road crack mapping using optimized convolution neural networks, which is 97% but still not enough to beat the results of our proposed model. In terms of accuracy, our network achieved better value than the compared studies by a much smaller number of parameters. Thus, the proposed model can be significant for cracks and potholes detection from the roads for building smart cities.
Our study proposes a deep learning-based novel method called Pothole Crack Detection (PCD) and a decision support system to identify a smart city’s cracks, damages, and potholes in road areas. The proposed system is trained as a generic object identifier to detect and classify road damages from the self-collected 6000 images dataset. The dataset is collected from different regions with different environmental conditions, such as rainy, dusty, sunny, and dry conditions. This study used a deep learning-based technique called Pothole Crack Detection (PCD) based on CNN, composed of 4-layer architecture. In the proposed model, it used convolutional layers to extract the different features from the training images. Our approach performs better than existing methods, with an accuracy of 97.47%. It has a low computation cost as compared to other states of the art models. Finally, the results produced by this model are conclusive enough to be used in smart cities for real-time detection. Eventually, after completing the training process, the PCD model is deployed on a decision support system to automate the procedure for smart city cameras. However, improvements could be made, such as this model uses images of cracks and potholes from empty roads; for the next step, the model could be reused for training with road traffic images of cracks and potholes.
Funding Statement: (1) Hunan Provincial Science and Technology Innovation Leader Project, Grant/Award Number: 2021RC4025; (2) National Natural Science Foundation of China, Grant/Award Number: 51808209; (3) Hunan Provincial Innovation Foundation for Postgraduate, Grant/Award Number: QL20210106.
Conflicts of Interest: The authors declare that they have no conflicts of interest to report regarding the present study.
References
1. J. Bélissent, “Getting clever about smart cities: New opportunities require new business models,” Cambridge, Massachusetts, USA, vol. 193, pp. 244–277, 2010. [Google Scholar]
2. U. Draz, T. Ali, J. A. Khan, M. Majid and S. Yasin, “A Real-time smart dumpsters monitoring and garbage collection system,” in 2017 Fifth Int. Conf. on Aerospace Science & Engineering (ICASE), Islamabad, Pakistan, IEEE, pp. 1–8, 2017. [Google Scholar]
3. A. Hussain, U. Draz, T. Ali, S. Tariq, M. Irfan et al., “Waste management and prediction of air pollutants using iot and machine learning approach,” Energies, vol. 13, no. 15, pp. 3930, 2020. [Google Scholar]
4. T. Ali, M. Irfan, A. S. Alwadie and A. Glowacz, “Iot-based smart waste bin monitoring and municipal solid waste management system for smart cities,” Arabian Journal for Science and Engineering, vol. 45, no. 10, pp. 185–198, 2020. [Google Scholar]
5. A. Sharif, J. Li, M. Khalil, R. Kumar, M. I. Sharif et al., “Internet of things smart traffic management system for smart cities using big data analytics,” in 2017 14th Int. Computer Conf. on Wavelet Active Media Technology and Information Processing (ICCWAMTIP), Sichuan, China, IEEE, pp. 281–284, 2017. [Google Scholar]
6. C. Koch, G. M. Jog and I. Brilakis, “Automated pothole distress assessment using asphalt pavement video data,” Journal of Computing in Civil Engineering, vol. 27, no. 4, pp. 370–378, 2013. [Google Scholar]
7. H. Oliveira and P. L. Correia, “Automatic road crack detection and characterization,” IEEE Transactions on Intelligent Transportation Systems, vol. 14, no. 1, pp. 155–168, 2012. [Google Scholar]
8. S. C. Radopoulou and I. Brilakis, “Patch detection for pavement assessment,” Automation in Construction, vol. 53, pp. 95–104, 2015. [Google Scholar]
9. A. Cubero-Fernandez, F. J. Rodriguez-Lozano, R. Villatoro, J. Olivares and J. M. Palomares, “Efficient pavement crack detection and classification,” EURASIP Journal on Image and Video Processing, vol. 2017, no. 1, pp. 1–11, 2017. [Google Scholar]
10. I. G. Heggie and P. Vickers, “Commercial management and financing of roads,” in the International Bank of Reconstruction and Development, vol. 23, The World Bank, N.W. Washington, D.C., USA: The World Bank Publications, pp. 7–22, 1998. [Google Scholar]
11. S. B. Atitallah, M. Driss, W. Boulila and H. B. Ghézala, “Leveraging deep learning and iot big data analytics to support the smart cities development: Review and future directions,” Computer Science Review, vol. 38, pp. 100303, 2020. [Google Scholar]
12. J. Rashid, M. Ishfaq, G. Ali, M. R. Saeed, M. Hussain et al., “Skin cancer disease detection using transfer learning technique,” Applied Sciences, vol. 12, no. 11, pp. 5714, 2022. [Google Scholar]
13. D. Ciregan, U. Meier and J. Schmidhuber, “Multi-column deep neural networks for image classification,” in 2012 IEEE Conf. on Computer Vision and Pattern Recognition, Providence, RI, IEEE, pp. 3642–3649, 2012. [Google Scholar]
14. J. Rashid, I. Khan, G. Ali, S. H. Almotiri, M. A. AlGhamdi et al., “Multi-level deep learning model for potato leaf disease recognition,” Electronics, vol. 10, no. 17, pp. 2064, 2021. [Google Scholar]
15. J. Rashid, I. Khan, G. Ali, S. U. Rehman, F. Alturise et al., “Real-time multiple guava leaf disease detection from a single leaf using hybrid deep learning technique,” Computers, Materials & Continua, vol. 74, no. 1, pp. 1235–1257, 2023. [Google Scholar]
16. H. Wu, Z. Lei, Y. Shi and X. Li, “Water level prediction of community secondary water supply tank based on deep learning,” in 2019 IEEE 4th Advanced Information Technology, Electronic and Automation Control Conf. (IAEAC), Chengdu, China, IEEE, vol. 1, pp. 1336–1340, 2019. [Google Scholar]
17. M. Sohail, G. Ali, J. Rashid, I. Ahmad, S. H. Almotiri et al., “Racial identity-aware facial expression recognition using deep convolutional neural networks,” Applied Sciences, vol. 12, no. 1, pp. 88, 2022. [Google Scholar]
18. Q. Chen, W. Wang, F. Wu, S. De, R. Wang et al., “A survey on an emerging area: Deep learning for smart city data,” IEEE Transactions on Emerging Topics in Computational Intelligence, vol. 3, no. 5, pp. 392–410, 2019. [Google Scholar]
19. M. Everingham, S. A. Eslami, L. V. Gool, C. K. Williams, J. Winn et al., “The pascal visual object classes challenge: A retrospective,” International Journal of Computer Vision, vol. 111, no. 1, pp. 98–136, 2015. [Google Scholar]
20. J. Deng, W. Dong, R. Socher, L. -J. Li, K. Li et al., “Imagenet: A largescale hierarchical image database,” in 2009 IEEE Conf. on Computer Vision and Pattern Recognition, Miami, FL, IEEE, pp. 248–255, 2009. [Google Scholar]
21. E. Zalama, J. Gómez-García-Bermejo, R. Medina and J. Llamas, “Road crack detection using visual features extracted by gabor filters,” Computer-Aided Civil and Infrastructure Engineering, vol. 29, no. 5, pp. 342–358, 2014. [Google Scholar]
22. B. Akarsu, M. Karaköse, K. Parlak, A. Erhan and A. Sarimaden, “A fast and adaptive road defect detection approach using computer vision with real time implementation,” International Journal of Applied Mathematics Electronics and Computers, no. Special Issue-1, pp. 290–295, 2016. [Google Scholar]
23. S. Khan, S. Nazir, I. García-Magariño and A. Hussain, “Deep learning-based urban big data fusion in smart cities: Towards traffic monitoring and flow preserving fusion,” Computers & Electrical Engineering, vol. 89, pp. 106906, 2021. [Google Scholar]
24. A. K. Pandey, R. Iqbal, T. Maniak, C. Karyotis, S. Akuma et al., “Convolution neural networks for pothole detection of critical road infrastructure,” Computers and Electrical Engineering, vol. 99, pp. 107725, 2022. [Google Scholar]
25. G. M. Rowe, J. N. Meegoda, A. A. Jumikis, M. J. Sharrock, N. Bandara et al., “Detection of segregation in asphalt pavement materials using the aran profile system,” Northeast Asphalt User, Producer Group Newport Marriott, Newport, Rhode Island, vol. 30, pp. 2–19, 2002. [Google Scholar]
26. J. Huyan, W. Li, S. Tighe, J. Zhai, Z. Xu et al., “Detection of sealed and unsealed cracks with complex backgrounds using deep convolutional neural network,” Automation in Construction, vol. 107, pp. 102946, 2019. [Google Scholar]
27. L. Song and X. Wang, “Faster region convolutional neural network for automated pavement distress detection,” Road Materials and Pavement Design, vol. 22, no. 1, pp. 23–41, 2021. [Google Scholar]
28. C. V. Dung and L. D. Anh, “Autonomous concrete crack detection using deep fully convolutional neural network,” Automation in Construction, vol. 99, pp. 52–58, 2019. [Google Scholar]
29. Y. -J. Cha, W. Choi and O. Büyüköztürk, “Deep learning-based crack damage detection using convolutional neural networks,” Computer-Aided Civil and Infrastructure Engineering, vol. 32, no. 5, pp. 361–378, 2017. [Google Scholar]
30. Y. Bhatia, R. Rai, V. Gupta, N. Aggarwal, A. Akula et al., “Convolutional neural networks based potholes detection using thermal imaging,” Journal of King Saud University-Computer and Information Sciences, vol. 34, no. 3, pp. 578–588, 2022. [Google Scholar]
31. N. -D. Hoang, “Image processing based automatic recognition of asphalt pavement patch using a metaheuristic optimized machine learning approach,” Advanced Engineering Informatics, vol. 40, pp. 110–120, 2019. [Google Scholar]
32. Z. Liu, Y. Cao, Y. Wang and W. Wang, “Computer vision-based concrete crack detection using u-net fully convolutional networks,” Automation in Construction, vol. 104, pp. 129–139, 2019. [Google Scholar]
33. W. Ye, W. Jiang, Z. Tong, D. Yuan and J. Xiao, “Convolutional neural network for pothole detection in asphalt pavement,” Road Materials and Pavement Design, vol. 22, no. 1, pp. 42–58, 2021. [Google Scholar]
34. M. Naddaf-Sh, S. Hosseini, J. Zhang, N. A. Brake, H. Zargarzadeh et al., “Realtime road crack mapping using an optimized convolutional neural network,” Complexity, vol. 2019, pp. 1–17, 2019. [Google Scholar]
35. H. Maeda, Y. Sekimoto, T. Seto, T. Kashiyama and H. Omata, “Road damage detection using deep neural networks with images captured through a smartphone,” arXiv preprint arXiv:1801.09454, 2018. [Google Scholar]
36. J. M. C. Manalo, A. S. Alon, Y. D. Austria, N. E. Merencilla, M. A. Misola et al., “A transfer learning-based system of pothole detection in roads through deep convolutional neural networks,” in 2022 Int. Conf. on Decision Aid Sciences and Applications (DASA), Chiangrai, Thailand, IEEE, pp. 1469–1473, 2022. [Google Scholar]
37. R. Rohitaa, S. Shreya and R. Amutha, “Intelligent deep learning based pothole detection and reporting system,” in 2021 Fourth Int. Conf. on Electrical, Computer and Communication Technologies (ICECCT), Erode, India, IEEE, pp. 1–5, 2021. [Google Scholar]
38. G. Chen, B. Ningxin and Y. Hualilong, “Pavement pothole detection based on cascade and fusion convolutional neural network using 2d images under complex pavement conditions,” Recent Patents on Engineering, vol. 16, no. 1, pp. 1469–1473, 2022. [Google Scholar]
39. M. Anandhalli, A. Tanuja, V. P. Baligar and P. Baligar, “Indian pothole detection based on cnn and anchor-based deep learning method,” International Journal of Information Technology, vol. 14, pp. 1–11, 2022. [Google Scholar]
40. I. Kavati, “Deep learning-based pothole detection for intelligent transportation systems,” in Edge Analytics, vol. 869, NY, USA: Springer, pp. 256–267, 2022. [Google Scholar]
41. Cifar-10 python. Kaggle, 2021. [Online]. Available: https://www.kaggle.com/pankrzysiu/cifar10-python/version/1. [Google Scholar]
42. Lisa traffic light dataset. Kaggle, 2021. [Online]. Available: https://www.kaggle.com/mbornoe/lisa-traffic-light-dataset/code. [Google Scholar]
43. A. Mikołajczyk and M. Grochowski, “Data augmentation for improving deep learning in image classification problem,” in 2018 Int. Interdisciplinary PhD Workshop (IIPhDW), Cie, Poland, IEEE, pp. 117–122, 2018. [Google Scholar]
44. keras-team/keras: Deep learning for humans, 2022. [Online]. Available: https://github.com/keras-team/keras. [Google Scholar]
45. Welcome to colaboratory-colaboratory, 2021. [Online]. Available: https://colab.research.google.com/notebooks/intro.ipynb?utm_source = scs-index. [Google Scholar]
46. S. Safari, A. Baratloo, M. Elfil and A. Negida, “Evidence based emergency medicine; part 5 receiver operating curve and area under the curve,” Emergency, vol. 4, no. 2, pp. 111, 2016. [Google Scholar]
47. M. Sandler, A. Howard, M. Zhu, A. Zhmoginov and L. -C. Chen, “Mobilenetv2: Inverted residuals and linear bottlenecks,” in Proc. of the IEEE Conf. on Computer Vision and Pattern Recognition, Salt Lake City, UT, USA, pp. 4510–4520, 2018. [Google Scholar]
48. C. Szegedy, V. Vanhoucke, S. Ioffe, J. Shlens and Z. Wojna, “Rethinking the inception architecture for computer vision,” in Proc. of the IEEE Conf. on Computer Vision and Pattern Recognition, Las Vegas, NV, USA, pp. 2818–2826, 2016. [Google Scholar]
49. B. Zoph, V. Vasudevan, J. Shlens and Q. V. Le, “Learning transferable architectures for scalable image recognition,” in Proc. of the IEEE Conf. on Computer Vision and Pattern Recognition, Salt Lake City, UT, USA, pp. 8697–8710, 2018. [Google Scholar]
50. H. Majidifard, B. Jahangiri, P. Rath, L. U. Contreras, W. G. Buttlar et al., “Developing a prediction model for rutting depth of asphalt mixtures using gene expression programming,” Construction and Building Materials, vol. 267, pp. 120543, 2021. [Google Scholar]
51. J. Dharneeshkar, S. Aniruthan, R. Karthika, L. Parameswaran et al., “Deep learning based detection of potholes in Indian roads using yolo,” in 2020 Int. Conf. on Inventive Computation Technologies (ICICT), Coimbatore, India, IEEE, pp. 381–385, 2020. [Google Scholar]
52. S. H. Supangkat, A. A. Arman, Y. A. Fatimah, R. A. Nugraha and H. S. Firmansyah, “The role of living labs in developing smart cities in Indonesia,” in Data-Driven Multivalence in the Built Environment, 1st ed., NY, USA: Springer, pp. 223–241, 2020. [Google Scholar]
53. Y. Du, N. Pan, Z. Xu, F. Deng, Y. Shen et al., “Pavement distress detection and classification based on yolo network,” International Journal of Pavement Engineering, vol. 22, no. 13, pp. 1–14, 2020. [Google Scholar]
54. A. Ahmadi, S. Khalesi and A. Golroo, “An integrated machine learning model for automatic road crack detection and classification in urban areas,” International Journal of Pavement Engineering, vol. 23, no. 10, pp. 1–17, 2021. [Google Scholar]
Cite This Article
 Copyright © 2023 The Author(s). Published by Tech Science Press.
This work is licensed under a Creative Commons Attribution 4.0 International License , which permits unrestricted use, distribution, and reproduction in any medium, provided the original work is properly cited.
 Downloads
 Citation Tools