
 Submit a Paper
 Propose a Special lssue
 Open Access
ARTICLE

Fruit Leaf Diseases Classification: A Hierarchical Deep Learning Framework
1 Department of Computer Science, HITEC University, Taxila, 47080, Pakistan
2 Computer Sciences Department, College of Computer and Information Sciences, Princess Nourah bint Abdulrahman University, Riyadh, 11671, Saudi Arabia
3 Department of Electrical Engineering, College of Engineering, Jouf University, Sakakah, 72311, Saudi Arabia
4 College of Computer Engineering and Sciences, Prince Sattam bin Abdulaziz University, Al-Kharj, 16242, Saudi Arabia
5 Department of ICT Convergence, Soonchunhyang University, Asan, 31538, Korea
* Corresponding Author: Yunyoung Nam. Email:
Computers, Materials & Continua 2023, 75(1), 1179-1194. https://doi.org/10.32604/cmc.2023.035324
Received 16 August 2022; Accepted 14 December 2022; Issue published 06 February 2023
 View Full Text
 Download PDF
Abstract
Manual inspection of fruit diseases is a time-consuming and costly because it is based on naked-eye observation. The authors present computer vision techniques for detecting and classifying fruit leaf diseases. Examples of computer vision techniques are preprocessing original images for visualization of infected regions, feature extraction from raw or segmented images, feature fusion, feature selection, and classification. The following are the major challenges identified by researchers in the literature: (i) low-contrast infected regions extract irrelevant and redundant information, which misleads classification accuracy; (ii) irrelevant and redundant information may increase computational time and reduce the designed model’s accuracy. This paper proposed a framework for fruit leaf disease classification based on deep hierarchical learning and best feature selection. In the proposed framework, contrast is first improved using a hybrid approach, and then data augmentation is used to solve the problem of an imbalanced dataset. The next step is to use a pre-trained deep model named Darknet53 and fine-tune it. Next, deep transfer learning-based training is carried out, and features are extracted using an activation function on the average pooling layer. Finally, an improved butterfly optimization algorithm is proposed, which selects the best features for classification using machine learning classifiers. The experiment was carried out on augmented and original fruit datasets, yielding a maximum accuracy of 99.6% for apple diseases, 99.6% for grapes, 99.9% for peach diseases, and 100% for cherry diseases. The overall average achieved accuracy is 99.7%, higher than previous techniques.Keywords
Agriculture is essential to the economic development of any country [1]. In Pakistan, agriculture is the second largest sector in the national economy [2]. The sector yearly contributes 19% of the Gross domestic product (GDB) [3]. Agriculture contributes approximately 91%, which is a significant contribution to any other economic sector in Pakistan [4]. It also helps other sectors, such as the industrial sector, by utilizing innovative tools in the farming process [3]. Fruits, which contain vitamins, zinc, folic acid, and magnesium, protect humans from heart disease, cancer, inflammation, and diabetes [5]. Fruit nutrients benefit heart health, reduce the risk of chronic diseases, protect human cells from damage, boost the immune system, reduce obesity, maintain blood pressure, and control cholesterol levels in the human body [6]. Every third fruit from a farm has a bacterial, viral, or fungal infection. Some apple, grape, peach, and cherry diseases include scab, fire blight, powdery mildew, bitter rot, apple rust, black rot, crown gall, downy mildew, bunch rot, bacterial leaf spot, bacterial canker, brown rot, and peach mosaic [7,8]. Traditional methods of detecting various fruit illnesses rely on acute naked-eye monitoring. Manual fruit disease identification is costly, time-consuming, and requires an expert [9]. Early disease detection can save a lot of money, which helps to increase fruit production and boost the national economy.
For the reasons stated above, computerized techniques are widely used for the early detection of fruit diseases and classification into relevant classes. The automated methods are based on several key steps, including input image, image preprocessing, feature extraction, feature fusion, selection, and disease recognition [10]. Preprocessing is used to improve image data by removing undesired distortions or increasing specific graphic features relevant for further computation [11]. Feature extraction is an essential step in any computerized technique, and several methods are described in the literature, including color features, shape features, texture features, and others [12,13]. Another critical step is important feature selection, which improves accuracy by removing some redundant information. This step also reduced the computational time of the designed system [14]. Following the selection of the best features, a variety of machine learning classifiers can be used for the final classification. Support vector machine (SVM), Softmax, K-Nearest Neighbors (KNN), ensemble trees, and a few others are among essential classifiers [15].
Deep learning has recently shown significant success in large dataset classification in computer vision. The most common applications are agriculture, medical imaging, surveillance, and object classification. A neural network is a type of convolutional neural network (CNN). It has a convolutional layer, a ReLu layer, a Pooling layer, a normalization layer, a fully connected layer, and a classification layer, among others. The researchers used deep learning techniques to detect and classify fruit diseases. They have still faced several challenges, including a poorly visible infected region, noise, and redundant feature extraction. In this article, we proposed a new automated framework based on deep learning and an improved butterfly optimization algorithm to address these issues. Our major contributions are listed as follows:
■ A hybrid contrast enhancement technique was proposed based on the fusion of the CNN denoising function and the top-bottom formulation.
■ Fine-tuned Darknet53 CNN model and trained on augmented dataset instead original images. The training is performed through deep transfer learning by employing fixed hyperparameters.
■ Proposed an improved butterfly optimization algorithm and used the Newton-Raphson method to stop iterations.
Fruit leaf disease recognition is a hot research topic in computer vision, and several techniques have been proposed in the literature. Traditional and deep learning techniques are used in the techniques presented. Traditional techniques work well for small datasets with few images, whereas deep learning techniques work well for large datasets. Rehman et al. [16] presented an automated system for fruit leaf illness recognition. They used contrast stretching to improve the visual quality of infected parts. They later used a mask recurrent neural network (RCNN) to detect infected regions. In parallel, they extracted features using a pre-trained model, which was refined using a selection technique. Experiments on the Plant Village dataset yielded 96.6% accuracy. Shah et al. [17] presented a novel computerized approach using ant colony optimization (ACO) for feature selection. They performed four steps: data augmentation, model selection such as MobileNet-V2 and NasNet Mobile, fusion, and ACO-based selection. The experiments were performed on the augmented dataset and acquired an accuracy of 99.7% which is very effective and better than the recent techniques.
Adeel et al. [18] presented a computerized system for detection of grape leaf diseases. The presented method includes four main steps. Initially, it enhances the local contrast of symptoms by using local contrast refinement (LCHR). The best channel is then selected, and LAB color transformation is performed based on pixel information. Next, geometrical, color, and texture features are combined using canonical correlation analysis (CCA). Then, distorted features are removed using the neighborhood component analysis (NCA) approach, which is then classified using the support vector machine. The plant village dataset was employed for the experimental process and attained an accuracy of 90%. Yamparala et al. [19] presented a technique for the identification of fruit diseases by using convolutional neural networks (CNN). They obtained an accuracy of 90% which was better than the other methods. Baranwal et al. [20] presented a technique for plant leaf illness identification and addressed symptoms as an issue. They used a plant village dataset that included both damaged and healthy leaves. To obtain a larger dataset for training, image generation, image filtration, and image compression techniques were used. Wagh et al. [21] presented a CNN model for the detection of grape leaf disease at a very early stage to save the fruit from damage. A pre-trained AlexNet architecture is used for feature extraction. The dataset was collected from “National Research Center for Grapes” that contains images of grape leaves and attained an accuracy of 98.23%.
Nhat et al. [22] presented a framework for plant leave disease identification using deep neural networks and feature selection. Firstly, they used a contrast enhancement method for image preprocessing on the plant village dataset then the symptomatic images were segmented. These symptomatic images were selected based on principle component analysis. Several features are extracted and performed classification. They achieved the maximum accuracy of 81.2% using the presented approach. Akram et al. [23] presented a correlation coefficient, and deep features-based approach for plant leave diseases. At the very first step, they enhanced the original images and trained two deep models named vgg16 and Caffe Alexnet. Features of both models were fused that further optimized using a selection technique. The selected features are finally classified using a support vector machine. Sladojevic et al. [24] presented a plant disease recognition model based on a deep neural network. The presented model recognized 13 different diseases of fruit leaves. They contain images from agriculture experts and attained a precision rate between 91% and 98%. Several other methods are also presented, such as Akram et al. [25], Al-bayati et al. [26], and Adeel et al. [27]. In all these methods, the major challenge was the selection of the best features.
Initially, original images are required from the database. Then, a hybrid contrast enhancement technique is applied to improve the contrast of the infected region and perform some filtering technique for noise removal. After that Darknet53 pre-trained model is employed and trained on the augmented dataset. The model will be selected based on a number of parameters and Top-5 accuracy. Next, features are extracted from the trained model using the activation layer on the average pool layer. After that, proposed an improved Butterfly optimization technique for selecting the best features. In the last stage, several classifiers were utilized for the final classification. Fig. 1 depicts the framework for recognizing proposed fruit diseases.
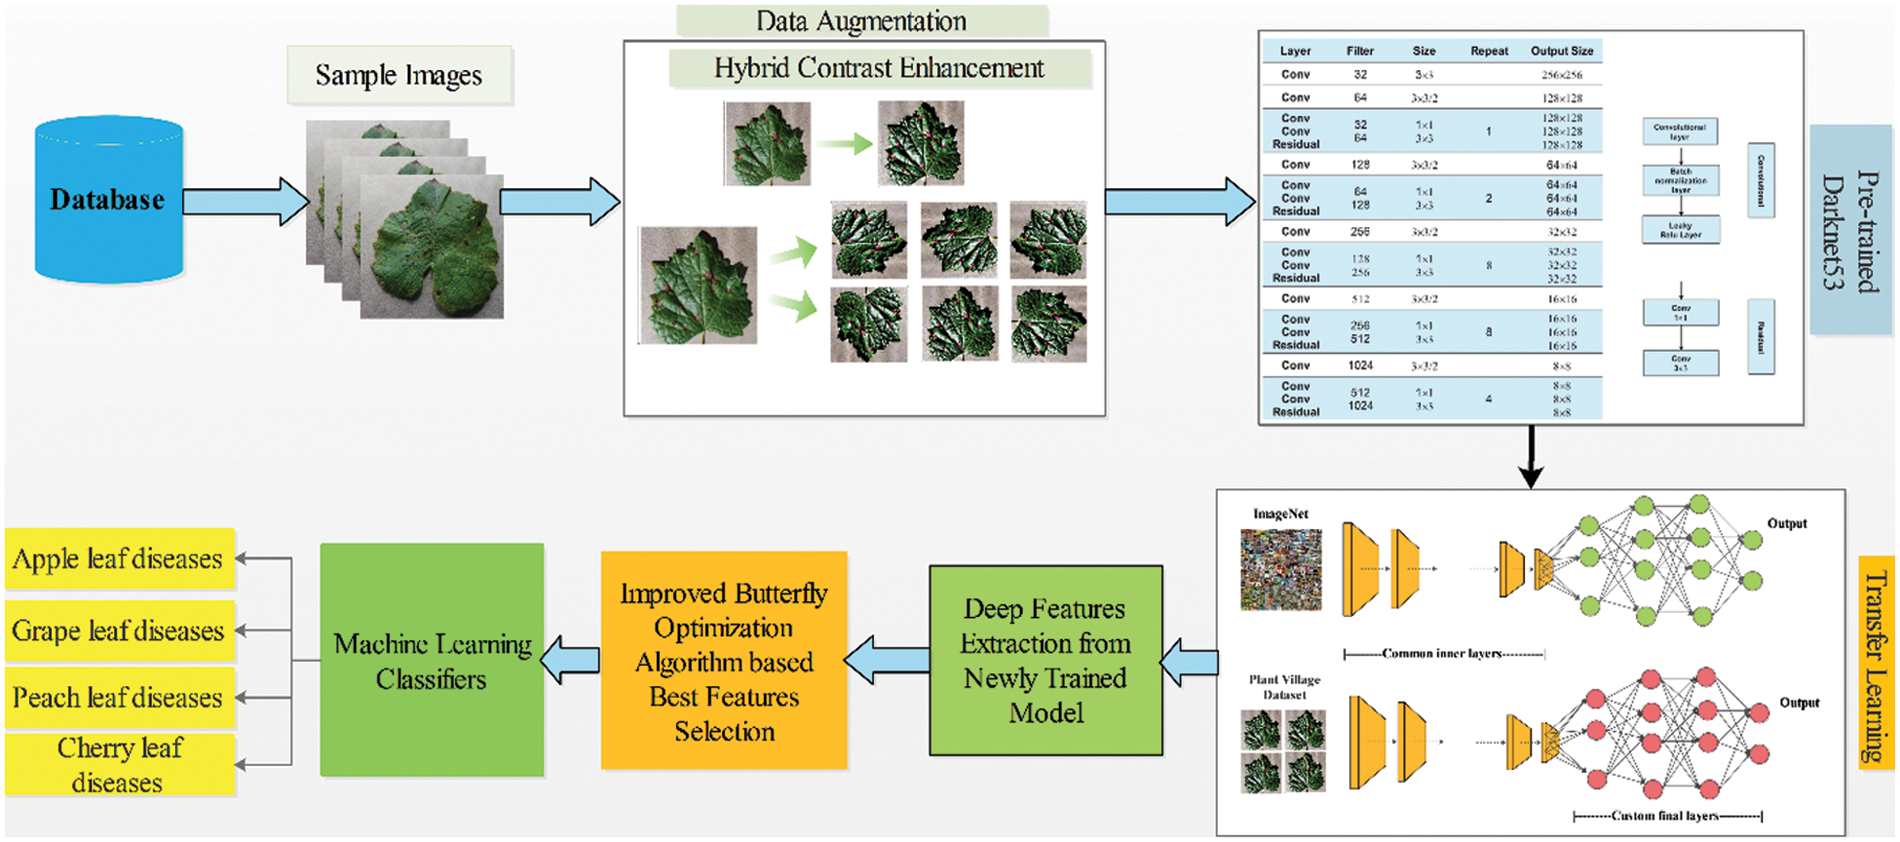
Figure 1: Proposed framework of fruit leaf diseases recognition
In this article, we utilized the plant village dataset. This dataset contains several leaf diseases found on various fruits and crops. Apple, peach, cherry, and grape leaf disease classes were chosen. Each fruit’s healthy class is also available. There are three diseases in the Apple dataset: apple scab, apple black rot, and apple cedar rust. In addition, a healthy class is included for classification purposes. A few sample images are illustrated in Fig. 2a. For the grapes dataset, three disease classes have been picked: black rot, black measles, and leaf blight. Moreover, a healthy class is also included. Sample images are illustrated in Fig. 2b. The peach dataset contains only peach bacterial and healthy classes, as shown in Fig. 2c. The cherry dataset also includes only two classes-powdery mildew and healthy, as shown in Fig. 2c.
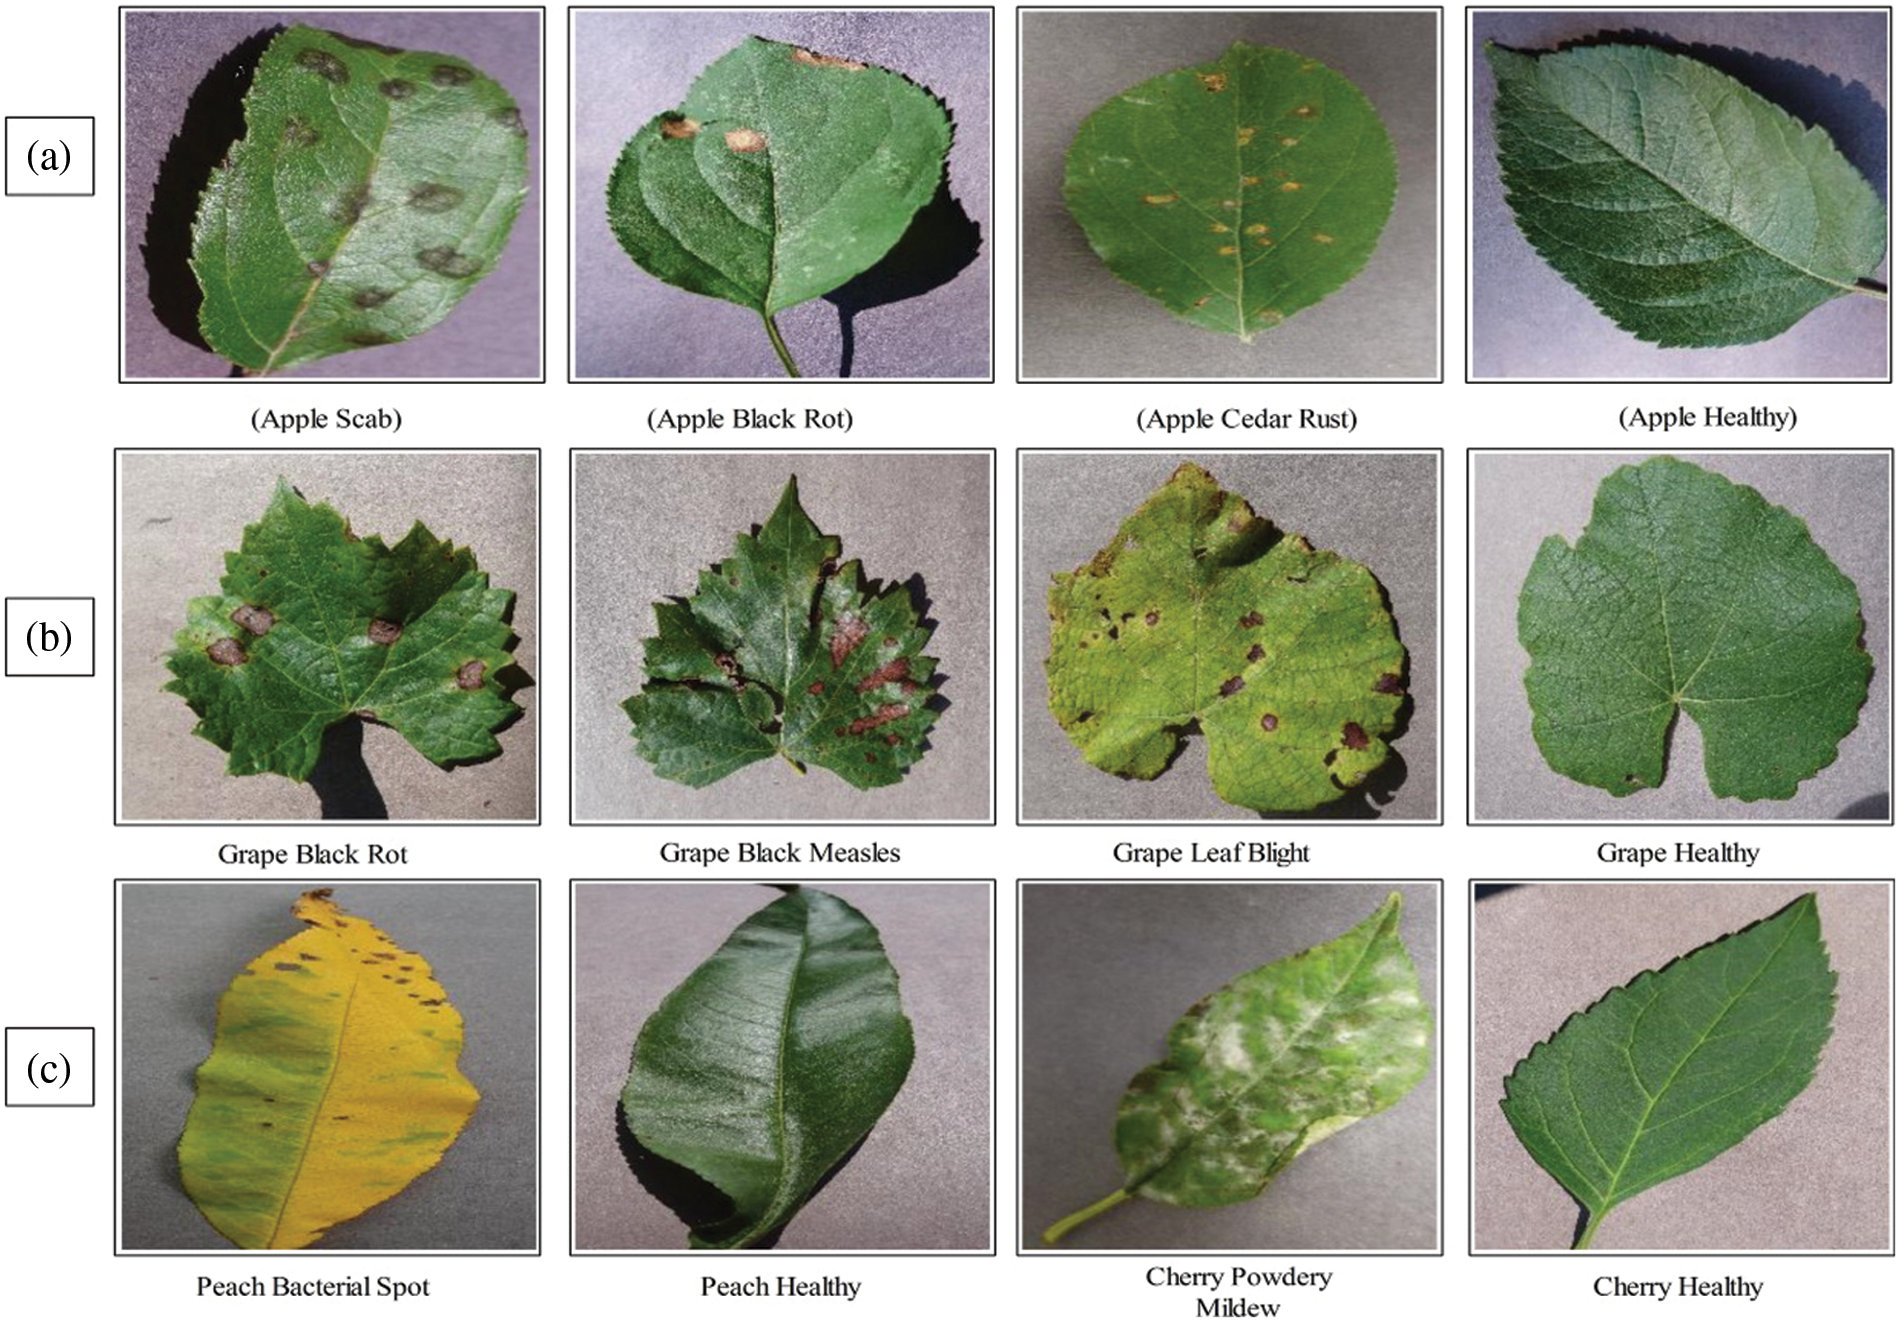
Figure 2: Sample plant village dataset images for classification
3.2 Hybrid Contrast Enhancement and Data Augmentation
Contrast enhancement has been an essential step in the domain of computer vision for the last couple of years. As a result, several contrast enhancement techniques have been introduced in the literature for different challenges. In this work, we proposed a hybrid contrast enhancement technique to visualize fruit leaf-infected regions accurately. The proposed approach is based on two different transformations: (i) local-global information stretching and fusion, and (ii) HSV color transformation.
Consider we have an input image I having dimension 512 × 512. The resultant local-global contrast image is represented by
where,
where,
Based on the above channels, the final output is computed as follows:
A few resultant samples are shown in Fig. 3. In this figure, (a) represent the original images and (b) represents the hybrid contrast enhanced images, respectively.
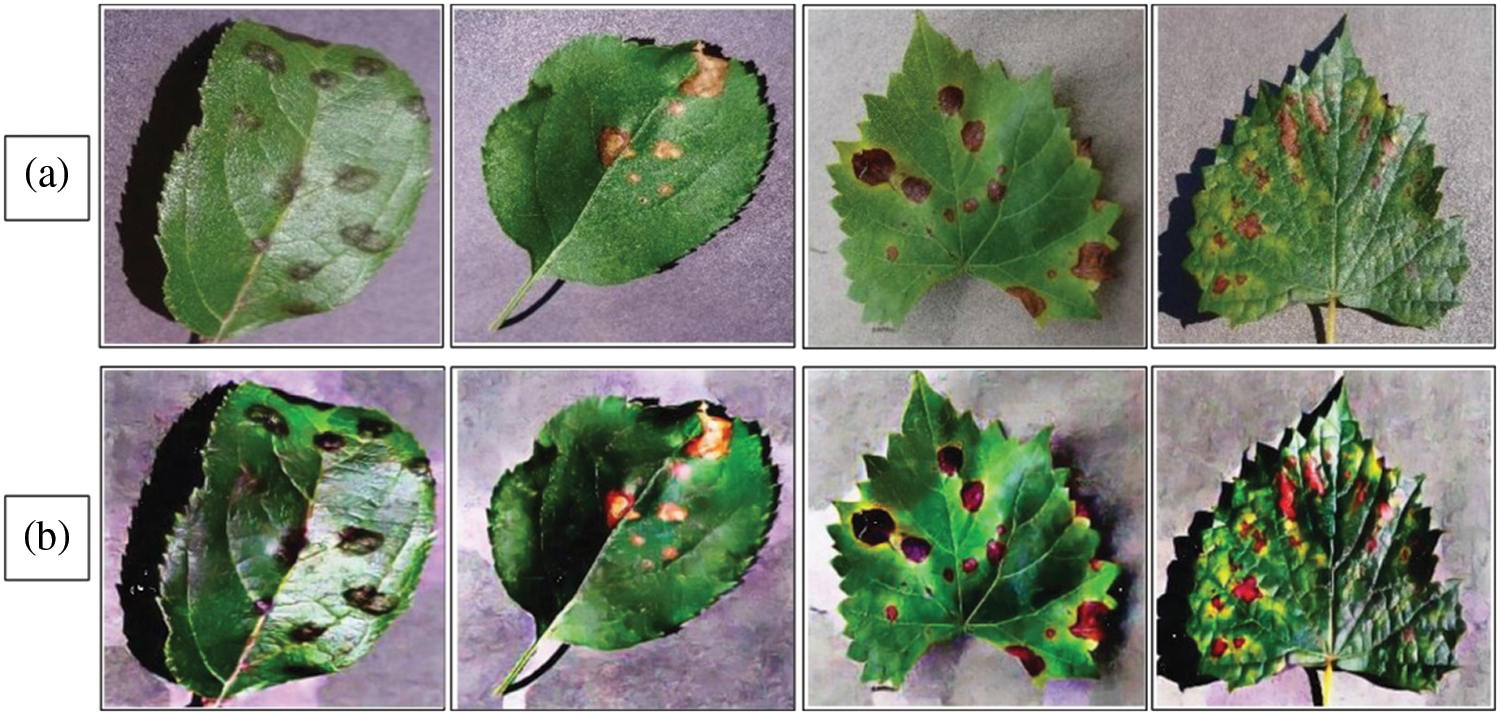
Figure 3: Sample image of hybrid contrast enhancement. (a) Original images; (b) enhanced images
After that, the data augmentation is performed using three different operations: shift left, shift above, and transpose [28]. Data is increased based on these three operations, as listed in Table 1. The augmented dataset is further utilized for the training of deep models in the next step.

3.3 Convolutional Neural Networks (CNN)
Convolutional neural networks are artificial neural networks that have gained popularity in recent years in various computer vision applications, particularly in agriculture. CNN is intended to learn spatial feature hierarchies automatically and adaptively through backpropagation using various building blocks such as convolution layers, pooling layers, and fully connected layers [29]. A simple flow of CNN is illustrated in Fig. 4.

Figure 4: A simple CNN architecture for plant disease recognition
In this work, we utilized a pre-trained deep model named Darknet53 [30] for feature extraction. The selected pre-trained model was previously trained on the Imagenet dataset having 1000 object classes, as illustrated in Fig. 5. We fine-tuned this model and trained it on an augmented dataset through the deep transfer learning concept. Deep transfer learning is the most common approach in which models are used as a starting point for solving problems and can be used later for another problem to save time [31]. The purpose of transfer learning is to gain a better understanding of conditional probability distribution. A source domain is
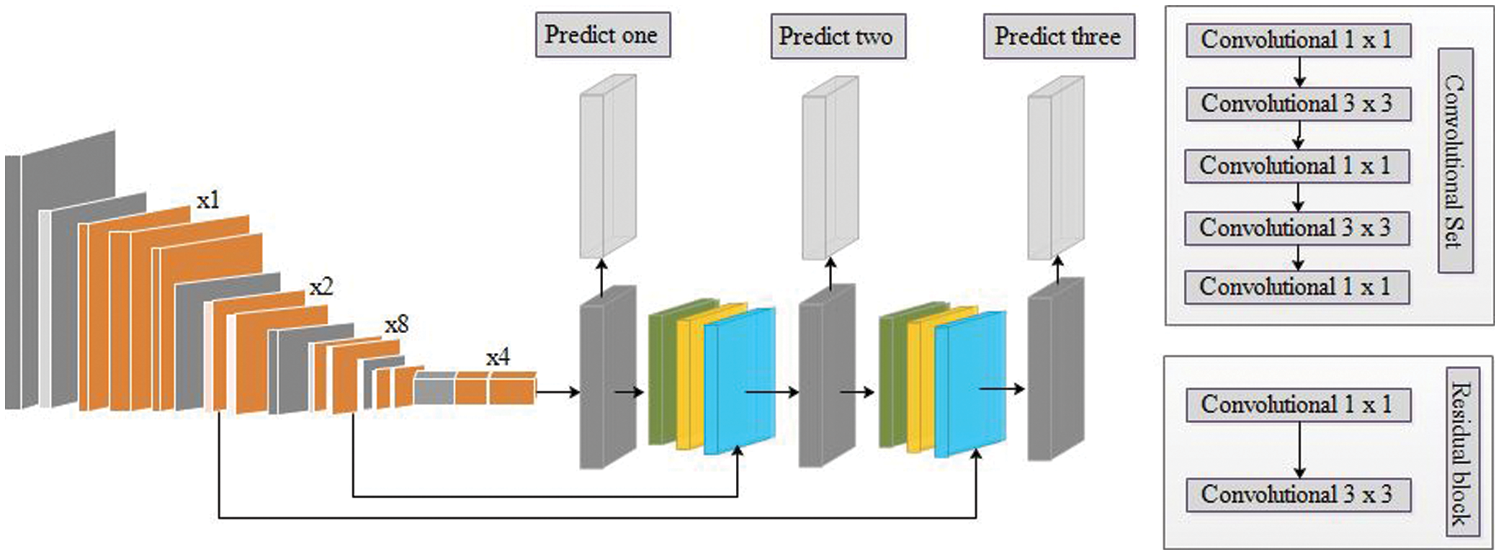
Figure 5: Structure of pre-trained Darknet53 model [32]
3.5 Improved Butterfly Optimization Based Features Selection
We proposed an improved butterfly optimization algorithm for the best feature selection in this paper. This step’s main goal is to select the best optimum features that improve accuracy and reduce computational time. Butterfly optimization is a meta-heuristic algorithm for selecting the best features. This algorithm promotes the butterfly’s ability to find food. Butterflies have multiple senses, including hearing, smelling, and tasting, as well as partner mating and evading hunters. Chemoreceptors are nerve cells that search for food. Chemoreceptors can use their sense of smell to locate food and a partner [33]. A butterfly can find the best fragrance population consisting of common types of butterflies that act as search agents. Butterfly optimization algorithm (BOA) is a swarm optimization technique in which each agent shares its experiences with the other butterflies depending on fragrance distribution over a distance [34]. In the improved version, we utilized the entropy function for the sensory modality instead of the static value. Mathematically, the improved algorithm is defined as follows: Initially, the fragrance is computed by the following equation:
where
where,
where,
where t is a constant of value between [0, 1]. The value of c is updated as follows:
where,
where,
The proposed deep learning and optimum feature selection based framework are tested on the augmented Plant Village dataset. The augmented dataset has been divided into a ratio of 60:40 for the training of the model and testing. During the training process, several hyperparameters have been employed, such as a learning rate is 0.0001, epochs are 100, momentum is 0.6, mini-batch size is 32, a weights optimization method is stochastic gradient descent, and loss function is cross entropy. The 10-fold method was carried out for cross-validation. The entire framework is implemented in MATLAB 2021b, Corei7, with 16 GB of RAM and an 8 GB graphics processing unit.
The proposed framework results are presented in this section. Ten different classifiers have been utilized for the classification purpose, as given in the below tables. Each classifier performance is computed through several measures such as sensitivity rate, precision rate, F1-Score, accuracy, and testing time for the classification task. In addition, the following experiments have been performed for the evaluation of the proposed framework: (i) experiment 1 # Apple leaf diseases recognition results; (ii) Grapes leaf diseases recognition results; (iii) Peach leaf diseases recognition results, and (iv) Cherry leaf diseases recognition results.
Experiment 1: In this experiment, classification results are discussed using the proposed framework on the augmented apple leaf diseases dataset. This dataset consists of four classes: apple scab, apple cedar rust, apple healthy, and black apple rust. Table 2 presents the proposed classification results for apple leaf disease recognition. This table presents the best accuracy of 100.0%, whereas the rest of the measures, such as sensitivity rate of 99.9, precision rate of 99.9, and F1-Score, are 99.9%, respectively. The sensitivity rate can also be verified by a confusion matrix, illustrated in Fig. 6. The classification time is also noted, and the best-mentioned time is 3.8041 (s). The obtained accuracy for the rest of the classifiers, such as 96.9%, 94.8%, 87.2%, 99.9%, and so on. Fine Gaussian SVM shows a minimum accuracy of 62.4% due to the complex structure of this classifier. Moreover, a time comparison among originally extracted Darknet53 features and features after the selection of the proposed framework has been illustrated in Fig. 7. This figure shows that the proposed framework significantly reduces the testing time than the original Darknet53 features.

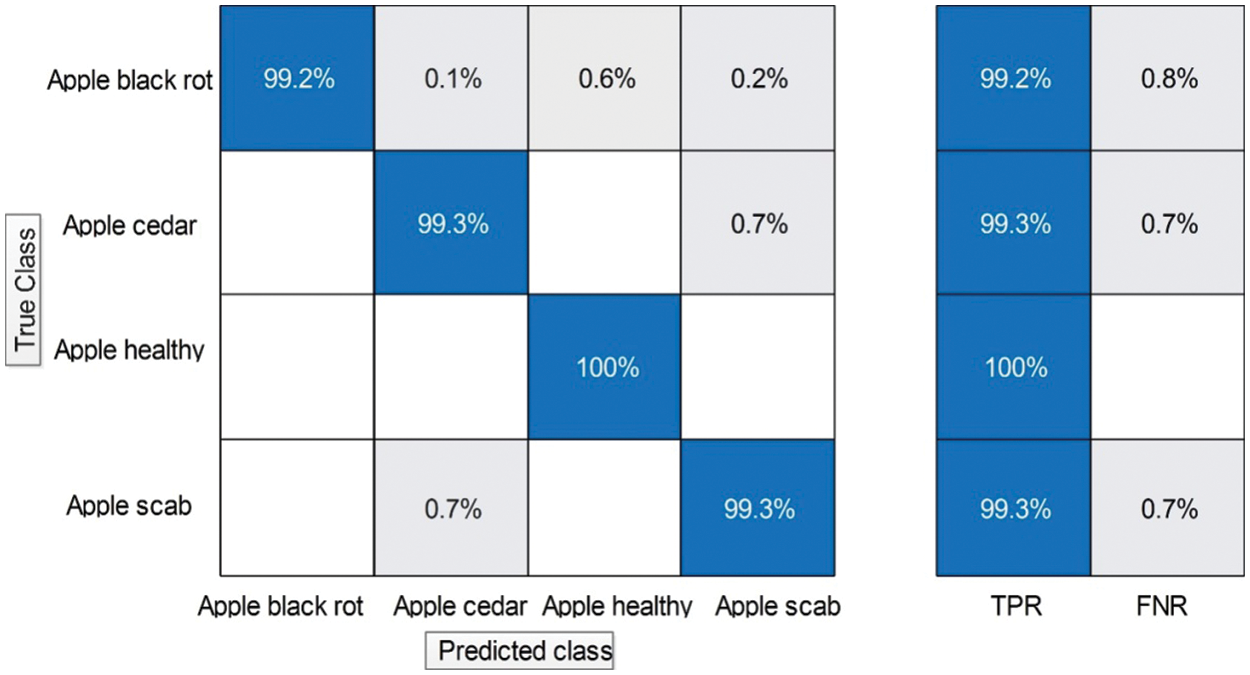
Figure 6: Confusion matrix of proposed framework for augmented apple leaf diseases recognition
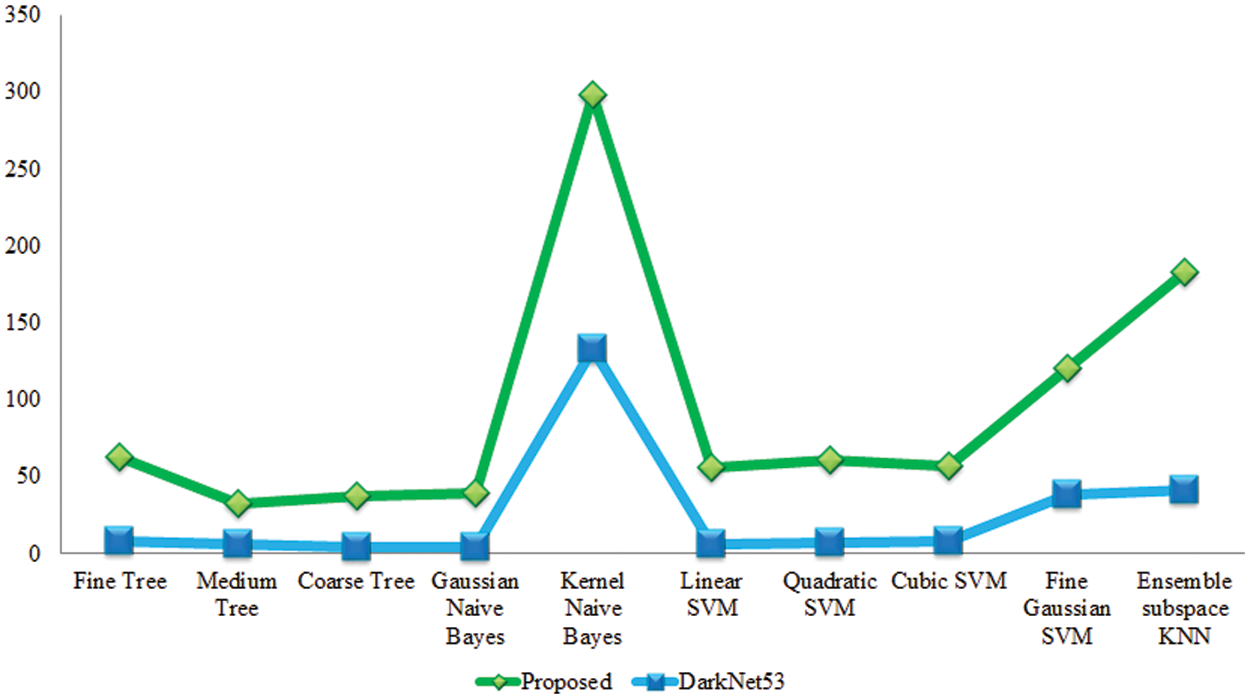
Figure 7: Testing time-based comparison among original Darknet53 features and proposed selected features
Experiment 2: In this experiment, classification results are discussed using the proposed framework on the augmented grapes leaf diseases dataset. This dataset consists of four classes: grape black rot, grape esca, grape leaf blight, and grape healthy. Table 3 presents the proposed classification results for grapes leaf disease recognition. This table shows the best accuracy of 99.9%, whereas the rest of the measures, such as sensitivity rate of 99.9, precision rate of 99.8, and F1-Score of 99.8%, respectively. The sensitivity rate can also be verified by a confusion matrix, illustrated in Fig. 8. The classification time is also noted, and the best-mentioned time is 3.3957 (s). Computational time based comparison is also conducted among originally extracted Darknet53 features and features after the selection of the proposed framework, as shown in Fig. 9. Based on this figure, it is clearly illustrated that the time is significantly reduced after the best features selection.

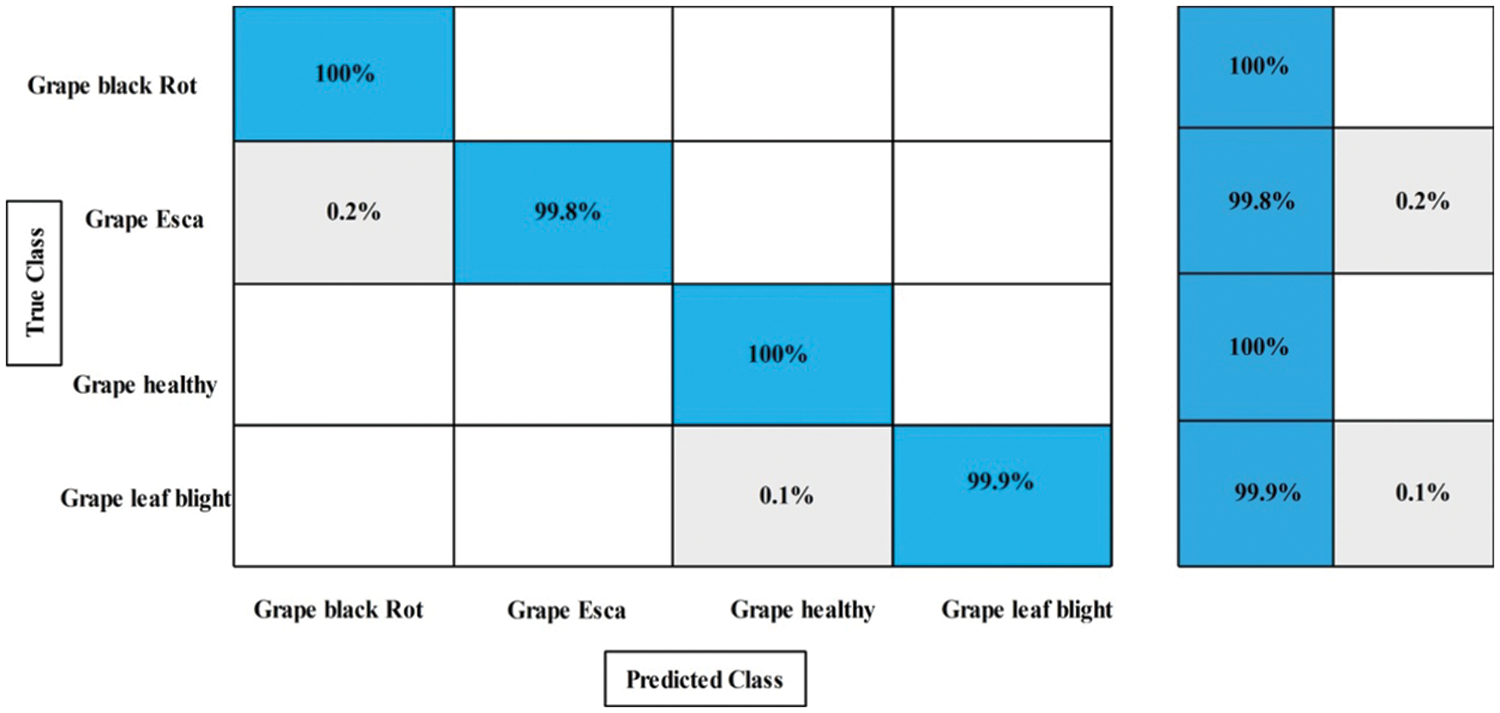
Figure 8: Confusion matrix of proposed framework for augmented grapes leaf diseases recognition
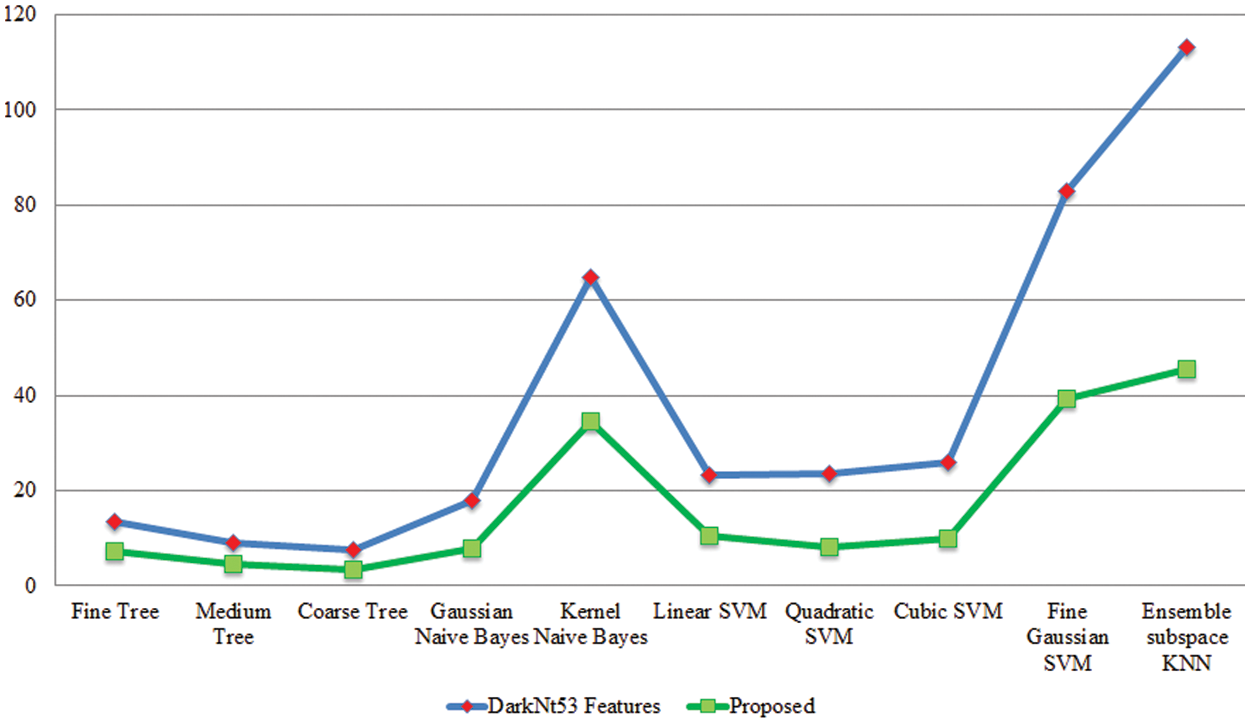
Figure 9: Testing time based comparison among original Darknet53 features and proposed selected features for grapes leaf diseases recognition
Experiment 3: In this experiment, classification results are discussed using the proposed framework on the augmented peach leaf diseases dataset. This dataset consists of two classes such as peach bacterial spot and healthy. Table 4 presents the proposed classification results for peach leaf disease recognition. This table presents the best accuracy of 99.9%, whereas the rest of the measures, such as sensitivity rate of 99.9, precision rate of 99.8, and F1-Score of 99.8%, respectively. The sensitivity rate can also be verified by a confusion matrix, illustrated in Fig. 10. The classification time is also noted, and the best-mentioned time is 3.0846 (s). Computational time based comparison is also conducted among originally extracted Darknet53 features and features after the selection of the proposed framework, as shown in Fig. 11. Based on this figure, it is clearly illustrated that the time is significantly reduced after the best features selection.
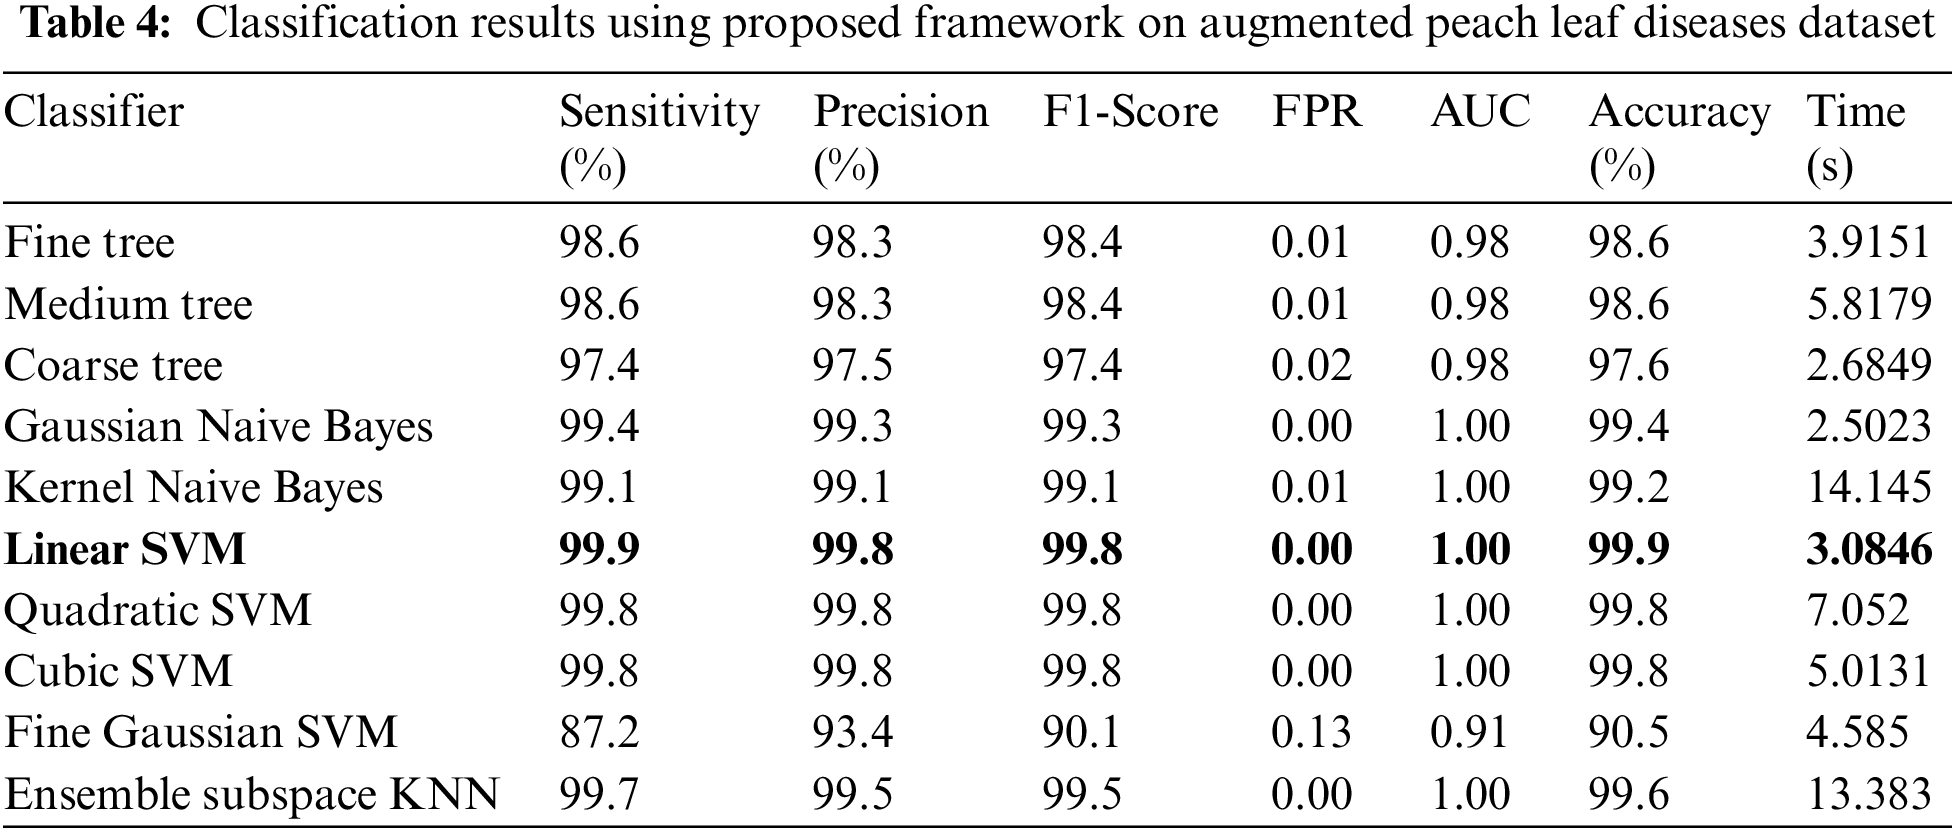

Figure 10: Confusion matrix of proposed framework for augmented peach leaf diseases recognition
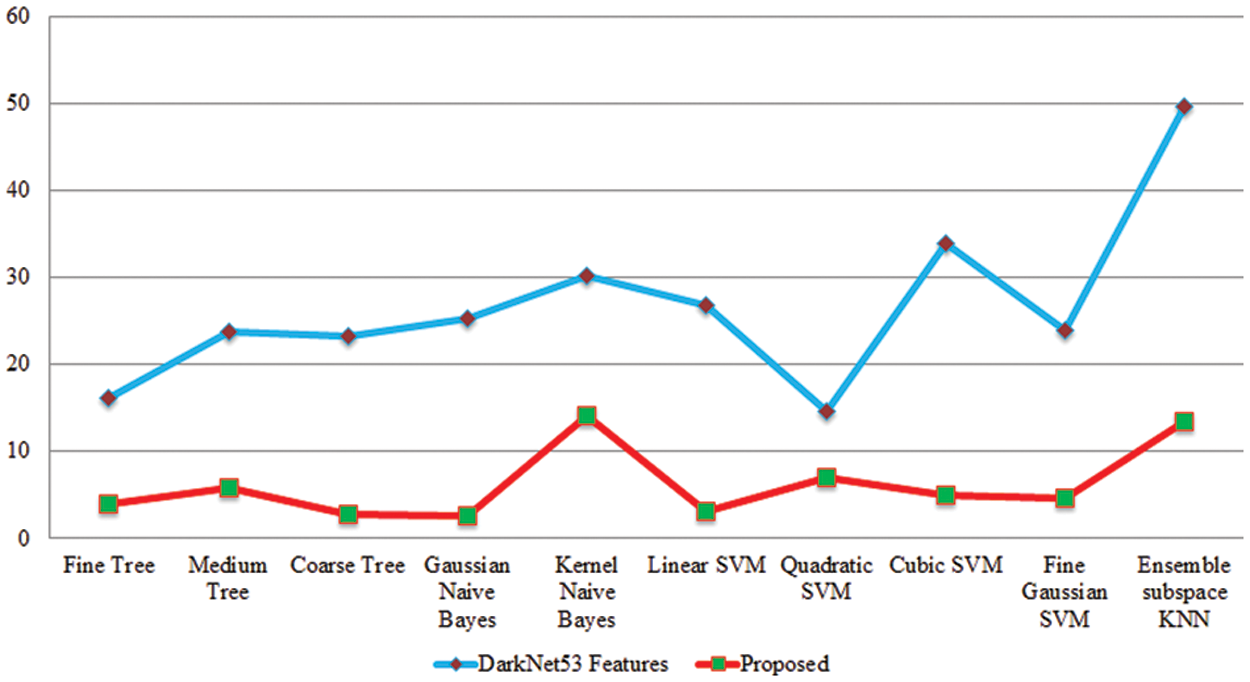
Figure 11: Testing time based comparison among original Darknet53 features and proposed selected features for peach leaf diseases recognition
Experiment 4: In the last experiment, classification results are discussed for the augmented cherry leaf diseases dataset. Table 5 presents the classification results for peach leaf disease recognition having the best accuracy of 100%. The rest of the measures, such as sensitivity rate of 100, precision rate of 100, and F1-Score 100%, respectively. The sensitivity rate can also be verified by a confusion matrix, illustrated in Fig. 12. The classification time is also noted, and the best-mentioned time is 1.7489 (s).
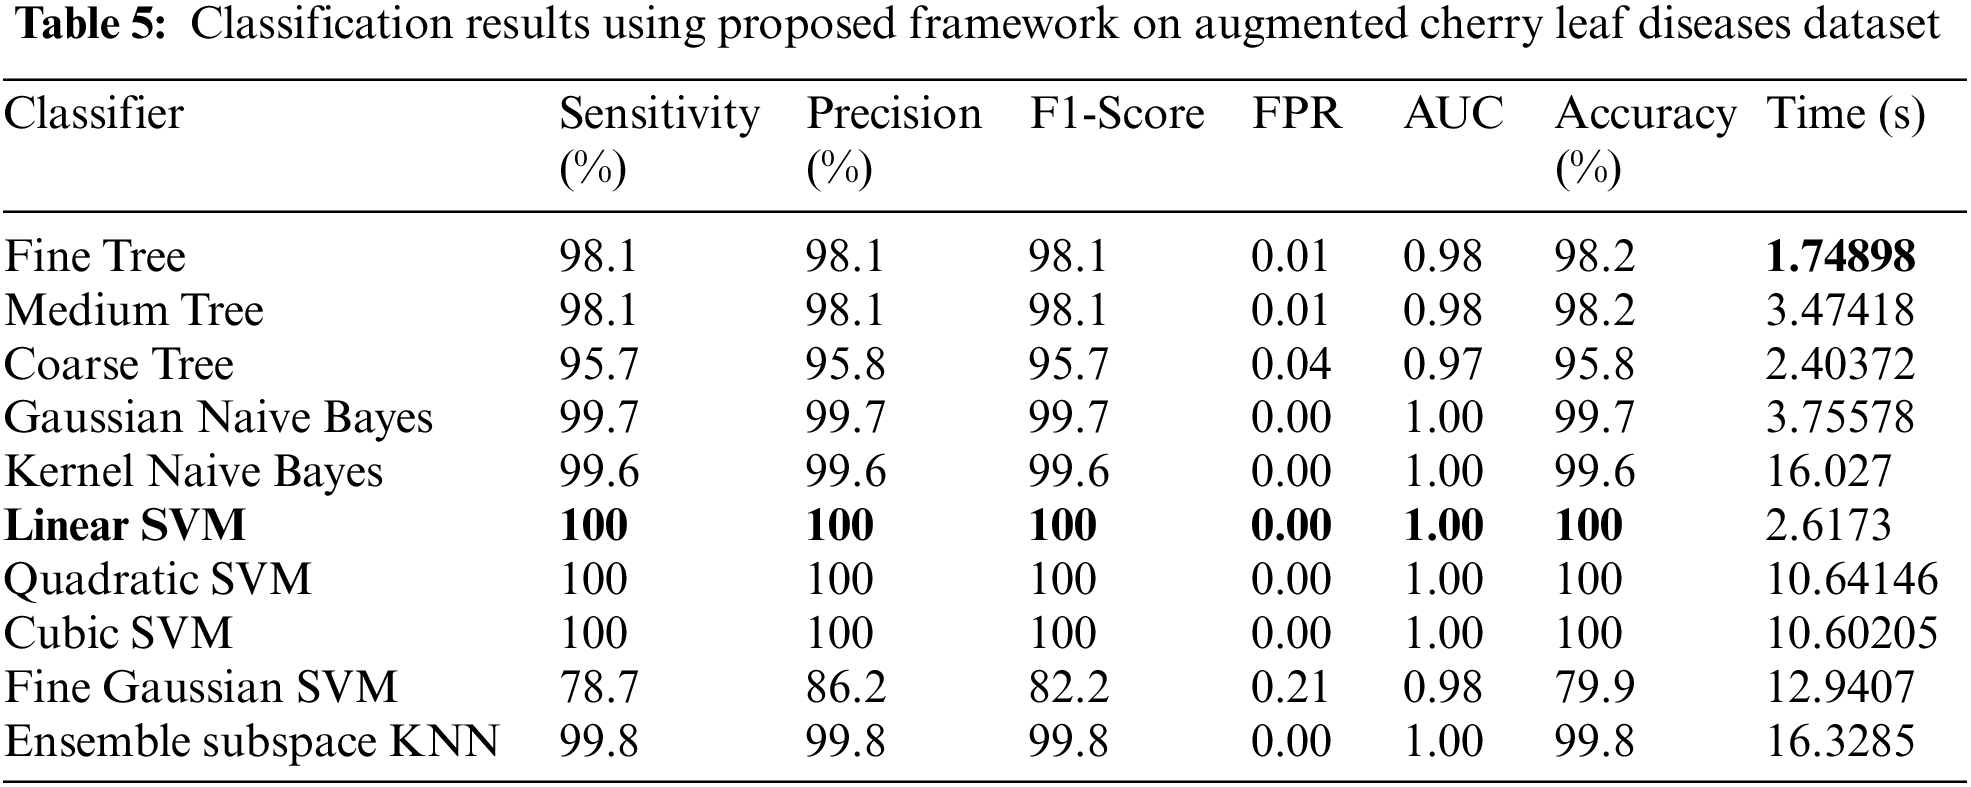
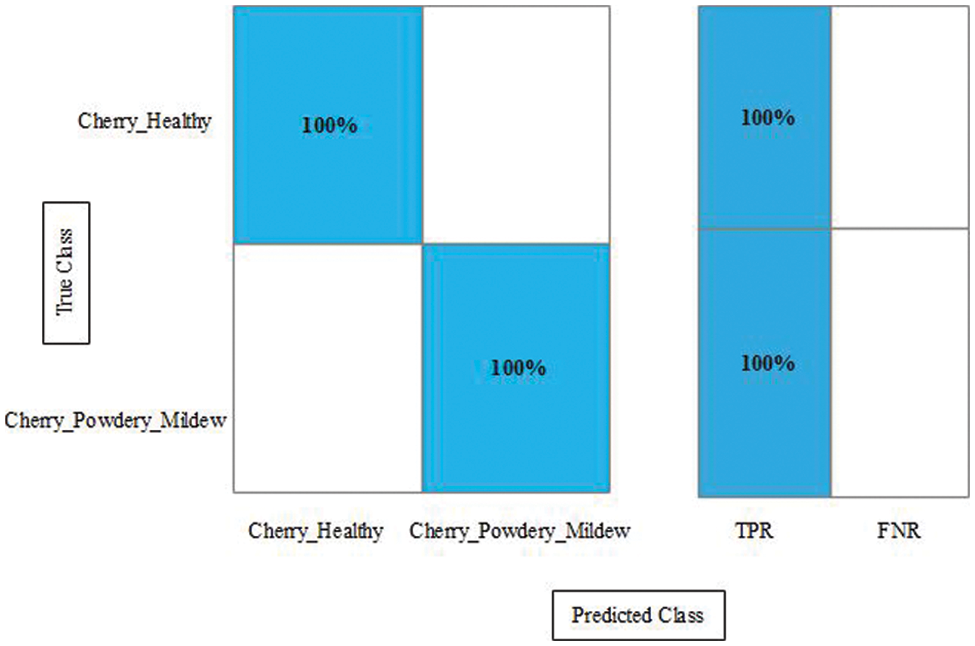
Figure 12: Confusion matrix of the proposed framework for augmented cherry leaf diseases recognition
In this paper, we proposed an automated framework for detecting fruit leaf diseases using deep learning and an improved butterfly optimization algorithm. Before performing data augmentation, the proposed framework improves contrast in the first step to increase the visibility of the infected region. The Darknet53 deep model was then fine-tuned, and deep learning features were extracted. We proposed an improved butterfly optimization algorithm for the best feature selection because the extracted features contain redundant and extra information, increasing computational time and decreasing accuracy. On the chosen Plant Village dataset, many experiments were run, with an average accuracy of more than 99%. Based on our findings, we concluded that selecting the best features improves accuracy while decreasing computational time. In the future, weight optimization will be considered to strengthen the proposed framework. Moreover, in the future some active learning techniques shall opt as fitness functions of optimization algorithms [35,36].
Funding Statement: This work was supported by BK21’s Innovative Talent Training Operation Fund and the Soonchunhyang University Research Fund.
Conflicts of Interest: The authors declare that they have no conflicts of interest to report regarding the present study.
References
1. D. Prasada, “Agriculture and economic development,” Agricultural Policy Analysis, vol. 1, no. 6, pp. 29–47, 2022. [Google Scholar]
2. M. Eichsteller, T. Njagi and E. Nyukuri, “The role of agriculture in poverty escapes in Kenya–Developing a capabilities approach in the context of climate change,” World Development, vol. 149, no. 41, pp. 105705, 2022. [Google Scholar]
3. A. B. Kamal, M. K. Sheikh, B. Azhar and M. R. Reed, “Role of agriculture extension in ensuring food security in the context of climate change: State of the art and prospects for reforms in Pakistan,” Food Security and Climate-Smart Food Systems, vol. 11, no. 3, pp. 189–218, 2022. [Google Scholar]
4. S. A. Raza, Y. Ali and F. Mehboob, “Role of agriculture in economic growth of Pakistan,” Food System, vol. 2, no. 1, pp. 1–12, 2012. [Google Scholar]
5. M. L. Dreher, “Whole fruits and fruit fiber emerging health effects,” Nutrients, vol. 10, no. 6, pp. 1833, 2018. [Google Scholar]
6. I. Amao, “Health benefits of fruits and vegetables: Review from sub-saharan Africa,” Vegetables: Importance of Quality Vegetables to Human Health, vol. 5, no. 2, pp. 33–53, 2018. [Google Scholar]
7. D. Prusky, I. Kobiler, I. Miyara and N. Alkan, “Fruit diseases,” in The Mango: Botany, Production and Uses, 2nd ed., London, UK: CABI Public, pp. 210–230, 2009. [Google Scholar]
8. A. Ippolito and F. Nigro, “Impact of preharvest application of biological control agents on postharvest diseases of fresh fruits and vegetables,” Crop Protection, vol. 19, no. 6, pp. 715–723, 2000. [Google Scholar]
9. A. Awate, D. Deshmankar, G. Amrutkar and S. Sonavane, “Fruit disease detection using color, texture analysis and ANN,” in 2015 Int. Conf. on Green Computing and Internet of Things (ICGCIoT), NY, USA, pp. 970–975, 2015. [Google Scholar]
10. A. A. Bharate and M. Shirdhonkar, “A review on plant disease detection using image processing,” in 2017 Int. Conf. on Intelligent Sustainable Systems (ICISS), NY, USA, pp. 103–109, 2017. [Google Scholar]
11. W. S. Gan, “Quantum image processing,” Quantum Acoustical Imaging, vol. 3, no. 2, pp. 83–86, 2022. [Google Scholar]
12. J. Zhou, L. Liu, W. Wei and J. Fan, “Network representation learning: From preprocessing, feature extraction to node embedding,” ACM Computing Surveys, vol. 55, no. 12, pp. 1–35, 2022. [Google Scholar]
13. Z. H. Arif, M. A. Mahmoud, K. H. Abdulkareem, M. A. Mohammed and M. N. Al-Mhiqani, “Comprehensive review of machine learning (ML) in image defogging: Taxonomy of concepts, scenes, feature extraction, and classification techniques,” IET Image Processing, vol. 16, no. 5, pp. 289–310, 2022. [Google Scholar]
14. M. Chavent, R. Genuer and J. Saracco, “Combining clustering of variables and feature selection using random forests,” Communications in Statistics-Simulation and Computation, vol. 50, no. 16, pp. 426–445, 2021. [Google Scholar]
15. D. A. Stenkin, “Solving partial differential equations on radial basis functions networks and on fully connected deep neural networks,” in Proc. of the Int. Conf. on Intelligent Vision and Computing (ICIVC 2021), NY, USA, pp. 240, 2022. [Google Scholar]
16. Z. u. Rehman, F. Ahmed, R. Damaševičius and S. R. Naqvi, “Recognizing apple leaf diseases using a novel parallel real-time processing framework based on MASK RCNN and transfer learning: An application for smart agriculture,” IET Image Processing, vol. 15, no. 3, pp. 2157–2168, 2021. [Google Scholar]
17. F. A. Shah, M. Sharif, U. Tariq, A. Khan and S. Kadry, “A cascaded design of best features selection for fruit diseases recognition,” Computers, Material and Continua, vol. 69, no. 3, pp. 1–15, 2022. [Google Scholar]
18. A. Adeel, M. Sharif, F. Azam, J. H. Shah and T. Umer, “Diagnosis and recognition of grape leaf diseases: An automated system based on a novel saliency approach and canonical correlation analysis based multiple features fusion,” Sustainable Computing: Informatics and Systems, vol. 24, no. 5, pp. 100349, 2019. [Google Scholar]
19. R. Yamparala, R. Challa, V. Kantharao and P. S. R. Krishna, “Computerized classification of fruits using convolution neural network,” in 2020 7th Int. Conf. on Smart Structures and Systems (ICSSS), NY, USA, pp. 1–4, 2020. [Google Scholar]
20. S. Baranwal, S. Khandelwal and A. Arora, “Deep learning convolutional neural network for apple leaves disease detection,” in Proc. of Int. Conf. on Sustainable Computing in Science, Technology and Management (SUSCOM), Amity University Rajasthan, Jaipur-India, pp. 1–6, 2019. [Google Scholar]
21. T. A. Wagh, R. Samant, S. V. Gujarathi and S. B. Gaikwad, “Grapes leaf disease detection using convolutional neural network,” International Journal of Computational Applications, vol. 178, no. 45, pp. 7–11, 2019. [Google Scholar]
22. T. P. Nhat and S. V. T. Dao, “15 plant leaf disease classification based on feature selection and deep neural network,” Internet of Things and Machine Learning in Agriculture, vol. 6, no. 2, pp. 293–322, 2022. [Google Scholar]
23. T. Akram, M. Sharif, M. Awais, K. Javed and H. Ali, “CCDF: Automatic system for segmentation and recognition of fruit crops diseases based on correlation coefficient and deep CNN features,” Computers and Electronics in Agriculture, vol. 155, no. 3, pp. 220–236, 2018. [Google Scholar]
24. S. Sladojevic, M. Arsenovic, A. Anderla and D. Stefanovic, “Deep neural networks based recognition of plant diseases by leaf image classification,” Computational Intelligence and Neuroscience, vol. 16, no. 6, pp. 1–21, 2016. [Google Scholar]
25. T. Akram, M. Sharif and T. Saba, “Fruits diseases classification: Exploiting a hierarchical framework for deep features fusion and selection,” Multimedia Tools and Applications, vol. 79, no. 5, pp. 25763–25783, 2020. [Google Scholar]
26. J. S. H. Al-bayati and B. B. Üstündağ, “Early and late fusion of deep convolutional neural networks and evolutionary feature optimization for plant leaf illness recognition,” Journal of Xi’an University of Architecture & Technology, vol. 12, no. 3, pp. 1591–1610, 2020. [Google Scholar]
27. A. Adeel, T. Akram, A. Sharif, M. Yasmin and T. Saba, “Entropy-controlled deep features selection framework for grape leaf diseases recognition,” Expert Systems, vol. 4, no. 2, pp. 1–23, 2020. [Google Scholar]
28. C. Shorten, T. M. Khoshgoftaar and B. Furht, “Text data augmentation for deep learning,” Journal of Big Data, vol. 8, no. 4, pp. 1–34, 2021. [Google Scholar]
29. J. Guo, K. Han, H. Wu, Y. Tang and Y. Wang, “Cmt: Convolutional neural networks meet vision transformers,” in Proc. of the IEEE/CVF Conf. on Computer Vision and Pattern Recognition, NY, USA, pp. 12175–12185, 2022. [Google Scholar]
30. J. Redmon and A. Farhadi, “Yolov3: An incremental improvement,” ArXiv Preprint, vol. 1, no. 2, pp. 1–8, 2018. [Google Scholar]
31. W. Li, R. Huang, J. Li, Y. Liao and G. He, “A perspective survey on deep transfer learning for fault diagnosis in industrial scenarios: Theories, applications and challenges,” Mechanical Systems and Signal Processing, vol. 167, no. 41, pp. 108487, 2022. [Google Scholar]
32. H. Wang, F. Zhang and L. Wang, “Fruit classification model based on improved Darknet53 convolutional neural network,” in 2020 Int. Conf. on Intelligent Transportation, Big Data & Smart City (ICITBS), NY, USA, pp. 881–884, 2020. [Google Scholar]
33. A. Mortazavi and M. Moloodpoor, “Enhanced butterfly optimization algorithm with a new fuzzy regulator strategy and virtual butterfly concept,” Knowledge-Based Systems, vol. 228, no. 8, pp. 107291, 2021. [Google Scholar]
34. S. Arora and S. Singh, “Butterfly optimization algorithm: A novel approach for global optimization,” Soft Computing, vol. 23, no. 4, pp. 715–734, 2019. [Google Scholar]
35. P. M. Blok, G. Kootstra, H. E. Elghor, B. Diallo and E. J. van Henten, “Active learning with MaskAL reduces annotation effort for training Mask R-CNN on a broccoli dataset with visually similar classes,” Computers and Electronics in Agriculture, vol. 197, no. 6, pp. 106917, 2022. [Google Scholar]
36. Y. Yang, Y. Li, J. Yang and J. Wen, “Dissimilarity-based active learning for embedded weed identification,” Turkish Journal of Agriculture and Forestry, vol. 46, no. 3, pp. 390–401, 2022. [Google Scholar]
Cite This Article
 Copyright © 2023 The Author(s). Published by Tech Science Press.
This work is licensed under a Creative Commons Attribution 4.0 International License , which permits unrestricted use, distribution, and reproduction in any medium, provided the original work is properly cited.
 Downloads
 Citation Tools