
 Submit a Paper
 Propose a Special lssue
 Open Access
ARTICLE

MPFracNet: A Deep Learning Algorithm for Metacarpophalangeal Fracture Detection with Varied Difficulties
1 College of Quality and Technical Supervision, Hebei University, Baoding, 071002, China
2 Hebei Technology Innovation Center for Lightweight of New Energy Vehicle Power System, Baoding, 071002, China
3 National & Local Joint Engineering Research Center of Metrology Instrument and System, Hebei University, Baoding, 071002, China
* Corresponding Author: Linyan Xue. Email:
Computers, Materials & Continua 2023, 75(1), 999-1015. https://doi.org/10.32604/cmc.2023.035777
Received 03 September 2022; Accepted 26 October 2022; Issue published 06 February 2023
 View Full Text
 Download PDF
Abstract
Due to small size and high occult, metacarpophalangeal fracture diagnosis displays a low accuracy in terms of fracture detection and location in X-ray images. To efficiently detect metacarpophalangeal fractures on X-ray images as the second opinion for radiologists, we proposed a novel one-stage neural network named MPFracNet based on RetinaNet. In MPFracNet, a deformable bottleneck block (DBB) was integrated into the bottleneck to better adapt to the geometric variation of the fractures. Furthermore, an integrated feature fusion module (IFFM) was employed to obtain more in-depth semantic and shallow detail features. Specifically, Focal Loss and Balanced L1 Loss were introduced to respectively attenuate the imbalance between positive and negative classes and the imbalance between detection and location tasks. We assessed the proposed model on the test set and achieved an AP of 80.4% for the metacarpophalangeal fracture detection. To estimate the detection performance for fractures with different difficulties, the proposed model was tested on the subsets of metacarpal, phalangeal and tiny fracture test sets and achieved APs of 82.7%, 78.5% and 74.9%, respectively. Our proposed framework has state-of-the-art performance for detecting metacarpophalangeal fractures, which has a strong potential application value in practical clinical environments.Keywords
Metacarpophalangeal fractures are among the most common skeletal injuries, accounting for 10% of all fractures [1]. Due to its efficiency, accessibility, and low cost, radiography is one of the most used primary imaging tools for the initial assessment of metacarpophalangeal trauma in clinic, in which doctors visually inspect the fractures according to the anatomical location, fragmentation and displacement levels [2]. However, diagnostic performance is commonly affected by clinical experience, workload, fatigue, etc. In addition, X-ray images cannot clearly present the texture features of tiny fractures. Thus, the minor metacarpal fracture is difficult to detect [3]. Unfortunately, misdiagnoses or missed diagnoses of fractures could have a devastating impact on subsequent function. Therefore, precise and prompt identification of fractures is meaningful for prognosis and treatment.
Recently, Computer-aided diagnosis (CAD) based on deep learning (DL) has been widely used for automatic fracture detection and classification in X-ray images of various body regions, such as shoulder [2], vertebra [4], hip [5–9], thigh [10,11], knee [12], ankle fracture [13], radius [14], wrist [15] and arm [16]. However, these studies mainly discussed the diagnosis of fractures in relatively large bones with clear fracture curves and few joints, which were easily evaluated. In contrast, metacarpophalangeal bones, especially phalangeal bones, have small sizes as well as more joints, resulting in the difficulty of distinguishment between the multi-scale fracture curves and the subtle joints. Besides, X-ray images are common with low imaging quality and less learnable information, leading to radiographically invisible or feature information loss. Therefore, it is difficult for doctors to detect and diagnose metacarpophalangeal fractures in radiographs. Inspired by these observations, we propose a novel deep-learning model to automatically detect and locate metacarpophalangeal fractures in X-ray images more accurately and efficiently.
The major contributions of this work are as follows. (I) An improved one-stage network called MPFracNet was proposed to detect metacarpophalangeal fractures with multi-scale sizes in X-ray images efficiently. (II) We integrated the deformable convolution and the integrated feature fusion module into RetinaNet to accurately extract geometric deformation features from different network layers. Moreover, we adopted Focal Loss and Balanced L1 Loss to overcome the imbalance between fracture-positive and fracture-negative samples in the training process. (III) We divided metacarpal and phalangeal fractures into different test sets to evaluate the detection performance of the proposed network for fractures with different difficulties, especially in the detection of tiny fractures.
The rest of the paper is organized as follows. The most related works, including the detection of fractures, are briefly reviewed in Section 2. The dataset details and the composition of each module in MPFracNet are described in Section 3. Section 4 presents the composition of experimental detail, implementation platform, workflow and evaluation standard. We discussed the effectiveness of each key module of our MPFracNet and compared our MPFracNet with other state-of-the-art methods in Section 5. Finally, the paper is concluded in Section 6.
In this section, we briefly review existing methods in the literature that are closely related to our study, including those for general fracture classification tasks as well as fracture object detection tasks.
2.1 Image Classification Methods
We have investigated the relevant literature on fracture classification. Classification methods [2,4–7,9,12–14] trained deep neural networks that output per-image classification scores and calculated losses against the image-level labels. Chung et al. [2] evaluated the accuracy of detecting and classifying the proximal humeral fractures on anteroposterior plain (AP) shoulder radiographs. They classified the proximal humerus fractures into four types based on Neer’s classification. The top-1 accuracy in distinguishing normal and fracture displayed more than 95% (96%, CI 94%–97%), and in different fracture types exhibited 65%–86%. Chen et al. [4] trained ResNeXt-50 to diagnose vertebral fractures. Urakawa et al. [5] trained VGG-16 for intertrochanteric hip fractures detection, which the CNN has better performance than orthopedic surgeons. Cheng et al. [6] used Densenet-121 as the backbone structure of the neural network. They pre-trained the network with the limb dataset, using transfer learning methods to fine-tune the training of frontal pelvic plain images. Tanzi et al. [7] verified that the CAD method based on CNN is feasible in the classification of proximal femoral fractures. Krogue et al. [9] studied the automatic classification of hip fractures with DenseNet, gaining a binary accuracy for detecting fractures of 93.7% and a multi-classification accuracy of 90.8%. Lind et al. [12] showed that CNN could be employed for fracture classification around the knee. Olczak et al. [13] trained a neural network based on the ResNet architecture on 4,941 radiographic ankle examinations. All images were classified according to the AO/OTA 2018 classification. A senior orthopedic surgeon (MG) then re-evaluated all images with fractures. Kim et al. [14] employed DenseNet-161 and ResNet-152 to detect distal radius fractures, with accuracy rates of 0.962 and 0.947 respectively. Most of the above studies focus on classification tasks. For clinical fracture detection, it is crucial to locate the position of the fracture.
In recent years, deep learning-based object detection methods [8,10,11,15–17] have made great progress in medical image fracture detection. Zhang et al. [8] proposed a point-based annotation scheme and Window Loss for the inherent visual ambiguity of pelvic fractures, which achieved an area under the curve (AUC) of 0.983. Guan et al. [10] constructed the dilated convolutional feature pyramid structure and applied it to thigh fracture detection. The average accuracy (AP) on 358 test thigh images reaches 82.1%. Wang et al. [11] designed multiple parallel backbone networks and a feature fusion connection structure to detect and locate thigh fractures. The framework achieved 87.8% AP50 and 49.3% AP75. Gan et al. [15] trained the CNN to analyze wrist radiographs in the dataset. The feasibility of the object detection algorithm was evaluated by the intersection of the union (IOU). Guan et al. [16] designed a new backbone network based on feature pyramid architecture and exploited the receptive filed adjustment containing anchor scale reduction and tiny ROIs expansion to fracture detection in arm X-ray images. The network achieved a state-of-the-art average precision of 62.04% on arm fracture detection. Despite various studies that have been performed regarding automatic fracture detection, there is a lack of research evaluating deep learning for metacarpophalangeal fracture detection. Only Xue et al. [17] assessed metacarpophalangeal fractures with an improved Faster R-CNN, which increased the detection performance by the learnable anchoring scheme. However, they did not focus on the characteristics of the small targets of metacarpophalangeal fractures and the different difficulties of detecting metacarpal and phalangeal fractures. In addition, the GA_Faster R-CNN is a two-stage network with high accuracy but low speed and the training process is relatively expensive.
To build a dataset containing abundant data sources, our dataset is collected with different imaging systems. In the first part, we retrospectively review the patients who visited the Affiliated Hospital of Hebei University and underwent conventional radiography for metacarpophalangeal fractures from January 1, 2016 to December 31, 2019. All hand radiographs are downloaded in Digital Imaging and Communications in Medicine (DICOM) from the Picture Archiving and Communication System (PACS) and converted to JPG through format conversion software. In the second part, we collect the X-ray images of patients with metacarpophalangeal fractures in Baoding Derun Orthopedic Hospital in the same way and save the images in the format of JPG. In the third part, MURA [18] is downloaded from the internet, which is one of the largest public radiographic image datasets published in Jan 2018. It contains 40895 multi-view radiographic of the upper limb including the finger, hand, wrist, forearm, elbow, humerus and shoulder. We selected the positive X-ray images of the finger and hand in it.
As a reference standard, two professional orthopedic doctors manually label fractures in all radiographs according to the corresponding pathological reports. Some radiographs with foreign matters, blurred and inconsistent opinions of doctors are excluded. Finally, the dataset used for model development contains 6268 radiographs of 2029 patients, including 3067 radiographs of 794 patients from the Affiliated Hospital of Hebei University, 1708 radiographs of 598 patients from Baoding Derun Hospital, and 1493 radiographs of 637 patients come from the MURA. Each image embodies at least one fracture.
The detection difficulty of hand fractures varies on different scales. To evaluate the performance of the network for fracture detection at different difficulty levels, the fractures in the test set were divided into two groups: metacarpal fractures whose curves are relatively clear and thus easier to be detected, and phalangeal fractures whose sizes are generally smaller and harder to be detected than metacarpal fractures. Thus, 350 metacarpal and 350 phalangeal fracture radiographs are selected as the test set for checking the performance of the proposed model in detecting metacarpal and phalangeal fractures with varied difficulties, named “MF-test set” and “PF-test set”, respectively. Furthermore, a tiny fracture test set in which the area is less than 1% of the whole radiograph is built on the above two test sets. Three hundred radiographs containing more smaller-scale fractures, in which the area of each marked fracture is less than 5% of the whole image area, are selected to evaluate the performance of the proposed model in a tiny object that is more difficult to detect, named “Ti-test set”. All 700 radiographs include metacarpal and phalangeal fractures as the overall test set to evaluate the performance of the proposed model in the whole metacarpophalangeal fractures, named “Test set”, and the remaining 5568 images are used as the training set. Fig. 1 shows the overview of the dataset.
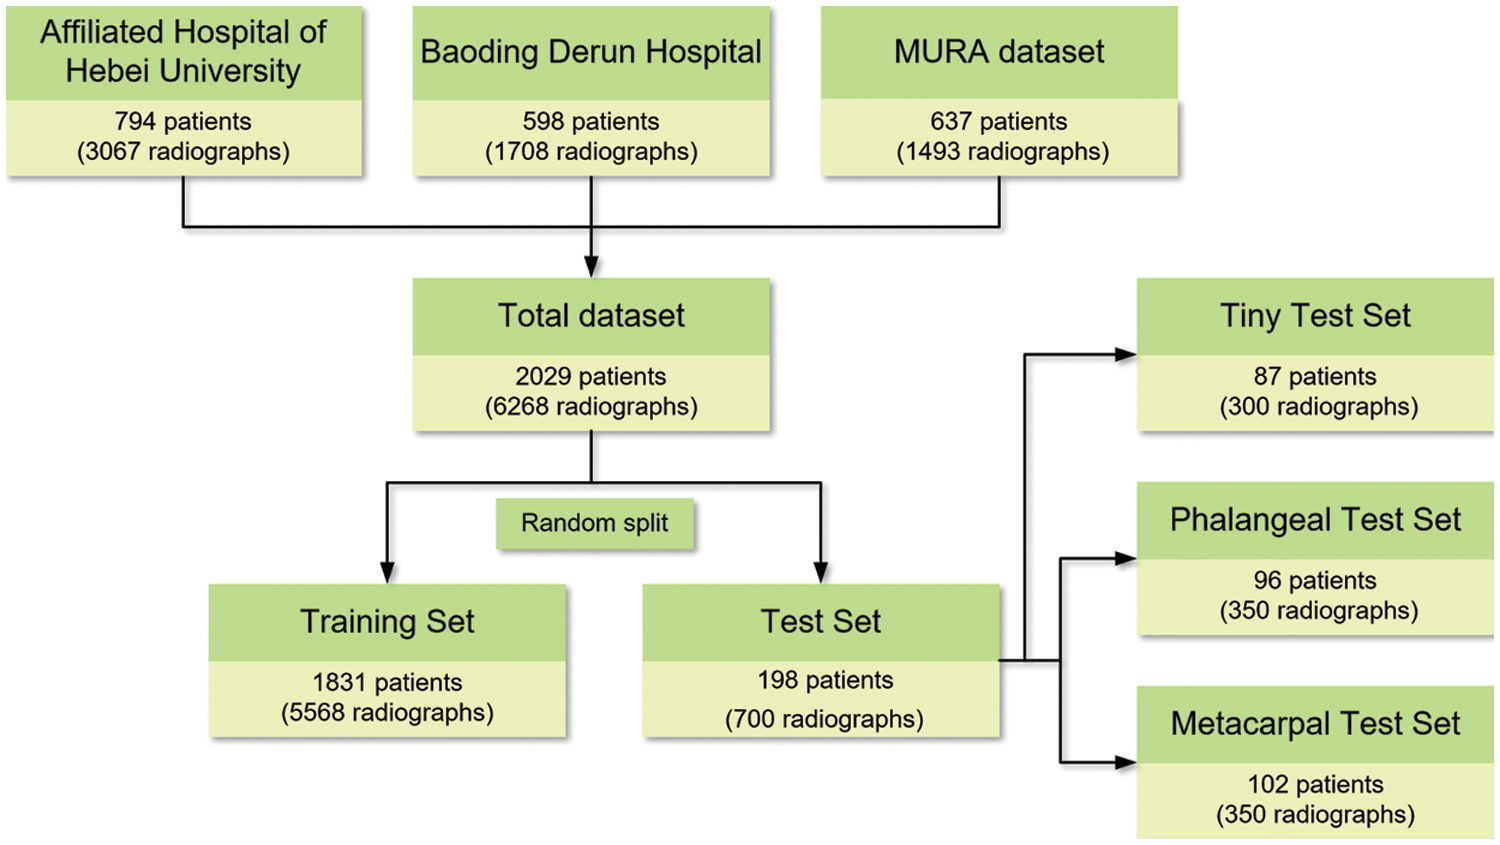
Figure 1: Overview of the datasets
Considering the training dataset totally including 5568 images is not enough to fine-tune the network which has been pre-trained on ImageNet. To generate the training network of metacarpal and phalangeal fracture X-ray images, we employ horizontal flipping to augment the data in the training procedure. Besides, considering that the original images collected in MURA have low brightness and the features are unobvious, we carry on image preprocessing by Gaussian filter, which can preserve the gray distribution characteristics of the images while reducing the noise. At the same time, we also carry out linear transformation and histogram equalization to enhance the image contrast.
There are significant differences between one-stage and two-stage networks concerning learning accuracy and speed. The one-stage network is generally associated with low accuracy and high speed, whereas a two-stage network tends to be more accurate at a lower speed. The proposed deep convolutional neural network takes a one-stage network, termed RetinaNet [19], as the basic network and makes certain improvements for better performance in metacarpophalangeal fracture detection. By giving more detailed descriptions, we briefly introduce the overview of the proposed MPFracNet, which is illustrated in Fig. 2. In MPFracNet, ResNet [20] is adopted as a backbone network to extract feature maps, and the deformable bottleneck block are applied to enhance the extraction capability of the multi-scale and irregular features. The last layer of each stage of the backbone network is used to construct the feature pyramid network (FPN) [21] by top-down pathway and lateral connections. Besides, an integrated feature fusion architecture is established to improve the accuracy of small objects. The strengthened feature maps {S2, S3, S4, S5, S6} with five different scales are used as input to the next two subsets, in which object classification and bounding box regression are carried out. Finally, Focal Loss evaluates the difference between the proposals and ground truths, both classification loss and location loss are calculated, and Balanced L1 Loss balances multi-tasks to achieve a better convergence.
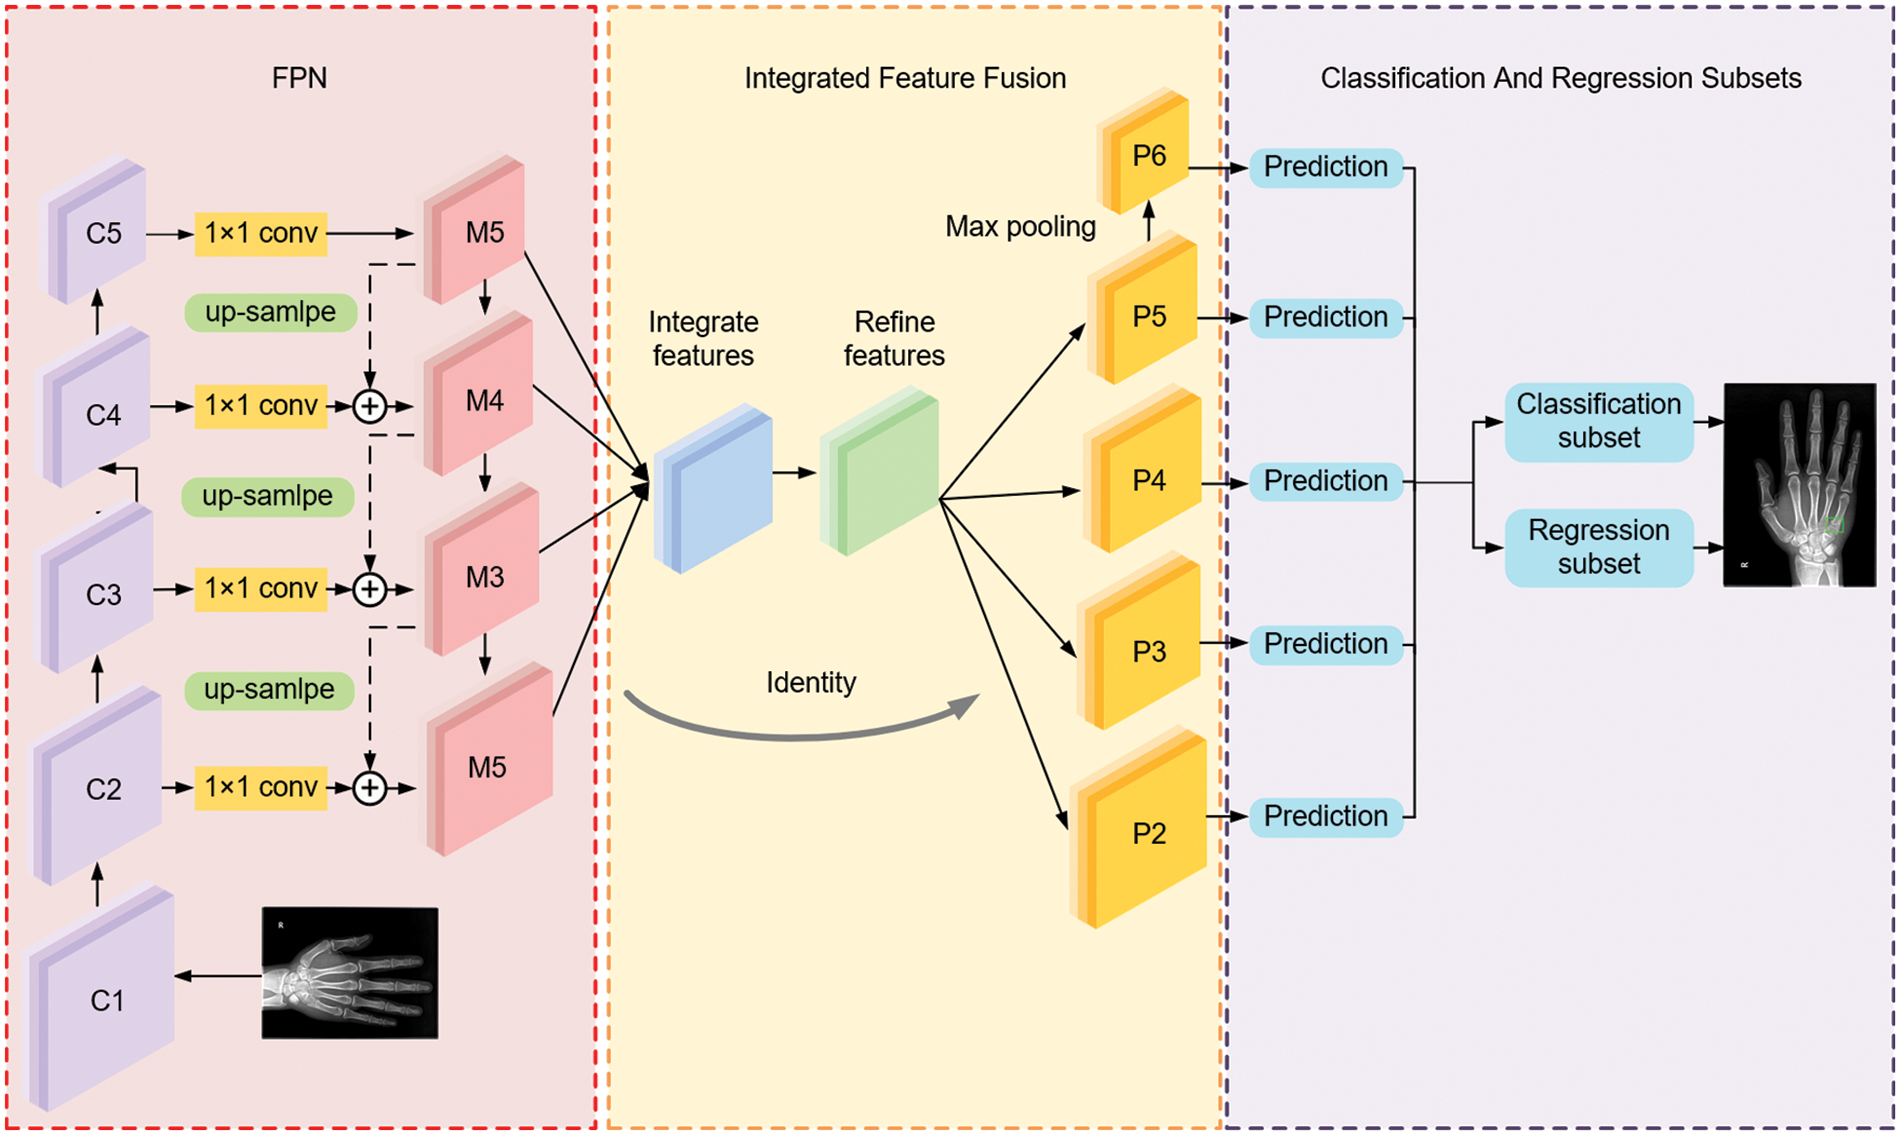
Figure 2: The overall architecture of MPFracNet
3.2.1 Proposed Bottleneck Block
ResNet [20] is one of the most classical deep convolutional neural networks, in which a residual structure with shortcut connections is adopted to solve the degradation problem as the network depth increases. The original ResNet is composed of 5 stages, and the feature maps output from each stage can be denoted as C1, C2, C3, C4, and C5, respectively. Stage 1 is composed of a 7 × 7 convolutional kernel and a 3 × 3 max-pooling layer, while stages 2 to 5 are composed of several bottleneck blocks. In ResNet50 and ResNet101, stages 2 to 5 contain 3, 4, 6, 3 and 3, 4, 23, 3 bottleneck blocks, respectively. The structure of each bottleneck block is shown in Fig. 3(1). There are three convolution kernels in each bottleneck block: the first 1 × 1 convolution kernel is used to decrease the input channels to 1/4 to decrease the amount of calculation, the second 3 × 3 convolution kernel is employed to extract features for the network, and then the final 1 × 1 kernel increases the channels to the input amounts.
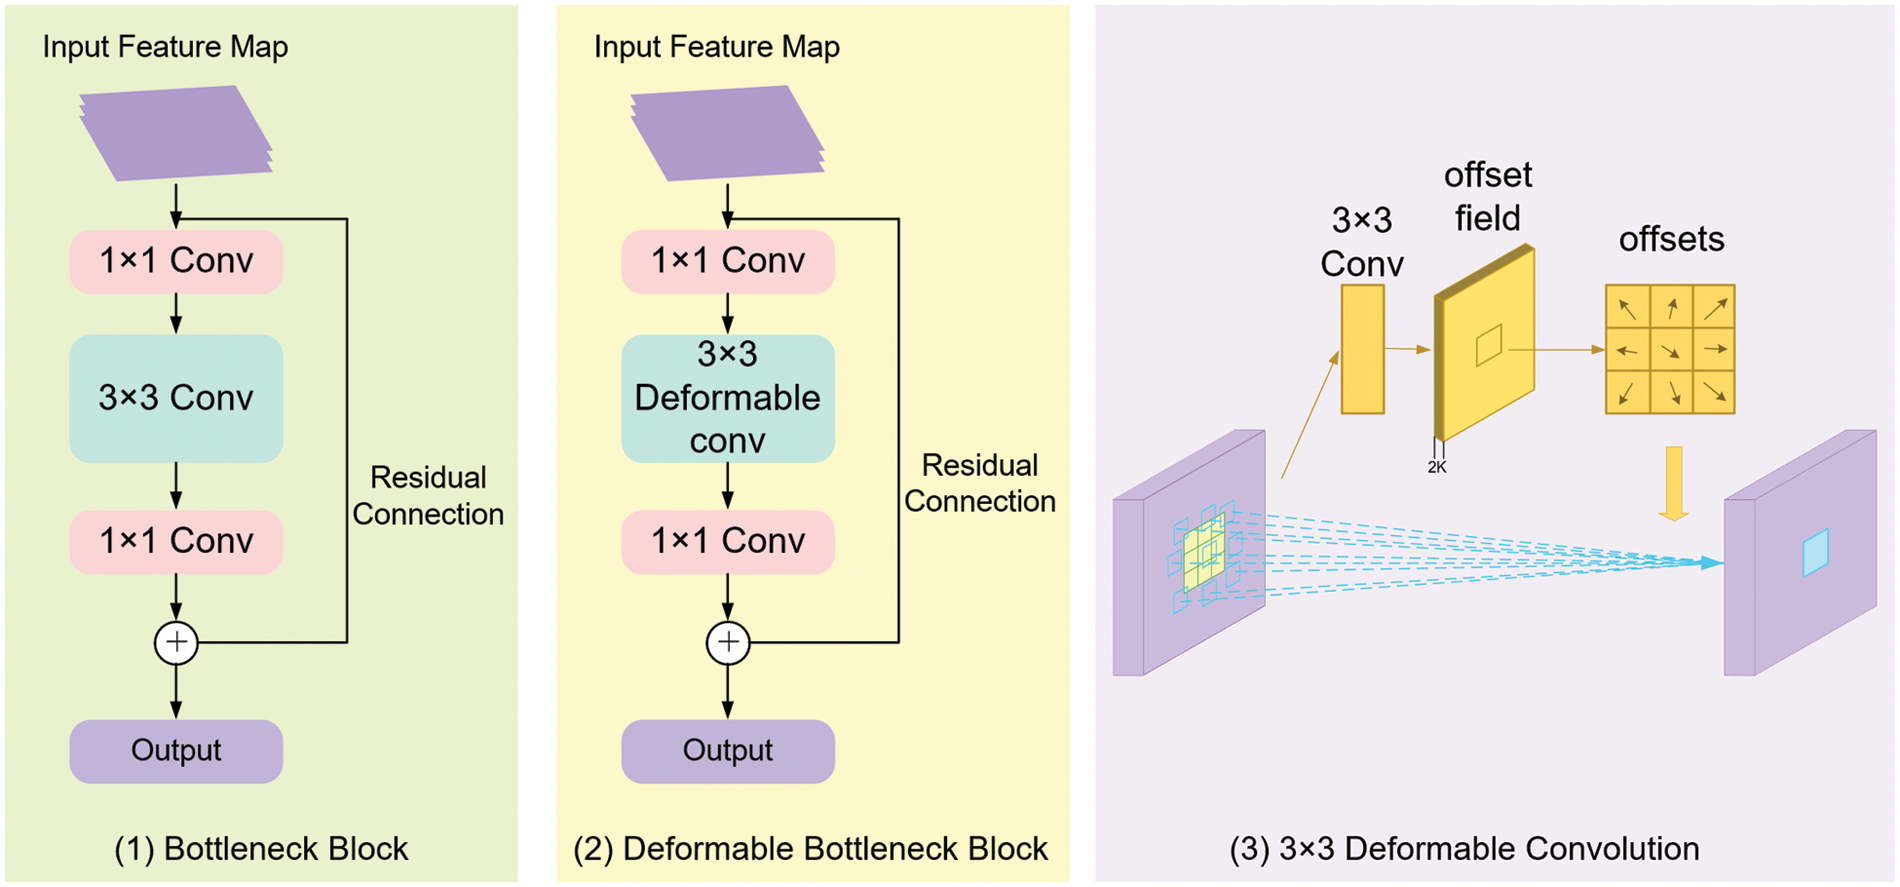
Figure 3: The architecture of (1) Bottleneck block; (2) Deformable bottleneck block and (3) 3 × 3 deformable convolution
However, regarding the multi-scale structure and irregular shape of metacarpophalangeal fracture curves, traditional convolution is difficult to extract variational fracture features at different scales from the input radiographs. In this paper, a novel bottleneck block employing a 3 × 3 deformable convolution [22] rather than the 3 × 3 general convolution is proposed to enhance the feature extraction performance of metacarpophalangeal fracture detection (see Fig. 3(2)).
As illustrated in Fig. 3(3), concerning an input feature map, the offsets are obtained by applying another 3 × 3 convolutional kernel with the same spatial resolution and dilation as the kernel of the current convolutional layer. The output offset fields have the same spatial resolution as the input feature map. The channel dimension 2 K corresponds to K 2D offsets. During the training process, both the convolutional kernels for generating the output features and the offsets are learned simultaneously.
Given a convolutional kernel of K sampling locations, assuming the input feature map x, for each location p on output feature map y, the calculation formula is shown as the following:
where
For deformable convolution, offsets {
While the deformable convolution can generally adapt to the geometric variation of the object, the corresponding position of the receptive field may extend beyond the region of interest, the non-object region would subsequently be incorrectly recognized. To achieve more accurate feature extraction, a modulation mechanism is introduced into deformable convolution. In short, the modulation mechanism is to assign different weights to the offsets corrected region. It can be expressed as:
where
3.2.2 Integrate Feature Fusion Pyramid Structure
Considering that deep high-level features contain more semantic representation, while shallow low-level features have better detail features that could better describe the characteristics of the small-scale objects, it is necessary to utilize the feature information of different layers effectively. FPN [21] is a state-of-the-art algorithm in generic object detection proposed by Lin et al. in 2017. The FPN introduces a pyramid structure to solve the multi-scale problem in object detection. Without sacrificing representational power, speed and memory, FPN greatly improves the performance of small object detection through a top-down pathway and lateral connection.
In the original architecture of FPN, as shown in Fig. 4(1), the output feature map from the backbone network is denoted as {C1, C2, C3, C4, C5}. M5 is generated by a 1 × 1 convolution of C5. The construction of M4, M3, and M2 relies on the lateral connection of feature maps C4, C3 and C2 with the up-sampling operation, respectively, where each lateral connection utilizes a 1 × 1 convolutional kernel to merge feature maps with the same special size by element-wise addition. It should be noted that the FPN network focuses on adjacent resolution rather than the integrated resolutions of semantic representation and detail features. In this case, a feature fusion module is implemented in the proposed MPFracNet to integrate multi-level features and subsequently enrich the output fracture features.
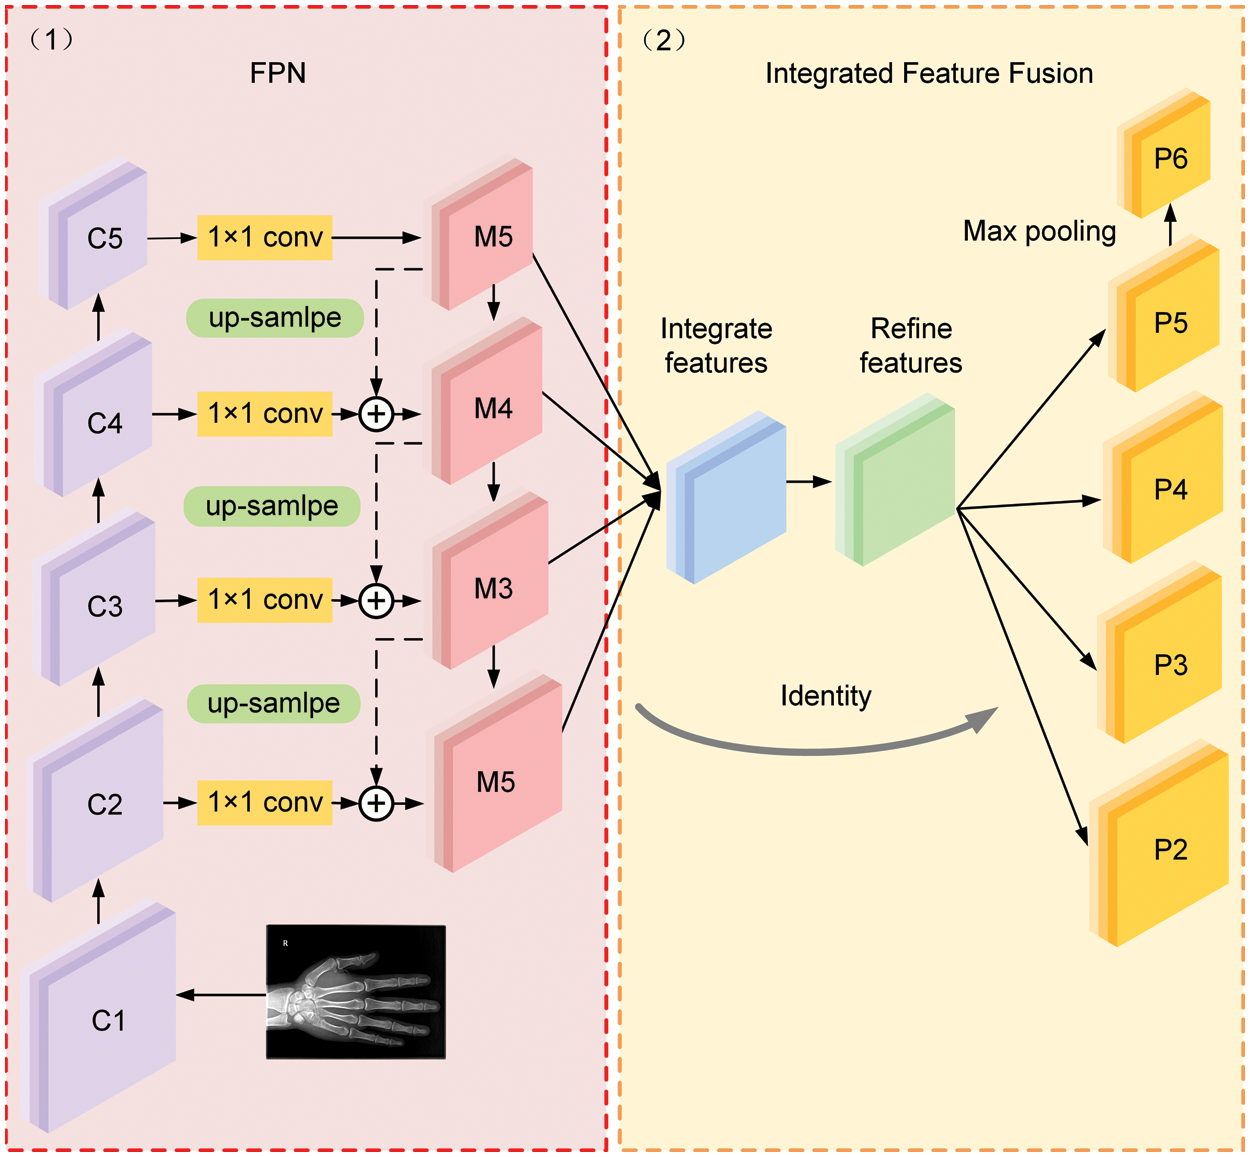
Figure 4: The architecture of the integrated feature fusion pyramid
Fig. 4(2) illustrates the architecture of the integrated feature fusion module. First, the feature maps {M2, M3, M5} are resized to the same size as M4 and interpolation and max-pooling operations are used on P5 and {P2, P3}, respectively. The balanced semantic features are obtained by simple averaging as:
where
To make the balanced semantic feature discriminative, we further refined the feature by using the embedded Gaussian non-local attention [23]. Compared with convolution directly, the non-local attention is more considerate of global features. The Non-local block can be generically represented as:
where x represents the input vector, y represents the output vector (with the same shape as the input vector), i is the location of the output index, j is all the possible locations of the index.
The embedded Gaussian non-local attention is the spatial similarity embedded in the calculation, which can be expressed as:
Afterwards, the final output feature maps {P2, P3, P4, P5} are obtained by rescaling the refined balanced semantic feature map in the reverse procedure. More specifically, P5 is received by using max-pooling operation on a refined balanced semantic feature map, and {P2, P3} are received by using interpolation operation. In the proposed integrated feature fusion pyramid structure, each resolution of final output feature maps acquired the same information from other resolutions to make the features more discriminative.
Many studies have proved that class imbalance is one of the main factors leading to the lower accuracy of the one-stage detector. Generally, the detectors evaluate 104–105 candidate regions per image, but only a few candidate regions contain objects. A large number of negative samples lead to inefficient training and model degeneration. Therefore, it is important to maintain a balance between each task and the samples involved in the procedure of training process proved significant. In RetinaNet, Lin et al. [19] bring a novel loss function, Focal loss, to solve this problem. Focal loss modifies based on the cross entropy (CE) loss and enhances the accuracy by introducing a modulating factor to reduce the weight of a large number of hard negative samples in the training process. The CE Loss for binary classification can be expressed as:
where y ∈ {±1} specifies the ground-truth class and
where the focusing parameter
The loss function of object detection network for object classification and location is defined as:
where
As can be seen from Formula (12), this loss function is the sum of the classification loss and the localization loss. Due to the existence of the phenomenon of imbalanced samples, the classification loss is already good, the model obtains a good loss when backpropagating, which will ignore the importance of localization. However, directly raising the weight of localization for balancing will make the model more sensitive to outliers, the outliers contribute to large gradients that have an unfavorable impact on the training process. Thus, we design a developed gradient formulation as the following:
where
Integrating the above gradient formulation, the Balanced L1 Loss [24] named
where the parameters
where the parameters are set as
The models mentioned in the paper were pre-trained with ImageNet to initialize the weights and repeatedly updated the weights by Stochastic Gradient Descent (SGD). A total of 50 epochs were trained and the batch size was set to 2. The input images were rescaled to 1000 × 800. The weight decay was set as 0.0001 and the momentum was set as 0.9. We initialized the learning rate as 1e − 3, and then decreased it to 1e − 4 at the 4th epoch and 1e − 5 at the 9th epoch, respectively. Finally, the training stopped at the 15th epoch. The predict boxes, which confidence scores are above 0.4, would be regarded as true positive. Otherwise, the prediction was counted as a false positive.
All the experiments are carried out on Python v3.7.8, Pytorch v1.6.0, Cuda 10.1, Cudnn v7.6.5, mmcv-full v1.1.5, TorchVision v0.7.0, OpenCV v4.4.0, GCC v5.5.0 and NCCL v2.4.8. All programs are run on an Ubuntu 18.05 with 2 GPUs Nvidia GeForce GTX 2080Ti.
The diagram of this workflow is illustrated in Fig. 5. After collecting hand X-ray images from different medical centers, the orthopedic doctors manually label the fractures in each image. Then the images with ground-truth bounding boxes are input for training the proposed network until the models converge ideally. Eventually, we evaluate the trained model on different test sets and achieve anchors to locate each bone fractures in the test images.
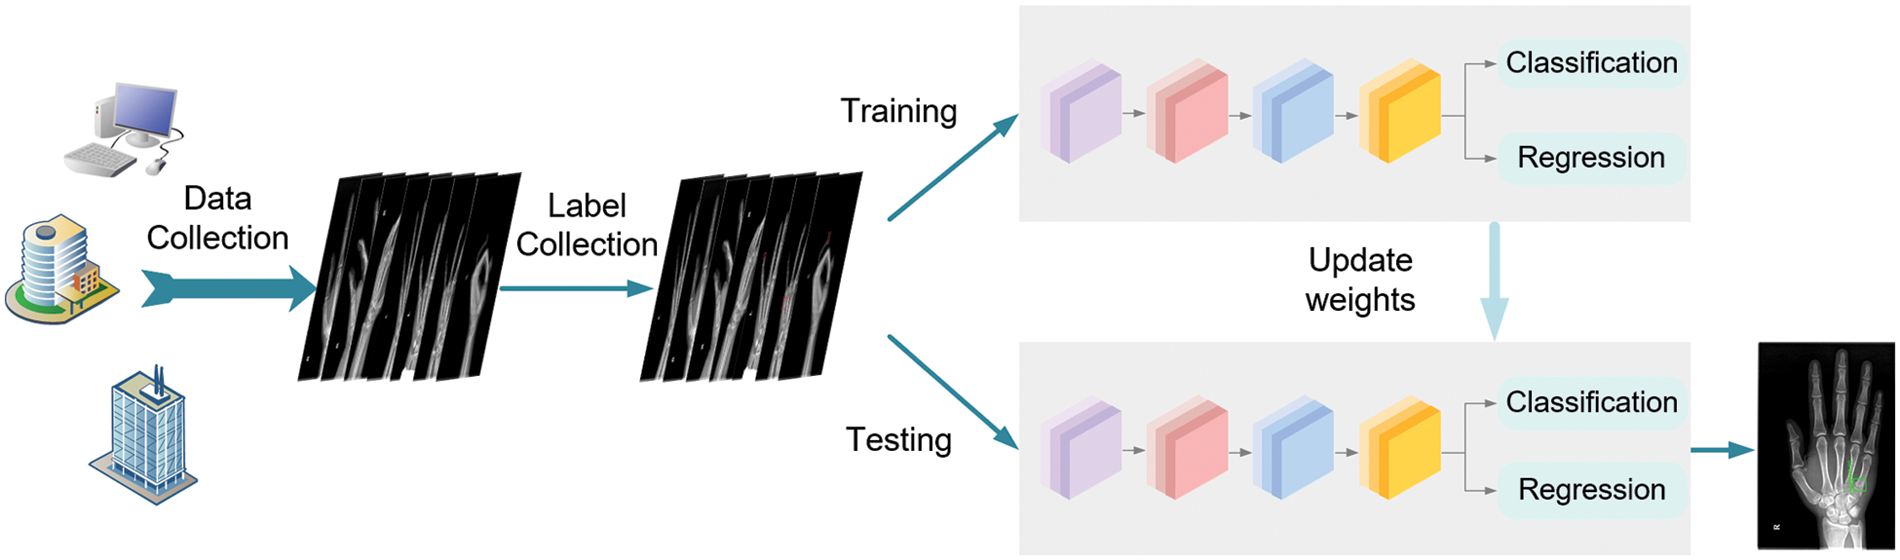
Figure 5: The flowchart of the whole procedure which includes dataset preparation and model training and testing
There is only object detection carried out in our experiment, so the precision standard used for image classification cannot completely evaluate the detection performance. Hence, we use the common evaluation metrics in the field of objection detection including Average-Precision (AP), recall, precision, and F1-score. We estimate these evaluation metrics as follows.
TP and TN indicate the number of true positive and true negative results, respectively, whereas FP and FN indicate the number of false positives and false negatives.
All models are evaluated after the training loss converges. In the proposed MPFracNet, deformable bottleneck block (DBB), integrated feature fusion module (IFFM) and Balanced L1 loss are applied to enhance the performance of metacarpal and phalangeal fracture detection. To investigate the effectiveness of each component of our MPFracNet, we conduct several ablation experiments in which these modules are separately or completely integrated into the baseline network. For the baseline network, the classical one-stage network RetinaNet is considered, which applies ResNet as the backbone to perform classification and localization. To comprehensively estimate the effect of detection and localization, we evaluate the APs and the AP improvements of the networks on the four different test sets mentioned in Section 3.1. Table 1 summarizes the comparative results obtained from different modifications with the backbone architectures of ResNet50 and ResNet101, respectively.

When considering ResNet50, the baseline network achieves 75.7% AP on MF-test set, 70.6% AP on PF-test set, 65.7% AP on Ti-test set, and 72.1% AP on Test set, respectively. As Table 1 shows, the network separately integrated with DBB, IFFM and Balanced L1 Loss shows superior performance to the baseline network. Therefore, we employ all these modules in the proposed MPFracNet and compare the detection performance between the improved network and the baseline model. As can be seen that the proposed algorithm provides the highest APs and improvements of 7.0%, 7.9%, 9.2%, and 8.3% in AP on different test sets. Note that the integration of all the proposed modules achieves the most significant improvement in the evaluation metric of AP on all datasets compared to the baseline architecture and any other modifications. In addition, Table 1 demonstrates that the performance enhancement of MPFracNet on the Ti-test set which is the most difficult to be detected is highest than other compared test sets, indicating that our model performs more effectively for tiny object detection. These occur due to the increment in feature extraction efficiency for the small and irregular fracture curves.
Besides, we gradually validate the effectiveness of DBB, IFFM and Balanced L1 loss equipped with the backbone of ResNet-101. The results show that the performances are all superior to the baseline model. However, when comparing the detection performance between the backbones of ResNet50 and ResNet101, networks with the backbone of ResNet50 achieve competitive results. We thus set ResNet50 as the backbone of our proposed MPFracNet.
Some examples of our detection results are shown in Fig. 6. Figs. 6(1), 6(4) and 6(7) are images randomly selected from MF-test set, PF-test set, and Ti-test, respectively. The red rectangle areas show the ground truths annotated by clinicians and the green prediction boxes in the remaining two columns are produced by the baseline RetinaNet and improved MPFracNet. In the first row of metacarpal fractures detection, the fracture location prediction is more accurate by MPFracNet (see Fig. 6(3)) than by RetinaNet ((see Fig. 6(2)), and additionally, MPFracNet achieves a higher probability of correct prediction (0.94 vs. 0.43). Compared with the results obtained by RetinaNet, the four fracture sites in Fig. 6(4) are precisely detected and located by the proposed method in Fig. 6(6), while the fracture in the middle phalanx of the fourth phalanx (the top red rectangle in Fig. 6(4)) is missed diagnosed in Fig. 6(5). Notably, the confidence of each prediction using MPFracNet is significantly higher than the corresponding prediction using RetinaNet. The proposed algorithm, in turn, extracts fracture features more efficiently than the baseline model. In the third row (see Figs. 6(7)–6(9)), MPFracNet identifies a very tiny fracture that is not detected in RetinaNet with a confidence of 0.99. In general, MPFracNet decreases missed diagnoses and misdiagnoses, especially for tiny fractures, which is challenging in practical applications.
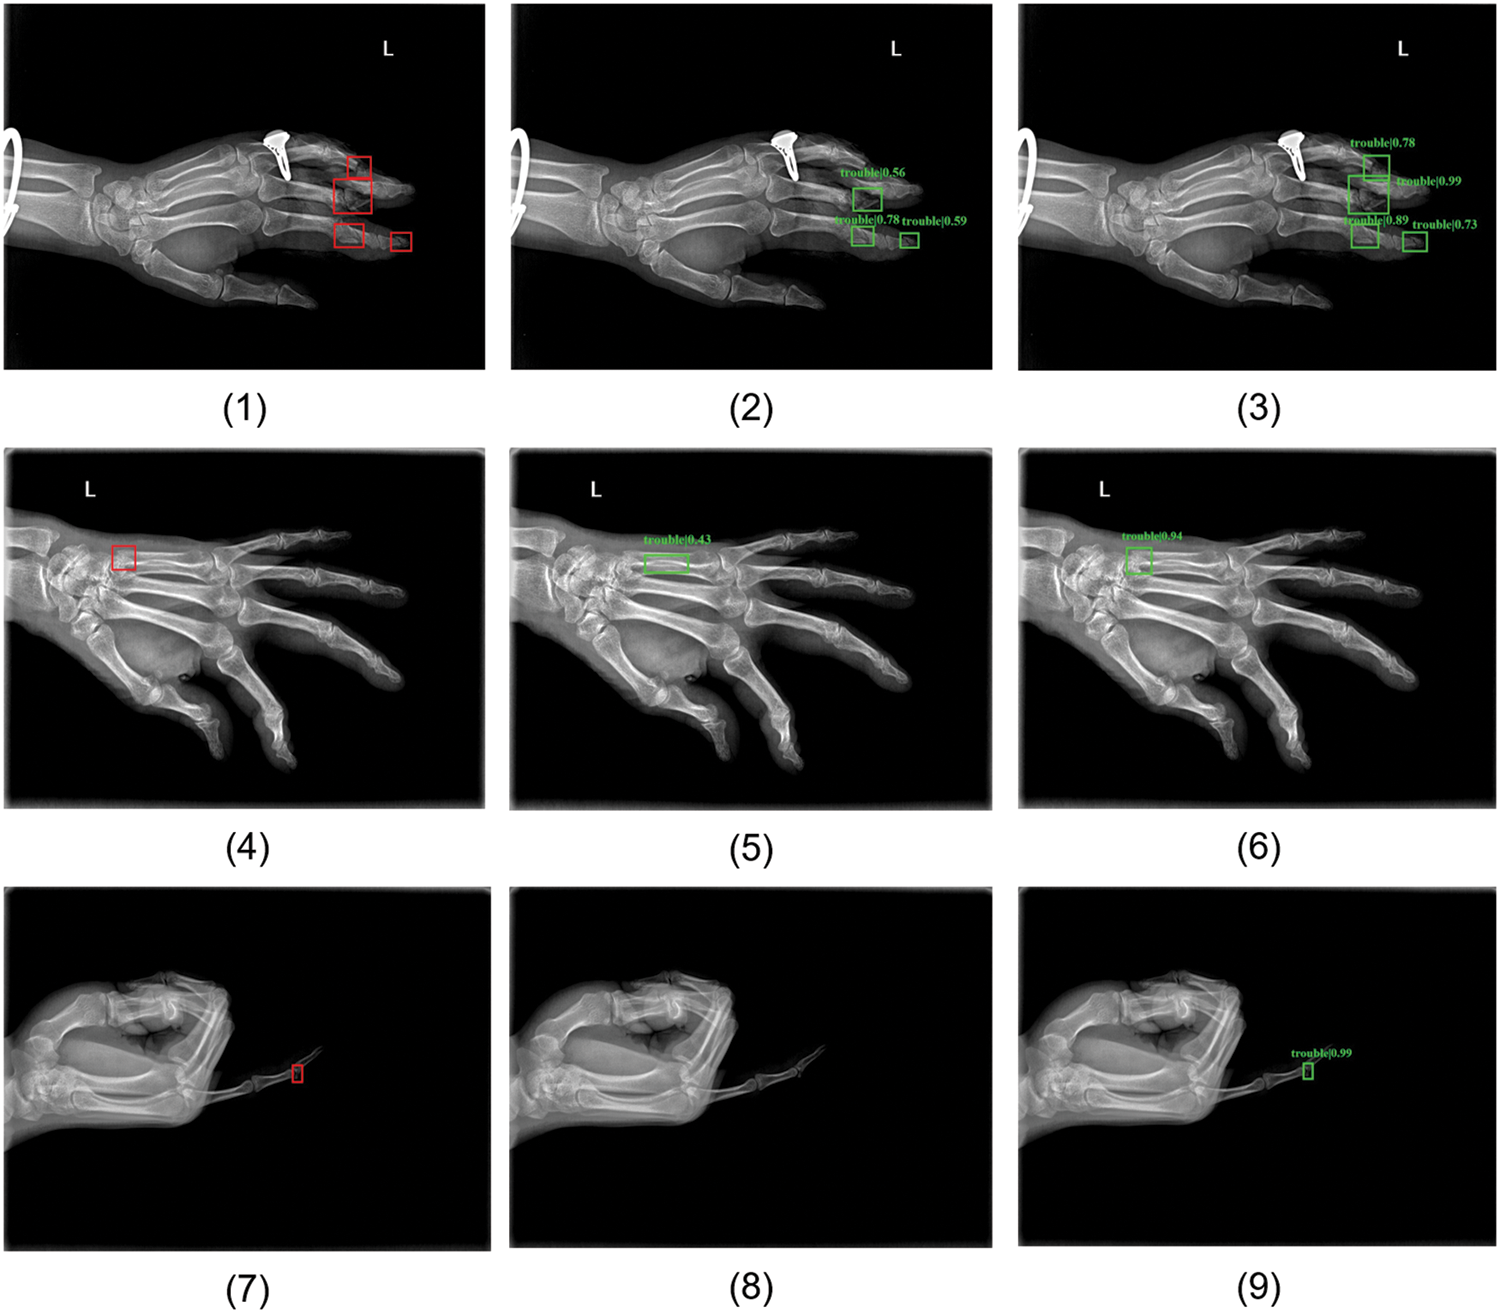
Figure 6: Some samples of detection results. (1)(4)(7) ground-truth boxes annotated by professional orthopedic doctors, (2)(5)(8) predicted boxes produced by basic network RetinaNet, (3)(6)(9) predicted boxes detected by MPFracNet. (1)(2)(3) results for metacarpal fracture detection, (4)(5)(6) results for phalangeal fracture detection, and (7)(8)(9) results for tiny fracture detection
5.2 Comparative Experiments with Existing Network
To comprehensively evaluate the proposed method, comparative experiments are conducted on the four test sets, and the quantitative metrics are listed in Table 2. In this part, our model is compared with some other state-of-the-art different networks: 1) the traditional two-stage object detection network Faster R-CNN [25] applying ResNet and FPN as the backbone; 2) an improved network Cascade R-CNN [26] based on Faster R-CNN, which enhances the localization accuracy by cascading the detection network with an increasing threshold; and 3) the GA_Faster R-CNN [17] which is proposed for metacarpophalangeal fractures by employing guided anchoring to enhance the performance. All these network structures are trained with ResNet50 as the backbone and tested on MF-test set, PF-test set, Ti-test set and Test set, respectively. To make a fair comparison, the comparative networks are reproduced using their open-source implementations while maintaining a similar training condition.

It should be noted that the proposed network consistently outperforms other networks improving APs from 74.8% to 82.7% (7.9% improvement) on MF-test set, from 70.6% to 78.5% (7.9% improvement) on PF-test set, from 66.0% to 74.9% (8.9% improvement) on Ti-test set, and 72.1% to 80.4% (8.3% improvement). Moreover, considerable improvements are also achieved in the metrics of recall, precision, and F1-score. Overall, the proposed network achieves state-of-the-art performance in detecting metacarpophalangeal fractures compared with other methods, especially enhancing the detecting accuracy of tiny fractures, which can effectively improve the misdiagnosis of metacarpal and phalangeal fractures.
In this paper, we have proposed a novel one-stage network to tackle the challenging problem of detecting metacarpal and phalangeal fractures in radiographs, which integrated a deformable bottleneck block and an integrated feature fusion module into the baseline RetinaNet. Moreover, we adopted Focal loss and Balance L1 loss to overcome the imbalance between fracture and nonfracture samples. To evaluate the detection performance of the proposed network on images with multi-scale fractures, we verified the model on four test sets classified according to different difficulties. The results show that the proposed MPFracNet outperforms some other state-of-the-art detection networks in AP, Precision, Recall and F1-score on all test sets. It concluded that the proposed network could accurately and quickly detect metacarpophalangeal fractures in hand radiographs, especially tiny fractures that are easy to be missed. One drawback of the current method is that it cannot achieve a refined classification of fracture type. For future work, we are interested in developing a deep learning network model for metacarpophalangeal fracture classification to assist clinicians in making proper diagnoses and treatment strategies.
Funding Statement: This work was funded by the Research Fund for Foundation of Hebei University (DXK201914), the President of Hebei University (XZJJ201914), the Post-graduate’s Innovation Fund Project of Hebei University (HBU2022SS003), the Special Project for Cultivating College Students’ Scientific and Technological Innovation Ability in Hebei Province (22E50041D).
Conflicts of Interest: We declare that we do not have any commercial or associative interest that represents a conflict of interest in connection with the work submitted.
References
1. I. H. Cotterell and M. J. Richard, “Metacarpal and phalangeal fractures in athletes,” Clinics in Sports Medicine, vol. 34, no. 1, pp. 69–98, 2015. [Google Scholar]
2. S. W. Chung, S. S. Han, J. W. Lee, K. S. Oh, N. R. Kim et al., “Automated detection and classification of the proximal humerus fracture by using deep learning algorithm,” Acta Orthopaedica, vol. 89, no. 4, pp. 468–473, 2018. [Google Scholar]
3. S. Kim, L. Goelz, F. Münn, D. Kim, M. Millrose et al., “Detection of missed fractures of hand and forearm in whole-body CT in a blinded reassessment,” BMC Musculoskeletal Disorders, vol. 22, no. 1, pp. 589, 2021. [Google Scholar]
4. H. Y. Chen, B. W. Hsu, Y. K. Yin, F. H. Lin, T. H. Yang et al., “Application of deep learning algorithm to detect and visualize vertebral fractures on plain frontal radiographs,” Public Library of Science One, vol. 16, no. 1 January, pp. 1–10, 2021. [Google Scholar]
5. T. Urakawa, Y. Tanaka, S. Goto, H. Matsuzawa, K. Watanabe et al., “Detecting intertrochanteric hip fractures with orthopedist-level accuracy using a deep convolutional neural network,” Skeletal Radiology, vol. 48, no. 2, pp. 239–244, 2019. [Google Scholar]
6. C. T. Cheng, T. Y. Ho, T. Y. Lee, C. C. Chang, C. C. Chou et al., “Application of a deep learning algorithm for detection and visualization of hip fractures on plain pelvic radiographs,” European Radiology, vol. 29, no. 10, pp. 5469–5477, 2019. [Google Scholar]
7. L. Tanzi, E. Vezzetti, R. Moreno, A. Aprato, A. Audisio et al., “Hierarchical fracture classification of proximal femur X-ray images using a multistage deep learning approach,” European Journal of Radiology, vol. 133, no. February, pp. 109373, 2020. [Google Scholar]
8. X. Y. Zhang, Y. R. Wang, C. T. Cheng, L. Lu, A. P. Harrison et al., “Window loss for bone fracture detection and localization in X-ray images with point-based annotation,” in Proc. Computer Vision and Pattern Recognition, New York, NY, USA, pp. 724–732, 2021. [Google Scholar]
9. J. D. Krogue, K. V. Cheng, K. M. Hwang, P. Toogood, E. G. Meinberg et al., “Automatic hip fracture identification and functional subclassification with deep learning,” Radiology: Artificial Intelligence, vol. 2, no. 2, pp. e190023, 2020. [Google Scholar]
10. B. Guan, J. Yao, G. Zhang and X. Wang, “Thigh fracture detection using deep learning method based on new dilated convolutional feature pyramid network,” Pattern Recognition Letters, vol. 125, pp. 521–526, 2019. [Google Scholar]
11. M. X. Wang, J. K. Yao, G. S. Zhang, B. Guan, X. B. Wang et al., “ParallelNet : Multiple backbone network for detection tasks on thigh bone fracture,” Multimedia Systems, vol. 27, pp. 1091–1100, 2021. [Google Scholar]
12. A. Lind, E. Akbarian, S. Olsson, H. Nsell, O. G. Skldenberg et al., “Artificial intelligence for the classification of fractures around the knee in adults according to the 2018 AO/OTA classification system,” Public Library of Science One, vol. 16, no. 4 April, pp. 1–15, 2021. [Google Scholar]
13. J. Olczak, F. Emilson, A. Razavian, T. Antonsson, A. Stark et al., “Ankle fracture classification using deep learning: Automating detailed AO foundation/orthopedic trauma association (AO/OTA) 2018 malleolar fracture identification reaches a high degree of correct classification,” Acta Orthopaedica, vol. 92, no. 1, pp. 102–108, 2020. [Google Scholar]
14. M. W. Kim, J. Jung, S. J. Park, Y. S. Park, J. H. Yi et al., “Application of convolutional neural networks for distal radio-ulnar fracture detection on plain radiographs in the emergency room,” Clinical and Experimental Emergency Medicine, vol. 8, no. 2, pp. 120–127, 2021. [Google Scholar]
15. K. F. Gan, D. L. Xu, Y. M. Lin, Y. D. Shen, T. Zhang et al., “Artificial intelligence detection of distal radius fractures : A comparison between the convolutional neural network and professional assessments,” Acta Orthopaedica, vol. 90, no. 4, pp. 394–400, 2019. [Google Scholar]
16. B. Guan, G. Zhang, J. Yao, X. Wang and M. Wang, “Arm fracture detection in X-rays based on improved deep convolutional neural network,” Computers & Electrical Engineering, vol. 81, pp. 106530, 2020. [Google Scholar]
17. L. Xue, W. Yan, P. Luo, X. Zhang, T. Chaikovska et al., “Detection and localization of hand fractures based on GA_Faster R-CNN,” Alexandria Engineering Journal, vol. 60, no. 5, pp. 4555–4562, 2021. [Google Scholar]
18. P. Rajpurkar, J. Irvin, A. Bagul, D. Ding, T. Duan et al., “MURA dataset: Towards radiologist-level abnormality detection in musculoskeletal radiographs,” in Proc. Medical Imaging with Deep Learning, Amsterdam, AMS, NL, pp. 1–10, 2017. [Google Scholar]
19. T. Y. Lin, P. Goyal, R. Girshick, K. He and P. Dollar, “Focal loss for dense object detection,” IEEE Transactions on Pattern Analysis and Machine Intelligence, vol. 42, no. 2, pp. 318–327, 2020. [Google Scholar]
20. K. He, X. Zhang, S. Ren and J. Sun, “Deep residual learning for image recognition,” in Proc. IEEE Computer Vision and Pattern Recognition, Las Vegas, LV, USA, vol. 2016-December, pp. 770–778, 2016. [Google Scholar]
21. T. Y. Lin, P. Dollar, R. Girshick, K. He, B. Hariharan et al., “Feature pyramid networks for object detection,” in Proc. IEEE Computer Vision and Pattern Recognition, Hawaii, HI, USA, pp. 1500–1504, 2017. [Google Scholar]
22. J. Dai, H. Z. Qi, Y. W. Xiong, Y. Li, G. D. Zhang et al., “Deformable convolutional networks,” in Proc. IEEE Int. Conf. on Computer Vision, Venice, VCE, Italy, vol. 2017-October, pp. 764–773, 2017. [Google Scholar]
23. X. Wang, R. Girshick, A. Gupta and K. He, “Non-local neural networks,” in Proc. IEEE Computer Vision and Pattern Recognition, Salt Lake City, SLC, USA, pp. 7794–7803, 2018. [Google Scholar]
24. J. M. Pang, K. Chen, J. P. Shi, H. J. Feng, W. Ouyang et al., “Libra R-CNN: Towards balanced learning for object detection,” in Proc. IEEE Computer Vision and Pattern Recognition, Long Beach, LB, USA, vol. 2019-June, no. 2, pp. 821–830, 2019. [Google Scholar]
25. S. Ren, K. He, R. Girshick and J. Sun, “Faster R-CNN: Towards real-time object detection with region proposal networks,” IEEE Transactions on Pattern Analysis and Machine Intelligence, vol. 39, no. 6, pp. 1137–1149, 2016. [Google Scholar]
26. Z. Cai and N. Vasconcelos, “Cascade R-CNN: Delving into high quality object detection,” in Proc. Computer Vision and Pattern Recognition, Salt Lake City, SLC, USA, pp. 6154–6162, 2018. [Google Scholar]
Cite This Article
 Copyright © 2023 The Author(s). Published by Tech Science Press.
This work is licensed under a Creative Commons Attribution 4.0 International License , which permits unrestricted use, distribution, and reproduction in any medium, provided the original work is properly cited.
 Downloads
 Citation Tools