
 Submit a Paper
 Propose a Special lssue
 Open Access
ARTICLE

Estimation of Weibull Distribution Parameters for Wind Speed Characteristics Using Neural Network Algorithm
Department of Electrical Engineering, College of Engineering, Qassim University, Buraidah, Saudi Arabia
* Corresponding Author: Musaed Alrashidi. Email:
Computers, Materials & Continua 2023, 75(1), 1073-1088. https://doi.org/10.32604/cmc.2023.036170
Received 19 September 2022; Accepted 08 December 2022; Issue published 06 February 2023
 View Full Text
 Download PDF
Abstract
Harvesting the power coming from the wind provides a green and environmentally friendly approach to producing electricity. To facilitate the ongoing advancement in wind energy applications, deep knowledge about wind regime behavior is essential. Wind speed is typically characterized by a statistical distribution, and the two-parameters Weibull distribution has shown its ability to represent wind speeds worldwide. Estimation of Weibull parameters, namely scale and shape parameters, is vital to describe the observed wind speeds data accurately. Yet, it is still a challenging task. Several numerical estimation approaches have been used by researchers to obtain c and k. However, utilizing such methods to characterize wind speeds may lead to unsatisfactory accuracy. Therefore, this study aims to investigate the performance of the metaheuristic optimization algorithm, Neural Network Algorithm (NNA), in obtaining Weibull parameters and comparing its performance with five numerical estimation approaches. In carrying out the study, the wind characteristics of three sites in Saudi Arabia, namely Hafer Al Batin, Riyadh, and Sharurah, are analyzed. Results exhibit that NNA has high accuracy fitting results compared to the numerical estimation methods. The NNA demonstrates its efficiency in optimizing Weibull parameters at all the considered sites with correlations exceeding 98.54.Keywords
Initiatives have been made globally to produce power using renewable energy sources, such as solar photovoltaic systems and wind, to support the potential increase in the electricity demand. These renewable resources have a limitless supply from their prime movers that result in preventing hazardous emissions and minimizing global warming. Utilizing wind turbines is one method for producing power from such sources. In 2019, wind power was considered the second leading technology in the annual addition contribution of renewable power capacity with 60 GW or 30% [1]. Hence, many countries began to harvest the energy coming from wind to cover their domestic need, at least partially.
The electricity consumption of Saudi Arabia has been growing in the past decades, which requires more energy production to meet this demand. The per capita electricity consumption in Saudi Arabia is estimated to be three times compared of the world average [2]. According to a recent study in [3], the peak demand in Saudi Arabia is predicted to reach 365.4 TW by 2030. Hence, the Saudi Electricity Company (SEC) aims to meet this future load by adding new generation capacities [4]. In addition, SEC plans to optimize energy use, enhance the growth forecasting load, and support renewable energy expansion programs [4].
Furthermore, the Saudi government aims to diversify the energy generation mix by taking advantage of unexploited renewable energy resources, such as solar and wind [5]. The government aims to incorporate this potential advancement and expansion of the renewable energy sector into the local Saudi economy through research, development, and manufacturing [5]. In 2017, therefore, the Saudi oil company (ARAMCO), in partnership with General Electric, implemented the first wind turbine in Turaif city, northwest Saudi Arabia [6].
The power extracted from the wind has great potential, and many countries have embraced this technology to meet their domestic load. However, the power generated from the wind is variable due to its intermittency. Therefore, to avoid the uncertainty risks and evaluate the potential of wind energy at any site, deep knowledge about wind regime behavior is essential. Several statistical Probability Density Functions (PDF) have been investigated to represent wind speeds, such as Rayleigh [7,8], Lognormal [7,9], Gamma [7,10,11], Beta [12], etc. However, the two-parameters Weibull distribution is the well-known and most popular distribution to characterize wind speed. Therefore, Weibull distribution is used in this paper.
The selection process of Weibull parameters, namely scale
The study in [17] compares five numerical methods to estimate Weibull parameters for wind speed on Phangan Island, Thailand. The estimation approaches are EM, EPFM, MLM, Modified MLM (MMLM), and GM. Results indicate that EPFM outperforms other methods with the lowest percent error of power density. In addition, the authors in [18] use EM, MOM, EPFM, MLM, and MMLM to obtain c and k of Weibull distribution for wind energy evaluation at Eastern Jerusalem, Palestine. Study findings point out that EM and MOM are the two approaches that best fit the wind speed regime at the study site with chi-square test values of 0.035 to 0.086 in the summer months. In [19], the researchers characterize wind speed data at Agadir, Morocco, by utilizing seven estimation methods, namely the Least Square Method (LSM), MLM, standard deviation method (STDM), Empirical Method of Lysen (EML), Mabchour Method (MMab), EPFM and MOM. The statistical indicator measurements reveal that MLM has the highest accuracy results, followed by STDM.
Authors in [14] assess the technical and economic feasibility of wind energy in Nooriabad, Pakistan. Weibull distribution is used to carry out this assessment, and its parameters are determined using EM, MLM, MMLM, EPFM, and LSM. At the study site, all the estimation methods display good fitting accuracy results except GM. Furthermore, authors in [20] use Weibull distribution to depict the wind characteristics in seven cities in Saudi Arabia, and the two Weibull parameters are estimated utilizing MLM, LSM, and Wasp colony (WAsP) algorithm. The statistical errors show that MLM is the optimal method to estimate c and k at all the considered sites followed by LSM and WAsP methods. Reference [21] used Weibull distribution to evaluate the wind energy potential at different locations in Saudi Arabia. For Weibull function parameters estimation, the researchers use LSM, MOM, and MLM. The study finds that MOM is the most efficient method to acquire Weibull parameters and thus calculate the wind power density.
There are several applications for wind characteristics based on the Weibull distribution in the wind field. The techno-economic feasibility analysis of wind energy production has used Weibull distribution to assess spatial and temporal fluctuations of the wind potential [22]. The technical assessments utilize Weibull distribution to identify the optimal wind turbine technology at a particular site, wind power density, annual energy output, and capacity factor, while the economic assessment is to calculate the cost of energy and the payback period of wind projects. The authors in [23], for instance, evaluate the wind potential in the Ouargla region, Algeria, using Weibull distribution, and its parameters are estimated using numerical methods. Results show that the average monthly wind speed is between 1.19–5.51 m/s at 50 m with a speculated energy of 953.77 kWh/m2. In addition, the authors in [24] use EM, MLM, MMLM, EPFM, and GM to find the optimal set of Weibull parameters. These parameters are then used to characterize the wind speed and to determine the cost of energy, capacity factor, annual energy yield, and wind power density for Hawke Bay in China. According to statistical study, the annual wind speeds at 30, 60, and 80 m AGL are 5.04, 5.84, and 6.05 m/s, respectively, while average power densities are 184.0, 231.5, and 307.5 W/m2, respectively. Results also state that the lowest energy cost with a 2.3 MW wind turbine is 0.056 US$/kWh.
1.2 Motivation and Contributions
Most works concerning wind in Saudi Arabia use numerical estimation methods to assess wind energy potential. Employing such numerical estimation methods, however, may result in inadequate fitting precision to the actual wind speed frequency. Hence, there is a need for more advanced and precise estimation methods [13]. Metaheuristic algorithms for optimization demonstrate their capacity to resolve challenging optimization related to renewable energy resources. This motivates researchers to incorporate such algorithms in varieties of problems. Therefore, the goal of this paper is to use the recent metaheuristic optimization that is proposed by authors in [25], called Neural Network Algorithm (NNA) algorithm, to tune Weibull parameters and compare its performance with numerical estimation methods. The main contributions of this study are as follows:
1. Developing a framework to estimate Weibull distribution parameters to characterize wind speed in three sites in Saudi Arabia, namely Hafer Al Batin, Riyadh, and Sharurah.
2. Investigating the performance of NNA to optimize the two parameters of Weibull distribution.
3. Comparing the performance of NNA with commonly used numerical estimation methods, namely LSM, MLM, MOM, EM, and EPFM, in characterizing the wind speed in the selected sites. Results show the superiority of NNA over numerical methods in obtaining the optimal parameters; hence, a reliable description of the actual frequency of the wind speeds.
4. Although this work aims to characterize wind speeds in Saudi Arabia, the developed framework can be applied to characterize wind speeds in different geographical areas with varying wind regimes.
This paper is organized as follows: Section 2 discusses the framework of this study and the wind speed dataset. In Section 3, the Weibull PDF is explained together with the numerical estimation methods. The NNA algorithm is described in Section 4, while the statistical indicators are presented in Section 5. The results of the comparison are shown in Section 6. Finally, the study findings are summarized in Section 7.
The overall study is presented in this section, together with a description of the wind speed dataset.
Fig. 1 displays the framework of this research work. Initially, the wind speed dataset at each site is used to construct the histogram that represents the frequency of observed wind speeds. After that, the two Weibull parameters are estimated by employing the five numerical methods and the NNA algorithm. The generated theoretical PDFs are then compared through some statistical measurements, namely, Root Mean Square Error (RMSE), Coefficient of Determination (R2), and Mean Absolute Error (MAE).
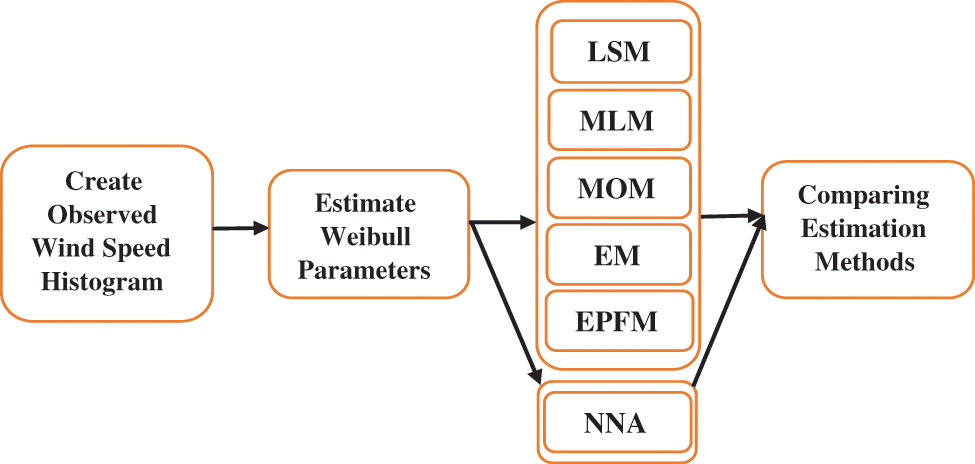
Figure 1: Flowchart of the study framework
The wind speed data are provided by King Abdullah City for Atomic and Renewable Energy (K.A.CARE) [26] to accomplish this study. Three Saudi sites are investigated in this paper, namely Hafer Al Batin, Riyadh, and Sharurah. The primary reason for selecting these three sites for wind analysis is that they are located in different geographic areas and represent different wind speed regimes in Saudi Arabia. Hafer Al Batin is located in the northeast parts of Saudi Arabia, while Riyadh and Sharurah are located in the middle and south. Fig. 2 depicts the location of the study sites, while Table 1 lists the geographic specifications of all sites.
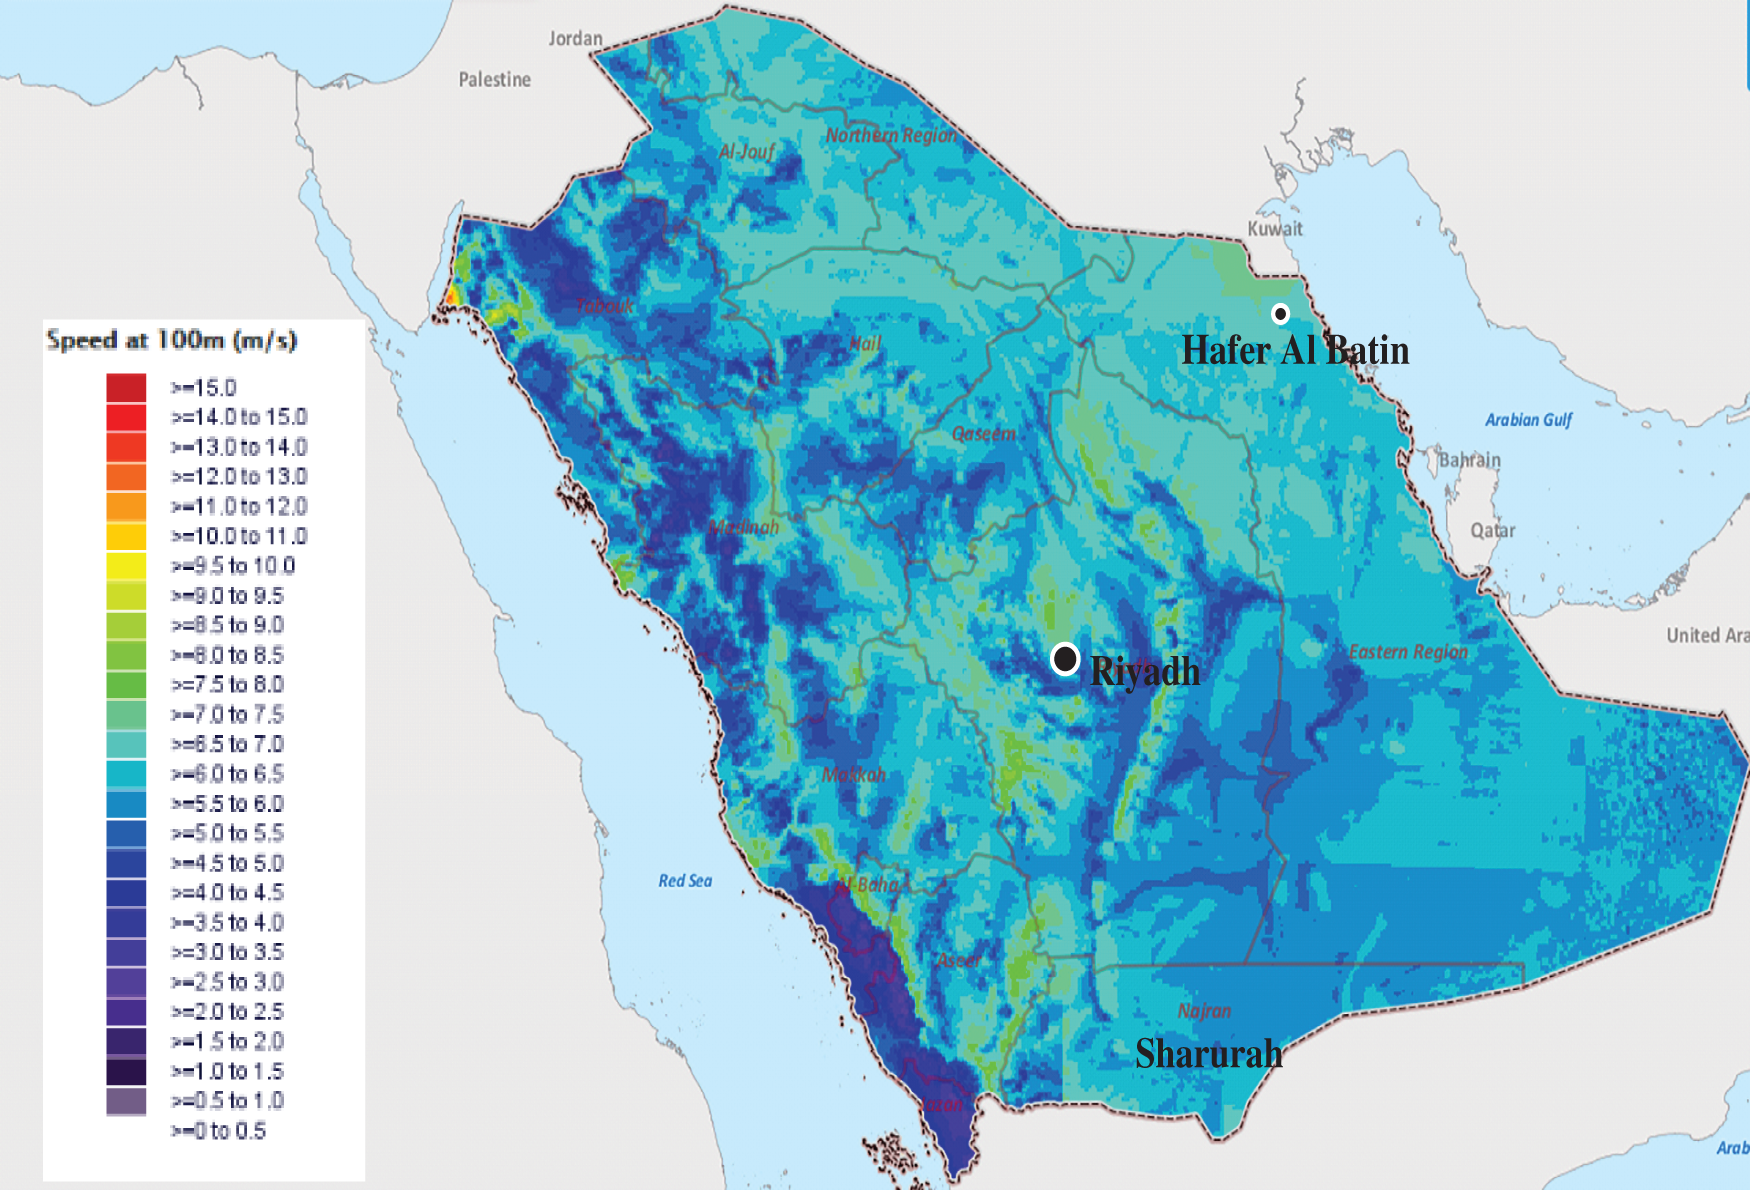
Figure 2: Saudi wind map and the site locations [26]
Hourly wind speeds data collected at 80 m Above Ground Level (AGL) were used during a period from 2015 to 2016. The wind speed data are shown in Fig. 3. In Riyadh, the data of wind speed of October 2016 are not available, see the shaded region in Fig. 3.
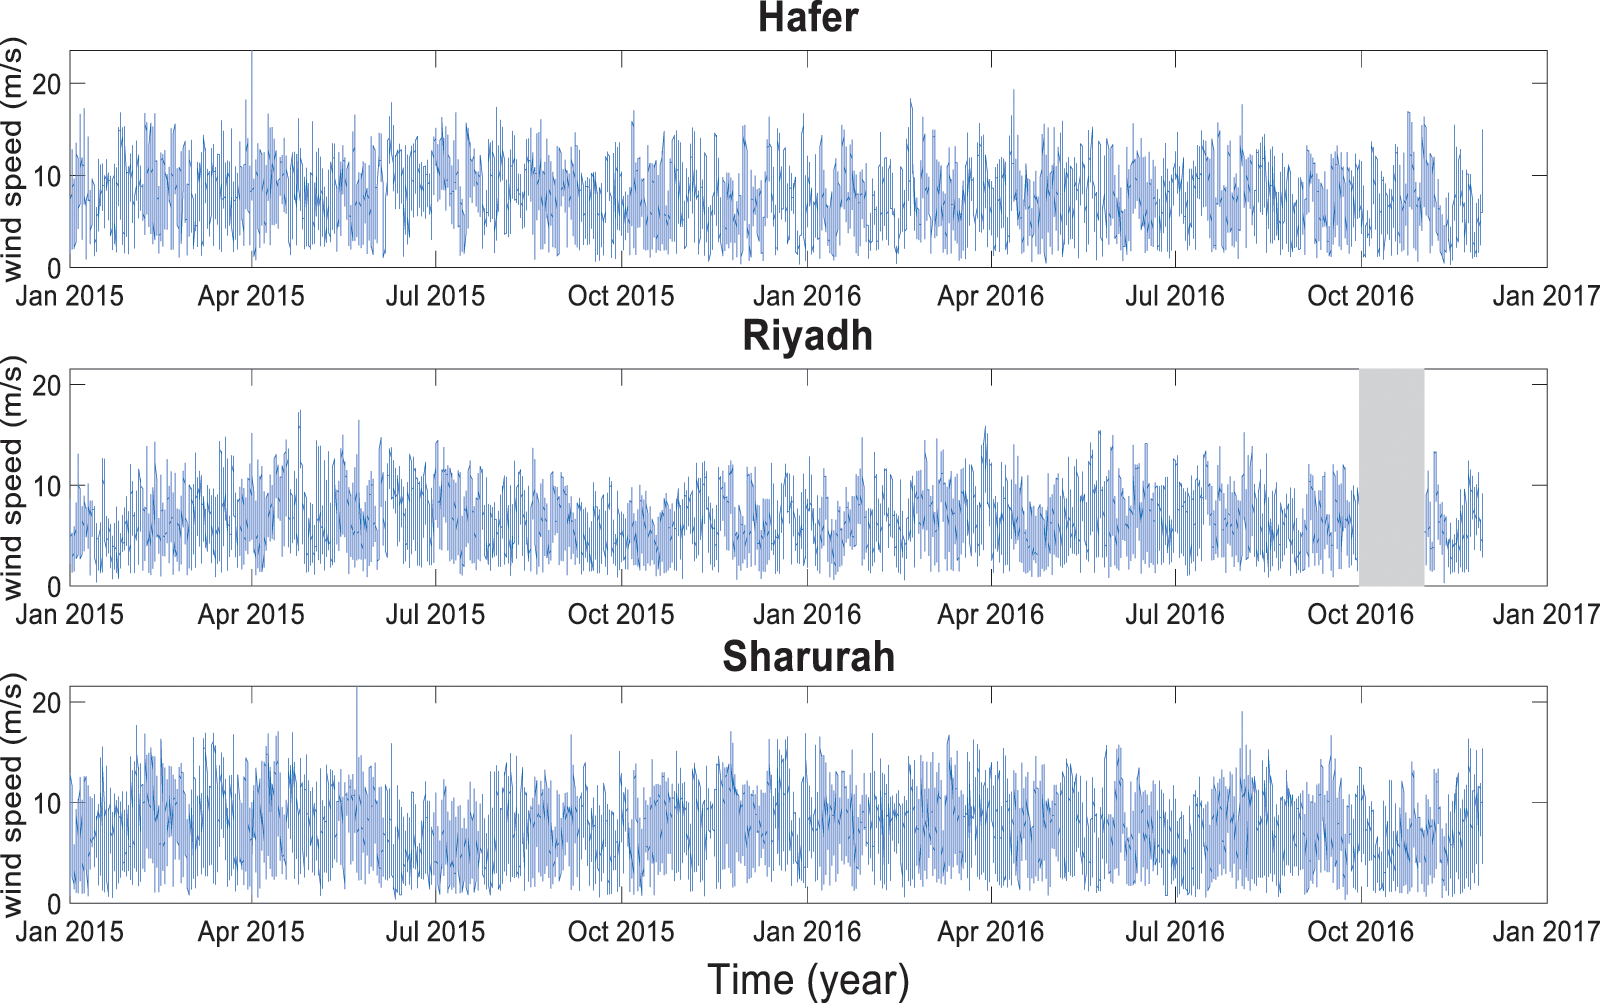
Figure 3: Wind speed dataset at the three sites in Saudi Arabia
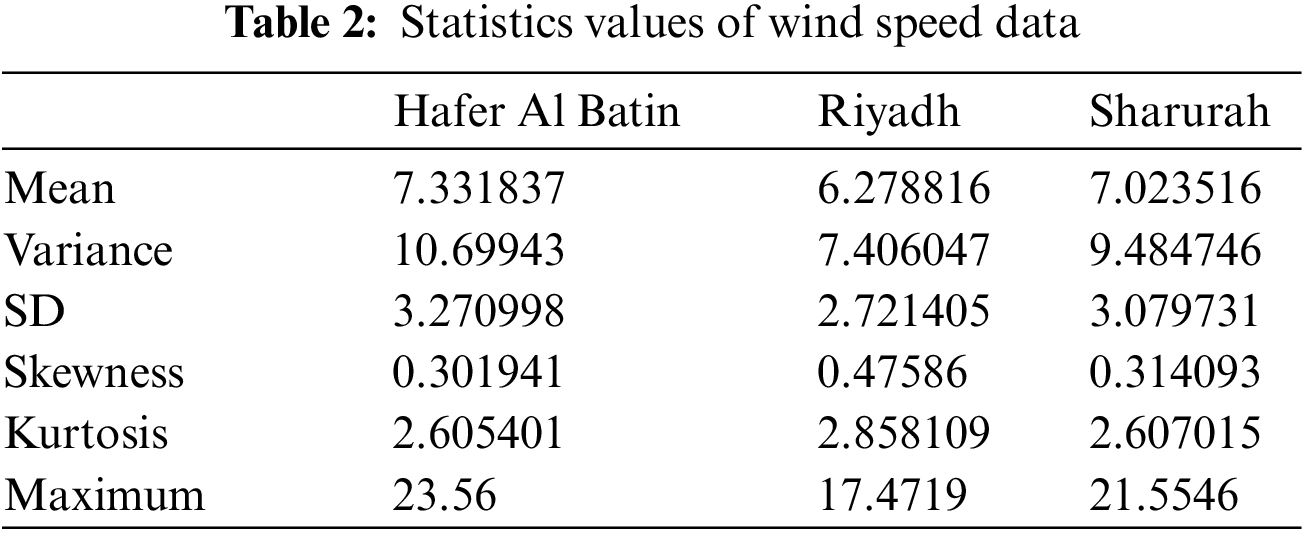
Furthermore, to understand the wind speeds well, statistics values are calculated in each site, including Mean, Variance, Standard Deviation (SD), Skewness, Kurtosis, and Maximum wind speed values. These statistical values are summarized in Table 2. The central tendency of the wind speed data is reflected by the mean values. Variance and SD reveal how far the actual wind speed deviates from the target value. Skewness and kurtosis are used further to comprehend the shape of the observed frequency distribution. Skewness shows the symmetry of the wind speed data, while the kurtosis value describes the steepness of the data, respectively. Finally, the maximum wind speed value is the highest measured wind speed obtained from the observed dataset.
3 Two–Parameters Weibull Distribution
Weibull PDF effectively represents measured wind speed distributions worldwide by providing a good fit for wind speed data at different layers [27]. The PDF of the Weibull distribution and the numerical estimation methods used to attain the two-Weibull parameters, c and k, are explained in this section.
The Weibull distribution is represented by its PDF,
where,
3.1 Numerical Estimation Methods
Five numerical estimation methods are utilized to calculate the k and c of the Weibull PDF, which are explained below.
In this method, the wind speed is required to be in the form of cumulative distribution [17]. LSM depends primarily on logarithmic transformation. Hence, to linearize Weibull distribution, the logarithm of its CDF should be taken to obtain the following expression [29]:
Eq. (3) represents a straight-line equation as follows:
By linear regression, the least square estimator of Weibull distribution parameters
3.1.2 Maximum Likelihood Method
MLM is called the likelihood function of the wind speed data [30]. MLM is obtained by numerical iteration to estimate the c and k. By applying maximum likelihood estimation theory, the Weibull parameters are attained from Eqs. (6), (7) [31]:
After computing the k from Eq. (6) by utilizing a numerical iteration algorithm, such as Newton Raphson, the value of
MOM considers the statistical values of wind speeds, the mean of the observed wind speeds
where:
This method is generated from MOM [30]. The two-Weibull parameters are estimated using this method as follows [33]:
3.1.5 Energy Pattern Factor Method
The EPFM is obtained from the mean of the wind speed data and is calculated from the following formulas [32]:
where,
The NNA is a modern metaheuristic optimization algorithm motivated by the concept of Artificial Neural Networks (AAN). NNA utilizes the same structure and principle of ANN to generate the algorithm candidate solutions and solve complex optimization problems. In this study, the objective function to be minimized is the square difference between the actual wind speed frequency and the generated theoretical PDF. Eq. (15) represents the fitness function to be minimized.
where
Details of the NNA are as follows [25]:
Step 1: Select the pattern solutions population
Step 2: Initiate the population of pattern solutions with the predetermined bounds using the following formula:
Step 3: Calculate the fitness values of the initial population using Eq. (15).
Step 4: Generate randomly the weigh matrix, whose values are selected based on uniform distribution between zero and one. The summation of these values should be below or equal to one. See Eqs. (17) and (18).
where t, is the iteration number.
Step 5: Determine the target solution
Step 6: Create a new pattern solution
Step 7: Update the weight matrix
Step 8: Evaluate the bias condition. If
Step 9: Employ the transfer function operator
Step 10: Find the fitness values of the updated pattern solutions using the objective function, Eq. (15).
Step 11: Update the target solution and its associated target weight.
Step 12: Update the value of
Step 13: Check that the stop criteria are met; otherwise, the algorithm should go back to Step 6.
5 Statistical Measurement Indicators
The suitability and efficacy of the five numerical estimation methods and NNA algorithm to investigate how accurately the theoretical frequency distribution corresponds to the observed frequency distribution of wind speed are evaluated using the following statistical indicators: RMSE, R2, and MAE.
where:
The RMSE measures the deviation between actual and theoretical values of wind speeds [34]. R2 is the proportion of variation of the theoretical data obtained by PDF models and the observed wind speeds data variation, while MAE determines the average error between the empirical and theoretical PDFs.
NNA and five numerical estimation methods were applied to acquire the two Weibull parameters c and k. Initially, the histogram of observed wind speeds at each site was constructed, and the estimation methods were used. The theoretical PDFs were then compared with the original frequency of wind speeds using RMSE, R2, and MAE.
Figs. 4a–4c show the wind rose plot at all the considered sites. Wind rose provides a visualization of the direction and intensity of wind speed. As shown in Figs. 4a–4c, the prevailing wind direction is Southeast in Hafer Al Batin, while the dominant wind speed blows from North to Northeast in Riyadh and Sharurah, respectively.
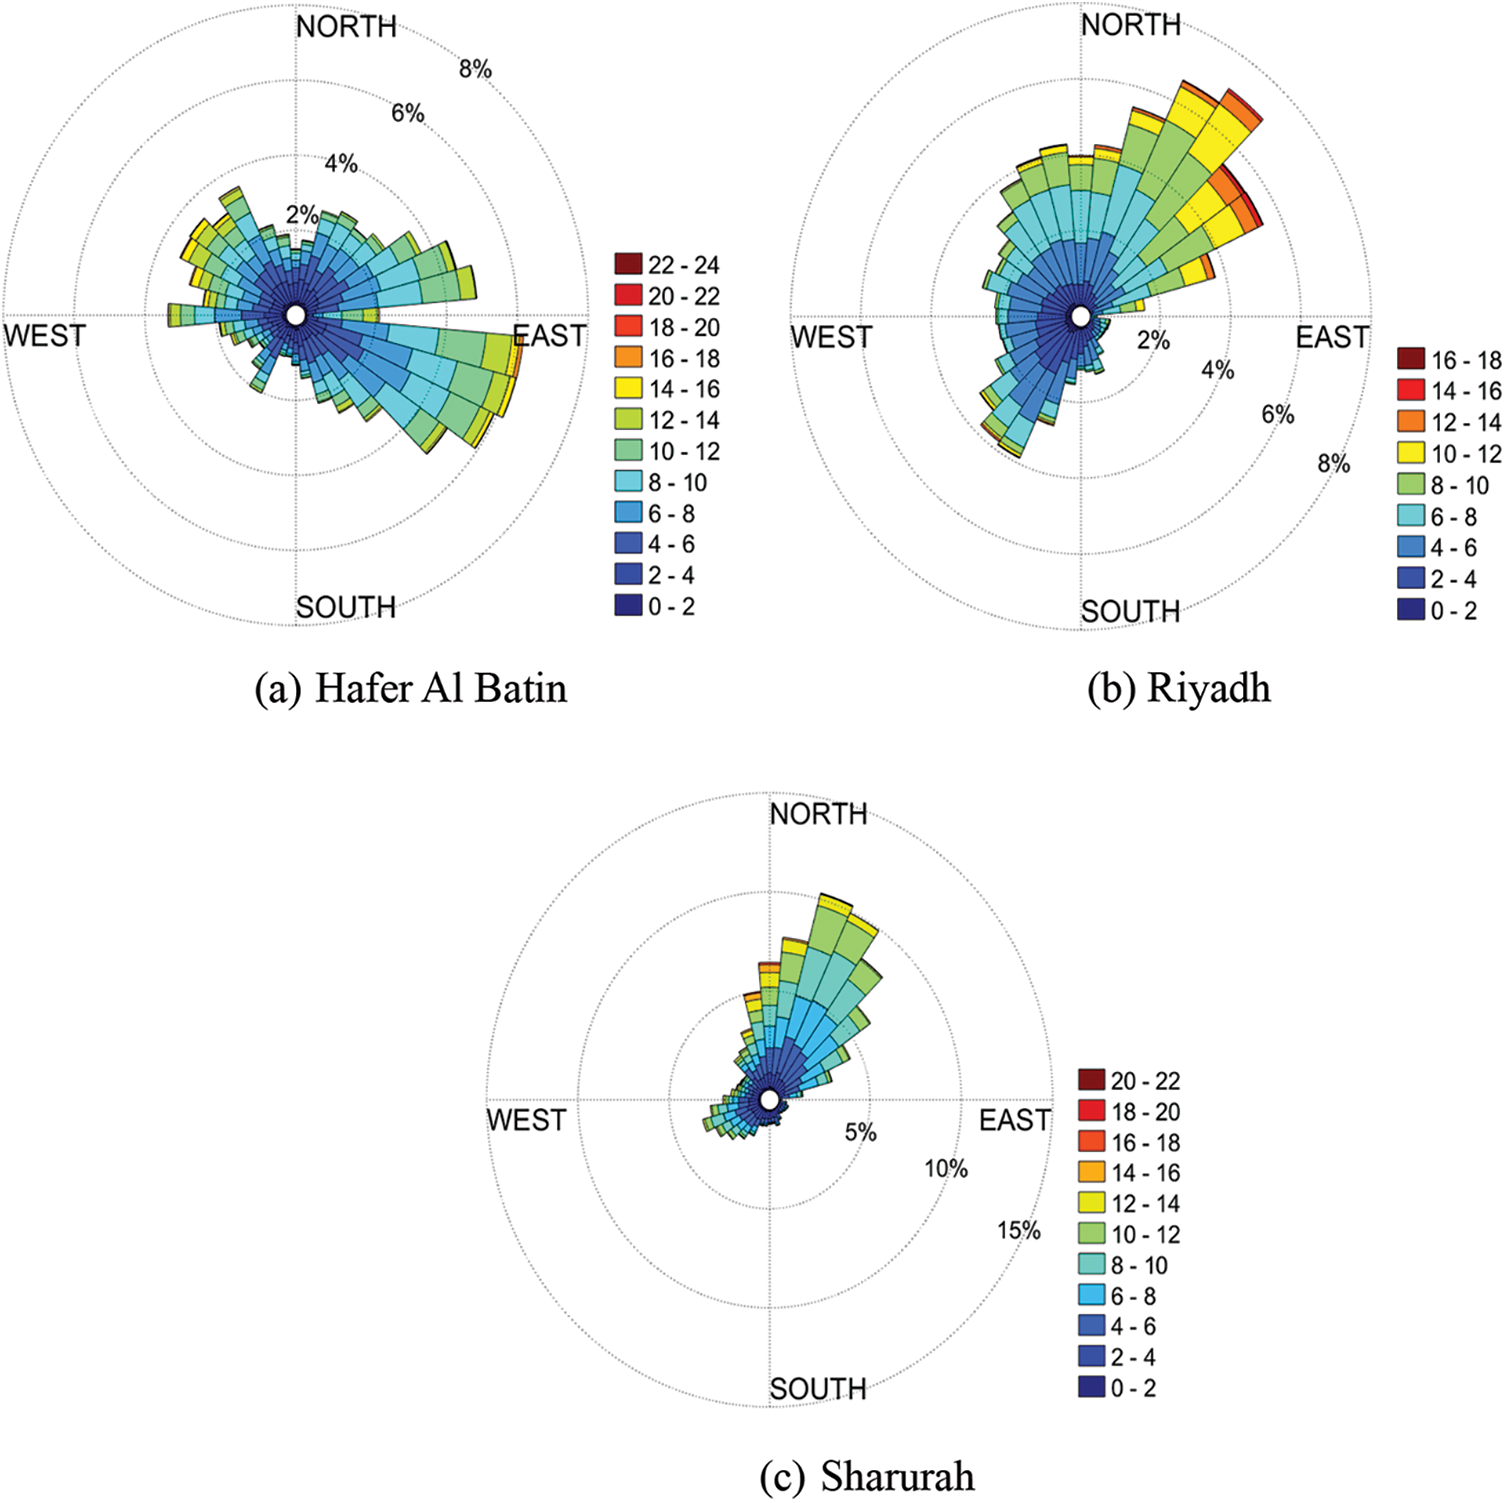
Figure 4: Wind rose plots at 80 m AGL of (a) Hafer Al Batin (b) Riyadh (c) Sharurah
Figs. 5a–5c show the histogram of the measured frequencies at all considered sites and the theoretical PDF models generated from the estimation methods. These figures generally show that all estimation methods exhibit good performance in attaining c and k, leading to an adequate fitting accuracy. However, LSM is shown to be less precise in representing the actual wind speed.
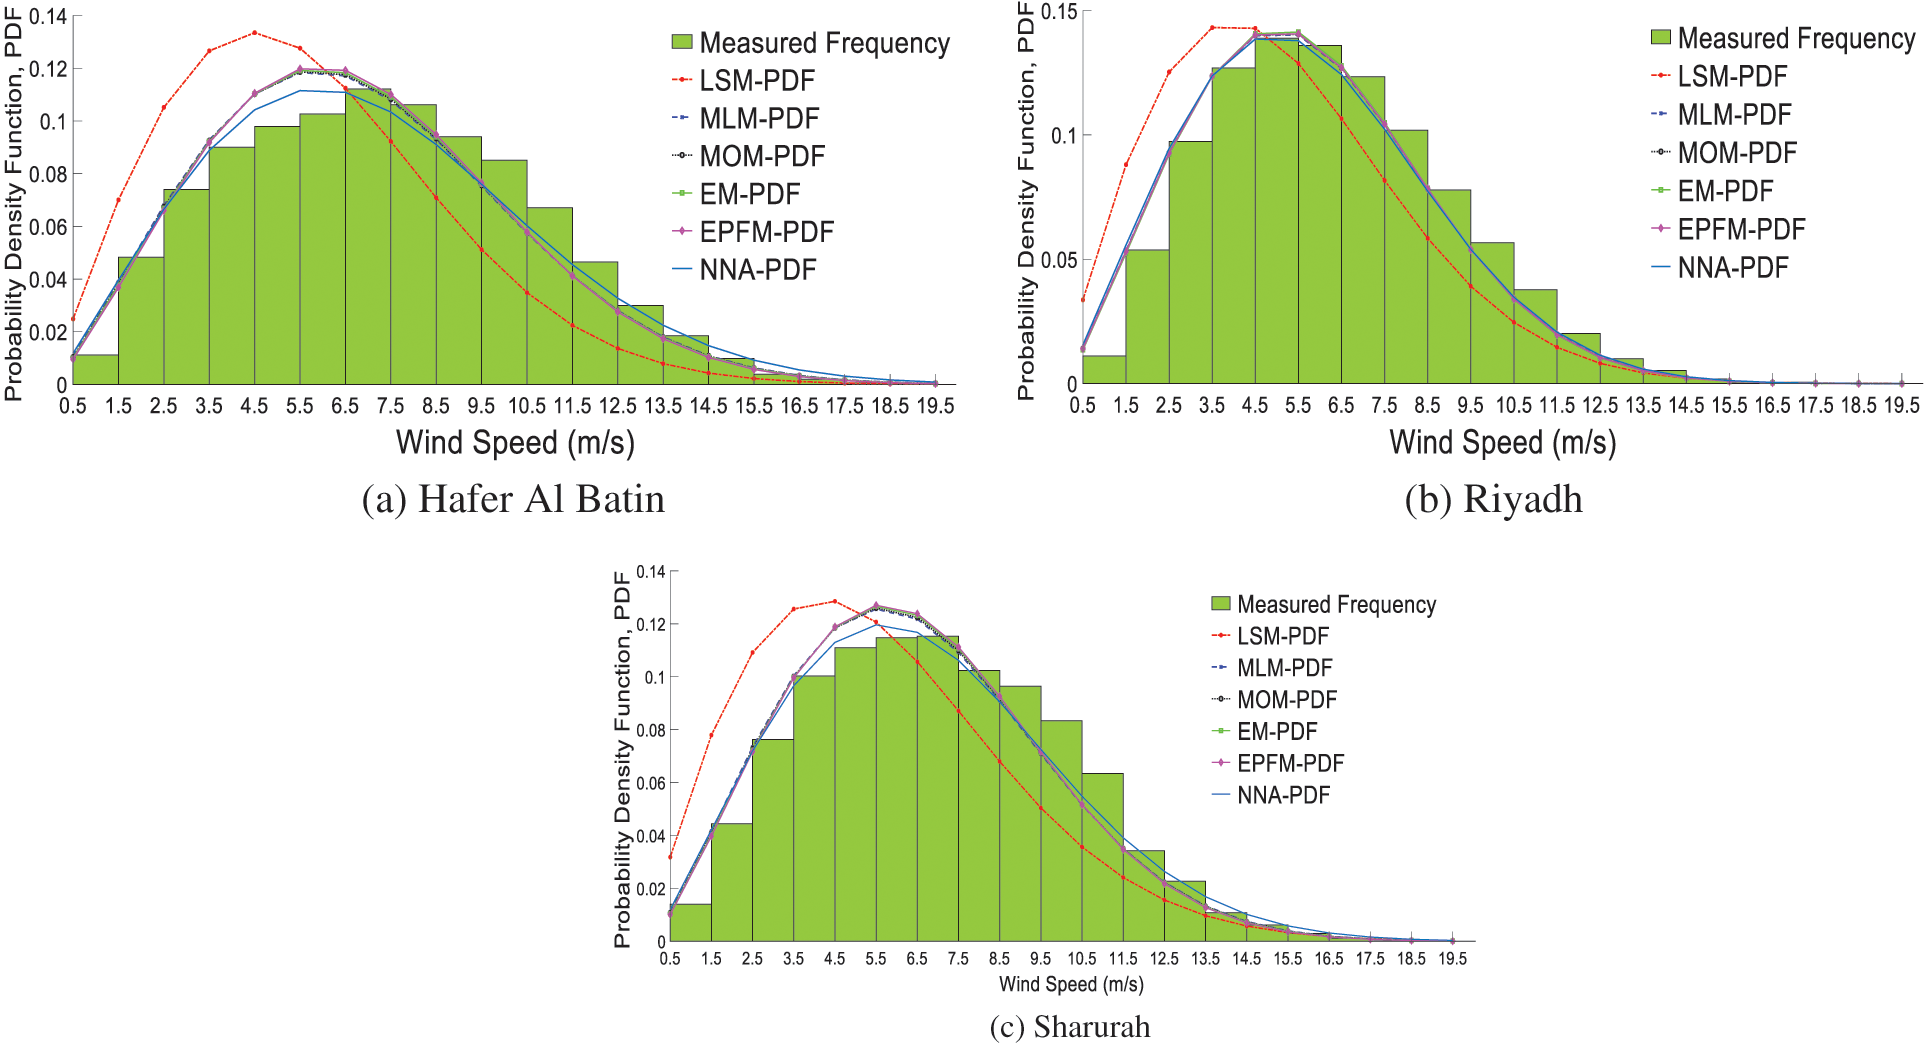
Figure 5: Histogram and theoretical PDFs of estimation methods at (a) Hafer AlBatin (b) Riyadh (c) Sharurah
Table 3 summarizes the results of the statistical tests, including RMSE, R2, and MAE. The NNA algorithm outperforms all the numerical methods in estimating the two Weibull parameters with R2 greater than 98.54% and RMSE below 0.005. The superiority of NNA can be attributed to the search mechanism of NNA. Mathematically, the NNA uses search operators and the unique design of AAN to address complex optimization problems. One benefit of NNA is that it overcomes the difficulty of fine-tuning the starting parameters, which is the main barrier that other metaheuristic algorithms encounter.
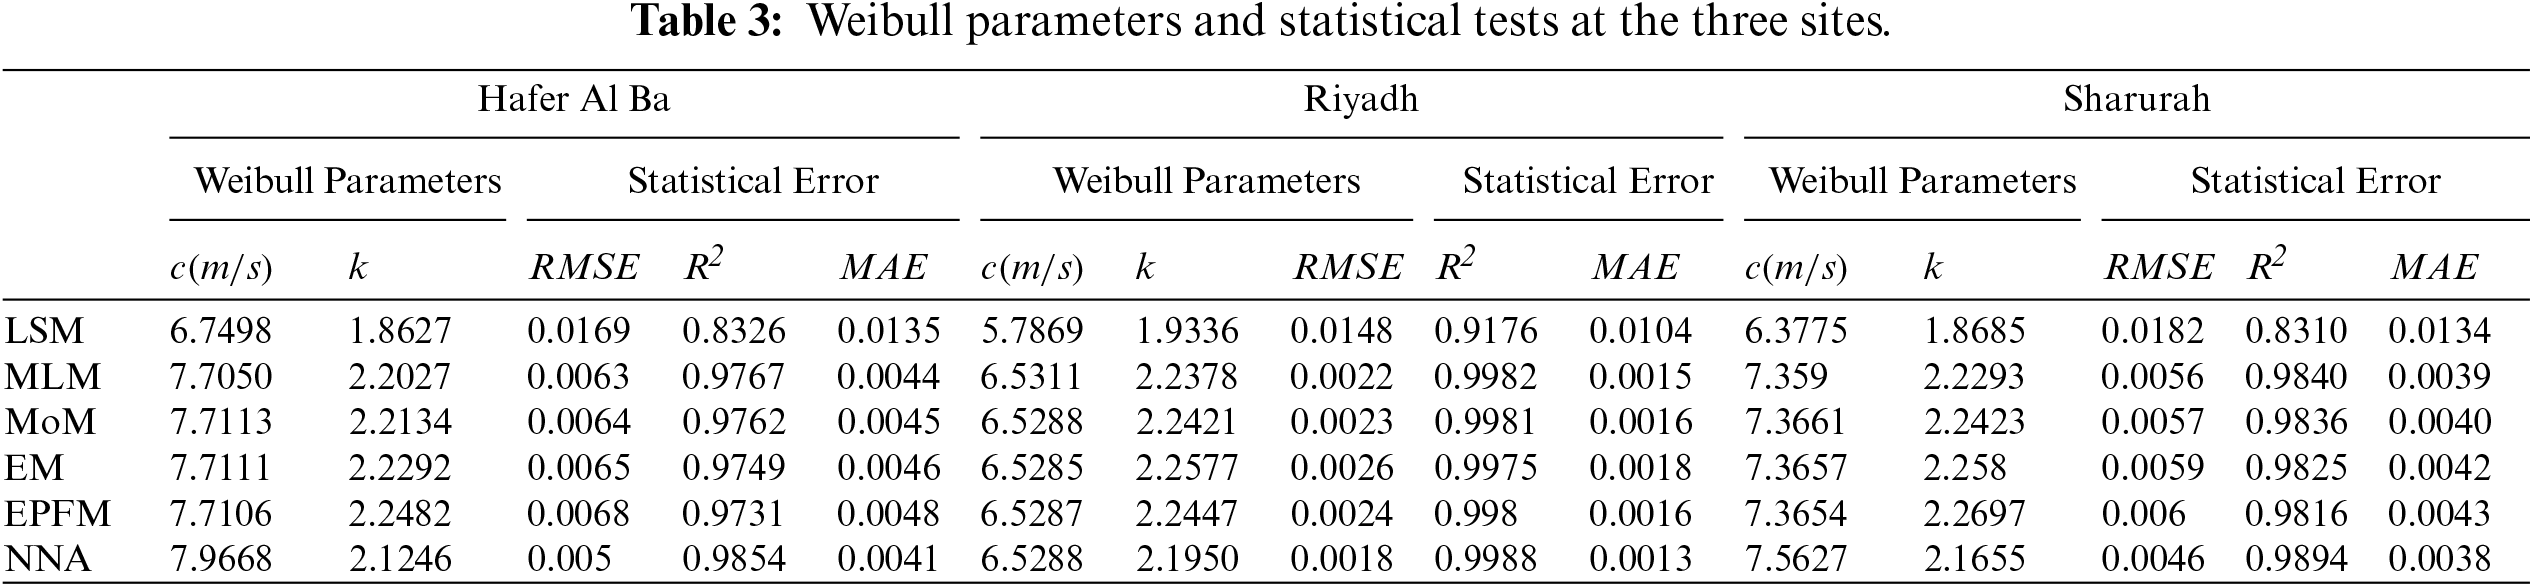
Fig. 6 shows the monthly values of the shape parameter
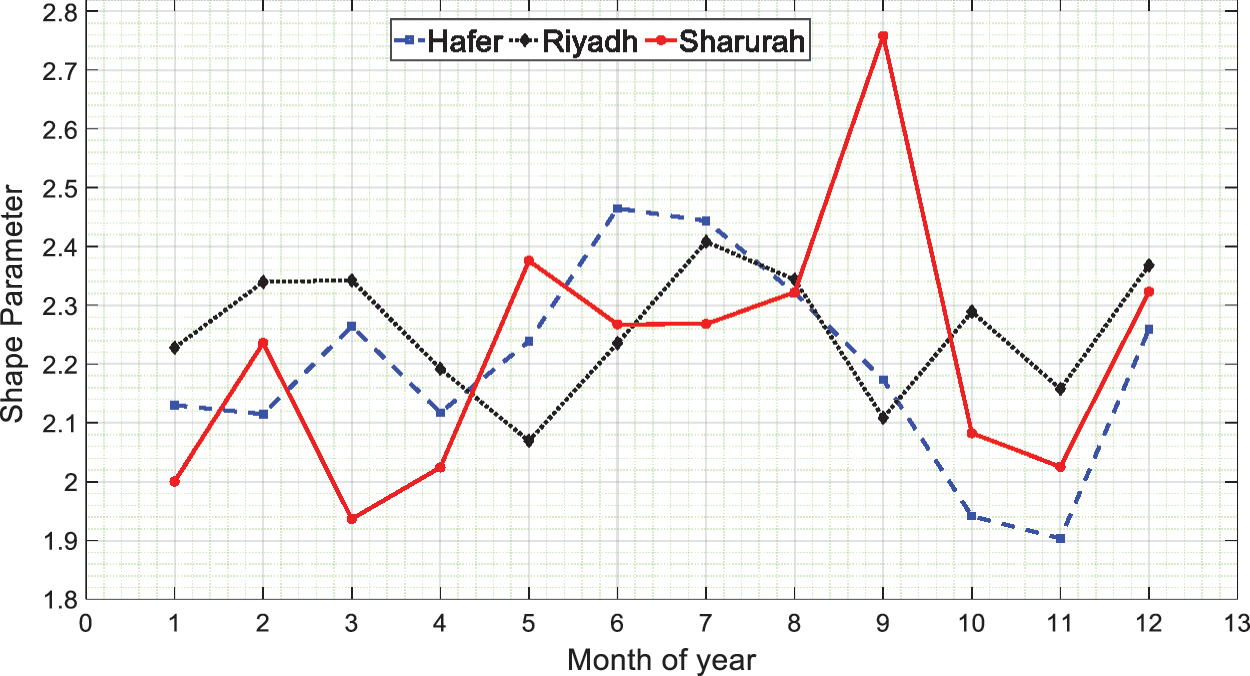
Figure 6: Monthly values of shape parameters
Fig. 7 shows the monthly values of the scale parameter
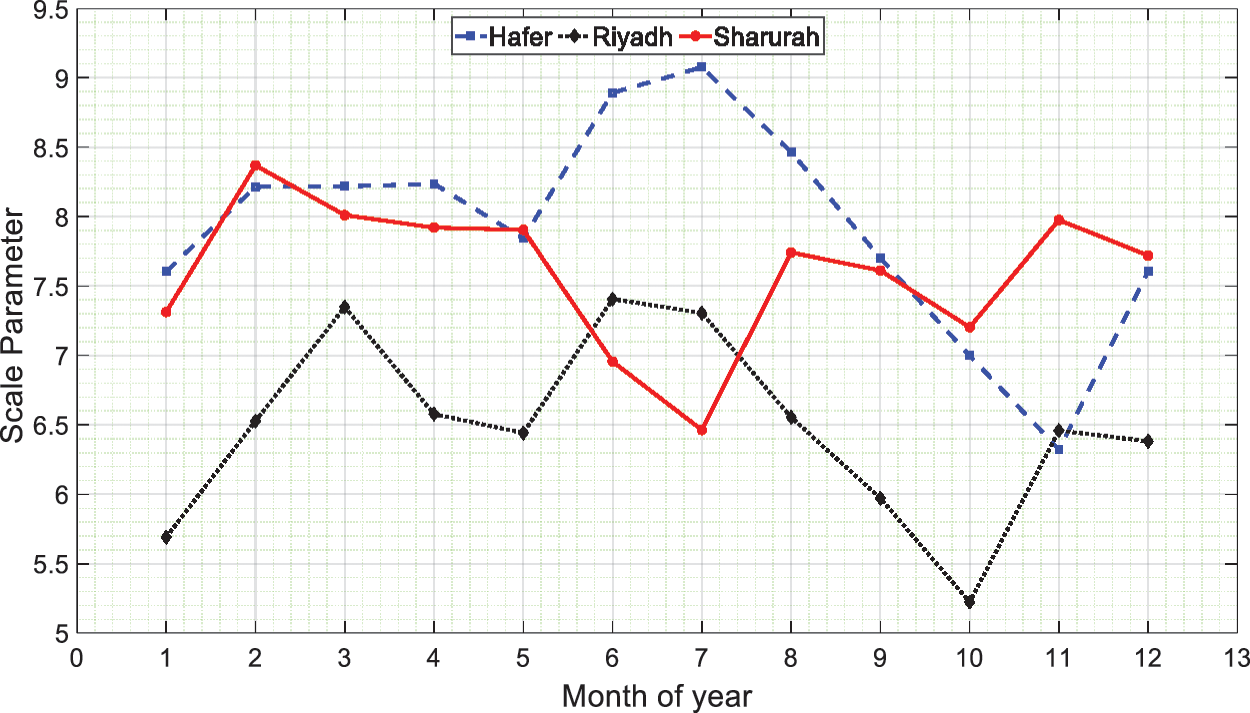
Figure 7: Monthly values of scale parameters (
For Hafer Al Batin, the annual c values were in the range of 7.71 and 7.97 m/s, while the monthly values varied between 7.84 and 9.07 m/s. Riyadh’s annual
In this study, the performance of the Neural Network Algorithm (NNA) was examined to estimate Weibull distribution parameters, namely the scale
■ The MLM appeared to be the most accurate numerical method to find the Weibull parameters c and k, with RMSE values less than 0.0063 in the selected site. On the other hand, LSM has poor performance in obtaining the parameters.
■ In terms of describing observed wind speed, results show that NNA outperformed numerical estimation methods with R2 greater than 0.9854 and RMSE not exceeding 0.005.
■ NNA exhibits an adequate fitting accuracy to wind speed data. Hence, it may become an accurate estimation approach to evaluate wind energy potential in Saudi Arabia.
In this study, five numerical estimation methods are used. Other numerical methods, such as Percentile Method and Modified MLM, can be further investigated in future works. In addition, the NNA algorithm is used in this study to estimate the Weibull parameters. Other optimization approaches, such as Differential Evolution and Particle Swarm Optimization, can be applied, and their performance can be evaluated with the NNA. These algorithms can be compared in terms of their searching capability and convergence rates. Finally, the study used the Weibull distribution function to characterize wind speed. Other distributions, including Rayleigh and Gamma distribution functions, can be further investigated by comparing their fitting accuracy with the study findings.
Acknowledgement: The author extends his appreciation to the Deputyship for Research & Innovation, Ministry of Education, Saudi Arabia for funding this research work through the project number (QU-IF-4-3-3-31466). The authors also thank to Qassim University for technical support.
Funding Statement: The author extends his appreciation to the Deputyship for Research& Innovation, Ministry of Education, Saudi Arabia for funding this research work through the project number (QU-IF-4-3-3-31466). The authors also thank to Qassim University for technical support.
Conflicts of Interest: The author declares that they have no conflicts of interest to report regarding the present study.
References
1. REN21. 2020, Renewables 2020 global status report. Paris, France: REN21 Secretariat, 2020. [Online]. Available: http://www.ren21.net/resources/publications/. [Google Scholar]
2. G. A. Tularam and Y. Alsaedi, “Electricity consumption, peak load and GDP in Saudi Arabia: A time series analysis,” in Proc.- 22nd Int. Congress on Modelling and Simulation, Hobart, Tasmania, Australia, pp. 202–208, 2017. [Google Scholar]
3. S. Soummane and F. Ghersi, “Projecting Saudi sectoral electricity demand in 2030 using a computable general equilibrium model,” Energy Strategy Reviews, vol. 39, pp. 100787, 2022. [Google Scholar]
4. I. Tlili, “Renewable energy in Saudi Arabia: Current status and future potentials,” Environment,” Development and Sustainability, vol. 17, no. 4, pp. 859–886, 2015. [Google Scholar]
5. Kingdom of Sauid Arabia, Saudi Vision 2030, Riyadh, Saudi Arabia, 2016. [Online]. Available: http://www.vision2030.gov.sa/. [Google Scholar]
6. Aramco, Commissioning of First Wind Turbine in Turaif, Riyadh, Saudi Arabia, 2017. [Online]. Available: http://www.saudiaramco.com/en/home/news-media/news/first-wind-turbine.html.and. [Google Scholar]
7. Q. Hu, Y. Wang, Z. Xie, P. Zhu and D. Yu, “On estimating uncertainty of wind energy with mixture of distributions,” Energy, vol. 112, pp. 935–962, 2016. [Google Scholar]
8. Y. Dong, J. Wang, H. Jiang and X. Shi, “Intelligent optimized wind resource assessment and wind turbines selection in Huitengxile of Inner Mongolia, China,” Applied Energy, vol. 109, pp. 239–253, 2013. [Google Scholar]
9. T. B. M. J. Ouarda, C. Charron, J. Y. Shin, P. R. Marpu, A. H. Al-Mandoos et al., “Probability distributions of wind speed in the UAE,” Energy Conversion and Management, vol. 93, pp. 414–434, 2015. [Google Scholar]
10. J. Wang, J. Hu and K. Ma, “Wind speed probability distribution estimation and wind energy assessment,” Renewable and Sustainable Energy Reviews, vol. 60, pp. 881–899, 2016. [Google Scholar]
11. H. Jiang, J. Wang, J. Wu and W. Geng, “Comparison of numerical methods and metaheuristic optimization algorithms for estimating parameters for wind energy potential assessment in low wind regions,” Renewable and Sustainable Energy Reviews, vol. 69, pp. 1199–1217, 2017. [Google Scholar]
12. J. A. Carta, P. Ramírez and S. Velá Zquez, “A review of wind speed probability distributions used in wind energy analysis case studies in the Canary Islands,” Renewable and Sustainable Energy Reviews, vol. 13, no. 5, pp. 933–955, 2009. [Google Scholar]
13. T. C. Carneiro, S. P. Melo, P. C. M. Carvalho, A. Plínio and S. Braga, “Particle swarm optimization method for estimation of Weibull parameters: A case study for the Brazilian northeast region,” Renewable Energy, vol. 86, pp. 751–759, 2016. [Google Scholar]
14. Z. Hussain Hulio, W. Jiang and S. Rehman, “Technical and economic assessment of wind power potential of Nooriabad, Pakistan,” Energy, Sustainability and Society, vol. 7, no. 1, pp. 35, 2017. [Google Scholar]
15. N. Aries, S. M. Boudia and H. Ounis, “Deep assessment of wind speed distribution models: A case study of four sites in Algeria,” Energy Conversion and Management, vol. 155, pp. 78–90, 2018. [Google Scholar]
16. A. Eltamaly and H. Farh, “Wind energy assessment for five locations in Saudi Arabia,” Journal of Renewable and Sustainable Energy, vol. 4, no. 2, pp. 022702, 2012. [Google Scholar]
17. W. Werapun, Y. Tirawanichakul and J. Waewsak, “Comparative study of five methods to estimate Weibull parameters for wind speed on Phangan Island, Thailand,” Energy Procedia, vol. 79, pp. 976–981, 2015. [Google Scholar]
18. H. R. Alsamamra, S. Salah, J. A. H. Shoqeir and A. J. Manasra, “A comparative study of five numerical methods for the estimation of Weibull parameters for wind energy evaluation at Eastern Jerusalem, Palestine,” Energy Reports, vol. 8, pp. 4801–4810, 2022. [Google Scholar]
19. I. Tizgui, F. El Guezar, H. Bouzahir and B. Benaid, “Comparison of methods in estimating Weibull parameters for wind energy applications,” International Journal of Energy Sector Management, vol. 11, no. 4, pp. 650–663, 2017. [Google Scholar]
20. M. A. Baseera, J. P. Meyera, S. Rehmana and Md. Mahbubalama, “Wind power characteristics of seven data collection sites in Jubail, Saudi Arabia using Weibull parameters,” Renewable Energy Journal, vol. 102, pp. 35–49, 2017. [Google Scholar]
21. M. M. Salah, A. G. Abo-khalil and R. P. Praveen, “Wind speed characteristics and energy potential for selected sites in Saudi Arabia,” Journal of King Saud University-Engineering Sciences, vol. 33, no. 2, pp. 119–128, 2021. [Google Scholar]
22. P. Wais, “A review of Weibull functions in wind sector,” Renewable and Sustainable Energy Reviews, vol. 70, pp. 1099–1107, 2017. [Google Scholar]
23. H. Boutelli, A. Djafour and M. B. Danoune, “Estimation of wind power density in Ouargla region using Weibull distribution,” International Journal of Control, Energy and Electrical Engineering, vol. 8, no. 4, pp. 18–24, 2019. [Google Scholar]
24. Z. H. Hulio, W. Jiang and S. Rehman, “Techno-economic assessment of wind power potential of Hawke’s Bay using Weibull parameter: A review,” Energy Strategy Reviews, vol. 26, pp. 100375, 2019. [Google Scholar]
25. A. Sadollah, H. Sayyaadi and A. Yadav, “A dynamic metaheuristic optimization model inspired by biological nervous systems: Neural network algorithm,” Applied Soft Computing, vol. 71, pp. 747–782, 2018. [Google Scholar]
26. King Abdullah City for Atomic and Renewable Energy (K.A.CARE“Renewable resource Atlas,” , 2022. [Online]. Available: https://rratlas.kacare.gov.sa/RRMMPublicPortal/?q=en/Home. [Google Scholar]
27. P. K. Chaurasiya, S. Ahmed and V. Warudkar, “Comparative analysis of Weibull parameters for wind data measured from met-mast and remote sensing techniques,” Renewable Energy, vol. 115, pp. 1153–1165, 2018. [Google Scholar]
28. K. M. Bataineh and D. Dalalah, “Assessment of wind energy potential for selected areas in Jordan,” Renewable Energy, vol. 59, pp. 75–81, 2013. [Google Scholar]
29. P. Bhattacharya, “Weibull distribution for estimating the parameters,” in Wind Energy Management, 1st ed., no. 1, Rijeka, Croatia: InTech, pp. 3–12, 2011. [Google Scholar]
30. D. Indhumathy, C. V. Seshaiah and K. Sukkiramathi, “Estimation of Weibull parameters for wind speed calculation at Kanyakumari in India,” International Journal of Innovative Research in Science, Engineering and Technology, vol. 3, no. 1, pp. 8340–8345, 2014. [Google Scholar]
31. S. Mohanty, “Estimation of parameters of some continuous distribution functions,” M.S. Thesis, Department of Mathematics, National Institute of Technology, Rourkela, India, 2012. [Google Scholar]
32. A. K. Azad, M. G. Rasul and T. Yusaf, “Statistical diagnosis of the best weibull methods for wind power assessment for agricultural applications,” Energies, vol. 7, no. 5, pp. 3056–3085, 2014. [Google Scholar]
33. A. Allouhi, O. Zamzoum, M. R. Islam, R. Saidur, T. Kousksou et al., “Evaluation of wind energy potential in Morocco’s coastal regions,” Renewable and Sustainable Energy Reviews, vol. 72, pp. 311–324, 2017. [Google Scholar]
34. C. Renno, F. Petito and A. Gatto, “Artificial neural network models for predicting the solar radiation as input of a concentrating photovoltaic system,” Energy Conversion and Management, vol. 106, pp. 999–1012, 2015. [Google Scholar]
Cite This Article
 Copyright © 2023 The Author(s). Published by Tech Science Press.
This work is licensed under a Creative Commons Attribution 4.0 International License , which permits unrestricted use, distribution, and reproduction in any medium, provided the original work is properly cited.
 Downloads
 Citation Tools