
 Submit a Paper
 Propose a Special lssue
 Open Access
ARTICLE

An Active Image Forgery Detection Approach Based on Edge Detection
1 Department of IT Systems and Technologies, Mehmet Akif Ersoy University, Bucak Z. T. School of Applied Technology and Business, Burdur, 15300, Türkiye
2 Department of Computer Engineering, Suleyman Demirel University, Engineering Faculty, Isparta, 32200, Türkiye
* Corresponding Author: Arif Koyun. Email:
Computers, Materials & Continua 2023, 75(1), 1603-1619. https://doi.org/10.32604/cmc.2023.036216
Received 21 September 2022; Accepted 14 December 2022; Issue published 06 February 2023
 View Full Text
 Download PDF
Abstract
Recently, digital images have become the most used data, thanks to high internet speed and high resolution, cheap and easily accessible digital cameras. We generate, transmit and store millions of images every second. Most of these images are insignificant images containing only personal information. However, in many fields such as banking, finance, public institutions, and educational institutions, the images of many valuable objects like ID cards, photographs, credit cards, and transaction receipts are stored and transmitted to the digital environment. These images are very significant and must be secured. A valuable image can be maliciously modified by an attacker. The modification of an image is sometimes imperceptible even by the person who stored the image. In this paper, an active image forgery detection method that encodes and decodes image edge information is proposed. The proposed method is implemented by designing an interface and applied on a test image which is frequently used in the literature. Various tampering attacks are simulated to test the fidelity of the method. The method not only notifies whether the image is forged or not but also marks the tampered region of the image. Also, the proposed method successfully detected tampered regions after geometric attacks, even on self-copy attacks. Also, it didn’t fail on JPEG compression.Keywords
Written texts are the most important sources of information for people in history. In today’s world, the creation and distribution of visual media have become easier. People who interact with visual media tend to believe what they see, not what they read. It can be said that images are the most important source of information and they are the means of conveying information in today’s world. Images are used on almost all platforms. Today, digital images are used in many fields, such as social media, law, industry, marketing, and medicine. Due to their widespread use, digital images are often manipulated and misused. The malicious manipulation of digital images to deceive people is called digital image forgery [1]. Forgery aims to make changes in the image without leaving a trace; that is, the changes made in the image are not easily detected [2].
In the days before digital photography, it was very difficult to modify an image. To create a forged photo, more than one photo or negative had to be cut, overlapped, and pasted [3]. The first image forgery in the literature is the fake photograph in which a French photographer named Hippolyte Bayard portrayed himself as a suicide victim in 1840 [4]. In another example, in 1860, after the Civil War in the USA, a forged image was distributed in which the head of Abraham Lincoln was placed over the body of vice president John Calhoun, who died in 1850 [5]. These forgeries are shown in Fig. 1.
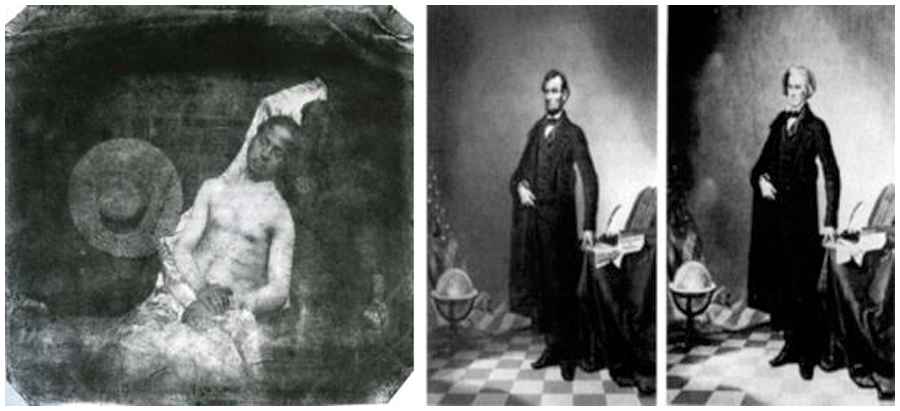
Figure 1: Image forgery before digital photography
With technological advances, almost all photographs are now created, stored, and transmitted digitally. In recent years, high-resolution cameras have become so cheap that many people can easily obtain them [6]. Powerful image processing software such as Adobe Photoshop, GIMP, Paintshop Pro, HitFilm Express, and Corel Paint are developed to edit digital images on the computer [7,8] Some of this software are paid and some are free [3]. Captured images with mobile phone-integrated high-resolution cameras can easily be edited with free software such as Google Photos, Snapseed, and Photoshop Express, and they can be sent end-to-end on the internet. These facilities enable even non-experts to do image forgery today. The use of forged images in e-mails, social media platforms, political campaigns, magazines, the fashion industry, and media organizations is increasing day by day [8]. This situation causes a decrease in trust in visual media. The forged images are mostly not detectable by the human visual system (HVS). Generally, whether an image is forged or not, there is nothing to worry about until it causes harm [3].
The most commonly used methods for image forgery can be expressed as copy-move attacks, image splicing attacks, retouching attacks, cropping attacks, and scaling attacks. The image forgery method, in which part of an image is copied and pasted into another part, is called copy-move forgery. It is also referred to as “cloning forgery” in the literature [2]. The purpose of this method is to hide a part of the image [1]. Since the copy-paste operation is performed on the same image, the basic properties of the image, such as noise, color, and texture do not change. Therefore, it is quite difficult to detect copy-move forgery [2]. In some forgery techniques, part(s) of one or more images are copied and pasted into another image [7]. These techniques are called “image splicing forgery”. Professional software such as Photoshop is used to perform this forgery. Because the source and target images are different, the high-order Fourier statistics of the forged image are generally distorted [2] and forgery can be detected by pattern analysis [1]. Techniques in which the integrity of the image is not damaged but the image is enhanced and improved, are called “retouching forgery”. In these techniques, operations such as smoothing, sharpening, and brightness and/or contrast changes can be performed on the whole or certain parts of the image. They are often used by photo editors to make the image more attractive [1]. There may be undesirable regions in some images, especially near the frame. The center of the image is magnified to remove these parts from the image. These forgery techniques are called “cropping forgery”. Especially in images with an embedded watermark or steganographic information in the spatial domain, the size or geometry of the image can be changed to destroy the hidden information. This type of attack is called a “scaling forgery”. Scaling forgery covers operations such as up-sampling, down-sampling, mirroring, skewing, and seam carving [3].
A forged image can be considered an original image by anyone as long as it is harmless. However, when an image causes harm, the image must be examined for forgery. Finding out whether the image has been manipulated is important to compensate for the damage caused by the image. The image may have been the subject of a court, news, insurance, or medical procedure [6]. There is a need for reliable methods that examine whether the image is original or manipulated [3]. In addition, if the image has been manipulated, the detection of the manipulated region is also important [3] and it is very difficult to detect [7]. The methods that perform these operations are called image forgery detection methods. As new image forgery detections are proposed, anti-forensic forgeries develop new image forgery methods to evade these techniques. Therefore, new image forgery detection techniques need to be constantly developed.
Image forgery detection methods are examined in different categories according to the detection approach. Let
Image forgery detection techniques are divided into two classes: active and passive techniques. Active techniques need information that is already embedded in the image [9]. This information is a watermark or digital signature. While performing forgery detection, it can be decided whether the image is forged by checking the integrity and authenticity of the previously placed confidential information. In the digital watermarking method,
In this study, we proposed an active forgery detection method. Active methods check the authenticity of the image by looking at the integrity of the extracted watermark or digital signature. If the watermark is spread over the entire image, it can be easily recognized that there is a watermark in the image. This is a negative situation for digital image security. Also, most parts of the watermark may be distorted when geometric transformation or compression operations are applied to the image. In this case, the image may be detected as forged even if its integrity is not compromised. In this study, an active image forgery detection method is proposed that hides a very small and imperceptible watermark data only at the important points of the image, so that it can distinguish the real image in attacks that do not destroy the image integrity, and can also detect the forged region(s).
A disadvantage of passive forgery detection methods with digital watermarking is that forgers can detect pre-processed images if the same watermark is embedded in all images during the preprocessing stage. A watermark can be perceived by the HVS when it is embedded in the frequency domain with an average watermark strength factor. A watermark embedded in the spatial domain is not easily detected by HVS and does not cause a significant change in the statistical values of the image. One of the most important pieces of information that reflects the details of an image is the edge data of the image. In this paper, we propose a new method that creates and embeds a specific watermark that contains particular edge information of the image. We used Lena’s image as the distributed test image. We applied various image forgery techniques to the test image and evaluated the success of the proposed forgery detection method. The flow chart of the proposed method is shown in Fig. 2.
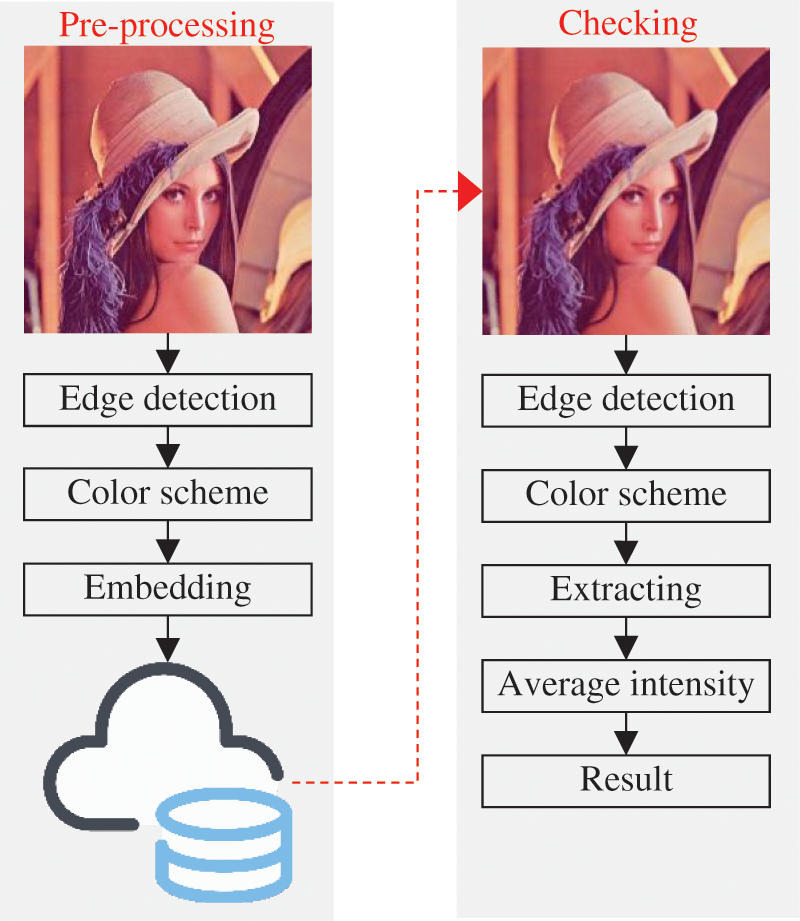
Figure 2: Flow chart of the proposed method
In the pre-processing phase, a pre-processed image is obtained by applying a series of operations on the original image. These operations are mapping the edge matrix of the original image, separating the image into color channels, and embedding the edge map into the corresponding color channels, respectively. The resulting image obtained at the end of these processes is aimed to be at a minimum distance from the original image, and it is ready to be distributed in an insecure digital environment.
The sudden change in intensity while moving linearly in one direction over an image is called an edge [11]. The edge is the transition point from one piece of information to another one on the image. The methods that connect these points and localize the edges are called edge detection methods. An edge detection algorithm is based on the original image and locates the edge by obtaining the differentiation of the obvious gray changes in the image and it uses the gradient changes between the light and the shade [12]. Edge detection is frequently used in image processing applications to separate objects on the image from each other [13]. Edge detection is performed with different methods such as gradient sensitivity, object function, artificial neural network, Bayesian approach, wavelet transform, morphology, genetic algorithm, etc. The most widely used edge detection methods are classical methods such as Robert, Sobel, and Prewitt, which obtain gradients by processing neighboring pixels [14]. These methods use kernel matrices of different sizes depending on the application to obtain the gradient. These matrices are called “kernel” or “edge detection operators”. Edge detection is difficult on noisy images because the edges in such images contain high frequencies. Attempting to reduce noise may cause distortion or blurring of edges [15]. Conventional operators are sensitive to noise, but they cannot prevent interference [16]. The Canny operator is often used in applications that require a high signal-to-noise ratio (SNR) and detection sensitivity. Therefore, the Canny operator for edge detection is used in the method proposed in this paper.
The Canny operator is proposed by J. F. Canny [17] and is mentioned in the literature as a multi-scale optimal edge detector [12,18]. The main goals of the Canny algorithm are a low error rate, a minimal difference between real edge pixels and calculated edge pixels, and a single response to an edge. Let
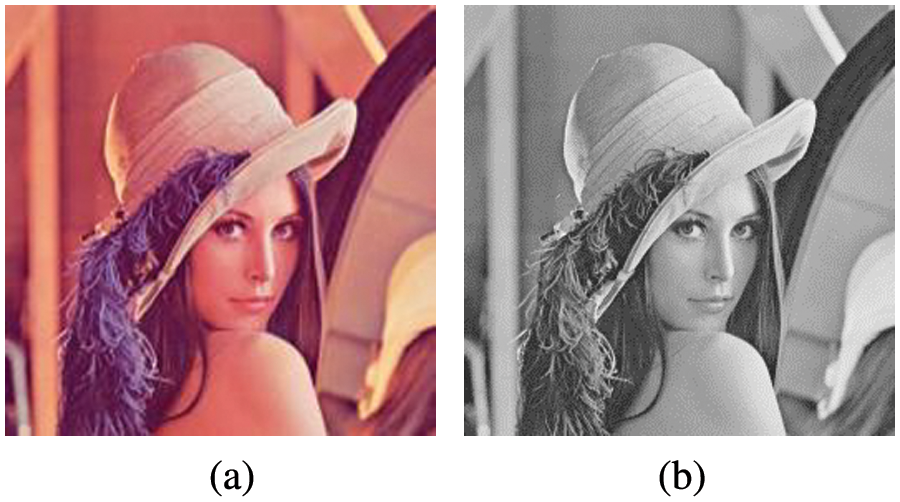
Figure 3: (a) I(m, n) (b) S(m, n)
To remove possible noise in the S image, a two-dimensional Gaussian filter is applied to obtain a smoothed
Here,
Edge strength can be determined by finding which direction the brightness changes most in a neighboring pixel group in a monochrome image [20]. The gradient information is obtained on x and y coordinates by moving the
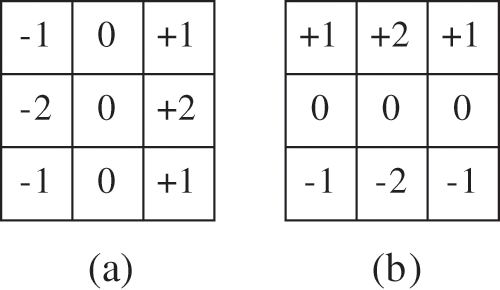
Figure 4: (a) Cx and (b) Cy convolution matrices
The gradient of an image shows the change in color intensity as we move through the image in one direction. In other words, the gradient is a vector quantity with direction and magnitude (Fig. 5), and it is one of the fundamental parts of image processing.

Figure 5: Sample image gradient vector
Let
And the direction of this gradient
For example, if
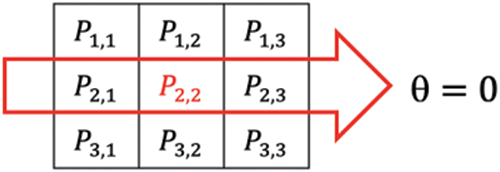
Figure 6: Sample image portion Px,y for convolution
We figure out the gradient of the
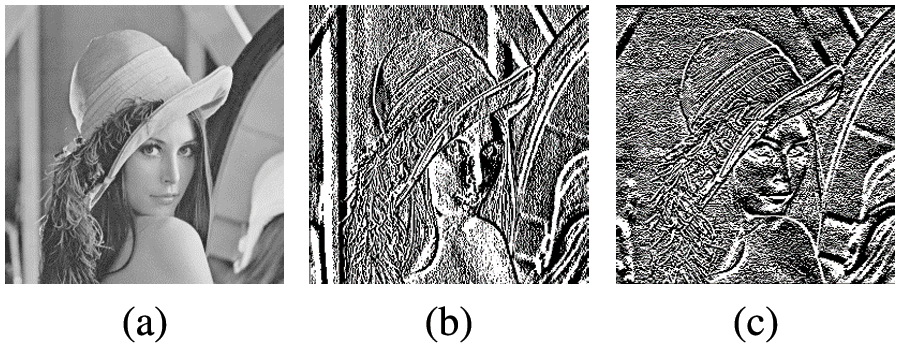
Figure 7: (a) S(m, n) (b) hx (c) hy
The resulting gradient vector
Now, some regions are perceived as edges that are not actually edges due to high-frequency noise above
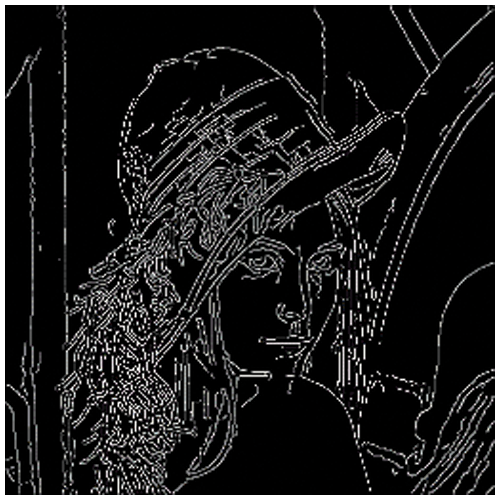
Figure 8: Binary edge matrix E (m, n) of test image
A color scheme is a model that mathematically expresses the color information of an image [21]. In digital image processing applications, there are color-based Red Green Blue (RGB), tone-based Hue Saturation Value (HSV), Hue Saturation Intensity (HSI), Hue Saturation Lightness (HSL), and brightness-based luminance chrominance color scheme (YCbCr). The RGB color scheme is based on the mathematical expression of the intensity of the primary colors red, green, and blue for storing digital images. Tone-based color schemes are often used to distinguish regions of the desired color within an image. Brightness-based color schemes are frequently used in image compression methods. In this study, the YCbCr color scheme is chosen to embed the watermark in the spatial domain. Because, the embedding process is performed with a steganographic approach, and the YCbCr color space is the optimum technic for a spatial domain application [22]. Let,
Each
Thus,
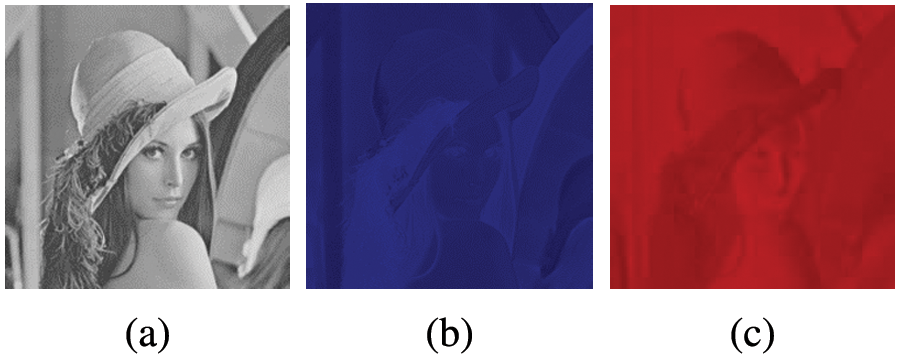
Figure 9: Y, Cb and Cr matrices of the test image
If
Binary expression of the
Here, the last 3 bits in the binary expression of
The maximum data size stored by 3LSBs is 23 = 8. Since the total data size is 28 = 256, the change of all the 3LSBs in this color channel causes only a change of 8/256 = 3.125%. This negligible change in the
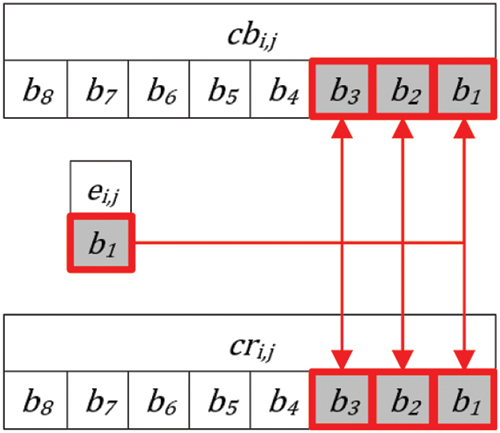
Figure 10: Embedding E binary matrix to 3LSBs of chrominance channels
The modified Cb′ and Cr′ matrices are combined with the
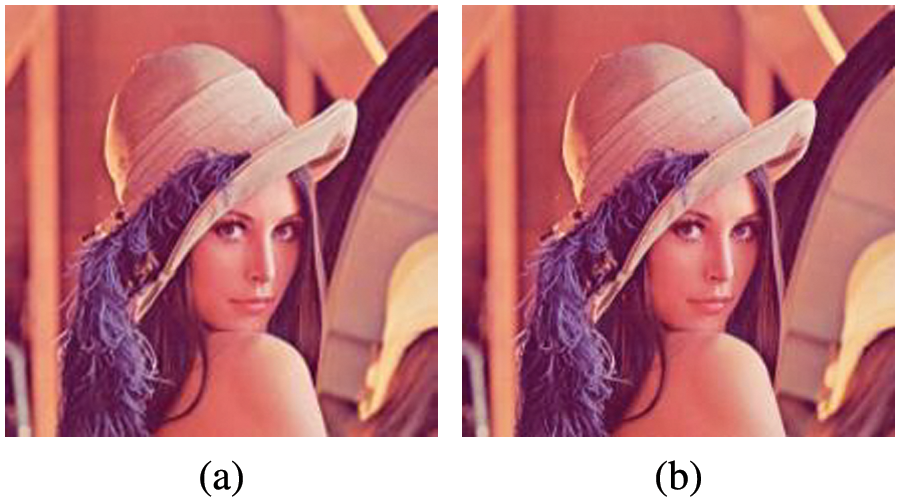
Figure 11: (a) Original test image I, (b) pre-processed test image P
If the embedded data in the pre-processed image is detected by the HVS, we can say that this method has failed. There are some mathematical methods for measuring how far an image deviates from the original after it has been manipulated. In this paper, Peak Signal-to-Noise-Ratio (PSNR), Normalized Correlation (NC), and Structural Similarity Index Measure (SSIM) values are measured to evaluate the perceptual distance from
Here,
SSIM is calculated by
If
The main purpose of this step is to detect whether
Let E′ be the edge matrix obtained from E′. There is definitely a noise difference between
For an unmanipulated
Natural noise is diffused, while artificial noise is concentrated in the manipulation area. So, the artificial noise in
The results of the average intensity phase on the unforged test image are shown in Fig. 12. It is clearly seen that natural noise is completely eliminated.
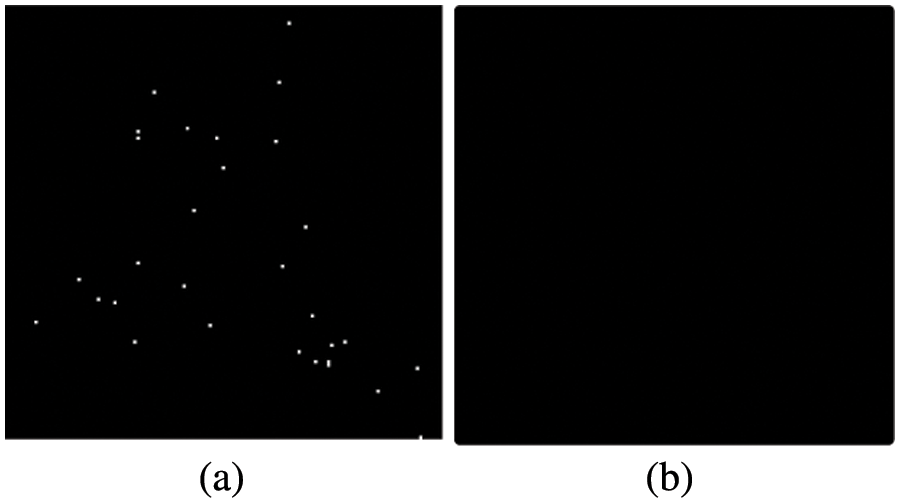
Figure 12: (a) N with natural noise (b) N after average intensity phase
We can decide if the distributed image
It is important to select the correct
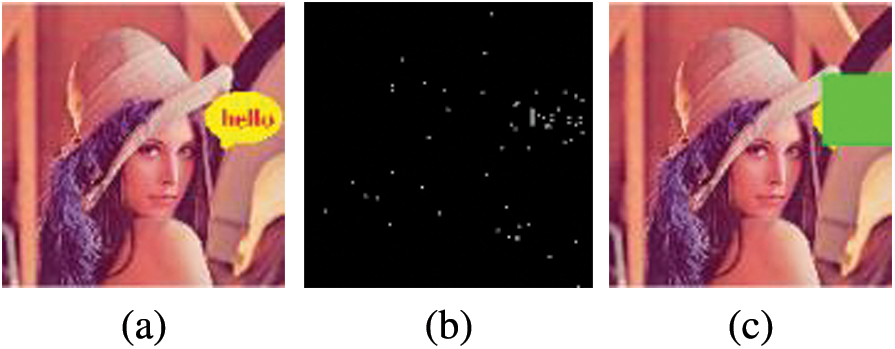
Figure 13: (a) Forged P (b) N of P (c) estimated forged region
Generally, the performance of a forgery detection method is evaluated by HVS. The weakness of forgery detection methods is that they perceive the unforged image as forged or the forged image as unforged. Also, some methods have the ability to detect the tampered region of the image. But the weakness of these methods is that they may perceive the unforged region as forged or the forged region as unforged.
In statistics, the probability that a value that is actually negative will be falsely classified as positive is called the False Positive Rate (FPR)
FPR is calculated as a decision maker for
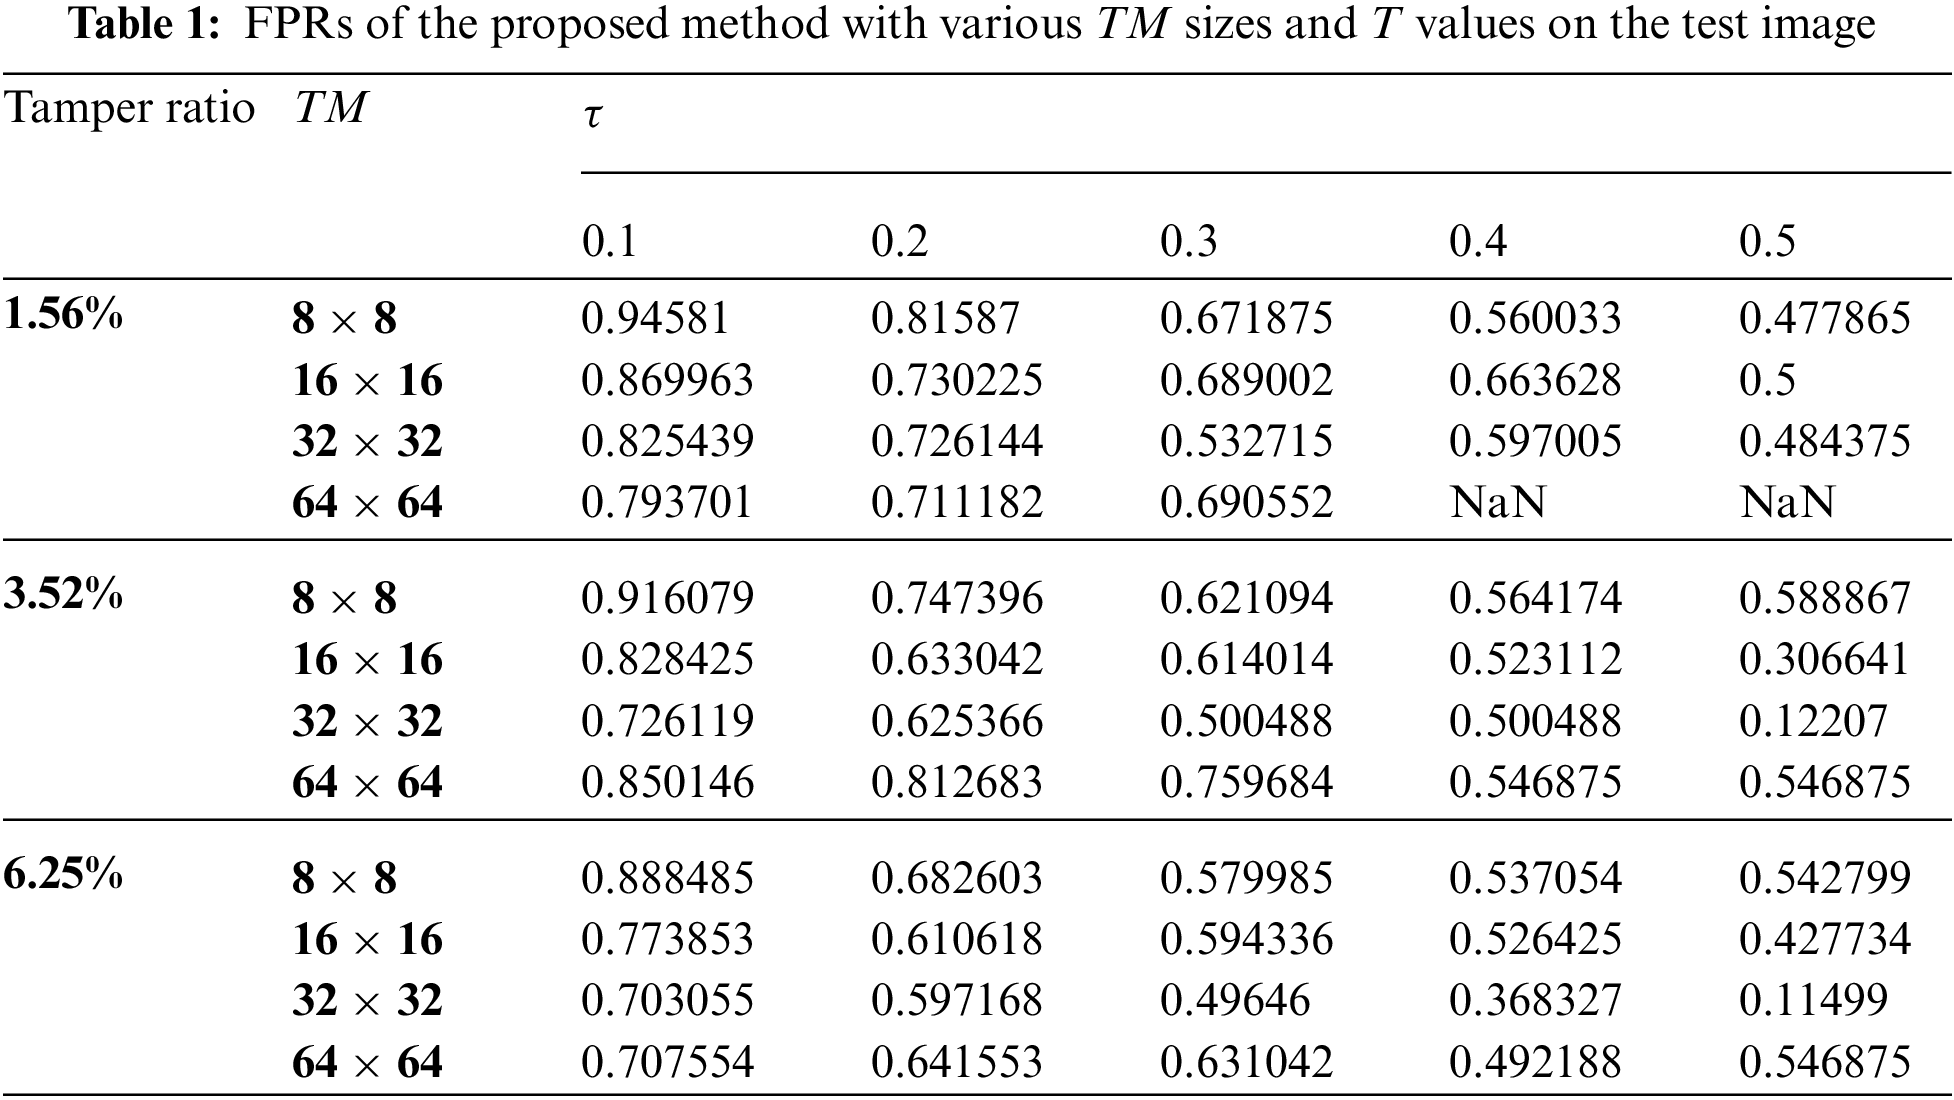
The lowest FPR is the best. When the results are analyzed, it is clearly seen that optimum values gather around
For an image to be considered forged, it must have been irreversibly altered. Copy-move, cropping, splicing, and retouching attacks irreversibly distort the image, but geometric attacks such as mirroring, scaling, and rotating only change the geometry of the image. Images exposed to geometric attacks are not considered as forged because these attacks do not make a semantic change to the image. We simulated the proposed method on all these attacks, and the results are shown in Table 2.
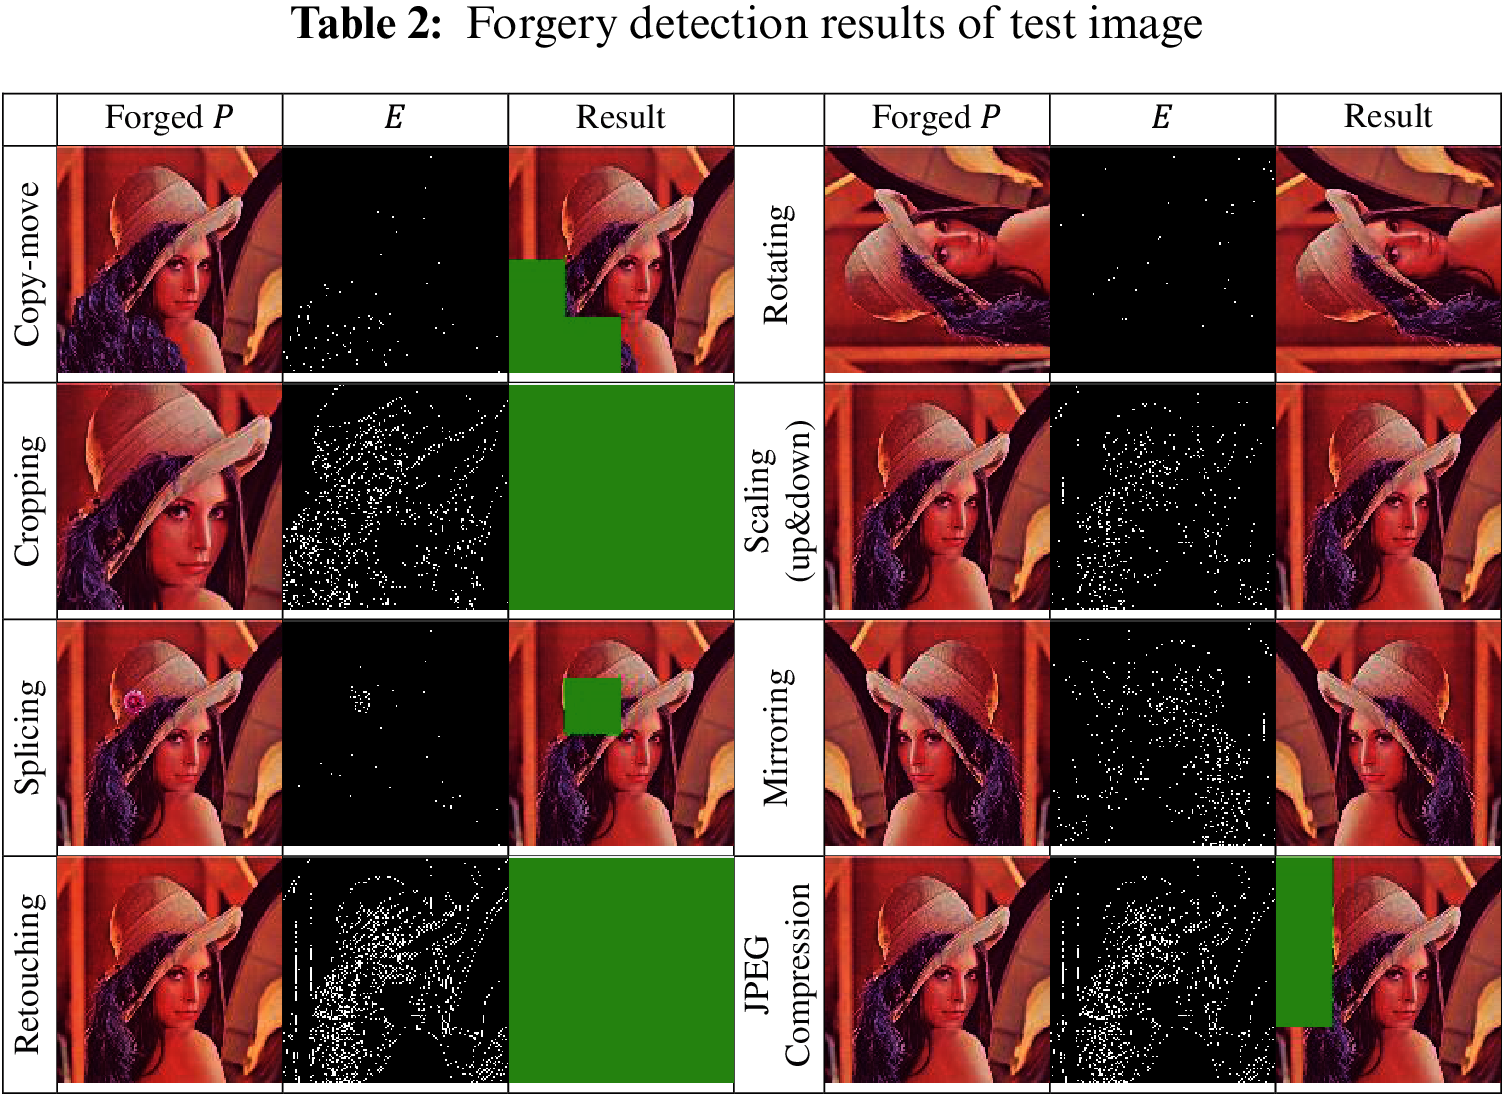
The green areas are marked as tampered regions in the result column. As it is seen, the proposed method clearly identified the tampered regions on forged images, and it did not fail on geometric attacks. Also, it identified the JPEG compressed image as partially forged.
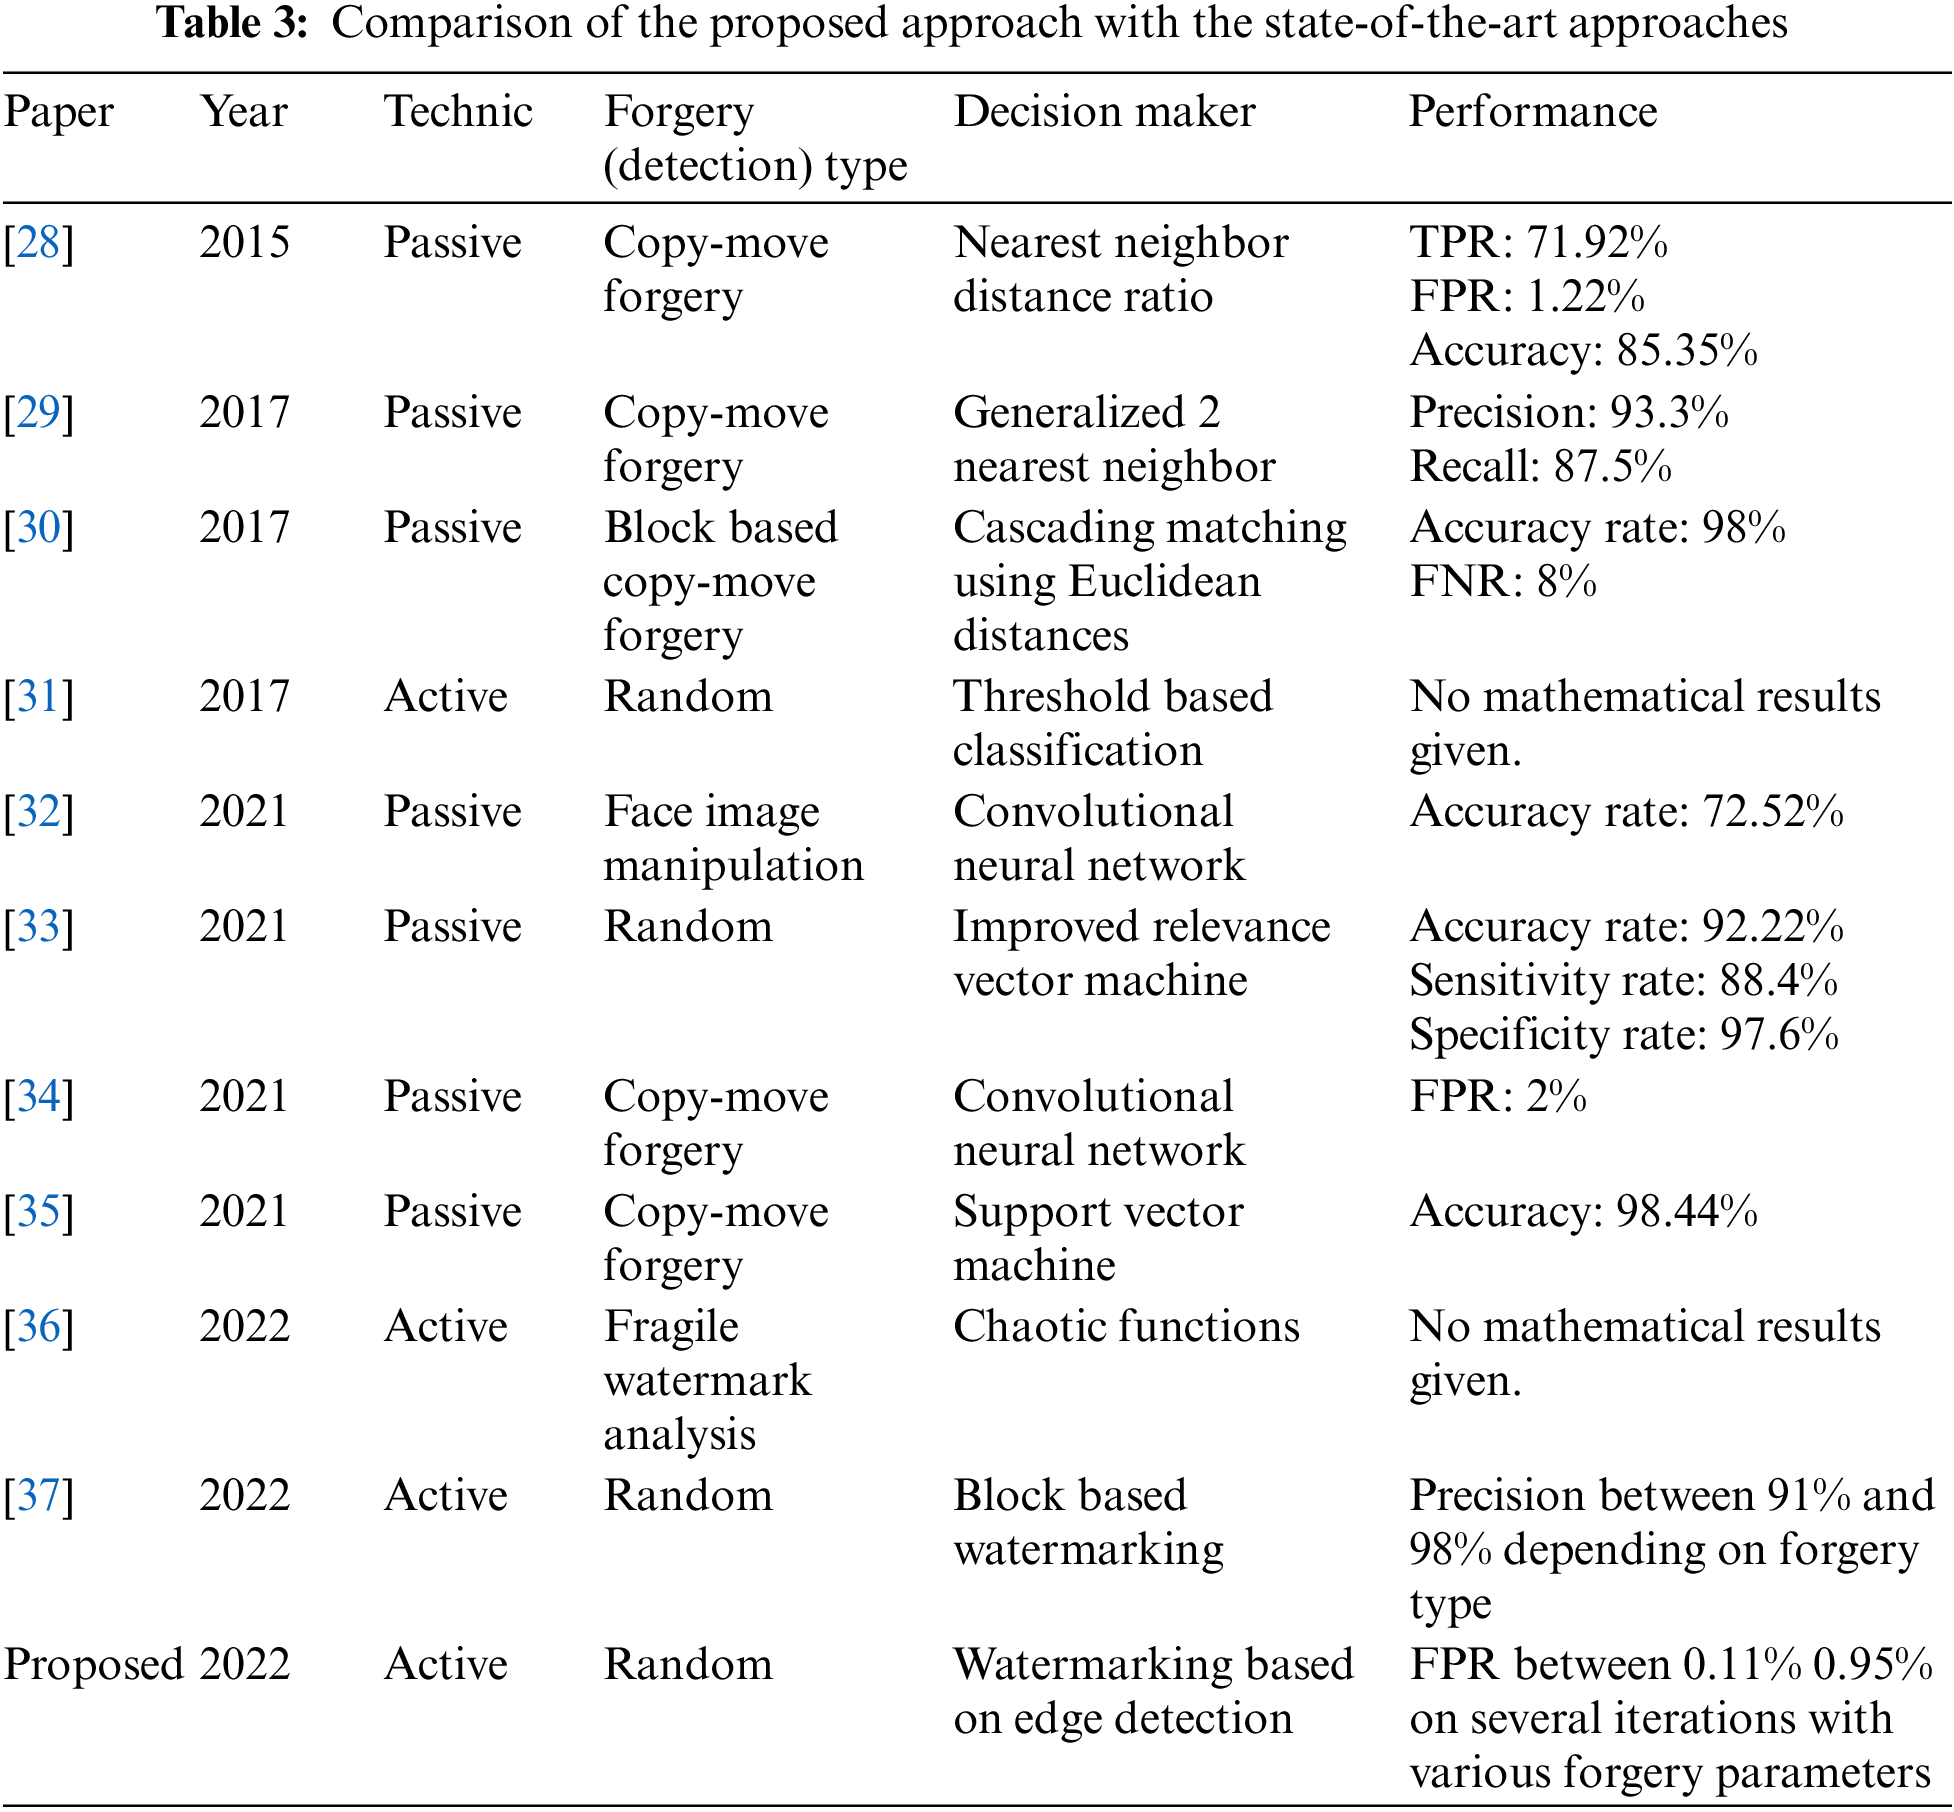
Table 3 shows the qualitative comparison of the proposed approach with state-of-the-art approaches The results of this table indicate that the proposed approach has pros and cons. The pros are: (1) it does not need any side information to detect forgery; (2) it can be used for image copyright protection; (3) it is robust to known attacks; (4) it is the only approach that performs tests and gives results on different ratios of forgery. The cons are: (1) It is an active method and needs pre-processing; (2) since it is an active method, it cannot be compared mathematically with passive methods.
An image cannot protect itself when taken to storage or transmission media. Various methods have been proposed in the literature to ensure image security. In this paper, we propose an active image forgery detection method that performs image security by embedding edge information in the image’s chrominance layers in an imperceptible way. We coded the proposed method with the MATLAB programming language and tested it with the Lena test image with several different parameters. The proposed method has detected 100% of the forgery attacks such as copy-move and image splicing that perform partial tampering of the image. In addition, it detected the whole forgery on retouched or cropped images. We measured the FPR values with different parameters to monitor situations where the proposed method might fail. Finally, the method showed its success by confirming the originality of the image in rotating, mirroring, and scaling attacks, which many image forgery detection methods perceive as a forgery.
Funding Statement: The authors received no specific funding for this study.
Conflicts of Interest: The authors declare that they have no conflicts of interest to report regarding the present study. And all authors have equally contributed.
References
1. C. Kaur and N. Kanwal, “An analysis of image forgery detection techniques,” Statistics Optimization and Information Computing, vol. 7, no. 2, pp. 486–500, 2019. [Google Scholar]
2. A. Kashyap, R. S. Parmar, M. Agarwal and H. Gupta, “An evaluation of digital image forgery detection approaches,” ArXiv, vol. 12, no. 15, pp. 4747–4758, 2017. [Google Scholar]
3. S. Walia and K. Kumar, “Digital image forgery detection: A systematic scrutiny,” Australian Journal of Forensic Sciences, vol. 51, no. 5, pp. 488–526, 2019. [Google Scholar]
4. T. Qazi, K. Hayat, S. U. Khan, S. A. Madani, I. A. Khan et al., “Survey on blind image forgery detection,” IET Image Processing, vol. 7, no. 7, pp. 660–670, 2013. [Google Scholar]
5. H. Farid, “Digital doctoring: How to tell the real from the fake,” Significance, vol. 3, no. 4, pp. 162–166, 2006. [Google Scholar]
6. K. Asghara, Z. Habiba and M. Hussain, “Copy-move and splicing image forgery detection and localization techniques: A review,” Australian Journal of Forensic Sciences, vol. 49, no. 3, pp. 281–307, 2017. [Google Scholar]
7. C. N. Bharti and P. Tandel, “Survey of image forgery detection techniques,” in Proc. of IEEE WiSPNET Conf., Chennai, India, pp. 877–881, 2016. [Google Scholar]
8. H. Farid, “Image forgery detection, a survey,” IEEE Signal Processing Magazine, vol. 26, no. March Issue, pp. 16–25, 2009. [Google Scholar]
9. N. K. Gill, R. Garg and E. A. Doegar, “A review paper on digital image forgery detection techniques,” in Proc. of 8th ICCCNT, Delhi, India, pp. 1–7, 2017. [Google Scholar]
10. T. Mahmood, T. Nawaz, R. Ashraf, M. Shah, A. Khan et al., “A survey on block-based copy move image forgery detection techniques,” in Int. Conf. on Emerging Technologies (ICET), Peshawar, Pakistan, pp. 1–6, 2015. [Google Scholar]
11. S. R. Joshi and R. Koju, “Study and comparison of edge detection algorithms,” in Third Asian Himalayas Int. Conf. on Internet, Kathmandu, Nepal, pp. 1–5, 2012. [Google Scholar]
12. Z. Wang, K. Li, X. Wang and A. Lee, “An image edge detection algorithm based on multi-feature fusion,” Computers, Materials & Continua, vol. 73, no. 3, pp. 4996–5009, 2022. [Google Scholar]
13. A. Mouse, “Canny edge-detection based vehicle plate recognition,” International Journal of Signal Processing, Image Processing and Pattern Recognition, vol. 5, no. 3, pp. 1–7, 2012. [Google Scholar]
14. C. X. Deng, G. B. Wang and X. R. Yang, “Image edge detection algorithm based on improved Canny operator,” in Proc. of the 2013 Int. Conf. on Wavelet Analysis and Pattern Recognition, Tianjin, China, pp. 168–172, 2013. [Google Scholar]
15. A. Himanshu, “Study and comparison of various image edge detection techniques,” International Journal of Image Processing, vol. 3, no. 1, pp. 1–12, 2009. [Google Scholar]
16. M. Sonka, V. Hlavac and R. Boyle, Image Processing Analysis and Machine Vision. Beijing: Posts & Telecom Press, 2002. [Google Scholar]
17. J. F. Canny, “A computational approach to edge detection,” IEEE Transactions on Pattern Analysis and Machine Intelligence, vol. 8, no. 6, pp. 679–698, 1986. [Google Scholar]
18. Z. Xu, X. Baojie and W. Guoxin, “Canny edge detection based on Open CV,” in IEEE 13th Int. Conf. on Electronic Measurement & Instruments, Yangzhou, China, pp. 53–56, 2017. [Google Scholar]
19. K. Çelik, “Gradyan uyarlamalı görüntü filtresi tasarımı,” M.S. dissertation, Gazi University, Graduate School of Natural and Applied Sciences, Ankara, Turkey, 2015. [Google Scholar]
20. A. S. Ahmed, “Comperative study among Sobel, Prewitt and Candy edge detection operators used in image processing,” Journal of Theoretical and Applied Information Technology, vol. 96, no. 19, pp. 6517–6525, ISSN: 1992-8645, 2018. [Google Scholar]
21. S. Kolkur, D. Kalbande, P. Shimpi, C. Bapat and J. Jatakia, “Human skin detection using RGB, HSV and YCbCr color models,” Advances in Intelligent Systems Research, vol. 137, pp. 324–332, 2017. [Google Scholar]
22. S. Hemalatha, U. D. Acharya and A. Renuka, “Comparison of secure and high-capacity color image steganography techniques in RGB and YCBCR domains,” International Journal of Advanced Information Technology, vol. 3, no. 3, pp. 1–9, 2013. [Google Scholar]
23. E. Vahedi, R. A. Zoroofi and M. Shiva, “On optimal color coordinate selection for wavelet-based color image watermarking,” in Int. Conf. on Intelligent and Advance Systems, Kuala Lumpur, pp. 635–640, 2007. [Google Scholar]
24. A. Baumy, A. D. Algarni, M. Abdalla, W. El-Shafai, F. E. Abd El-Samie et al., “Efficient forgery detection approaches for digital color images,” Computers, Materials & Continua, vol. 71, no. 2, pp. 3257–3276, 2022. [Google Scholar]
25. C. Patvardhan, C. Kumar and C. V. Lakshmi, “Effective color image watermarking scheme using YCbCr color space and QR code,” Multimedia Tools and Applications, vol. 77, no. 10, pp. 12655–12677, 2018. [Google Scholar]
26. S. A. Laskar, “High-capacity data hiding using LSB steganography and encryption,” International Journal of Database Management Systems, vol. 4, no. 6, pp. 57–68, 2012. [Google Scholar]
27. J. A. Hussein, “Spatial domain watermarking scheme for colored images based on log-average luminance,” Journal of Computing, vol. 2, no. 1, pp. 100–103, ISSN:2151-9617, 2010. [Google Scholar]
28. E. Silva, T. Carvalho, A. Ferreira and A. Rocha, “Going deeper into copy-move forgery detection: Exploring image telltales via multi-scale analysis and voting processes,” Journal of Visual Communication and Image Representation, vol. 29, no. 1, pp. 16–32, 2015. [Google Scholar]
29. W. Zhang, Z. Yang, S. Niu and J. Wang, “Detection of copy-move forgery in flat region based on feature enhancement,” in Digital Forensics and Watermarking, Lecture Notes in Computer Science, Vol. 10082. Germany: Springer, pp. 159–171, 2017. [Google Scholar]
30. D. Huang, C. Huang, W. Hu and C. Chou, “Robustness of copy-move forgery detection under high JPEG compression artifacts,” Multimedia Tools and Applications, vol. 76, no. 1, pp. 1509–1530, 2017. [Google Scholar]
31. V. Tuba, R. Jovanovic and M. Tuba, “Digital image forgery detection based on shadow HSV inconsistency,” in 5th Int. Symp. on Digital Forensic and Security, Tirgu Mures, Romania, pp. 1–6, 2017. [Google Scholar]
32. S. Lee, S. Tariq, Y. Shin and S. S. Woo, “Detecting handcrafted facial image manipulations and GAN- generated facial images using shallow-FakeFaceNet,” Applications Soft Computing, vol. 105, no. 1, pp. 107256, 2021. [Google Scholar]
33. N. K. Rathore, N. K. Jain, P. K. Shukla, U. S. Rawat and R. Dubey, “Image forgery detection using singular value decomposition with some attacks,” Natural Academy Science Letters, vol. 44, no. 3, pp. 331–338, 2021. [Google Scholar]
34. N. Goel, S. Kaur and R. Bala, “Dual branch convolutional neural network for copy move forgery detection,” IET Image Processing, vol. 15, no. 3, pp. 656–665, 2021. [Google Scholar]
35. I. T. Ahmed, B. T. Hammad and N. Jamil, “Image copy-move forgery detection algorithms based on spatial feature domain,” in EEE 17th Int. Colloquium on Signal Processing & Its Applications, Langkawi, Kedah, Malaysia, pp. 92–96, 2021. [Google Scholar]
36. O. Benrhouma, “Cryptanalysis of a hamming code and logistic-map based pixel-level active forgery detection scheme,” International Journal of Advanced Computer Science and Applications, vol. 13, no. 2, pp. 663–668, 2022. [Google Scholar]
37. M. Z. Salim, A. J. Abboud and R. A. Yıldırım, “Visual cryptography-based watermarking approach for the detection and localization of image forgery,” Electronics, vol. 11, no. 1, pp. 136, 2022. [Google Scholar]
Cite This Article
 Copyright © 2023 The Author(s). Published by Tech Science Press.
This work is licensed under a Creative Commons Attribution 4.0 International License , which permits unrestricted use, distribution, and reproduction in any medium, provided the original work is properly cited.
 Downloads
 Citation Tools