
 Submit a Paper
 Propose a Special lssue
 Open Access
ARTICLE

Quantum Fuzzy Regression Model for Uncertain Environment
1 School of Cybersecurity, Chengdu University of Information Technology, Chengdu, 610225, China
2 Advanced Cryptography and System Security Key Laboratory of Sichuan Province, Chengdu, 610255, China
3 School of Engineering and Technology, University of Hertfordshire, Hertford, UK
* Corresponding Author: Yan Chang. Email:
Computers, Materials & Continua 2023, 75(2), 2759-2773. https://doi.org/10.32604/cmc.2023.033284
Received 13 June 2022; Accepted 17 November 2022; Issue published 31 March 2023
 View Full Text
 Download PDF
Abstract
In the era of big data, traditional regression models cannot deal with uncertain big data efficiently and accurately. In order to make up for this deficiency, this paper proposes a quantum fuzzy regression model, which uses fuzzy theory to describe the uncertainty in big data sets and uses quantum computing to exponentially improve the efficiency of data set preprocessing and parameter estimation. In this paper, data envelopment analysis (DEA) is used to calculate the degree of importance of each data point. Meanwhile, Harrow, Hassidim and Lloyd (HHL) algorithm and quantum swap circuits are used to improve the efficiency of high-dimensional data matrix calculation. The application of the quantum fuzzy regression model to small-scale financial data proves that its accuracy is greatly improved compared with the quantum regression model. Moreover, due to the introduction of quantum computing, the speed of dealing with high-dimensional data matrix has an exponential improvement compared with the fuzzy regression model. The quantum fuzzy regression model proposed in this paper combines the advantages of fuzzy theory and quantum computing which can efficiently calculate high-dimensional data matrix and complete parameter estimation using quantum computing while retaining the uncertainty in big data. Thus, it is a new model for efficient and accurate big data processing in uncertain environments.Keywords
With the development of information technology, big data security and computing efficiency are essential research directions. In terms of big data security, such as digital continuity and application in the industrial field [1–5], the complexity of big data is bound to bring uncertainty and create an uncertain environment in which the accuracy, efficiency, security, robustness of big data algorithms are confronted with significant challenges. Traditional regression models have strong interpretability and accuracy. Predictions can be well predicted and analyzed when the original data sets are linear and independent. The parameters are obtained mainly by solving linear equations. However, in the case of uncertainty and the high dimension of big data in an uncertain environment, traditional regression models cannot obtain parameters efficiently and accurately when dealing with big data [6].
In order to compensate for the shortcomings of the traditional regression models in processing uncertain data. Tanaka first proposed fuzzy regression models to process uncertain data [7,8]. The coefficients of fuzzy regression models were represented by interval numbers with membership functions, compared with traditional regression models. Fuzzy regression models can obtain more accurate prediction model results. Since fuzzy regression models proposed by Tanaka have high requirements for the data, in realistic application scenarios, data sets cannot meet the requirements. Therefore, fuzzy membership degrees are used to describe the uncertainty of data sets, for example, fuzzy regression models based on fuzzy point data [9,10]. The fuzzy regression models based on fuzzy point data can use fuzzy membership degrees to fit better parameters. In a word, the improvements from fuzzy regression models to traditional regression models mainly give more characteristics to data to better describe the uncertainty of data and get more accurate parameters.
Fuzzy regression models can deal with the uncertainty in the data sets well, but with the growth of the dimension of the data sets matrix, classical computers face mole bottleneck. In order to seek better computers, researchers proposed that quantum computers can achieve exponential acceleration computing power, break through the bottleneck of computing power and compute processing through the operation of quantum states. Applications of quantum algorithms in machine learning algorithms have shown remarkable performance, such as the HHL algorithm solving linear equations and the parameters fitting problems of traditional regression models [11,12].
In recent years, many achievements have been made in the theoretical research of quantum regression models and fuzzy regression models in dealing with big data, but few achievements have been made in researching the intersection and integration of quantum regression models and fuzzy regression models. Because of the theoretical and practical significance of the research on the efficient and accurate processing of uncertain big data through the regression models will undoubtedly become the focus of the research in the field of big data.
This thesis introduces a novel regression model called the “quantum fuzzy regression model” to address the existing models’ inefficient and low accuracy issues. The quantum fuzzy regression model uses fuzzy membership degrees and quantum algorithms to improve the existing models. The fuzzy membership degrees are determined by data envelopment analysis (DEA) [13], which can comprehensively reflect the importance degree of each data point. The data sets and fuzzy membership degrees are encoded by quantum amplitude and the predicted results are obtained by the quantum HHL algorithm, which improves the efficiency of the traditional fuzzy regression models and can better deal with big data in an uncertain environment.
Since the regression models were established, one direction of research on the regression model is using fuzzy theory to describe uncertainty in the data sets to increase the accuracy of the predicted results. Another direction is lifting the computational power to speed up the calculation of parameter estimation. This thesis first briefly introduces the matrix parameters solution method of traditional regression model and the parameter solution method based on the fuzzy point data regression model and then introduces the study of the quantum regression model in quantum machine learning, which provides a theoretical research basis for the quantum fuzzy regression model.
The process of a linear regression model is shown below. Firstly, a data set with m data points is given
The data set satisfies the relationship shown in Eq. (1), where b is the offset of the prediction,
As
The least square method is used to predict the parameters. Loss function:
When
In actual situations, the degrees of each data point’s importance are different and some data points in the process of data sets are more important than other data points. However, in the traditional regression models, the importance of each data point cannot be distinguished. According to the definitions of the data points in [14], Shen proposed the concept of a fuzzy point data regression model. The process of the fuzzy point data regression model is as follows.
Before explaining the fuzzy linear regression model, this paper first explains the standard methods to determine the fuzzy membership degrees for each training data point
Firstly, data sets with fuzzy membership degrees
The fuzzy regression model based on fuzzy point data is shown in Eq. (5).
The independent variable matrix
This paper makes
When
The effects of fuzzy regression models after introducing fuzzy membership degrees in processing actual data have been verified by the predicted results, which have better effects on data fitting and can better reflect the importance of each data point in data fitting.
2.3 Quantum Linear Regression Model
The classical regression model has insufficient computational power when processing high-dimensional data, so the quantum regression model is introduced for optimization. Compared with the classical regression model, the key difference of the quantum regression model is that the quantum circuits are introduced to accelerate the parameter estimation part and the data set processing part.
In 2012, Wiebe proposed the quantum regression model for the first time, which can effectively determine the parameters of the least square fitting on big data [15,16]. Unlike the classical algorithm, quantum regression models can efficiently determine parameters and store data [17,18]. The process of the quantum linear regression model is as follows.
Firstly, the quantum computer uses the input matrixes X and Y as shown in Eq. (7), to obtain the quantum states
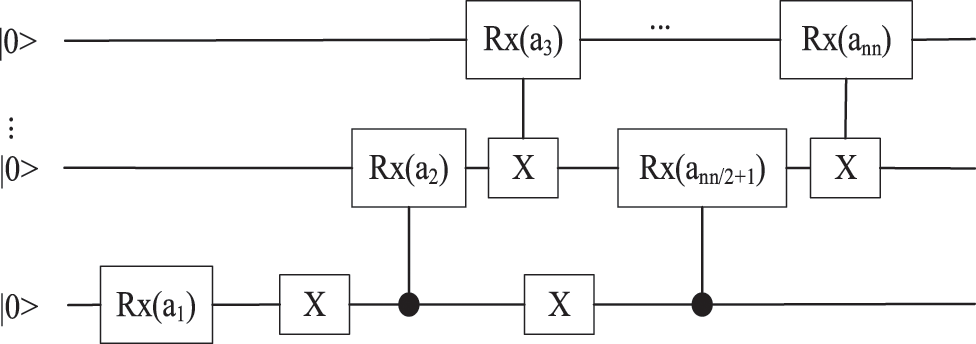
Figure 1: Encode circuit of matrix
In the quantum encode circuit of the matrix X,
Since X generally does not meet the requirements of a symmetric matrix in actual situations, it is defined to encode all the information of X and facilitate subsequent matrix calculation. The encoding circuit complexity is
According to the method of solving parameters in the traditional linear regression models, as shown in Eq. (4), the difficulty lies in solving the inverse of the high dimensions data matrix. Therefore, using the HHL algorithm to calculate the quantum states data sets can be more efficient in solving linear equations such as
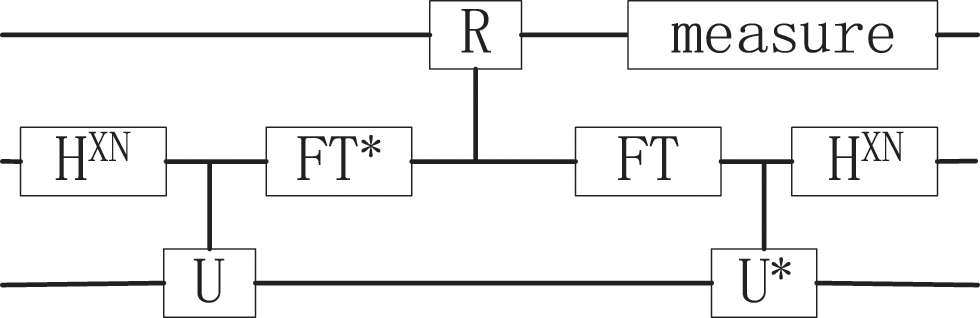
Figure 2: Diagram of the HHL algorithm process
In the diagram, the quantum circuit comprises H gates, U gates, R gates and Fourier transform (FT) module. H gates are Hadamard gates to obtain superposition. U gates are universal gates, including the information of data sets. R gates are the rotation gates encoding the eigenvalues of A. FT and FT* modules are the quantum Fourier transform (QFT) circuit and inverse of the QFT circuit.
Firstly, the HHL algorithm constructs the circuit as shown in Fig. 2. Circuit uses H gates and U gates to complete the encoding of the data sets. Then, a controlled rotation gate (R gate) is used to extract the values in the encoding quantum states to the probability amplitude through an additional quantum bit.
Finally, the output of the HHL algorithm is taken as the final result of the parameters estimation of data fitting. According to the research in [20], the efficiency of the quantum algorithm to solve high-dimension multiple linear regression is significantly improved. With the increase in available quantum bits, the advantages of quantum regression models in data processing will become more and more obvious.
3 Quantum Fuzzy Regression Model
The existing fuzzy and quantum regression models cannot deal with the uncertainty in big data efficiently and accurately. The quantum fuzzy linear regression model proposed in this paper uses fuzzy membership degrees to describe uncertainty and quantum circuits to accelerate the efficiency of data preprocessing and parameter estimation, which can process large data efficiently and accurately.
First, the quantum fuzzy regression model uses the DEA algorithm (Banker, Charness, Cooper model (BCC model)) to calculate the fuzzy membership degrees of each training point
The data sets
According to the method of fuzzy point data, the quantum state generated after amplitude encoding contains data sets and fuzzy membership degrees. In order to combine fuzzy membership degrees and data sets by referring to the method DEA, the results
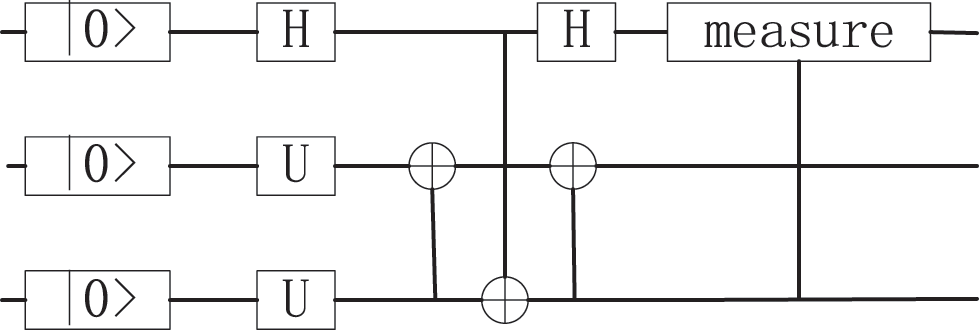
Figure 3: The circuit of the swap test
Using the above quanutum swap circuit, the inner product result of two quantum states can be obtained by measuring the result of one qubit, which meets the application effect of fuzzy membership degrees in a fuzzy regression model based on fuzzy point data and procession of swap test is as shown in Eq. (11):
In the swap test circuit, the measure of the ancillary qubit probability of getting
The quantum states data sets containing fuzzy membership degrees are obtained through the above operations. The fuzzy quantum state data set can better describe the data characteristics and better fit the complex big data in an uncertain environment.
This paper applies the HHL algorithm for the quantum state fuzzy data sets using the phase estimation circuit, as shown in Fig. 4 below. The phase estimation circuit completes the quantum state input of the fuzzy data set using the quantum bits storage
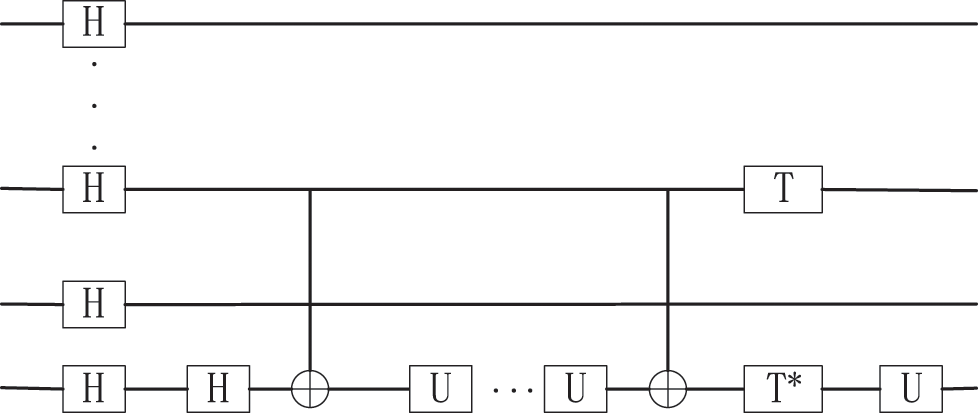
Figure 4: Phase estimation functions of the HHL algorithm
After processing the phase estimation algorithm, the state of the additional qubit is changed from
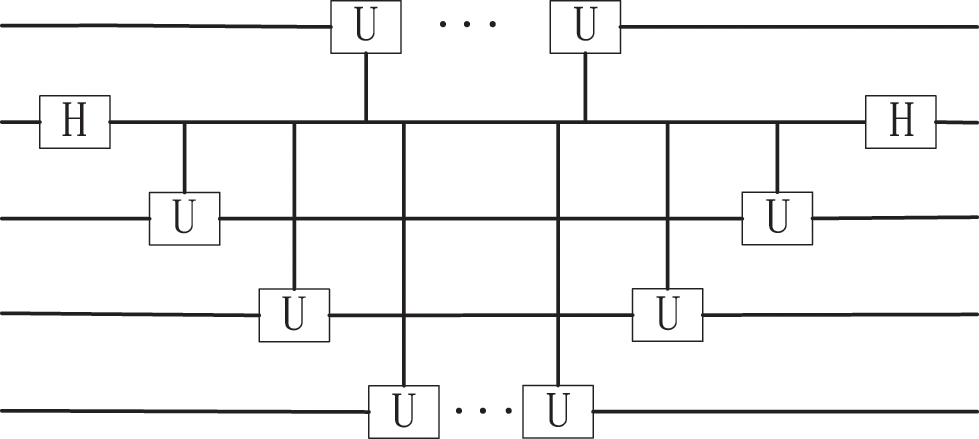
Figure 5: The process of using the controlled rotation door
Performing the phase estimation’s reverse operation and then measuring the auxiliary bit. When the measurement reaches 1, register Q2 will get the final solution, which will be analyzed in the runtime analysis, as Fig. 6 shows.
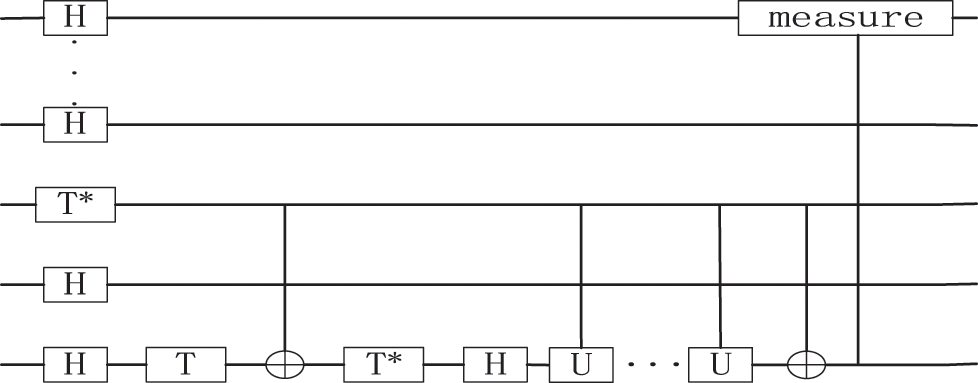
Figure 6: The process of the measure
The pseudo codes of the quantum fuzzy regression model in this thesis are shown in Figs. 7 and 8. The pseudo codes are about the quantum fuzzy data preprocessing solution of the eigenvalue and inverse of a matrix through the HHL algorithm.
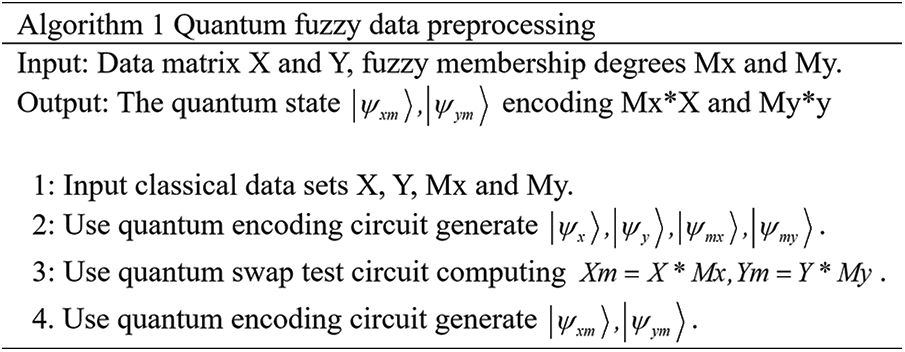
Figure 7: The pseudo of quantum fuzzy data preprocessing
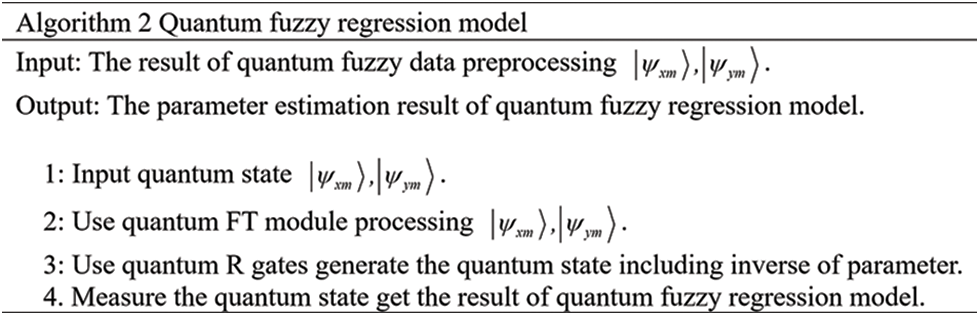
Figure 8: The pseudo of quantum fuzzy regression model
Predicting the stock index in the short term is one of the most important application scenarios in the financial field. Due to the huge potential of China’s economic development and the stability and favorable domestic situation, stock prices in China’s stock market are linearly correlated. It shows that the quantum fuzzy regression model can use the historical data of the Chinese stock index to establish a quantum fuzzy regression model to predict the trend of the stock index in the short term. The China Securities Index (CSI) series of scale indexes include CSI 100, 200 and 500. The CSI 500 index is a small-cap stock index, which is suitable for small long-term investments in asset allocation and has more research significance. Therefore, data from the China Securities 500 Index from August 16, 2021 to September 24, 2021 (data source: China Securities Index official website—China Securities Small Cap 500 Index-China Securities Index Co., LTD. (CSIndex.com.cn) is used as the original data sets in this thesis to establish a model to predict the closing price of China Securities Index 500 in the short term.
4.1 Comparison Between Fuzzy Regression Model and Regression Model
The original data set is obtained and collected from the original data sets of CSI 500 from August 20, 2021 to September 13, 2021 (data source: historical data on the official website of CSI, with two decimal digits reserved). The original data set of CSI 500 is shown in Table 1.
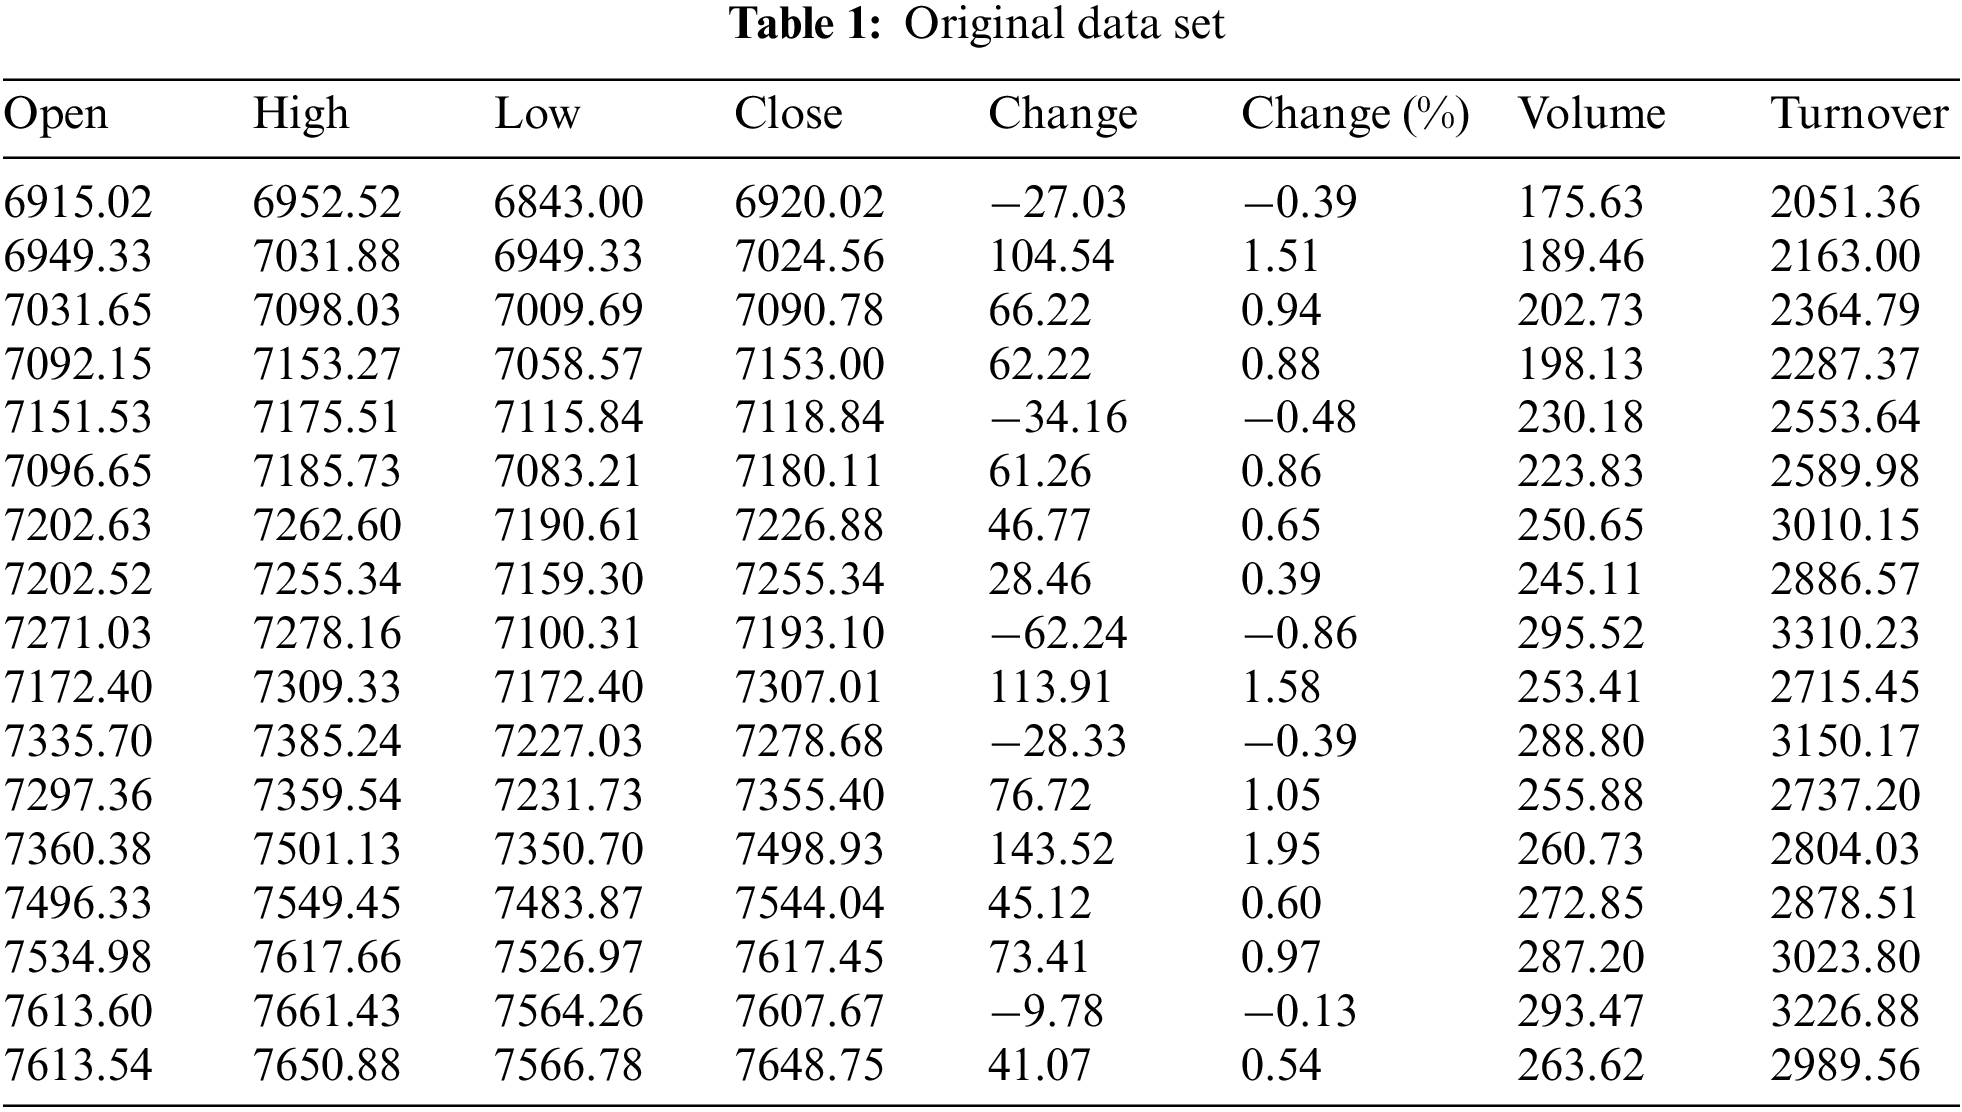
According to the original data set of CSI 500, the factors affecting the closing price of the next day are obtained and all independent variables affecting the closing price of the next day are selected for analysis. Due to the limitation of available quantum bits for general quantum computers, the number of available quantum bits for the existing IBM quantum computer cloud platform is five qubits and considering that the input matrix may not meet the conditions of the Hermitian matrix. Therefore, the two independent variables with the highest significance among all independent variables are selected as the independent variables of the quantum fuzzy regression model and the closing price of the next day is taken as the dependent variable.
Data uncertainty is common in many practical application scenarios, and certainty is usually called risk in the financial field. The sources of uncertainty are mainly divided into three aspects: the error beyond distribution, the uncertainty of accidental events and the uncertainty of cognition. In this thesis’s application scenario, the main analysis’s uncertainty refers to the error beyond the distribution and the uncertainty of accidental events, that is, the weight of data and the analysis of abnormal data. Therefore, this thesis uses fuzzy membership degrees to describe the uncertainty and establish a model to get more accurate results. The original data sets are shown in Table 1.
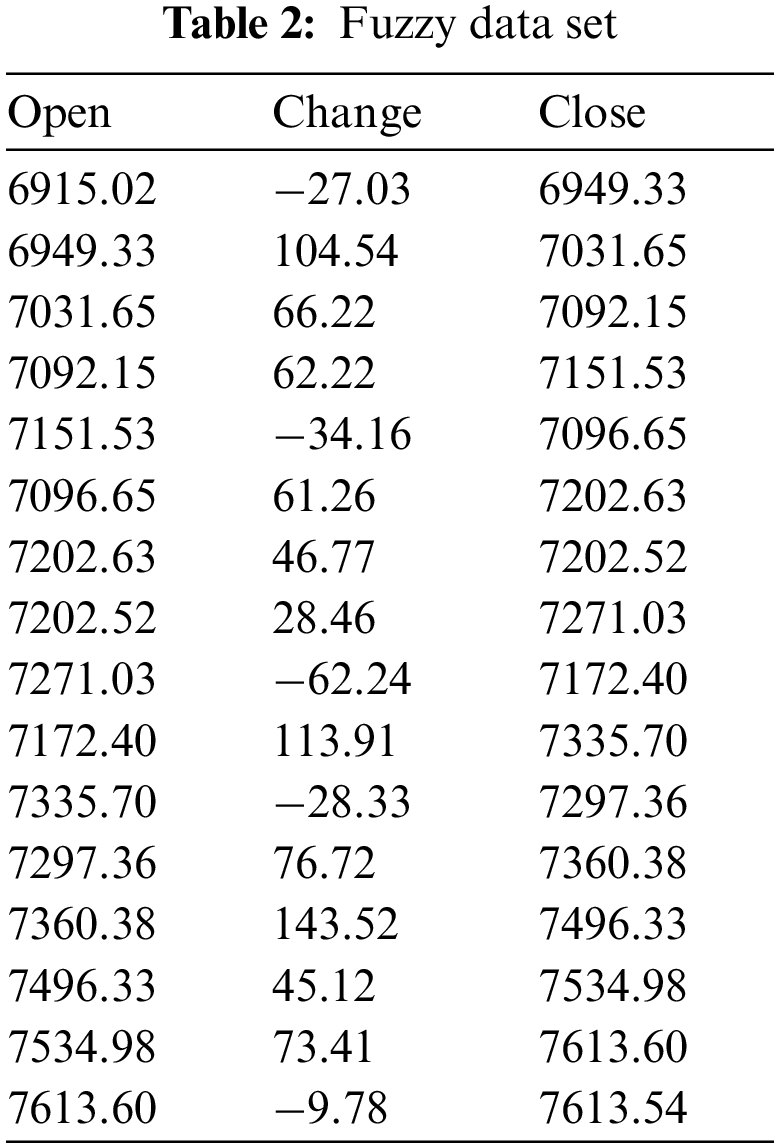
In the fuzzy membership degrees matrix for mode selection of this article is the data envelopment analysis (DEA) algorithm and can be a dependent variable in the closing as output indicators. The main factors affecting the next day’s closing price as the input index, the input index and the output index of efficiency evaluation of the results as fuzzy membership degrees of data points, generating the corresponding fuzzy membership degrees matrix. The fuzzy variable matrix is obtained by calculating the Hadamard product of the variable matrix and the corresponding fuzzy membership matrix of the quantum swap test circuit and the fidelity of the quantum swap test line was analyzed combined with the experimental results. The fuzzy data set is shown in Table 2.
In order to verify the validity of the quantum fuzzy linear regression model, it is necessary to verify the validity of the fuzzy linear regression model first. The original data set is prepared by zero-mean score (z-score) normalization. In this thesis, a multiple linear regression model, the independent variables z-score (Open) and z-score (Change) are established for analysis of dependent variable z-score (Close). Through the analysis of the timeliness data abbreviations for T-Open, T-Change and T-Close, membership fuzzy point data abbreviations for M-Open, M-Change and M-Close, the model summaries of multiple linear regression model and fuzzy linear regression model were finally obtained, as shown in Tables 3–5.
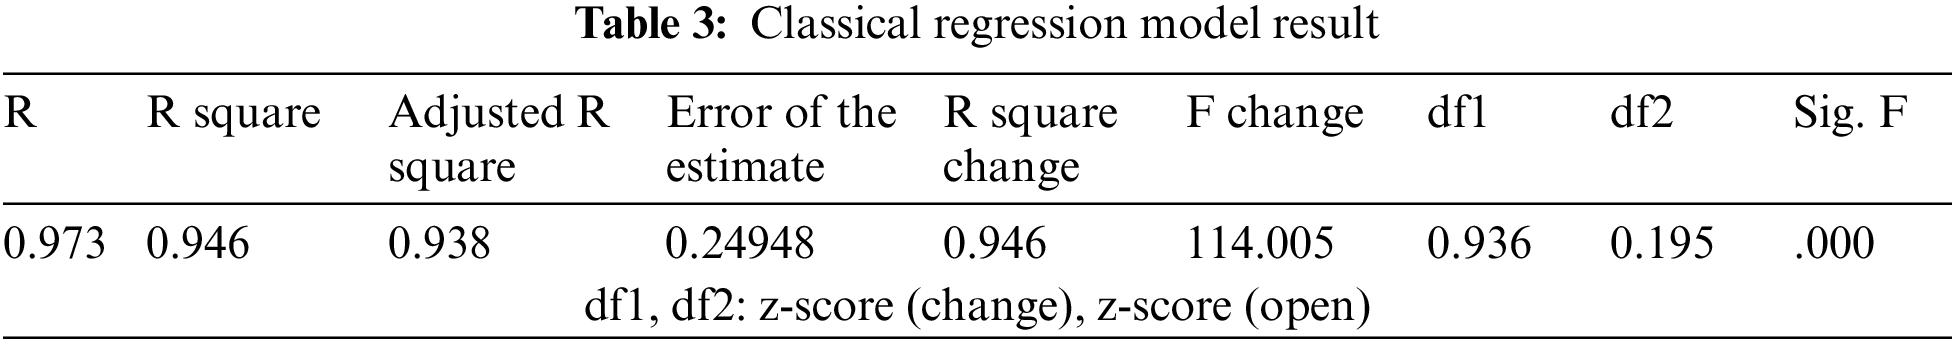

According to the analysis of Table 3, z-score (Open) and z-score (Change) can explain 94.6% of the change in z-score (Close). When conducting the significance test for the multiple linear regression model, the F value is 114.005, which passes the significance test, indicating that the opening and the rise and fall are closely related to the next day’s closing. Multicollinearity statistics of the model are all less than 5, meaning that there is no serious multicollinearity of the variable matrix and no correlation between the sample data. It shows that the multiple linear regression model construction is meaningful and reliable.
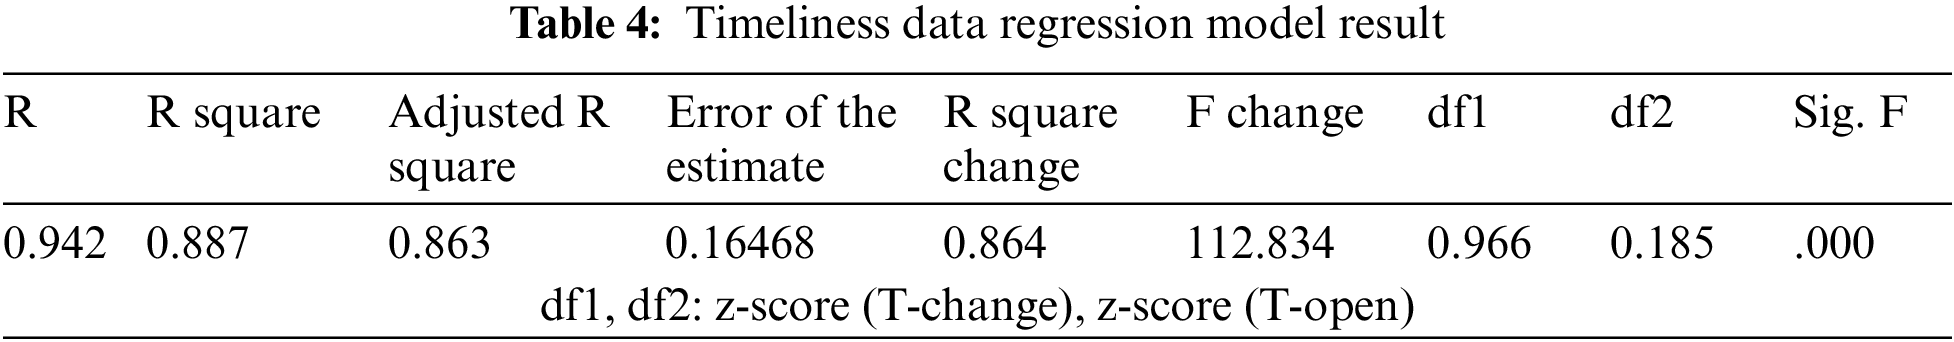
Through comparative analysis of Tables 3 and 4, the result can be found that although the timeliness of data is widely used in the fuzzy regression model, dealing with the uncertainty of stock data is not ideal. The simple analysis is combined with timeliness to ignore their impact on the overall analysis of the model sometimes produces greater deviation. The independent variables z-score (T-Change) and z-score (T-Open) only can explain the 88.7% of the change in z-score (T-Close). The simulation experiment in this article was abandoned using fuzzy membership degrees timely data acquisition.
Comparative analysis of Tables 3 and 5, this article can show the advantages of the fuzzy linear regression model. This paper marks M regarded the fuzzy data containing fuzzy membership. First of all, the z-score (M-Open) and z-score (M-Change) can describe 97.8% of the reasons for the change of the z-score (M-Close), which is better than multiple linear regression. Secondly, the result of a significance test is better than that of multiple linear regression and the multicollinearity is maintained at a good level. Finally, through some experimental results of the fuzzy linear regression model, it is concluded that the fuzzy linear regression model is better than the multiple linear regression model.
In a word, the quantum fuzzy point data regression model can improve the accuracy of the traditional regression model. When compared with other fuzzy regression models, such as timeliness data regression, fuzzy point data regression can get more accurate results.
4.2 Quantum Fuzzy Regression Model Execution Example
A fuzzy linear regression model can better describe the uncertainty of the data set and get better parameter results when dealing with uncertain data. In order to verify the effectiveness of the quantum fuzzy linear regression model, this thesis carries out a quantum fuzzy linear regression model circuit simulation experiment on the IBM quantum cloud platform to estimate parameters. The quantum solution obtained by the quantum fuzzy linear regression model is compared with the classical solution to verify the validity of the fidelity analysis of the quantum solution.
For the variable matrix without multicollinearity, the quantum HHL algorithm is used to solve the linear equations to get the parameter components and the fidelity of the quantum solution is calculated to verify the accuracy of the simulation experiment of the quantum HHL algorithm. The final parameters are calculated according to the average value of parameter components and compared with the parameter results of the fuzzy linear regression model to verify the validity of the parameter results of the quantum fuzzy linear regression model.
Because of the limitation of available quantum bits, in this thesis by using a standardized fuzzy variable partitioned matrix to establish a fuzzy linear regression model and by using the quantum HHL segmentation parameter estimation algorithm for a linear regression model, standardization of quantum HHL algorithm fuzzy variable partitioned matrix and the parameters of the corresponding component are shown in Figs. 9 and 10.
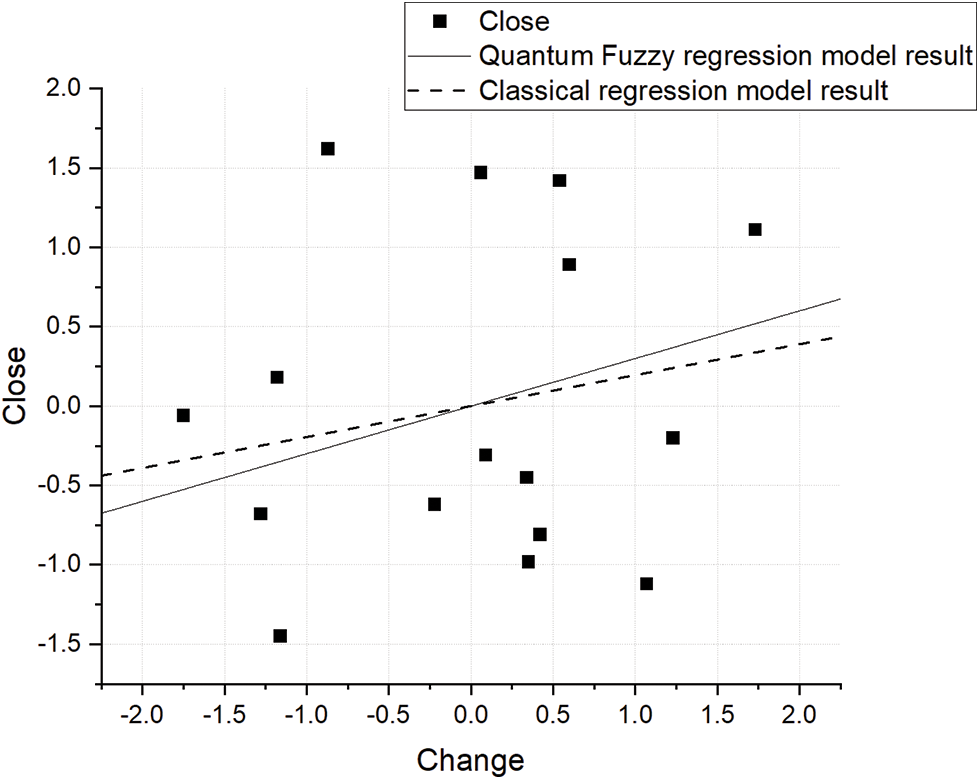
Figure 9: Relationship between close and change
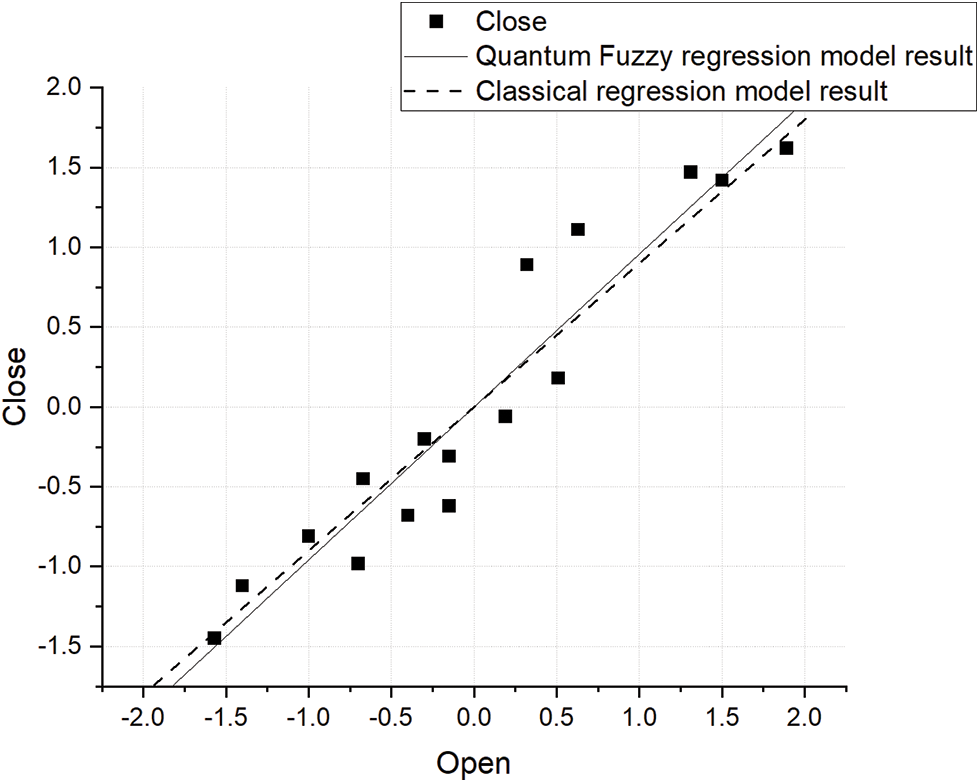
Figure 10: Relationship between close and open
According to Figs. 7 and 8, by introducing the fuzzy membership degrees, the results of parameters fitting have a better effect than the regression model. The fitted curve is closer to the real predicted value of the model and better describes the uncertainty in the data sets.
Fidelity refers to the fidelity of the result of the quantum calculation. The experiment reflects that the result’s fidelity is accurate under a small number of quantum bits. The result calculated using the quantum state is consistent with the classical algorithm.
In order to solve the problem of complex data fitting in the big data environment, this thesis proposes a quantum fuzzy regression model to solve the problem of fitting complex high-dimensional data. The model in this thesis can make use of the advantages of quantum computing to efficiently encode and calculate data and introduce fuzzy membership degrees to get a better fitting effect. In the operational analysis, this paper uses the sample data set to illustrate the algorithm’s advantages and results. We believe that in increasing the number of available quantum bits, the quantum algorithm can be combined with fuzzy mathematics to better deal with the complex problems in the actual situation.
Acknowledgement: In the research process of this thesis, I have received a great deal of support and assistance. I would first like to thank my tutor Yan Chang, for her valuable guidance throughout my studies. In addition, I would like to thank my parents for their wise counsel and sympathetic ear. You are always there for me. Finally, I could not have completed this dissertation without the support of my friend Yusheng Lin, who provided stimulating discussions as well as happy distractions to rest my mind outside of my research.
Funding Statement: This work is supported by the National Natural Science Foundation of China (No. 62076042), the Key Research and Development Project of Sichuan Province (Nos. 2021YFSY0012, 2020YFG0307, 2021YFG0332), the Science and Technology Innovation Project of Sichuan (No. 2020017), the Key Research and Development Project of Chengdu (No. 2019-YF05-02028-GX), the Innovation Team of Quantum Security Communication of Sichuan Province (No. 17TD0009), the Academic and Technical Leaders Training Funding Support Projects of Sichuan Province (No. 2016120080102643).
Conflicts of Interest: The authors declare that they have no conflicts of interest to report regarding the present study.
References
1. Y. J. Ren, K. Zhu, Y. Q. Gao, J. Y. Xia, S. Zhou et al., “Long-term preservation of electronic record based on digital continuity in smart cities,” Computers, Materials & Continua, vol. 66, no. 3, pp. 3271–3287, 2021. [Google Scholar]
2. Y. J. Ren, J. Qi, Y. P. Cheng, J. Wang and O. Alfarraj, “Digital continuity guarantee approach of electronic record based on data quality theory,” Computers, Materials & Continua, vol. 63, no. 3, pp. 1471–1483, 2020. [Google Scholar]
3. J. Xu, L. Wang, X. Liu, X. Feng, Y. Ren et al., “Front-end control mechanism of electronic records,” Computer Systems Science & Engineering, vol. 39, no. 3, pp. 337–349, 2021. [Google Scholar]
4. T. Li, N. P. Li, Q. Qian, W. Xu, Y. Ren et al., “Inversion of temperature and humidity profile of microwave radiometer based on bp network,” Intelligent Automation & Soft Computing, vol. 29, no. 3, pp. 741–755, 2021. [Google Scholar]
5. X. R. Zhang, W. F. Zhang, W. Sun, X. M. Sun and S. K. Jha, “A robust 3-D medical watermarking based on wavelet transform for data protection,” Computer Systems Science & Engineering, vol. 41, no. 3, pp. 1043–1056, 2022. [Google Scholar]
6. M. Raissi, H. Babaee and G. E. Karniadakis, “Parametric Gaussian process regression for big data,” Computational Mechanics, vol. 64, no. 2, pp. 409–416, 2019. [Google Scholar]
7. H. Lee and H. Tanaka, “Fuzzy approximations with non-symmetric fuzzy parameters in fuzzy regression analysis,” Journal of the Operations Research Society of Japan, vol. 42, no. 1, pp. 98–112, 1999. [Google Scholar]
8. H. Tanaka, S. Uejima and K. Asai, “Linear regression analysis with fuzzy model,” IEEE Transactions on Systems Man and Cybernetics, vol. 12, no. 6, pp. 903–907, 1982. [Google Scholar]
9. Y. Peng, X. J. Zhang, T. He, S. Y. Chen and W. W. Sheng, “Fuzzy point data regression analysis based on DEA,” Statistics and Decision, vol. 27, no. 3, pp. 170–172, 2011. [Google Scholar]
10. J. H. Shen, “Linear regression analysis based on fuzzy points data,” Journal of Natural Science of Heilongjiang University, vol. 24, no. 3, pp. 361–364, 2007. [Google Scholar]
11. A. W. Harrow, A. Hassidim and S. Lloyd, “Quantum algorithm for solving linear systems of equations,” Physical Review A, vol. 15, no. 103, pp. 150502, 2009. [Google Scholar]
12. J. Guan, Q. S. Wang and M. S. Ying, “An HHL-based algorithm for computing hitting probabilities of quantum walks,” Quantum Information & Computation, vol. 21, no. 5, pp. 395–408, 2021. [Google Scholar]
13. E. Thanassoulis, M. Kortelainen, G. Johnes and J. Johnes, “Costs and efficiency of higher education institutions in england: A DEA analysis,” Journal of the Operational Research Society, vol. 62, no. 7, pp. 1282–1297, 2011. [Google Scholar]
14. C. F. Lin and S. D. Wang, “Fuzzy support vector machines,” IEEE Transactions on Neural Networks, vol. 13, no. 2, pp. 464–471, 2002. [Google Scholar] [PubMed]
15. N. Wiebe, D. Braun and S. Lloyd, “Quantum algorithm for data fitting,” Biochemical and Biophysical Research Communications, vol. 109, no. 5, pp. 505051–505055, 2012. [Google Scholar]
16. G. M. Wang, “Quantum algorithm for linear regression,” Physical Review A, vol. 96, no. 1, pp. 1, 2017. [Google Scholar]
17. M. Schuld, I. Sinayskiy and F. Petruccione, “Prediction by linear regression on a quantum computer,” Physical Review A, vol. 94, no. 2, pp. 1, 2016. [Google Scholar]
18. H. F. Wang and X. Hua, “Quantum algorithm for total least squares data fitting,” Physics Letters A, vol. 383, no. 19, pp. 2235–2240, 2019. [Google Scholar]
19. Y. Liu and S. Y. Zhang, “Fast quantum algorithms for least squares regression and statistic leverage scores,” Theoretical Computer Science, vol. 657, no. 1, pp. 38–47, 2017. [Google Scholar]
20. Z. K. Ye, L. Z. Li, H. Z. SiTu and Y. Y. Wang, “Quantum speedup of twin support vector machines,” Science China: Information Sciences, vol. 63, no. 8, pp. 272–274, 2020. [Google Scholar]
21. S. Ishikawa, “A quantum mechanical approach to a fuzzy theory,” Fuzzy Sets and Systems, vol. 90, no. 3, pp. 277–306, 1997. [Google Scholar]
22. H. Y. Yu, Y. L. Huang and B. Wu, “Exact equivalence between quantum adiabatic algorithm and quantum circuit algorithm,” Chinese Physics Letters, vol. 35, no. 11, pp. 20–26, 2018. [Google Scholar]
23. I. F. Araujo, D. K. Park, F. Petruccione and A. J. Silva, “A divide-and-conquer algorithm for quantum state preparation,” Biochemical and Biophysical Research Communications, vol. 11, no. 1, pp. 1–12, 2021. [Google Scholar]
24. P. C. Li and B. Wang, “Quantum neural networks model based on swap test and phase estimation,” Neural Networks, vol. 130, no. 1, pp. 152–164, 2020. [Google Scholar] [PubMed]
25. J. C. Garcia-Escartin and P. Chamorro-Posada, “Swap test and hong-ou-mandel effect are equivalent,” Physical Review A, vol. 87, no. 5, pp. 1–10, 2013. [Google Scholar]
Cite This Article
 Copyright © 2023 The Author(s). Published by Tech Science Press.
This work is licensed under a Creative Commons Attribution 4.0 International License , which permits unrestricted use, distribution, and reproduction in any medium, provided the original work is properly cited.
 Downloads
 Citation Tools