
 Submit a Paper
 Propose a Special lssue
 Open Access
ARTICLE

Embedded System Development for Detection of Railway Track Surface Deformation Using Contour Feature Algorithm
1 NCRA-HHCMS Lab, Mehran University of Engineering & Technology Jamshoro, 76062, Pakistan
2 Department of Electronic Engineering, Quaid-e-Awam University of Engineering, Science & Technology Nawabshah, 67480, Pakistan
3 Design and Creative Technology, Torrens University Australia, 196 Flinders Street, Melbourne, VIC 3000, Australia
4 Department of Electronic Engineering, Mehran University of Engineering and Technology, Jamshoro, 76062, Pakistan
5 Department of Electronics and Power Engineering, Pakistan Navy Engineering College, NUST Karachi, 75350, Pakistan
* Corresponding Author: Tarique Rafique Memon. Email:
Computers, Materials & Continua 2023, 75(2), 2461-2477. https://doi.org/10.32604/cmc.2023.035413
Received 20 August 2022; Accepted 29 December 2022; Issue published 31 March 2023
 View Full Text
 Download PDF
Abstract
Derailment of trains is not unusual all around the world, especially in developing countries, due to unidentified track or rolling stock faults that cause massive casualties each year. For this purpose, a proper condition monitoring system is essential to avoid accidents and heavy losses. Generally, the detection and classification of railway track surface faults in real-time requires massive computational processing and memory resources and is prone to a noisy environment. Therefore, in this paper, we present the development of a novel embedded system prototype for condition monitoring of railway track. The proposed prototype system works in real-time by acquiring railway track surface images and performing two tasks a) detect deformation (i.e., faults) like squats, shelling, and spalling using the contour feature algorithm and b) the vibration signature on that faulty spot by synchronizing acceleration and image data. A new illumination scheme is also proposed to avoid the sunlight reflection that badly affects the image acquisition process. The contour detection algorithm is applied here to detect the uneven shapes and discontinuities in the geometrical structure of the railway track surface, which ultimately detects unhealthy regions. It works by converting Red, Green, and Blue (RGB) images into binary images, which distinguishes the unhealthy regions by making them white color while the healthy regions in black color. We have used the multiprocessing technique to overcome the massive processing and memory issues. This embedded system is developed on Raspberry Pi by interfacing a vision camera, an accelerometer, a proximity sensor, and a Global Positioning System (GPS) sensors (i.e., multi-sensors). The developed embedded system prototype is tested in real-time onsite by installing it on a Railway Inspection Trolley (RIT), which runs at an average speed of 15 km/h. The functional verification of the proposed system is done successfully by detecting and recording the various railway track surface faults. An unhealthy frame’s onsite detection processing time was recorded at approximately 25.6 ms. The proposed system can synchronize the acceleration data on specific railway track deformation. The proposed novel embedded system may be beneficial for detecting faults to overcome the conventional manual railway track condition monitoring, which is still being practiced in various developing or underdeveloped countries.Keywords
The rail industry plays a vital role in a nation’s economy and development; thus, it directly affects the lifestyle of the residents [1]. The railway network is becoming more sophisticated, burdened, and prone to tear and wear. Hence, the periodic inspection of railroad tracks is essential to find structural and geometrical problems that lead to railway accidents. Currently, in Pakistan, rail tracks are inspected by a manual system that requires a railway engineer as a domain expert to differentiate between different rail tracks’ faults, which are cumbersome, laborious, and error-prone [2], as the railway is the most common source of transport among all the sources of transportation, which interlinks various cities as well as neighboring countries. Due to the extensive use of railway infrastructure, maintaining a railway track, wheels and bogies become the major challenge for safe and reliable transportation. The inspection of railway track defects is an important task to ensure a safe train journey [3,4]. The presence of a system for early fault detection, identification, and repair guarantees the safety of the assets and lives.
Track deterioration by heavy haul freight traffic is a complex phenomenon and comprises different damage mechanisms, rail surface damage being a key one [5]. Various rail track surface deformations such as squats, shelling, and spalling occur during the operation of trains, and other problems related to wheel surfaces (i.e., the roundness of wheels, and wear in the wheels) need to be detected and alerted [6].
Among all the faults, squats are recognized as an important rail track issue and occur in many railway networks across the world [7], and these are considered very risky [8] and are a serious problem for railway organizations around the world [9]. Squats are sub-surface lamination usually occurs on the running band of rails; it extends diagonally downwards at an angle of 20°–30° from the horizontal surface plane. When squats are detected in the early stage, and their deterioration is mild, then maintenance may be easily performed by polishing a thin surface layer [10]. Generally, there is no uniform pattern of railway track surface faults. The different shapes of squats are shown in Fig. 1a. Other surface related faults include shelling and spalling, both occurring at gauge corners of railway tracks are shown in Figs. 1b and 1c.
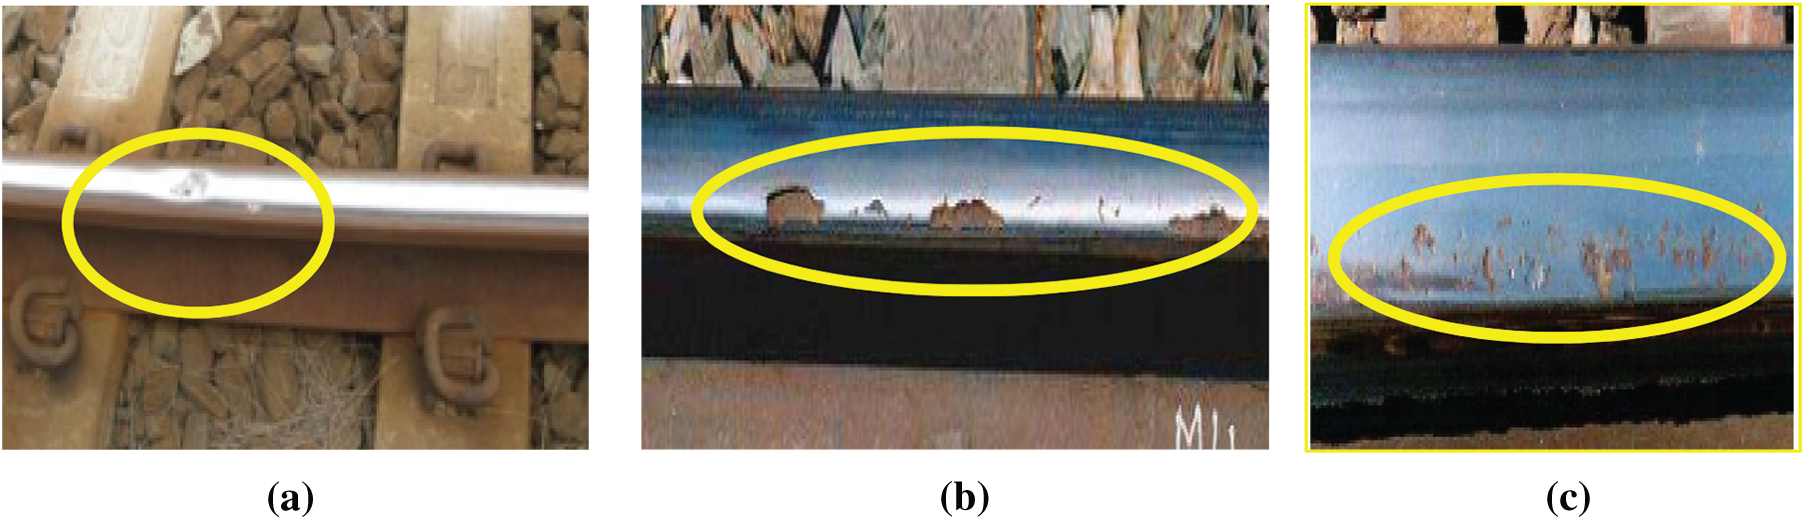
Figure 1: Squats, shelling, and spalling (a) Squats [8] (b) Shelling [10] (c) Spalling [10]
Shelling is an internal defect that initiates at a depth of 2 to 8 mm below the gauge corner of generally high rails in the curved track [11]. While spalling occurs when the surface-initiated crack development path is intersected by similar shallow cracks on the rail head area, a shallow chip of rail material falls out [12]. In the traditional method, a trained railway human operator walks alongside the track regularly and checks the tracks manually, and sometimes the defects may go unnoticed, and train accidents and derailments occur [13–15].
Recently condition monitoring systems for railway asset management have been proposed in [16–18] that mainly focus on the rolling stock part. But there is a rare state of art technique found in the literature to automate the onsite track deformation detection system. Therefore, in this paper, we present the design and development of a novel railway track surface fault detection prototype embedded system that uses a multi-sensory approach to detect the railway track surface deformation and observe the vibration impact of the wheel on that specific fault along with its location. This work is to develop the dataset of the railway track surface faults. This dataset may be used to develop Deep Learning (DL) algorithms for fault classification in real-time at a later stage.
The rest of the paper proceeds as follows. In Section 2, the relevant literature review is given that is followed by the proposed methodology in Section 3. The developed system hardware is given in Section 4, and the results are given in Section 5. In Section 6, we conclude the work and discuss the point of the future.
In this proposed system, research on railway track surface fault detection is focused on using acceleration and imaging. Railway track surface squat detection is prooposed in [10] with Axel Box Acceleration (ABA). Acceleration in x and y directions are recorded and further processed in MATLAB. The maximum acceleration was found 5 m/s2 and for larger vibrations, a maximum of 10 to 15 m/s2 was detected. The accuracy using wavelet spectrum analysis was 88.2%. However, only one type of fault is detected with mentioned accuracy. In [19], the work is reported on automatic surface faults detection based on image vision using the camera with LabVIEW hardware module. The contour algorithm is used here to detect the closed defect boundaries. The processing time of each image is 245.61 ms which is usually considered very high. Contour-based railway surface defects using local normalization are proposed in [20]. The proposed system can detect corrugation and discrete types of faults with 93.1% and 80.41%, respectively, and with lower accuracy at 72.78% and 81%. Corrugation fault is detected by [21] with imaging and laser triangulation method with an amplitude accuracy of 4 um. A prototype is presented in [22] for the Electro Magnetic Acoustic Transducer (EMAT) phased array probe. This prototype is utilized as a non-contact type of Non-Destructive Testing (NDT) compared to conventional ultrasonic NDT, which requires a direct coupling with the specimen. EMAT overcomes this disadvantage and can be used a few millimeters non-contact with the object. However, EMAT use excitation peak power greater than 1 kw, and hence driving electronics and the EMAT coils become bulky.
A multi-robot fault detection system is proposed by [23] for railway tracks system to eliminate manual human visual inspection. The system incorporates an Ultrasonic Transducer (UT), and image processing to detect surface defects. Conventional UT sensors are based on the distance threshold from the track to the sensor. UT can detect opened or broken gaps in the track, while, an image processing technique is used in this system to detect squats and other defects. Various problems are reported by the author, such as unsuitable lighting conditions, which make it difficult to detect image data. An unsupervised stereoscopic saliency method based on a binocular line scanning system is proposed by [24], in which it is reported that machine vision is better in surface defect testing, but image information is susceptible to illumination and shooting angles, and low texture defects are difficult to be detected in the approximate background area; so, proper illumination is necessary to detect defects. Condition monitoring of railway track fasteners is done by [25] with a YOLOv3 model with 96.26% accuracy; however, the proposed model is not tested onsite or onboard in real-time. Squat and corrosion detection was proposed by [26] using canny edge detection with a handheld two-wheel trolley and camera, however no real-time trolley speed and accuracy were mentioned. The contour algorithm proposed by [27] detects internal defects on a railway track with ultrasonic images with 97.5% accuracy and 120 ms/frame speed. As ultrasonic probes need a liquid as a coupling agent to be rubbed on the surface and it must be physically attached to the surface, which affects the real-time detection. The surface defect detection approach adopted by [28] proposed Convolutional Neural Network (CNN) based approach to detect railway track surface defects; however, CNN needs a sufficient number of samples to achieve high detection performance, and detection is also dependent on illumination performance. Image vision for inspecting railway track surface cracks is performed by [29] using a simple filtering technique in Matlab to convert an image to binary and identify surface cracks, images are used, and only one type of surface defect is detected. The contour approach proposes by [30] examines the defects of rolling stock moving at a speed <30 km/h with 95% accuracy. Different parts of the rolling stock were observed for fault detection using the mentioned technique.
The literature suggests that most of the already available systems for rail track monitoring do not have online fault detection capability. They only acquired track information which is processed in the laboratory at later stage. Varying real-time speed detections are reported in the literature. In [19], the reported processing speed of each frame is 245 ms, and similarly, 120 ms per frame in [27], which is considered usually very high for real-time detection. The literature suggests that the surface defects with DL algorithms need a sufficient amount of dataset, which limits the detection accuracy on smaller datasets [28]. Another reported issue with DL is that these algorithms work on trained features and the deformed pattern of railway track has no consistent and easily distinguishable structure. So they become less effective when detecting non-similar patterns [31]. To overcome these issues, we have developed an efficient onsite track monitoring system that detects the track faults, and monitor the condition of the track on the spot. The proposed automatic railway track surface fault detection system can diagnose unhealthy railway track regions, i.e., squats, shelling, and spalling. The fault detection is done by employing an image processing contour detection technique. The contour algorithm is chosen because it is helpful to detect the discontinuities and unknown shapes in an image of the railway track surface. An accelerometer, proximity sensor, and GPS are other sensors used in the proposed embedded system for data collection and fault detection in real-time. This proposed prototype embedded system works without human interaction and incorporates all the additional sensor data when the fault is detected using images. In this system, we have used parallel processing to cope with the processing speed for all the sensors. The novel contributions in this paper are given below.
1. Development of the embedded system using a multi-sensor fusion approach with a novel illumination scheme for image acquisition to avoid sunlight issues.
2. The novel railway track surface faults detection prototype development with the contour algorithm.
3. The synchronization method to measure the vibration signature of the wheel when passing the wheel on that specific deformation.
4. Onsite successful testing of the proposed embedded condition monitoring system and detection of the railway track surface faults with reasonable accuracy.
The proposed condition monitoring embedded system is implemented on Raspberry Pi 4. The block diagram of proposed model is shown in Fig. 2. All the sensors, including the vision camera, proximity sensor, accelerometer, and GPS, are attached to the General-Purpose Input Output (GPIO) of Raspberry Pi 4.
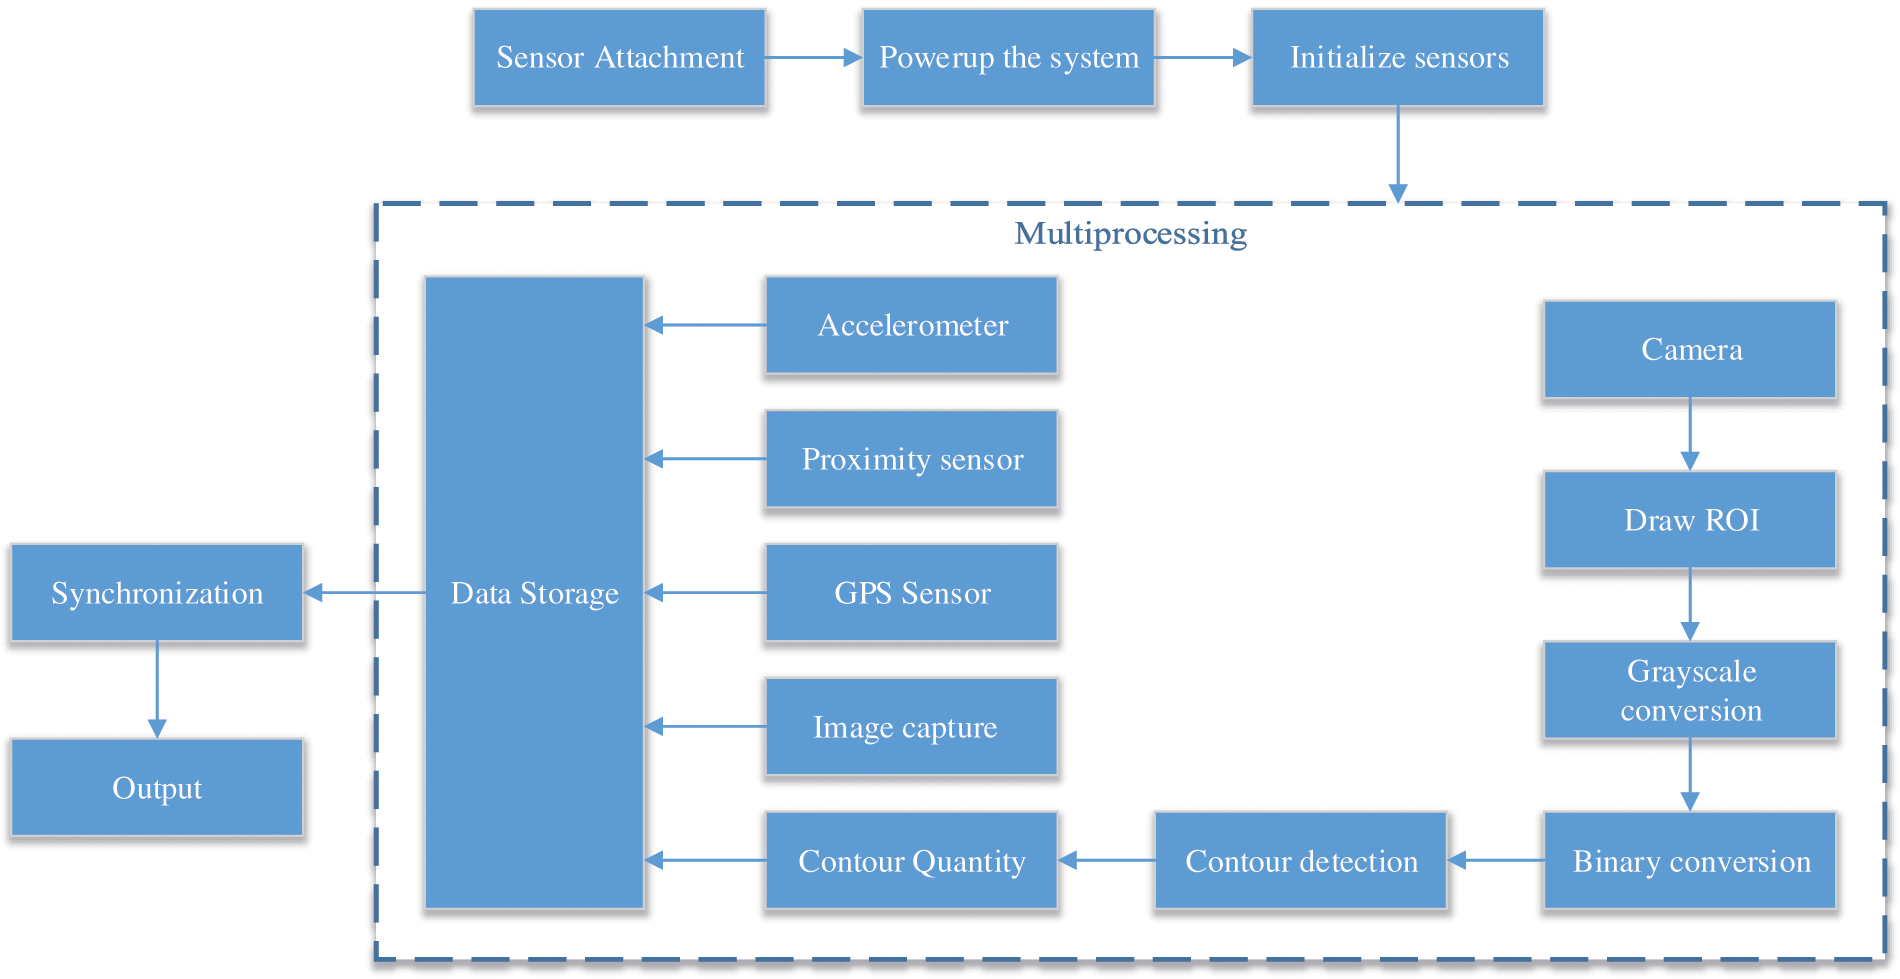
Figure 2: Block diagram of the proposed system
The task of the proposed embedded condition monitoring system is the automatic detection of the railway track surface deformations based on image processing using a contour algorithm implemented on the moving trolley. Due to the moving trolley, collecting the multi-sensor information in serializing mode may require pausing one sensor so that another data may be collected from other sensors, which may result in losing the detection of the faults on the go. Therefore, the nature of this system requires a multiprocessing approach that enables a system to support more than one process at the same time. In general, using several processes at a time, it will have to break each task and switch briefly to another to keep all the processing going [32]. To avoid the situation of missing detection, multiprocessing is used here. With the onboard multiprocessing approach, all the sensors process their data without interrupting other operations. Data from the image and accelerometer is also synchronized with the help of wheel rotation to measure the vibration impact on specific fault.
To achieve the multiprocessing of all the onboard sensors, an algorithm is developed in python. The flow chart of the developed algorithms is shown in Fig. 3. This system uses multiple sensors on its different and split processes so that each sensor should not interrupt other process. Some of the shared Raspberry Pi libraries are utilized once for all processes. All sensor scripts are assigned to different processes, namely Process 1–5. This separation is done so that all processes work individually.
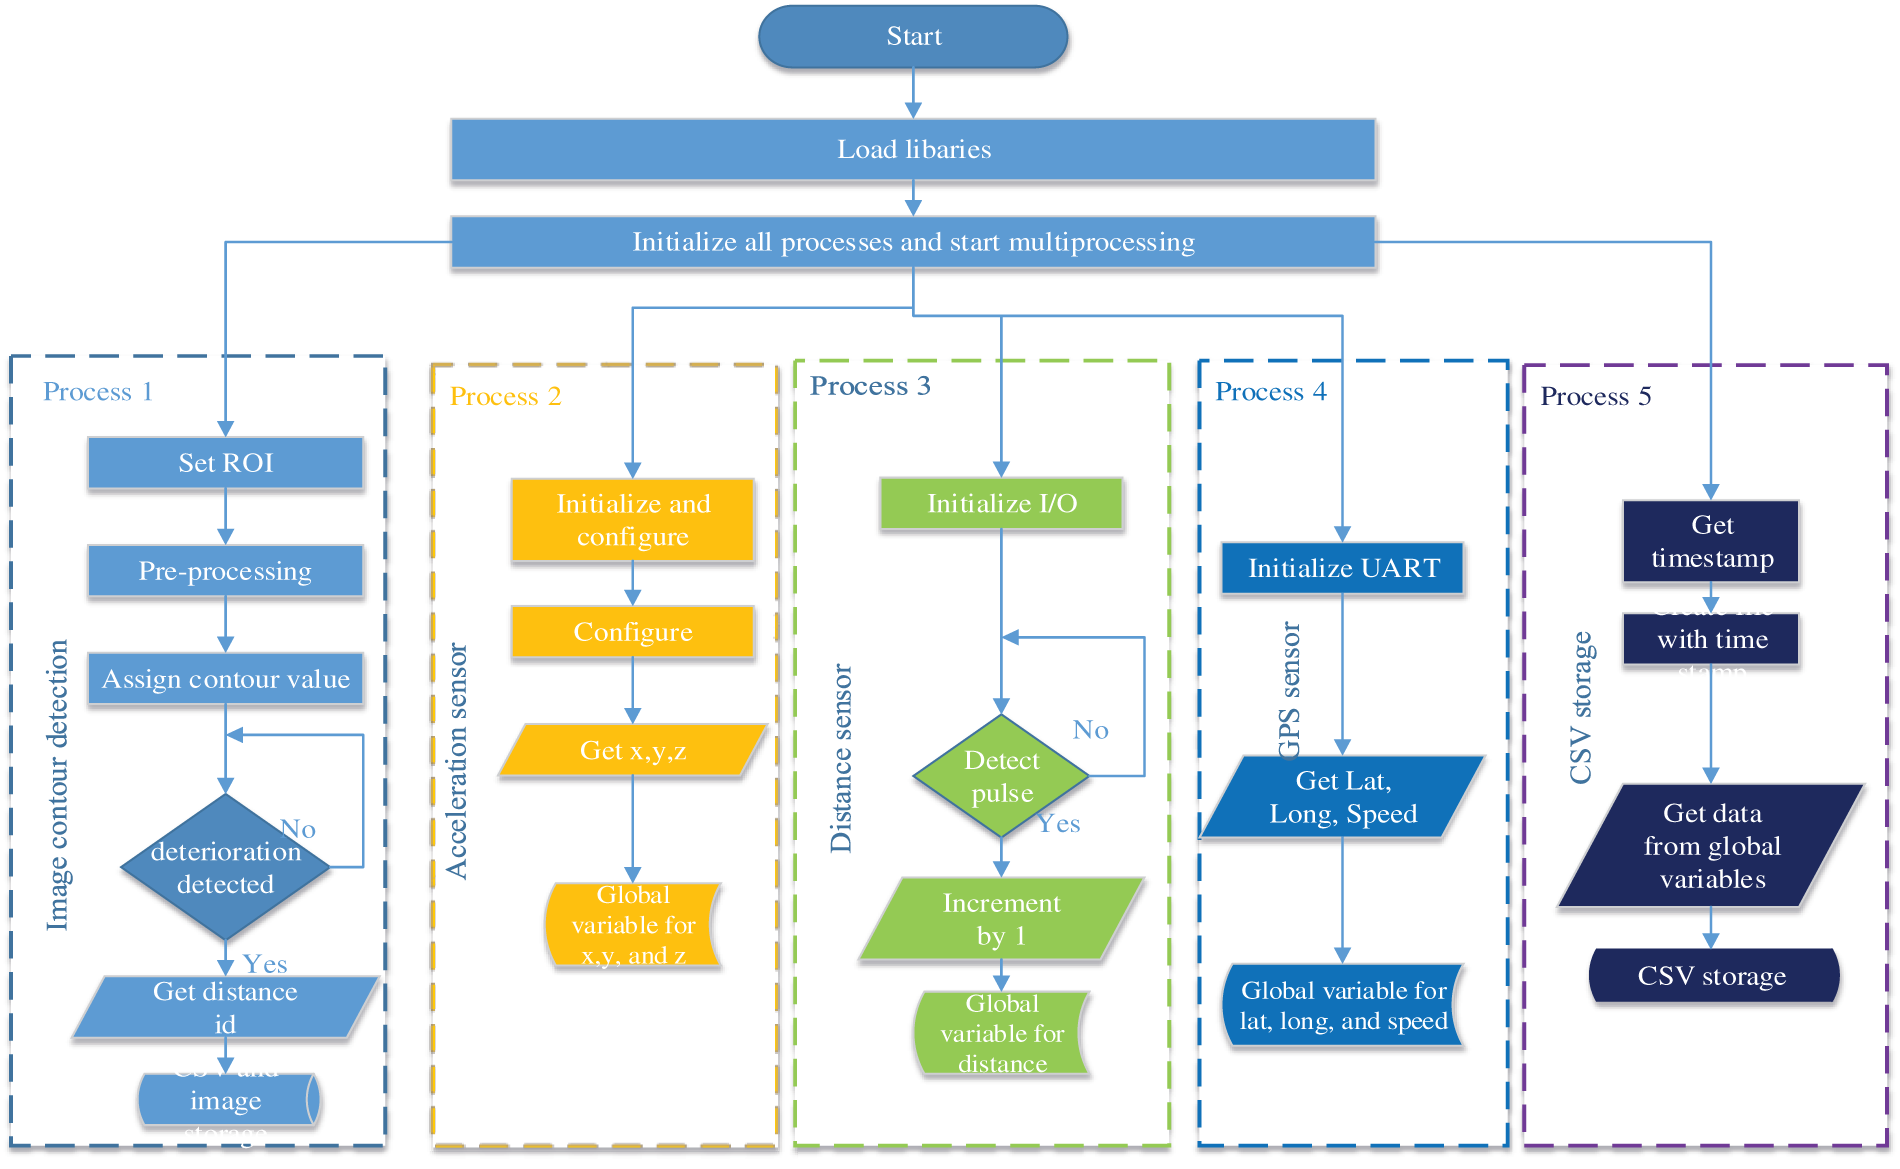
Figure 3: Flow chart of all the processes used in the system
Process 1 is the primary process that detects the defects on the railway track surface. The camera is set to focus on the railway track, as shown in Fig. 4a, which includes the additional area in the image. To avoid an additional area scan Region of Interest (ROI) is drawn on the screen with either touch or mouse pointer, as shown in Fig. 4b, which is considered an essential part of an image [33]. In selection of ROI, the overburden on the storage space is alleviated. In this way, the remaining part is only visible on the screen but not counted for the actual processing. Then preprocessing is performed by converting RGB images into grayscale using Eq. (1) [34].
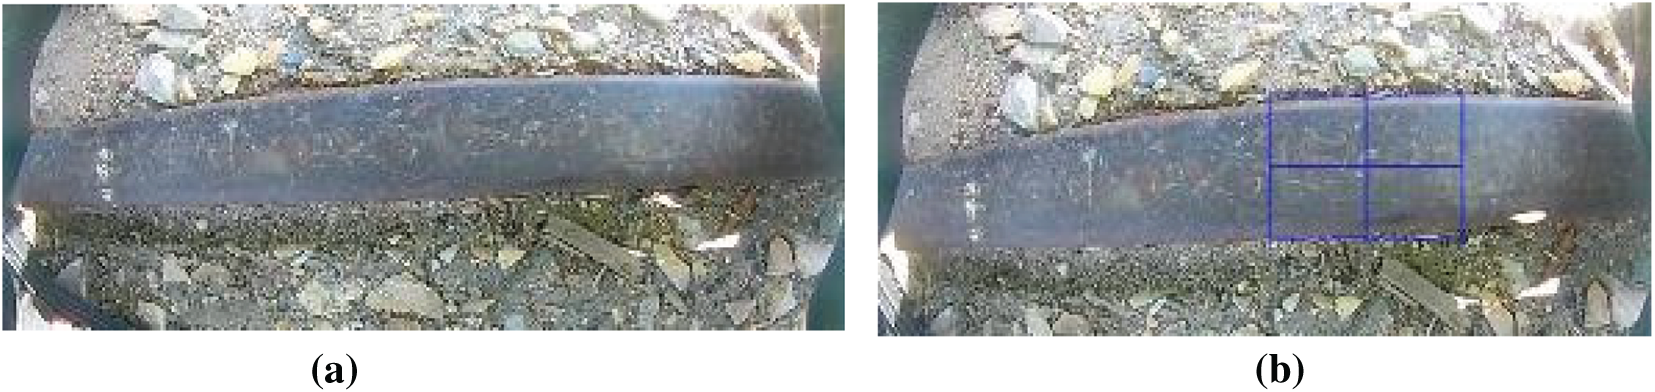
Figure 4: The covered area inside a shadow box and ROI drawn (a) covered track area (b) ROI drawn on track
The other part of preprocessing is to convert the grayscale to a binary image in an inverted mode using the operation expressed as Eq. (2) [35].
In this detection method, the contour feature is utilized, which is a process of identifying structural outlines of objects in an image that points to the object’s shape [36,37]. It checks the discontinuities in the photometrical, geometrical and physical characteristics of the object in an image; hence, it can easily distinguish the healthy and unhealthy regions of the railway track surface. Once the camera is aligned on the track, then the ROI is drawn on the railway track, then the number of contours will identify the deformation on the railway track surface that is followed by capturing that spot by taking a snapshot of it and storing it in the internal storage with a width and height of approximately 327 × 222 respectively. However, these dimensions are dependent on ROI and field of view. The sample of the step-wise flow of contour detection is shown in Fig. 5. This contour detection flow demonstrates how deformation is detected while moving the trolley on the railway track.
Figure 5: Steps to detect contours (a) Original image with ROI drawn (b) ROI captured (c) Grayscale image (d) Binary image (e) Contours drawn
Similarly, process 2 is an acceleration sensor process that stores the x-axis, y-axis, and z-axis acceleration data into three separate global variables. Process 3 is a distance sensor process that detects the pulses from the wheel; each, pulse represents the distance. This process is required to synchronize the data later on. Process 4 is the GPS sensor that stores the latitude, longitude, and speed data into three global variables. Process 5 is the Comma Separated Values (CSV) fetch process, and it, is the faster process that fetches the data from global variables and stores it into CSV files in 7 columns (i.e., distance id, latitude, longitude, speed, x-axis, y-axis, and z-axis data).
In the data acquisition, the camera is attached to a shadow box and installed on a trolley, as shown in Fig. 6a, and the distance travelled is shown in Fig. 6b; without the shadow box, different shades, glare, and reflection effects were observed at different daytimes, which affects the image data as shown in Figs. 7a–7c. The shadow box is designed with a dome shape with tin metal and wood, and it was aligned in such a way that it focuses on a railway track and avoid the sunlight effects that creates problem in image acquisition. The contour detection flow is used here, which detects the abnormalities in the railway track surface. Like the contour detection steps, as shown in Fig. 5, each frame is processed with RGB to grayscale and grayscale to binary, and contour detection is applied if the quantity matches the prescribed value, then it will store the part of the image. For contour quantity, experimental analysis is performed on various surface faults and the quantity on the smallest surface defect is confirmed 84. As this number increases, it shows the unhealthy railway track surface.
Figure 6: Camera attachment and distance map (a) attachment of camera in motorized rail trolley with shadow box (b) the distance covered map
Figure 7: Shades and reflections (a) shades on railway track (b) Huge reflection from different angles (c) reflection and darkness
The proposed system is implemented into two sections i.e., Illumination Scheme and real-time fault detection.
Visual inspection is susceptible to light intensity and ambient lighting during different morning and evening hours, so there is poor detection accuracy, which affects machine vision [20,38,39]. After collecting data in normal daylight conditions, we have detected that the railway track is a glossy type surface that shines with ambient lighting and makes a glare effect, which affects detection with imaging. Data collected with an open camera in normal daylight it was observed that this system needs at least shading so that the sunlight effect may be reduced.
The Illumination and shading mechanism is developed which overcomes the issue of ambient lighting. Further, bright white lights are used for uniform lighting in the detection area. The complete system is dome type structure with metal and wood sheets, that shades the railway track, as shown in Figs. 8a–8c.
Figure 8: Attachment of camera with different angles and inner view (a) Dome type shading (b) side view (c) inner side of shade box
4.2 Real-Time Fault Detection Mechanism
The real-time detection mechanism comprises the hardware with multi-sensors interfaced with the Raspberry pi 4. The proposed embedded condition monitoring system’s block diagram for railway track surface fault detection with a 7” touch screen Liquid Crystal Display (LCD) along with some level converters needed for some of the sensors are shown in Fig. 9. In the subsequent sections, the proposed system development is discussed, that is followed by its testing and results.
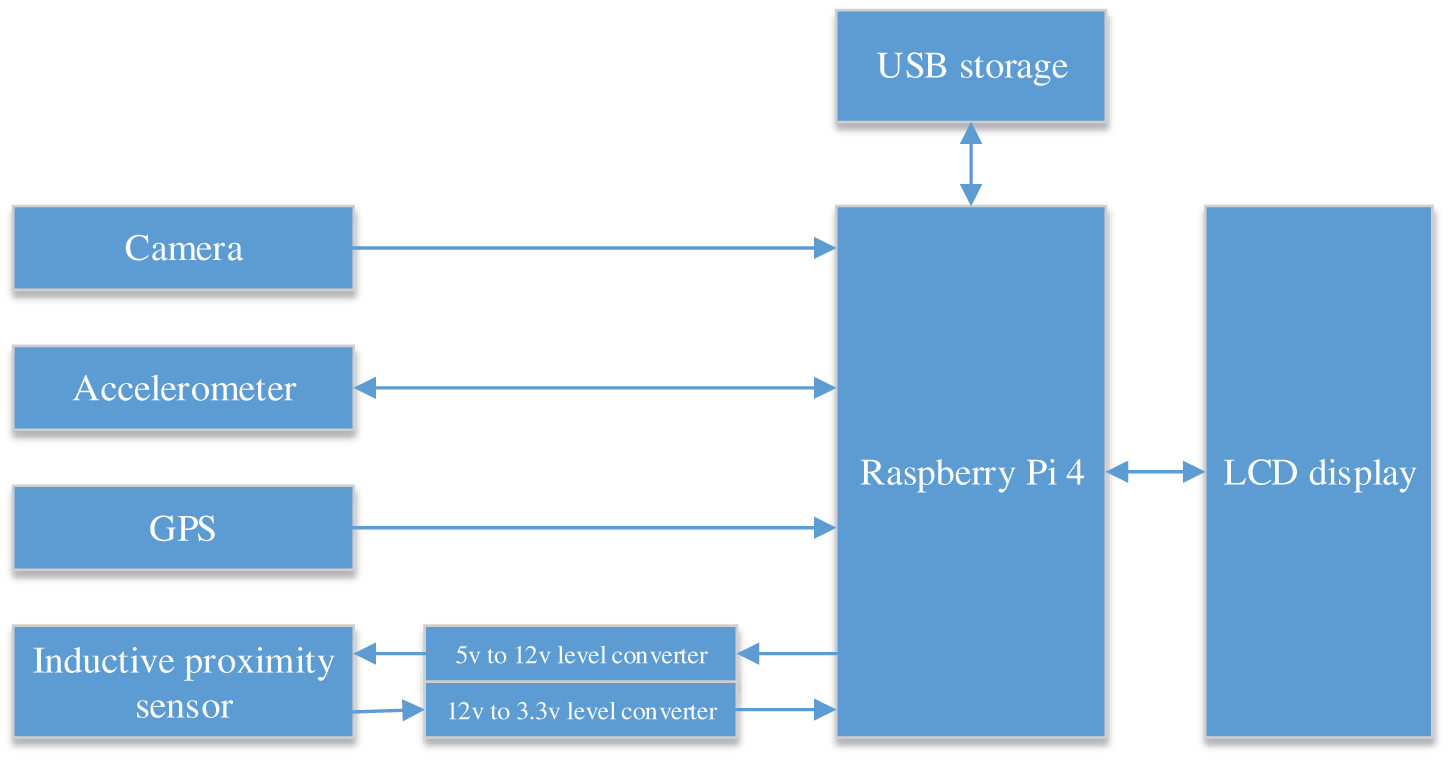
Figure 9: Block diagram of hardware
4.2.1 Multi-Sensors Installation
All the multiple sensors for the detection of surface faults, including a camera, accelerometer, proximity sensor, and GPS module, are fitted at locations based on their purpose.
The camera is attached to a dome-type shade at a distance of 47 cm from the trolley wheel, as shown in Fig. 10a. The accelerometer “ADXL345” is used to measure the X-axis, Y-axis, and Z-axis acceleration of the railway track. It is installed near the wheel, as shown in Fig. 10b. To synchronize the acceleration data and image data, a proximity sensor is installed near the wheel, as shown in Fig. 10c.
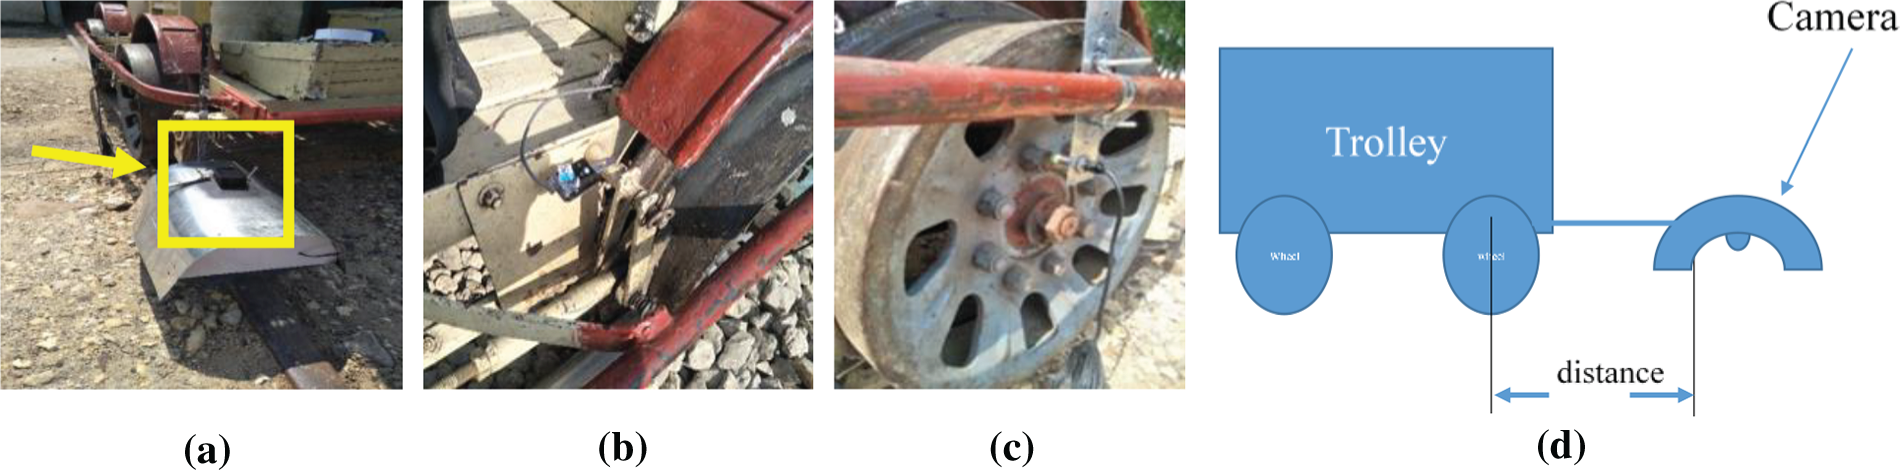
Figure 10: Installation of sensors (a) camera attachment (b) accelerometer attachment (c) proximity sensor attachment (d) attachment style of the camera on a trolley
The distance between the wheel and the camera is already known; however, when a fault is detected by the camera then the wheel reaches that fault location is calculated by using circumference Eq. (3) and the number of pulses detected from the proximity sensor.
The total diameter of this wheel is 40 cm, the circumference of the inspection trolley wheel used in this experiment is 125.6 cm, and all the metallic parts (i.e., nuts) are used to sense pulses. The distance traveled between the two nuts is 15.7 cm, and the distance between the camera and wheel is adjusted to 47 cm as shown in Fig. 10d. Therefore, after each 3rd pulse, the trolley wheel will reach the area where the fault is detected by the camera. The relation between the camera, the wheel distance, and the ROI is shown in Table 1. It is calculated that at the speed of 20 km/h, the region of 18.5 cm can be captured at once.

GPS module is set up to pinpoint the location of the fault. The GPS “NEO 6M” communicates to the serial interface of Raspberry Pi 4. A separate process is utilized to fetch the data without disturbing another process. The data includes latitude, longitude, and speed, which are stored in three separate variables.
The final embedded condition monitoring system prototype, along with all the sensors interfaced with Raspberry Pi, is shown in Fig. 11a. The developed embedded system mounted on the trolley for onsite image acquisition, testing, and fault detection is shown in Fig. 11b.
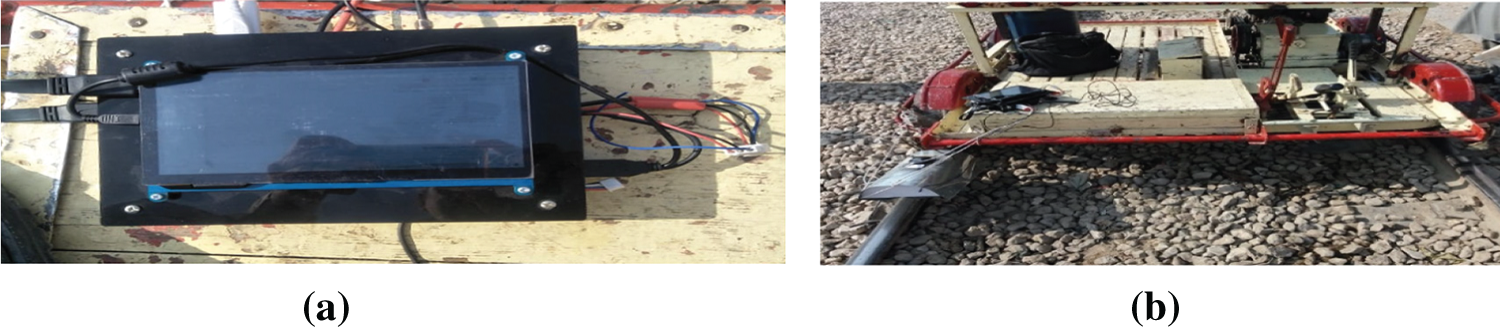
Figure 11: Final prototype (a) final prototype with LCD (b) onsite system
In this section, we present the obtained experimental results and their analysis.
5.1 Illumination and Shading Mechanism
The proposed illumination scheme has proved a better alternative with good quality image acquisition effects even in daylight. It blocks direct sunlight while providing enough natural light for the camera. This system also comprises high bright lights on both sides of the shading box. The results of this illumination scheme are shown in Figs. 12a and 12b with and without shading, respectively.
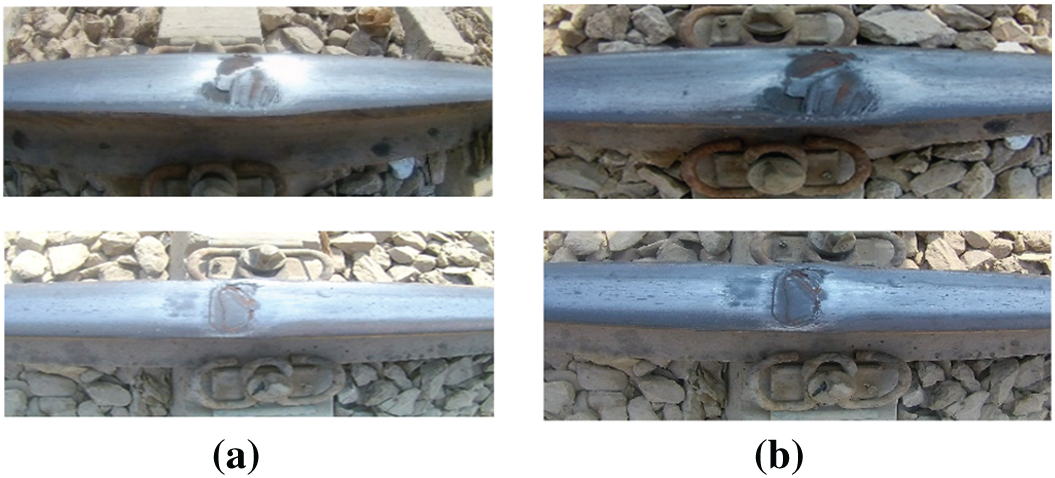
Figure 12: Shading effects (a) Before shading box (b) with shading box
The railway track surface deformation (i.e., Squat, track burn, spalling, scratches, and shelling) images were captured as shown in Fig. 13a. The experimental analysis is done in the laboratory on 100+ such faults using the contour feature. The lowest quantity of the contour shapes calculated is 84, which is considered a reference number that can detect railway track surface deformation on a moving trolley. The experimental analysis is shown in color mode in Fig. 13b and grayscale mode in Fig. 13c.
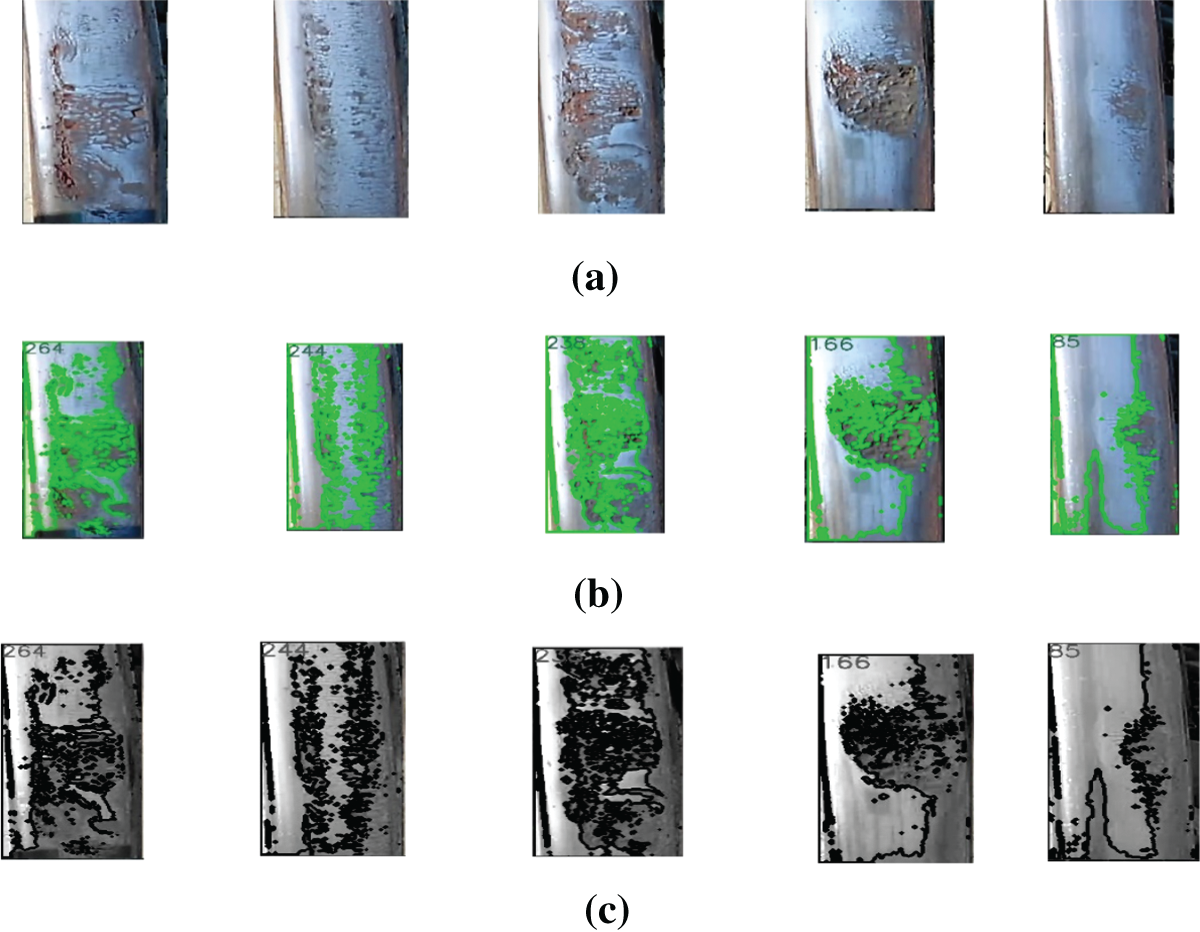
Figure 13: Contour extraction in different modes (a) original surface defect (b) contour extraction in color mode (c) in grayscale mode
The proposed prototype model was tested onsite for functional verification of the railway track surface faults’ automatic detection, as shown in Fig. 14. The prototype embedded condition monitoring system mounted on the trolley, that was operated at an average speed of 15 km/h. This prototype was tested onsite for a total distance of 1.9 km, as shown in Fig. 6b. The total number of faults detected was 1929. Out of them, 48 were false readings due to lateral movement of rail trolley moving on curved track, and 375 were similar detections due to low trolley speed; the same deformation was detected multiple times. The dimension of each image is dependent on ROI and field of view. The details of the surface deformation are shown in Table 2.
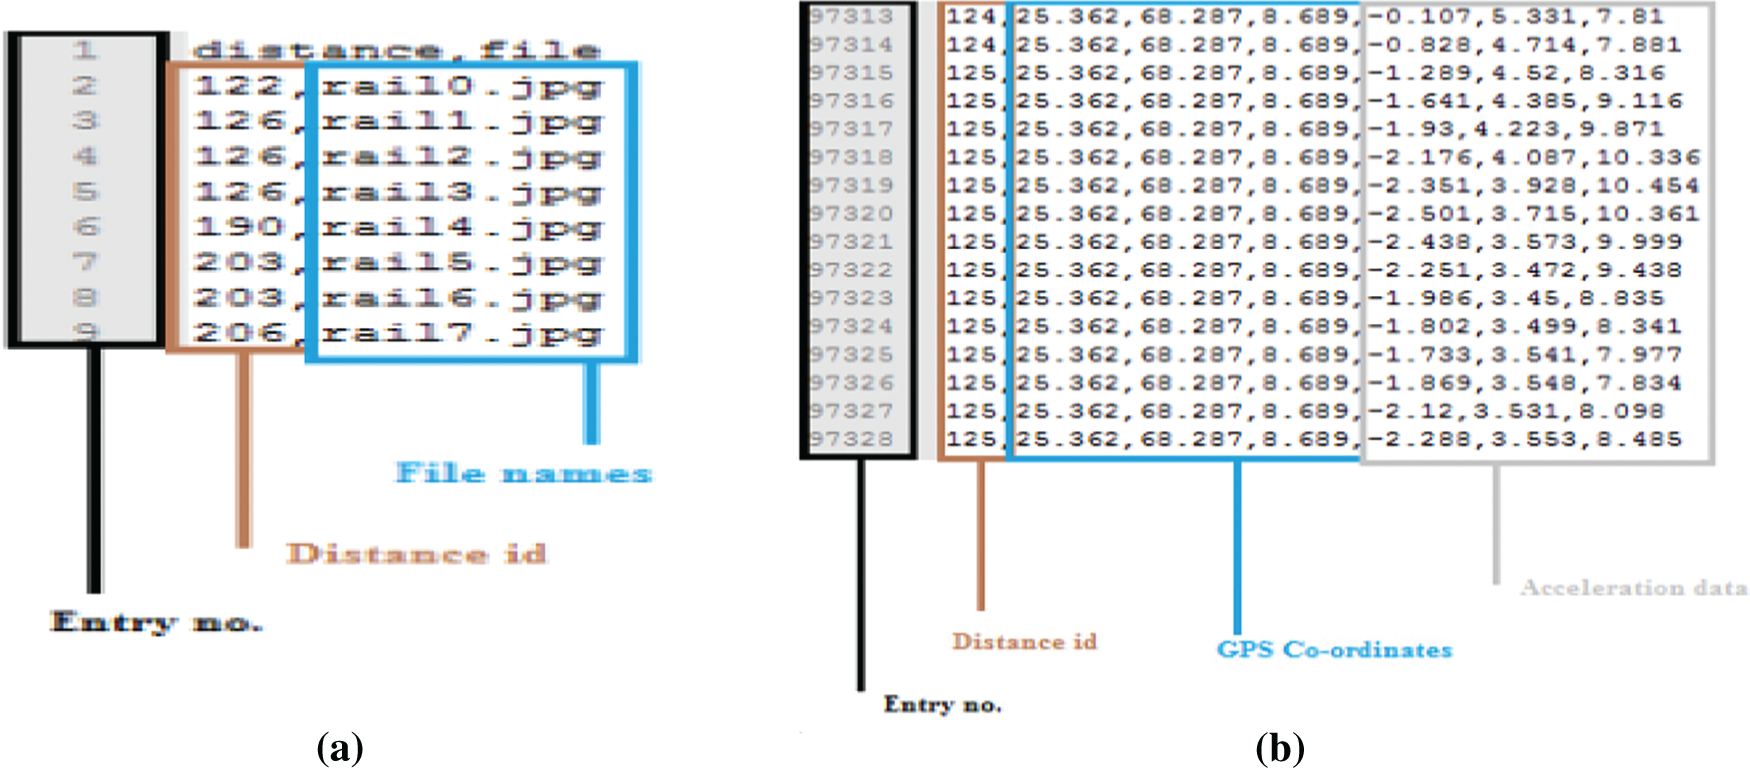
Figure 14: CSV files (a) images along with distance id (b) corresponding multi-sensory data

The resulting CSV files are generated as shown in Fig. 14a, which detects the image information on that distance ID, and Fig. 14b shows other sensory information on that distance id.
5.4 Synchronization of Sensor Data
In this work, we have introduced a novel synchronization approach between the arrival of the wheel precisely on the fault location and image acquisition. This is done by using an acceleration sensor installed near the trolley wheel, as described in the sensor’s installation section in Fig. 10, and when the trolley wheel reaches the point of fault, the acceleration is recorded. This synchronization method uses the proximity sensor and based on the distances between camera and the wheel, the collected data is synchronized. In the onsite detection, two CSV files are shown in Fig. 14a, which shows the distance id where this fault is detected, and Fig. 14b shows the data from other sensors. Based on these two CSV files, the fault detected (i.e., on distance id 122 has acceleration data on distance id 125 from Fig. 14b); because the distance between the camera and wheel is three distance pulses apart. Few samples of the faults recorded in the form of the change in the acceleration during onsite functional verification of the proposed embedded system are shown in Fig. 15.
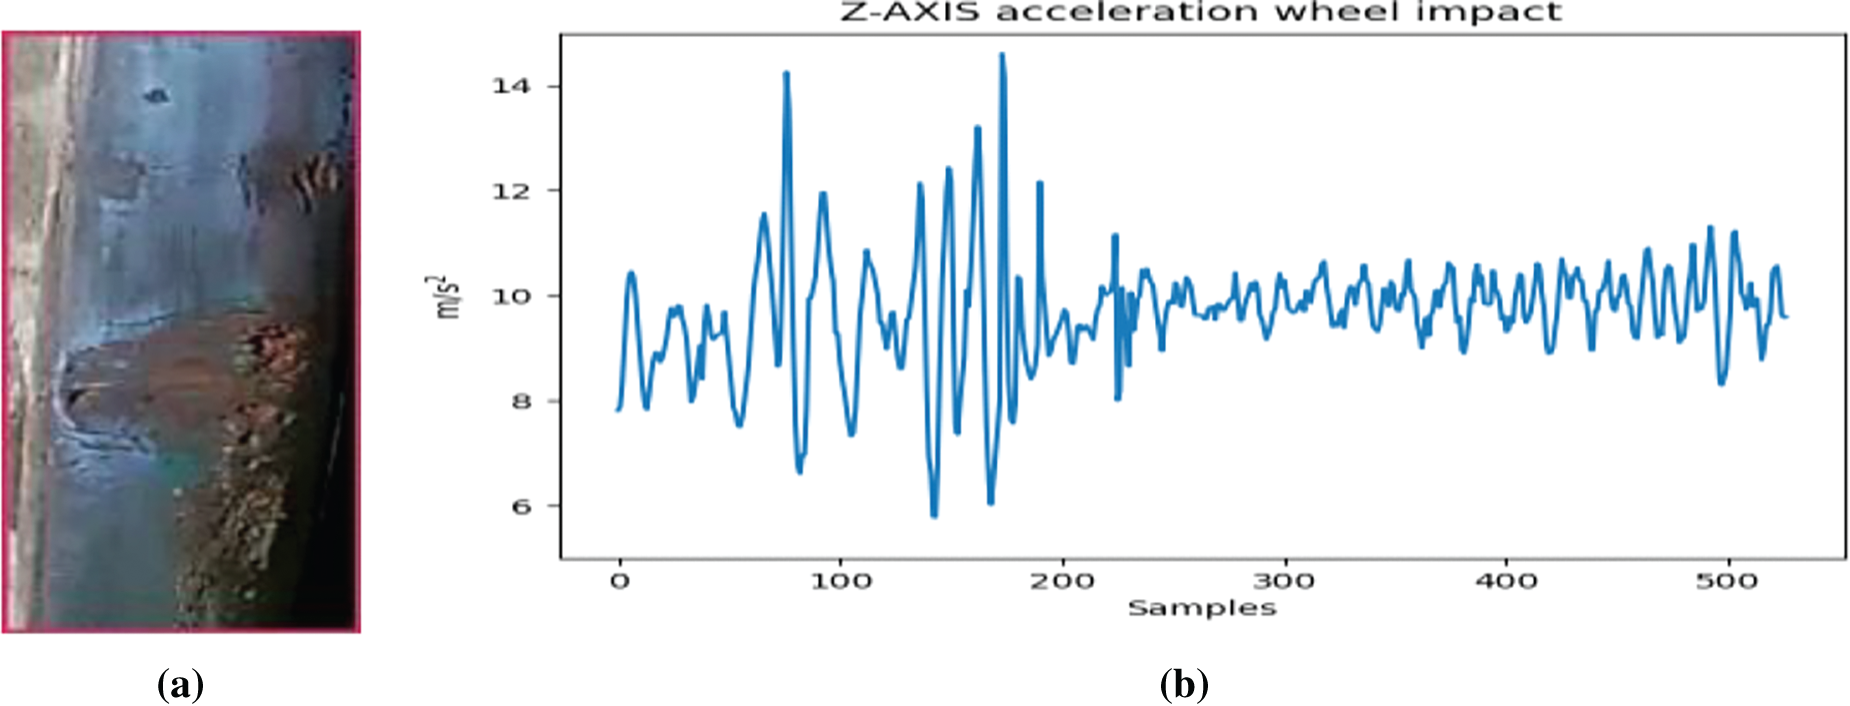
Figure 15: Surface deformation detected automatically during prototype testing (a) image file detected (b) corresponding Z-axis acceleration data
To validate the healthy and unhealthy (i.e., faulty) conditions identified by the embedded system on the track, we have recorded the acceleration of the rail trolley in a static position. This was achieved by recording the Engine’s ON and OFF conditions, as shown in Fig. 16. It can be easily seen that, in the engine’s OFF position, the acceleration is constant compared to the ON position, where the acceleration is higher and changing.
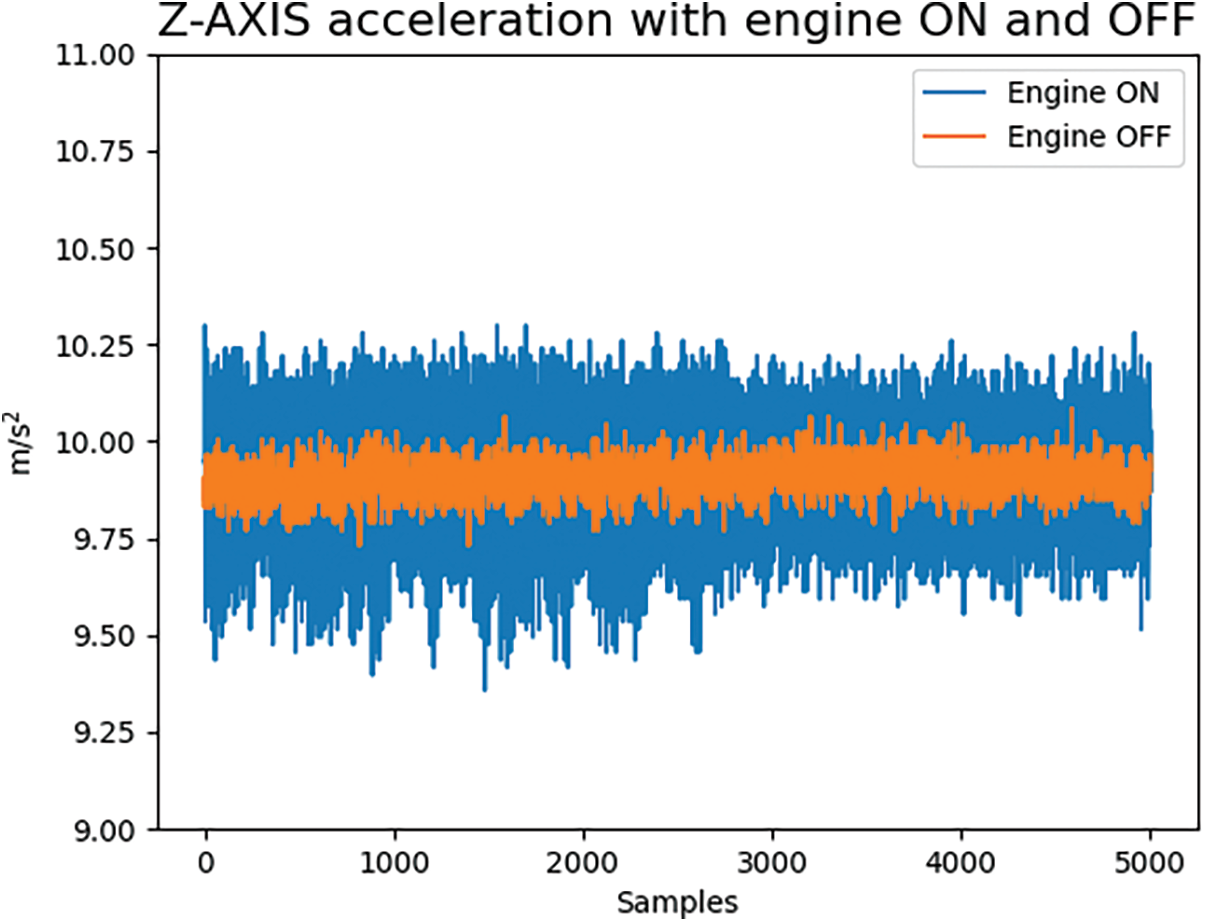
Figure 16: Z-axis acceleration in inspection trolley
5.5 Power Consumption and Processing Speed
The total power consumption of this prototype is 8.54 W, and the processing time of a healthy surface frame is 1.61 ms, while an unhealthy fault processing time is 25.6 ms.
In this work, we have developed a novel embedded condition monitoring system for onsite railway track surface deformation detection, and observing the vibration impact on those surface deformations. This automatic railway track surface deformation detection system is intended to replace the existing manual inspection system. The proposed prototype was developed with the Raspberry Pi along with four sensors to capture the surface faults and measure the acceleration, distance, and location. The developed prototype embedded system was installed on the railway inspection trolley, which was moving at an average speed of 15 km/h, and faults were captured for a distance of approximately 2 km. The real-time fault detection was recorded in two separate CSV files. The system presented here uses a multi-sensor approach where imaging and acceleration play the role to detect surface damage of the railway track surface head, which is 7 cm wide. The system uses customized ROI to focus on the railway track head and detect unhealthy areas on the railway track surface. Acceleration data is synchronized on a detected fault with the help of a proximity sensor. GPS sensor data is also incorporated into the developed system.
Through this developed prototype system, we have generated a dataset for railway track surface faults using the contour algorithm. The next step is to develop the DL algorithm with these images to classify the different faults. The culmination is to use the DL-based onsite embedded system for fault detection and classification in real-time. Further, this system can be improved with a high FPS camera that detects faults at a higher speed.
Acknowledgement: The authors would like to acknowledge the Higher Education Commission (HEC) Pakistan’s support in this research work under the National Center of Robotics and Automation (NCRA) joint lab titled “Haptics, Human Robotics, and Condition Monitoring System (HHCMS)” established at Mehran University of Engineering and Technology, Jamshoro, Pakistan.
Funding Statement: This research work is fully supported by the NCRA project of the Higher Education Commission Pakistan.
Conflicts of Interest: The authors declare that they have no conflict of interest to report regarding the present study.
References
1. A. Ji, W. L. Woo, E. W. L. Wong and Y. T. Quek, “Rail track condition monitoring: A review on deep learning approaches,” Intelligence & Robotics, vol. 1, no. 2, pp. 151–75, 2021. [Google Scholar]
2. M. S. A. Hashmi, M. Ibrahim, I. S. Bajwa, H. U. R. Siddiqui, F. Rustam et al., “Railway track inspection using deep learning based on audio to spectrogram conversion: An on-the-fly approach,” Sensors, vol. 22, no. 5, pp. 1983–2004, 2022. [Google Scholar] [PubMed]
3. F. P. Wu, Q. H. Li, S. P. Li and T. Wu, “Train rail defect classification detection and its parameters learning method,” Measurement, vol. 151, no. February 2020, pp. 107246–107256, 2020. [Google Scholar]
4. T. R. Memon, T. D. Memon, B. S. Chowdhry, I. H. Kalwar and K. Mal, “Development of specialized IoT cloud platform for railway track condition monitoring,” in Proc. Int. Conf. on Robotics and Automation in Industry (ICRAI), Rawalpindi, Pakistan, pp. 1–4, 2021. [Google Scholar]
5. V. V. Krishna, Q. Wu, S. Hossein-Nia, M. Spiryagin and S. Stichel, “Long freight trains & long-term rail surface damage–A systems perspective,” Vehicle System Dynamics, pp. 1–24, 2022. [Google Scholar]
6. X. K. Wei, X. X. Yin, Y. D. Hu, Y. F. He and L. M. Jia, “Squats and corrugation detection of railway track based on time-frequency analysis by using bogie acceleration measurements,” Vehicle System Dynamics, vol. 58, no. 8, pp. 1167–1188, 2019. [Google Scholar]
7. H. Zhu, H. Li, A. Al-juboori, D. Wexler, C. Lu et al., “Understanding and treatment of squat defects in a railway network,” Wear, vol. 442, pp. 203139–203148, 2019. [Google Scholar]
8. S. L. Grassie, D. Fletcher, E. Gallardo-Hernandez and P. Summers, “‘Squats’ and ‘studs’ in rails: Similarities and differences,” in Proc. 10th Int. Heavy Haul Association Conf. on Railroading in Extreme Environments, Calgary, Alberta, Canada, pp. 19–22, 2011. [Google Scholar]
9. S. Kaewunruen, “Identification and prioritization of rail squat defects in the field using rail magnetisation technology,” in Proc. Structural Health Monitoring and Inspection of Advanced Materials, Aerospace, and Civil Infrastructure, San Deigo, California, USA, vol. 9437, pp. 374–384, 2015. [Google Scholar]
10. H. Cho and J. Park, “Study of rail squat characteristics through analysis of train axle box acceleration frequency,” Applied Sciences, vol. 11, no. 15, pp. 7022–7033, 2021. [Google Scholar]
11. A. Wilson, Surface Defects in Rail, 1.2 ed., Sydney, NSW, Australia: NSW Transport RailCorp, 2019. [Google Scholar]
12. S. Kumar, Study of Rail Breaks: Associated Risks and Maintenance Strategies. Lulea, Sweden: Luleå tekniska universitet, 2006. [Google Scholar]
13. S. S. J. Kumar, T. J. Titus, V. Ganesh and V. S. S. Devi, “Automotive crack detection for railway track using ultrasonic sensorz,” International Journal of Engineering Technology and Computer Research (IJETCR), vol. 4, no. 6, pp. 34–37, 2016. [Google Scholar]
14. S. Arivazhagan, R. N. Shebiah, J. S. Magdalene and G. Sushmitha, “Railway track derailment inspection system using segmentation based fractal texture analysis,” ICTACT Journal on Image and Video Processing, vol. 6, no. 1, pp. 1060–1065, 2015. [Google Scholar]
15. J. Ye, E. Stewart, Q. Chen, L. Chen and C. Roberts, “A vision-based method for line-side switch rail condition monitoring and inspection,” Proceedings of the Institution of Mechanical Engineers, Part F: Journal of Rail Rapid Transit, vol. 236, no. 8, pp. 986–996, 2022. [Google Scholar]
16. M. Hussain, D. K. Soother, I. H. Kalwar, T. D. Memon, Z. A. Memon et al., “Stator winding fault detection and classification in three-phase induction motor,” Intelligent Automation, vol. 29, no. 3, pp. 869–883, 2021. [Google Scholar]
17. D. K. Soother, J. Daudpoto, N. R. Harris, M. Hussain, S. Mehran et al., “The importance of feature processing in deep-learning-based condition monitoring of motors,” Mathematical Problems in Engineering, vol. 2021, no. special issue, pp. 1–23, 2021. [Google Scholar]
18. M. Hussain, T. D. Memon, I. Hussain, Z. A. Memon and D. Kumar, “Fault detection and identification using deep learning algorithms in induction motors,” Computer Modeling in Engineering Sciences, vol. 133, no. 2, pp. 435–470, 2022. [Google Scholar]
19. Y. Min, B. Xiao, J. Dang, B. Yue and T. Cheng, “Real time detection system for rail surface defects based on machine vision,” Journal on Image Video Processing, vol. 2018, no. 1, pp. 3–13, 2018. [Google Scholar]
20. Q. Li and S. Ren, “A real-time visual inspection system for discrete surface defects of rail heads,” IEEE Transactions on Instrumentation and Measurement, vol. 61, no. 8, pp. 2189–2199, 2012. [Google Scholar]
21. S. M. Mousavi, D. Younesian and M. Torabi, “A high accuracy and high speed imaging and measurement system for rail corrugation inspection,” IEEE Transactions on Industrial Electronics, vol. 62, no. 9, pp. 8894–8903, 2020. [Google Scholar]
22. J. Isla and F. Cegla, “EMAT phased array probe for detecting surface cracks,” in Proc. 2017 Joint IEEE Int. Symp. on the Applications of Ferroelectric (ISAF)/Int. Workshop on Acoustic Transduction Materials and Devices (IWATMD)/Piezoresponse Force Microscopy (PFM), Atlanta, GA, USA, pp. 41–44, 2017. [Google Scholar]
23. S. Iyer, T. Velmurugan, A. Gandomi, V. N. Mohammed, K. Saravanan et al., “Structural health monitoring of railway tracks using IoT-based multi-robot system,” Neural Computing Applications, vol. 33, no. 11, pp. 1–19, 2020. [Google Scholar]
24. M. Niu, K. Song, L. Huang, Y. Yan and Q. Meng, “Unsupervised saliency detection of rail surface defects using stereoscopic images,” IEEE Transactions on Industrial Informatics, vol. 17, no. 3, pp. 2271–2281, 2020. [Google Scholar]
25. X. Wei, D. Wei, D. Suo, L. Jia and Y. Li, “Multi-target defect identification for railway track line based on image processing and improved YOLOv3 model,” IEEE Access, vol. 8, pp. 61973–61988, 2020. [Google Scholar]
26. A. A. Shah, B. S. Chowdhry, T. D. Memon, I. H. Kalwar and A. Ware, “Real time identification of railway track surface faults using canny edge detector and 2D discrete wavelet transform,” Annals of Emerging Technologies in Computing, vol. 4, no. 2, pp. 53–60, 2020. [Google Scholar]
27. F. Wu, X. Xie, J. Guo and Q. Li, “Internal defects detection method of the railway track based on generalization features cluster under ultrasonic images,” Chinese Journal of Mechanical Engineering, vol. 35, no. 1, pp. 1–18, 2022. [Google Scholar]
28. H. Li, F. Wang, J. Liu, H. Song, Z. Hou et al., “Ensemble model for rail surface defects detection,” PLoS One, vol. 17, no. 5, pp. 268518–268535, 2022. [Google Scholar]
29. U. Dube, S. Subramaniam and S. Subramaniam, “Cost effective railway track fault detection using image processing,” in Proc. 2nd Int. Conf. on IoT Based Control Networks and Intelligent Systems (ICICNIS), Kerala, India, pp. 1–7, 2021. [Google Scholar]
30. C. R. Prasad and P. Kishore, “Performance of active contour models in train rolling stock part segmentation on high-speed video data,” Cogent Engineering, vol. 4, no. 1, pp. 1279367–1279386, 2017. [Google Scholar]
31. Y. Wu, Y. Qin, Y. Qian, F. Guo, Z. Wang et al., “Hybrid deep learning architecture for rail surface segmentation and surface defect detection,” Computer-Aided Civil Infrastructure Engineering, vol. 37, no. 2, pp. 227–244, 2022. [Google Scholar]
32. Z. A. Aziz, D. N. Abdulqader, A. B. Sallow and H. K. Omer, “Python parallel processing and multiprocessing: A rivew,” Academic Journal of Nawroz University, vol. 10, no. 3, pp. 345–354, 2021. [Google Scholar]
33. S. S. Elkapelli and L. B. Damahe, “A review: Region of interest based image retrieval,” in Proc. 2016 Online Int. Conf. on Green Engineering and Technologies (IC-GET), Coimbatore, China, pp. 1–6, 2016. [Google Scholar]
34. W. Hou, D. Xia and H. Jung, “Video road vehicle detection and tracking based on OpenCV,” in Proc. Int. Conf. on Information Science and Education (ICISE-IE), Sanya, China, pp. 315–318, 2020. [Google Scholar]
35. Q. Huang, W. Gao and W. Cai, “Thresholding technique with adaptive window selection for uneven lighting image,” Pattern Recognition Letters, vol. 26, no. 6, pp. 801–808, 2005. [Google Scholar]
36. J. Zhu, D. Navarro-Alarcon, R. Passama and A. Cherubini, “Vision-based manipulation of deformable and rigid objects using subspace projections of 2D contours,” Robotics Autonomous Systems, vol. 142, no. August 2021, pp. 103798–103812, 2021. [Google Scholar]
37. X. -Y. Gong, H. Su, D. Xu, Z. T. Zhang, F. Shen et al., “An overview of contour detection approaches,” International Journal of Automation and Computing, vol. 15, no. 6, pp. 656–672, 2018. [Google Scholar]
38. H. -I. Lin and F. S. Wibowo, “Image data assessment approach for deep learning-based metal surface defect-detection systems,” IEEE Access, vol. 9, pp. 47621–47638, 2021. [Google Scholar]
39. S. Liu, Q. Wang and Y. Luo, “A review of applications of visual inspection technology based on image processing in the railway industry,” Transportation Safety Environment, vol. 1, no. 3, pp. 185–204, 2019. [Google Scholar]
Cite This Article
 Copyright © 2023 The Author(s). Published by Tech Science Press.
This work is licensed under a Creative Commons Attribution 4.0 International License , which permits unrestricted use, distribution, and reproduction in any medium, provided the original work is properly cited.
 Downloads
 Citation Tools