
 Submit a Paper
 Propose a Special lssue
 Open Access
ARTICLE

Intelligent System Application to Monitor the Smart City Building Lighting
1 Department of Industrial Engineering and Management, Ming Chi University of Technology, New Taipei City, 24301, Taiwan
2 Department of Architecture, Faculty of Engineering, Udayana University, Bali, 80361, Indonesia
3 Department of Computer Engineering and Applications, GLA University, Mathura, Uttar Pradesh, India
4 Department of Mathematics, Dwaraka Doss Goverdhan Doss Vaishnav College, Arumbakkam, University of Madras, Chennai, India
5 Architectural Engineering Department, Faculty of Engineering & Technology, Future University in Egypt, New Cairo, 11835, Egyp
* Corresponding Authors: Ngakan Ketut Acwin Dwijendra. Email: ,
Computers, Materials & Continua 2023, 75(2), 3159-3169. https://doi.org/10.32604/cmc.2023.035418
Received 20 August 2022; Accepted 28 September 2022; Issue published 31 March 2023
 View Full Text
 Download PDF
Abstract
A smart city incorporates infrastructure methods that are environmentally responsible, such as smart communications, smart grids, smart energy, and smart buildings. The city administration has prioritized the use of cutting-edge technology and informatics as the primary strategy for enhancing service quality, with energy resources taking precedence. To achieve optimal energy management in the multidimensional system of a city tribe, it is necessary not only to identify and study the vast majority of energy elements, but also to define their implicit interdependencies. This is because optimal energy management is required to reach this objective. The lighting index is an essential consideration when evaluating the comfort indicators. In order to realize the concept of a smart city, the primary objective of this research is to create a system for managing and monitoring the lighting index. It is possible to identify two distinct phases within the intelligent system. Once data collection concludes, the monitoring system will be activated. In the second step, the operation of the control system is analyzed and its effect on the performance of the numerical model is determined. This evaluation is based on the proposed methodology. The optimized results were deemed satisfactory because they maintained the brightness index value (79%) while consuming less energy. The intelligent implementation system generated satisfactory outcomes, which were observed 1.75 times on average.Keywords
One of the most important issues in the development of smart cities is the improvement and efficient use of energy resources. As a result, the development of energy-independent cities has long been regarded as a goal in sustainable development [1–3]. To achieve optimal energy management in a complex system such as a smart city, not only must the majority of energy elements be identified and studied, but their implicit interdependence must also be defined. Furthermore, extensive modeling is required to validate today’s sophisticated and cutting-edge systems [4–7]. Energy storage, intelligent energy management, and the utilization of internal resources that can be converted into renewable energy sources are all required today to address energy security issues [8,9].
In the case of an intelligent structure, energy management necessitates a systematic and ongoing effort to increase the building’s energy efficiency [10,11]. In the proposed smart city research, prioritize the examination of the capabilities, existing barriers, and fundamental criteria for achieving a smart city, as well as the degree of compliance of buildings with the smart city concept [12–14]. In this regard, the main building blocks (structures) for a city to become a smart city will be the gradual advancement of technology [15], as well as paving the way for optimizing energy consumption and management. When implementing and managing smart cities, numerous factors must be carefully considered [16]. Calvillo et al. [17] investigated all aspects of energy in the smart city and its communications, and they present a number of existing models and simulation tools. Energy-efficient buildings with improved applications, control systems, and demand-based designs, according to the study’s findings, will play an important role in future smart cities [17,18]. In another study, Petritoli et al. [19] used usable energy storage as consumption data for the smart street test system. In this study, the energy consumption of the lighting system is compared to that of a predefined simulated system. As a result, the lighting system can be tailored to the current weekly average traffic volume. Clearly, no exhaustive practical examination in this field has taken place. Intelligent transportation research has also been conducted [20–22]. Vázquez-Canteli et al. [23] investigated energy consumption reduction and optimization by combining a numerical model for city energy consumption simulation and a numerical model for developing advanced machine learning algorithms. This method is used to develop learning control algorithms, and their capacity and capability can be measured across cities, laying the groundwork for intelligent energy management. An automatic monitoring system, consumption control, manufacturing, and optimal adjustment of comfort indicators (light, temperature, humidity, and smoke) were used in this study [24]. The development of a smart city not only promotes technology and knowledge, but also provides the infrastructure for optimal energy consumption and management [25]. Smart cities, and particularly smart energy, provide a platform for monitoring and control, as well as general energy management, to be more transparently available to officials and consumers. Energy production and supply can be managed by accurately measuring these needs when the indicators of residents’ living comfort and real needs are clearly identified and based on intelligent and modern mechanisms [26]. This not only reduces energy consumption, but also serves as a smart city and building automation mechanism.
The novel aspect of this research is the implementation of a monitoring system, which begins with an analysis of requirements in the field of lighting index and is followed by the utilization of the intelligent control system to achieve a consumption pattern that is relatively close to the optimal consumption pattern. This results in a reduction in the overall energy consumption of the building, in addition to maintaining the desired brightness index.
This section describes the feasibility and implementation steps of the intelligent system of building lighting hardware and numerical model. The study and operational stages of this project include the following subsections (Fig. 1).
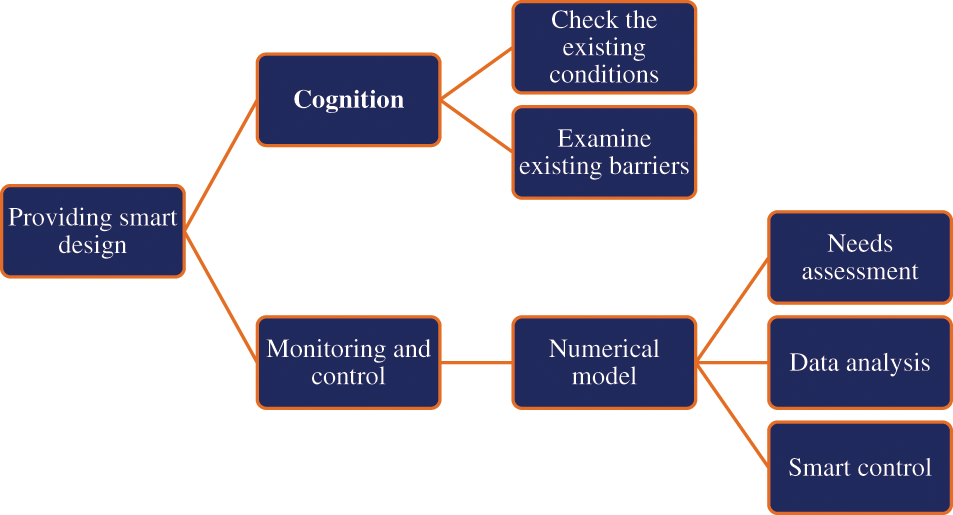
Figure 1: Schematic of the executive stages of research
The cognition phase generally includes the following:
• Investigation and analysis of the conditions of the building in terms of geographical location
• Examining the existing obstacles to the technical implementation of the plan.
In general, the monitoring and control phase consists of a Needs assessment that takes into account the significance of adjusting the brightness index at specific points and times, the collection of quantitative data and the measurement of the current power consumption pattern in the monitoring phase, and the implementation of hardware and numerical model equipment to control the brightness index and optimally adjust the power consumption according to the desired brightness.
In this section, the operational strategy is laid out, excluding concerns about its feasibility and the obstacles that stand in the way of its full implementation. The ultimate goal of this section is to provide a numerical model that can optimize, monitor, and manage energy usage with a particular emphasis on the brightness index once the system has been fully implemented. Electric current sensor, motion sensor (to monitor traffic), and light sensor are all examples of sensors that make up the intelligent mechanism. To accomplish this, the hardware component (central electronic board) is used to establish a connection between the sensors of the intelligent mechanism. Detailed descriptions of the anticipated monitoring and control systems are provided below:
In a timely monitoring system, the monitoring operation is performed according to the received inputs in three categories. As shown in Fig. 2, the three input categories are desirable variables, consumption, and environmental factors.
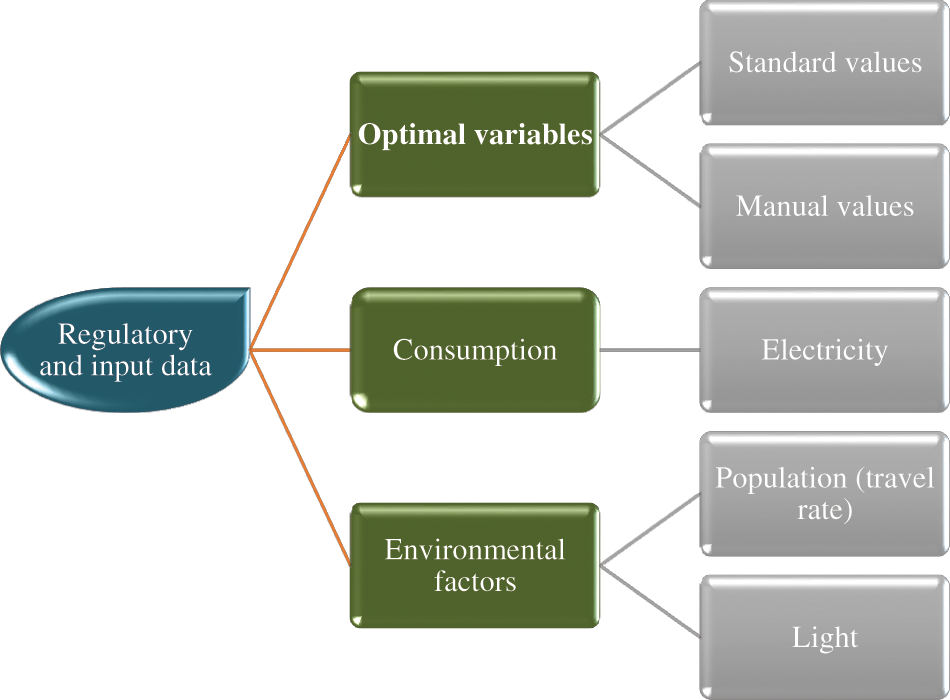
Figure 2: Configuration of the monitoring section for intelligent management system
The timely control system executes the control operation based on the timely monitoring system’s received inputs. (Fig. 3). This is done as a result of a discernible influence from the surrounding environment. In point of fact, this is done after assessing and collecting demographic data, in addition to determining the value of various building sections, as was described in the section on monitoring. By modulating the brightness index in this way, the control action helps to maximize efficiency in terms of energy consumption. It is prevented from being lost in the less significant portions of the building as a result of the sensitive regulation of environmental conditions in the important parts of the building and the concentration of energy consumption in those regions [27,28].
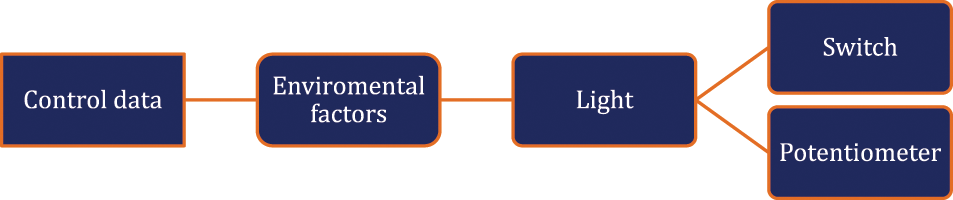
Figure 3: Configuration of the controlling section for intelligent management system
The control operation is attempted to be performed in a closed cycle. This implies that the control of variables is initially determined by the number of desirable variables. The monitored system then alternately measures the controlled parameters; if there is a difference, the control system will attempt to correct it again. Regarding the control mechanism of each environmental component, it should be noted that this operation must be carried out in accordance with the mechanism employed in the lighting equipment, which is stated individually:
The general control algorithm used in this system is configured in such a way that the desired values of the brightness factor are fixed values, and the measured values are entered into the controlled. Then the amount of environmental factors (brightness and traffic) are measured again, compared in the control section, and if there is a difference, the control is performed on the amount of light. This is repeated intermittently and at regular intervals (tR ≈ 10 s) [29]. Thus, the values are controlled based on the desired values.
It is worth noting that, as mentioned earlier, control is not done directly on consumption, but indirectly, based on the desired amount of brightness and the importance of different points (travel rates). For example, to adjust the light in a room if the rate of travel in that room during the day is 0, the control action regardless of the desired amount of light (or by considering a reduction factor in the desired amount), the amount of power consumption reduces the number of light sources or their current consumption, unless the room is manually defined as a critical point for security reasons [30].
It is important to note that the proposed algorithm (Fig. 4) uses the desired periodicity to replicate the control algorithm. This is something that should be kept in mind. This indicates that the newly presented algorithm is carried over into each iteration of the repeated cycle range that is denoted by a dashed line. It is also important to note that simultaneous measurements are being taken of the environmental factors, and that the parameters used in this algorithm actually represent the current value of the parameter that is being sought after. The brightness control function is designed to adjust the light between the minimum (Imin) and maximum (Imax) light intensities. In this algorithm the following situations are possible. First of all The variable of the status or command of the lighting system is 0 (S = 0). This means that the lighting adjustment system must be off, so the command to turn off the lighting system is sent.
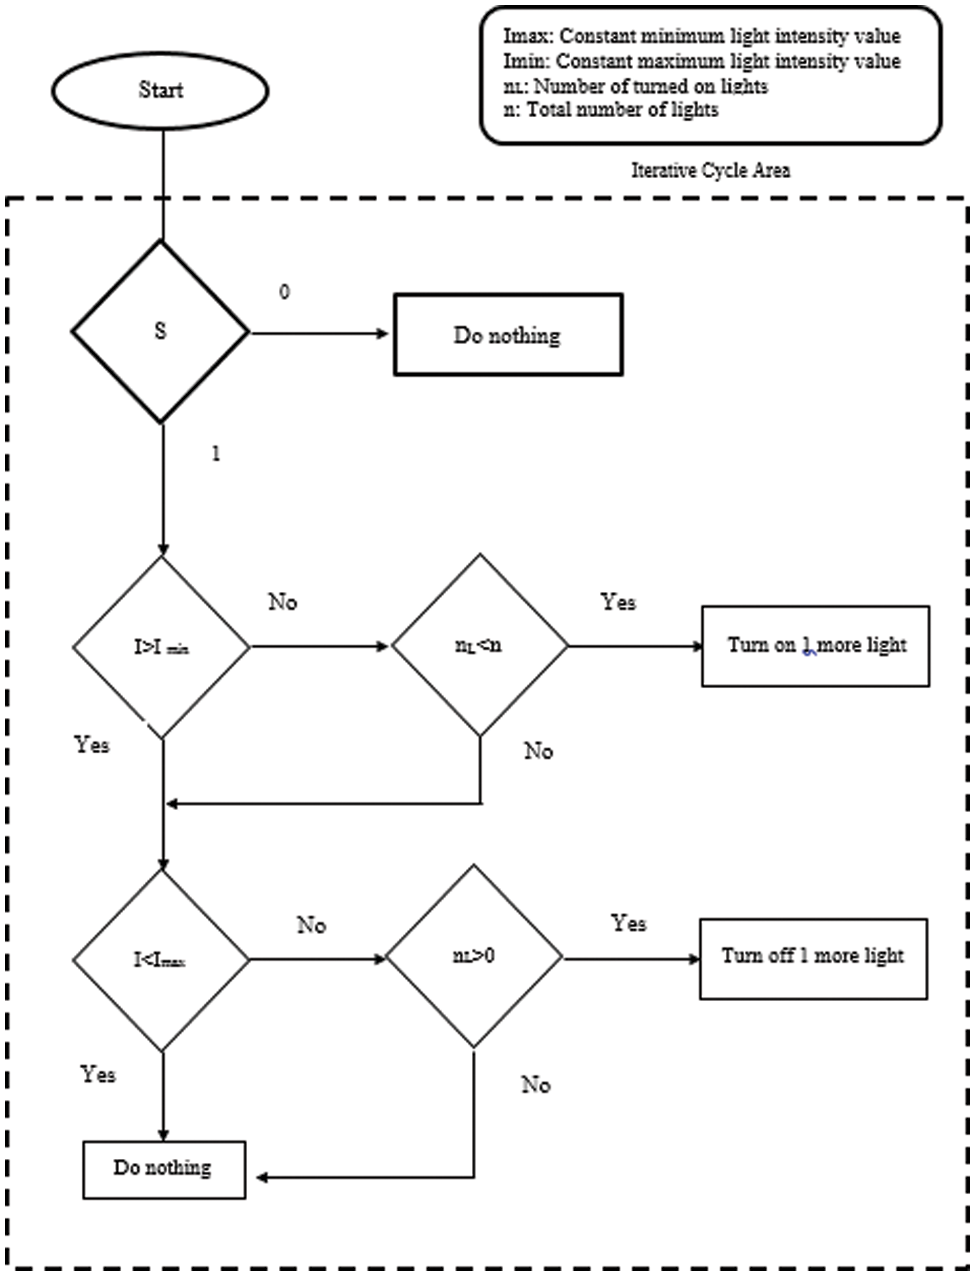
Figure 4: The algorithm for control that is utilized in the intelligent system and is repeated at each and every time interval
In addition the variable of the status or command of the lighting system is 1 (S = 1). This means that the brightness adjustment system must be active. Therefore, the lighting system works as follows:
Adjust the light intensity (I) relative to the minimum light intensity (I < Imin).
In this situation, two situations are possible:
– The number of light sources (lamps) NL is less than the total number of light sources (N).
In this situation, a bright light source is added to increase the light intensity, and if the light intensity still does not reach the desired level, in the next repetition of the cycle, another light source is lit. This continues until the light intensity reaches the desired level. It is worth noting that if the lighting system has variable brightness adjustment equipment, the control action is applied to their voltage instead of the number of light sources. Since this requires modification and equipping of the currently used facilities, it is costly and the number-based algorithm is mentioned as the proposed algorithm [31].
– The number of light sources (nL) is equal to the total number of light sources (n).
Since in this situation no other light source can be turned on (no other off light source is available) no special operation is performed and the algorithm continues to run. It should be noted, however, that this does not usually happen, because the light intensity must at least usually be determined to the extent that it can be met by the number of light sources available [32].
Adjusting the light intensity (I) to the maximum light intensity (I > Imax)
In this case the following situations are possible:
– The number of light sources (nL) is more than 0.
The intensity of the light is decreased by cycling one of the light sources on and off. If the intensity of the light does not drop to the level that is desired, the cycle is repeated with a different light source being turned off after each repetition of the cycle. This process will be repeated until the desired level of light intensity is achieved.
– The number of bright light sources is 0.
Since in this situation no other light source can be turned off (no other light source is available) no special operation is performed and the algorithm continues to run. It should be noted, however, that this usually occurs during the day or at a complete blackout, because during the day the light intensity is usually greater than the maximum defined light intensity (That is, without any bright light source, the I > Imax state occurs), and at a complete blackout, the maximum light intensity is defined as approximately 0 (That is, without any bright light source, the I > Imax situation still occurs).
The numerical model of the intelligent system is designed to monitor and control the brightness index and adjust the power consumption based on the proposed algorithms (Fig. 4). In the present study, the building in order to increase controllability is divided into several areas. In this way, monitoring and control of the desired factor and power consumption can be done independently from other areas. Numerical model consists of three parts: input, monitoring, and control:
• Input: In the data input part, the desired value of light intensity is entered as minimum (Imin) and maximum (Imax).
• Monitoring: In the monitoring section, the amount of current light intensity and the activation status of the lighting adjustment system are displayed numerically and graphically.
• Control: In the status control section, the lighting adjustment system (manual or automatic) is determined for the number of available light sources. Automatic mode means control by intelligent system, and manual mode means control of turning on and off light sources manually.
By delving deeper into the topic of building intelligence, one can gain a better understanding of how to maximize the building’s potential to save energy, as well as the challenges and factors that stand in the way of doing so, as well as the solutions available. In an intelligent building, in addition to monitoring changes in parameters related to energy consumption and recording data in a centralized system, optimal control of various elements is accomplished by determining the brightness parameter. This allows for the most efficient use of the building’s resources. If this procedure is carried out in a methodical manner, it will have a positive impact on the degree to which energy consumption is optimized. Before the monitoring and data collection operation, the building is subdivided into four distinct areas according to the plan that was ultimately put into action. This is done taking into account the total number of available light sources in each individual area. After that, the parameter for the amount of traffic in each of these areas is continuously monitored. The amount of travel as well as the rate of travel is recorded so that the importance of each area can be determined (Fig. 5a); additionally, the measured light intensity over the course of a day is shown in Fig. 5b.
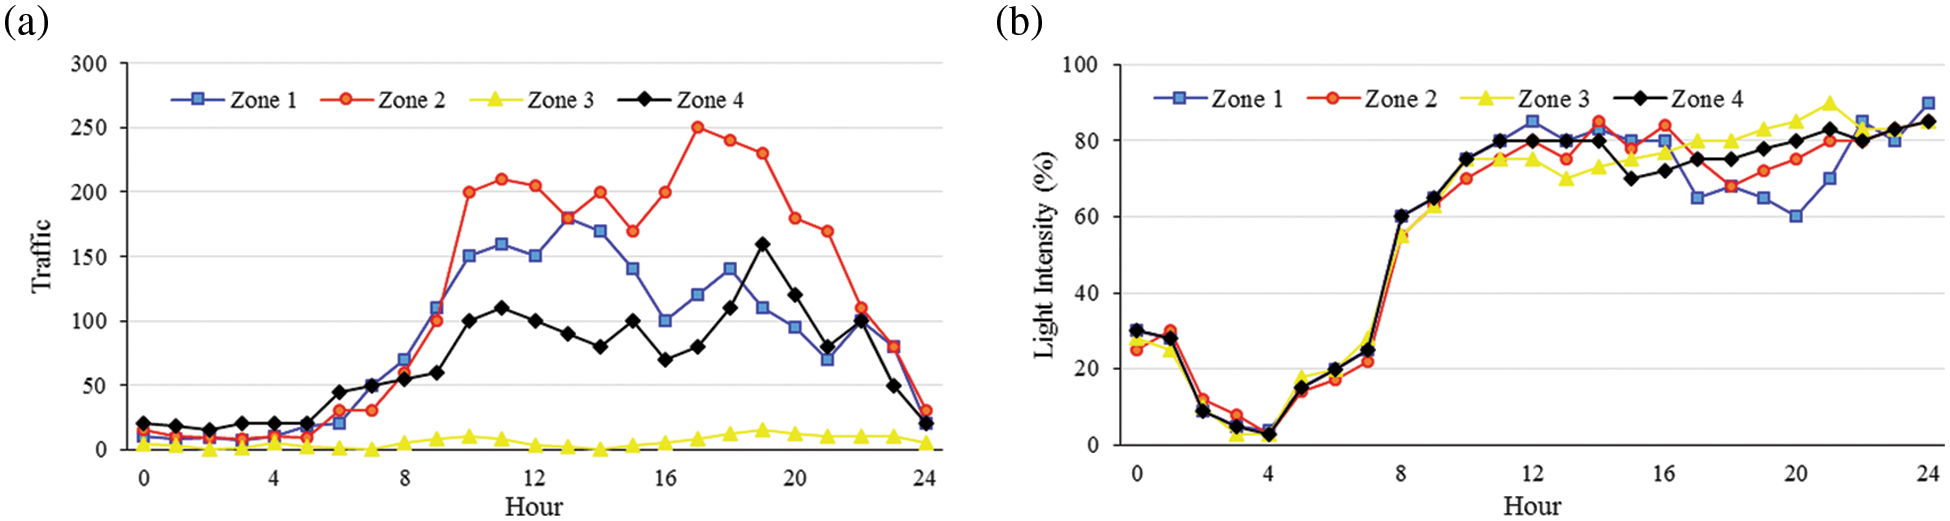
Figure 5: The amount and rate of (a) measured traffic and (b) light intensity for 24 h in 4 areas
Fig. 6 depicts the measured illumination intensity that was obtained following the implementation of the intelligent system. As can be seen, there is a marginal variation in the measured light intensity between the time before (Fig. 5b) and after (Fig. 6) the implementation of the intelligent system, but the required light intensity is still provided at a level that is deemed to be acceptable. It should also be noted that the amount of traffic and the importance of each point in the intensity of the light provided after the implementation of the control system has been observed. This observation has taken place after the system has been put into place. Therefore, it is important to keep in mind that the point under consideration does not require lighting only during the hours in which there is no traffic. Since the presence of even a single user (resident) in the area will necessitate the desired lighting intensity at that point, it is therefore not possible to program the system in such a way that the amount of low traffic is entered directly into the light intensity created by a coefficient. As a result, the controlled light intensity in each area is only set to 0 during times when there is no traffic, as depicted in Fig. 6.

Figure 6: Light intensity amount during a day in 4 areas, after the implementation of the intelligent system
The amount of current drawn is used to evaluate power consumption in all four of these different areas. According to Figs. 7a and 7b, from the wee hours of the morning (1:00) until the late afternoon (16:00), there is not a significant difference in the amount of electricity consumed, either before or after the implementation of the system. This is most likely because there is no requirement for a high level of brightness during these hours of the day. It is important to note, however, that the test building was inspected while the weather conditions were typical for the overnight hours. These conditions indicate that there will be no clouds in the sky. Therefore, if there are factors such as clouds and rain that reduce natural light, the difference in the amount of energy that must be consumed to create light during these hours will certainly be greater than the current situation. But there is one thing that can be discussed in general, and that is during the nighttime. Between the hours of 16:00 and 24:00, there is a substantial difference in the amount of electricity that is consumed, as shown in Fig. 7a. The comparison of this can be seen very clearly in Fig. 7c. The total amount of electricity consumed both before and after the intelligent system was put into place is depicted here using a diagram. This demonstrates the direct effect that the intelligent system that was proposed has in reducing the consumption of electrical energy.

Figure 7: Total current consumption of 4 areas (a) before the implementation of smart system in 4 area, (b) after the implementation of smart system in 4 area, and (c) before and after the implementation of smart system
In point of fact, the intelligent system that was implemented has been working in such a way that the amount of energy consumption (electric current) is determined according to the actual needs that are being monitored. The real requirement is the required intensity (percentage) of the required brightness, which can be calculated using the data that was gathered before the system was put into operation.
This brightness is determined prior to the implementation of the intelligent control system (optimization), regardless of consumption, and only from the user’s perspective, whereas consumption is adjusted only after the implementation of the intelligent control system based on the required light intensity. For example, if the user’s lighting requirement is 79% at 9 p.m., this light intensity is created with 4 light sources, and the amount of power consumed in this situation is 5 units of power. While the same light intensity (79%) can be achieved with only two light sources, the power consumption is only 2.5 units. This is accomplished through the use of a monitoring and control system. In fact, this system only increases the number of active (bright) light sources until the required brightness is achieved; while the user is unaware of the small amount of light intensity, he increases the amount of consumption by increasing the number of active light sources (turning on the light source). As a result, it is clear that the system has had a direct impact on lowering energy consumption. Now, if this system is implemented at several points throughout the area (building), it is done based on the amount of traffic and the importance of areas, with some areas receiving less traffic due to their low importance. They will have very few; however, prior to the system’s implementation, it is possible that, due to the user’s forgetfulness, the less important areas will continue to use energy unnecessarily due to the activation of light sources in them.
This investigation presented an intelligent energy efficiency optimization system as well as a method to adjust the lighting index as part of the overall findings. As a result of this investigation, both of these were presented to the audience. The investigation was conducted with the intention of looking into things, which it did. The varying degrees to which the various parts and pieces of the structure contributed to the building as a whole formed the conceptual foundation of the system. This provided a strong foundation for the system to work on. The numerical model and hardware both describe how to design and operate this system in two stages, monitoring and control. These stages are discussed further below. The sections that follow will go over these stages in greater depth. These stages are divided into as many granular details as possible. When considering the system’s operation mechanism, the amount of energy consumed reduced by adjusting the number of unnecessary light sources to provide the required lighting for each area is shown. As a result, the amount of energy consumed decreases. As a result, the total amount of energy consumed decreases. As a result, the total amount of energy consumed has been reduced. As a result, the overall amount of money spent on energy has been significantly reduced, resulting in a net savings. The system implemented reduces the required amount of power consumption for lighting by an average of 1.75 times, despite maintaining the desired percentage of lighting inside the building at the same level (79 percent). This is done while maintaining the same level of lighting. This is accomplished with no changes to the current lighting level. At no point during the process is the amount of natural light entering the building reduced. Based on the findings, it is anticipated that it will be possible to use it to measure other comfort indicators (such as temperature and suspended particles), which will then be implemented in other residential and non-residential areas. This will be done because other types of comfort indicators can be measured with it. This is because it will be possible to use it to measure other indicators of comfort. This is due to the fact that the system’s operation is dependent on the recognition of actual user requirements, as well as the significance of a variety of different points. This is the main reason for the current situation (determined by the volume of traffic).
Funding Statement: The authors received no funding for this study.
Conflicts of Interest: The authors declare that they have no conflicts of interest to report regarding the present study.
References
1. H. U. Khan, M. K. Alomari, S. Khan, S. Nazir, A. Q. Gill et al., “Systematic analysis of safety and security risks in smart homes,” Computers, Materials & Continua, vol. 68, no. 1, pp. 1409–1428, 2021. [Google Scholar]
2. E. Guler, S. Yerel Kandemir, E. Acikkalp and M. H. Ahmadi, “Evaluation of sustainable energy performance for OECD countries,” Energy Sources, Part B: Economics, Planning and Policy, vol. 16, no. 6, pp. 491–514, 2021. [Google Scholar]
3. A. A. Abdel-Wahab, A. Maligno and V. V. Silberschmidt, “Dynamic properties of cortical bone tissue: Izod tests and numerical study,” Computers, Materials & Continua, vol. 19, no. 3, pp. 217–237, 2010. [Google Scholar]
4. S. Y. Kandemir and M. Ö. Yaylı, “Investigation of renewable energy sources for airports,” in Sustainable Aviation: Energy and Environmental Issues, Springer, Sustainable Aviation, pp. 11–16, 2016. [Google Scholar]
5. M. M. Shahsavar, M. Akrami, M. Gheibi, B. Kavianpour, A. M. Fathollahi-Fard et al., “Constructing a smart framework for supplying the biogas energy in green buildings using an integration of response surface methodology, artificial intelligence and petri net modelling,” Energy Conversion and Management, vol. 248, pp. 114794, 2021. [Google Scholar]
6. Y. Himeur, A. Alsalemi, F. Bensaali and A. Amira, “The emergence of hybrid edge-cloud computing for energy efficiency in buildings,” in Proc. SAI Intelligent Systems Conf.: Springer, Amsterdam, The Netherlands pp. 70–83, 2021. [Google Scholar]
7. H. Fontenot, K. S. Ayyagari, B. Dong, N. Gatsis and A. Taha, “Buildings-to-distribution-network integration for coordinated voltage regulation and building energy management via distributed resource flexibility,” Sustainable Cities and Society, vol. 69, pp. 102832, 2021. [Google Scholar]
8. E. Açıkkalp and S. Yerel Kandemir, “Optimum insulation thickness of the piping system with combined economic and environmental method,” Energy Sources, Part A: Recovery, Utilization and Environmental Effects, vol. 40, no. 23, pp. 2876–2885, 2018. [Google Scholar]
9. M. Zekić-Sušac, A. Has and M. Knežević, “Predicting energy cost of public buildings by artificial neural networks, CART, and random forest,” Neurocomputing, vol. 439, pp. 223–233, 2021. [Google Scholar]
10. G. Pinto, M. S. Piscitelli, J. R. Vázquez-Canteli, Z. Nagy and A. Capozzoli, “Coordinated energy management for a cluster of buildings through deep reinforcement learning,” Energy, vol. 229, pp. 120725, 2021. [Google Scholar]
11. M. Elsisi, M. Q. Tran, K. Mahmoud, M. Lehtonen and M. M. Darwish, “Deep learning-based industry 4.0 and internet of things towards effective energy management for smart buildings,” Sensors, vol. 21, no. 4, pp. 1038, 2021. [Google Scholar] [PubMed]
12. J. Joe, J. Dong, J. Munk, T. Kuruganti and B. Cui, “Virtual storage capability of residential buildings for sustainable smart city via model-based predictive control,” Sustainable Cities and Society, vol. 64, pp. 102491, 2021. [Google Scholar]
13. M. Bruzzone, “Medium-Sized smart cities: A smart vision for urban centralities and buildings. From the European Case History, to a proposal for the City of Parma, Italy,” In: E. Magnaghi, V. Flambard, D. Mancini, J. Jacques, N. Gouvy, (Eds.Organizing Smart Buildings and Cities. Lecture Notes in Information Systems and Organisation, vol. 36, Cham: Springer, 2021. https://doi.org/10.1007/978-3-030-60607-7_7 [Google Scholar] [CrossRef]
14. A. Radziejowska and B. Sobotka, “Analysis of the social aspect of smart cities development for the example of smart sustainable buildings,” Energies, vol. 14, no. 14, pp. 4330, 2021. [Google Scholar]
15. L. Mendoza-Pitti, H. Calderón-Gómez, M. Vargas-Lombardo, J. M. Gómez-Pulido and J. L. Castillo-Sequera, “Towards a service-oriented architecture for the energy efficiency of buildings: A systematic review,” IEEE Access, vol. 9, pp. 26119–26137, 2021. [Google Scholar]
16. S. -V. Oprea, A. Bâra, R. C. Marales and M. -S. Florescu, “Data model for residential and commercial buildings. load flexibility assessment in smart cities,” Sustainability, vol. 13, no. 4, pp. 1736, 2021. [Google Scholar]
17. C. F. Calvillo, A. Sánchez-Miralles and J. Villar, “Energy management and planning in smart cities,” Renewable and Sustainable Energy Reviews, vol. 55, pp. 273–287, 2016. [Google Scholar]
18. H. Kim, H. Choi, H. Kang, J. An, S. Yeom et al., “A systematic review of the smart energy conservation system: From smart homes to sustainable smart cities,” Renewable and Sustainable Energy Reviews, vol. 140, pp. 110755, 2021. [Google Scholar]
19. E. Petritoli, F. Leccese, S. Pizzuti and F. Pieroni, “Smart lighting as basic building block of smart city: An energy performance comparative case study,” Measurement, vol. 136, pp. 466–477, 2019. [Google Scholar]
20. H. Farzaneh, L. Malehmirchegini, A. Bejan, T. Afolabi, A. Mulumba et al., “Artificial intelligence evolution in smart buildings for energy efficiency,” Applied Sciences, vol. 11, no. 2, pp. 763, 2021. [Google Scholar]
21. M. Jafari, A. Kavousi-Fard, T. Niknam and O. Avatefipour, “Stochastic synergies of urban transportation system and smart grid in smart cities considering V2G and V2S concepts,” Energy, vol. 215, pp. 119054, 2021. [Google Scholar]
22. J. Aguilar, A. Garces-Jimenez, M. R-Moreno and R. García, “A systematic literature review on the use of artificial intelligence in energy self-management in smart buildings,” Renewable and Sustainable Energy Reviews, vol. 151, pp. 111530, 2021. [Google Scholar]
23. J. R. Vázquez-Canteli, S. Ulyanin, J. Kämpf and Z. Nagy, “Fusing tensorflow with building energy simulation for intelligent energy management in smart cities,” Sustainable Cities and Society, vol. 45, pp. 243–257, 2019. [Google Scholar]
24. M. Zekić-Sušac, S. Mitrović and A. Has, “Machine learning based system for managing energy efficiency of public sector as an approach towards smart cities,” International Journal of Information Management, vol. 58, pp. 102074, 2021. [Google Scholar]
25. M. Thornbush and O. Golubchikov, “Smart energy cities: The evolution of the city-energy-sustainability nexus,” Environmental Development, vol. 39, pp. 100626, 2021. [Google Scholar]
26. C. Y. Yi, C. Childs, C. Peng and D. Robinson, “Thermal comfort modelling of older people living in care homes: An evaluation of heat balance, adaptive comfort, and thermographic methods,” Building and Environment, vol. 207, pp. 108550, 2022. [Google Scholar]
27. P. Jian, T. Guo, D. Wang, E. Valipour and S. Nojavan, “Risk-based energy management of industrial buildings in smart cities and peer-to-peer electricity trading using second-order stochastic dominance procedure,” Sustainable Cities and Society, vol. 77, pp. 103550, 2022. [Google Scholar]
28. K. Alagar, S. Thirumal, “Standalone PV-Wind-DG-Battery hybrid energy system for zero energy buildings in smart city Coimbatore, India,” In: F. Al-Turjman and N. Gowthaman, (Eds.Advanced Controllers for Smart Cities. EAI/Springer Innovations in Communication and Computing. Cham: Springer, 2021. https://doi.org/10.1007/978-3-030-48539-9_5 [Google Scholar] [CrossRef]
29. R. Alayi, F. Zishan, S. R. Seyednouri, R. Kumar, M. H. Ahmadi et al., “Optimal load frequency control of island microgrids via a PID controller in the presence of wind turbine and PV,” Sustainability, vol. 13, no. 19, pp. 10728, 2021. [Google Scholar]
30. M. H. Ahmadi, R. Kumar, M. E. H. Assad and P. T. T. Ngo, “Applications of machine learning methods in modeling various types of heat pipes: A review,” Journal of Thermal Analysis and Calorimetry, vol. 146, no. 6, pp. 2333–2341, 2021. [Google Scholar]
31. A. Karthick, V. K. Chinnaiyan, J. Karpagam, V. Chandrika and P. R. Kumar, “Optimization of PV-wind hybrid renewable energy system for health care buildings in smart city,” Hybrid Renewable Energy Systems, pp. 183–198, 2021. https://doi.org/10.1002/9781119555667.ch8 [Google Scholar] [CrossRef]
32. D. Uspenskaia, K. Specht, H. Kondziella and T. Bruckner, “Challenges and barriers for net-zero/positive energy buildings and districts—empirical evidence from the smart city project SPARCS,” Buildings, vol. 11, no. 2, pp. 78, 2021. [Google Scholar]
Cite This Article
 Copyright © 2023 The Author(s). Published by Tech Science Press.
This work is licensed under a Creative Commons Attribution 4.0 International License , which permits unrestricted use, distribution, and reproduction in any medium, provided the original work is properly cited.
 Downloads
 Citation Tools