
 Submit a Paper
 Propose a Special lssue
 Open Access
ARTICLE

Semantic Document Layout Analysis of Handwritten Manuscripts
Department of Computer Science, Faculty of Computing and Information Technology, King Abdulaziz University, Jeddah, 21589, Saudi Arabia
* Corresponding Author: Emad Sami Jaha. Email:
Computers, Materials & Continua 2023, 75(2), 2805-2831. https://doi.org/10.32604/cmc.2023.036169
Received 19 September 2022; Accepted 22 December 2022; Issue published 31 March 2023
 View Full Text
 Download PDF
Abstract
A document layout can be more informative than merely a document’s visual and structural appearance. Thus, document layout analysis (DLA) is considered a necessary prerequisite for advanced processing and detailed document image analysis to be further used in several applications and different objectives. This research extends the traditional approaches of DLA and introduces the concept of semantic document layout analysis (SDLA) by proposing a novel framework for semantic layout analysis and characterization of handwritten manuscripts. The proposed SDLA approach enables the derivation of implicit information and semantic characteristics, which can be effectively utilized in dozens of practical applications for various purposes, in a way bridging the semantic gap and providing more understandable high-level document image analysis and more invariant characterization via absolute and relative labeling. This approach is validated and evaluated on a large dataset of Arabic handwritten manuscripts comprising complex layouts. The experimental work shows promising results in terms of accurate and effective semantic characteristic-based clustering and retrieval of handwritten manuscripts. It also indicates the expected efficacy of using the capabilities of the proposed approach in automating and facilitating many functional, real-life tasks such as effort estimation and pricing of transcription or typing of such complex manuscripts.Keywords
Today despite the rapid growth of contemporary technologies in all life aspects, including the digital transformation of paper-based content, there is still a continuous necessity to process and analyze a renewed and endless number of scanned document images. Many of these available paper documents can be rare or very valuable and likely to be complex or even handwritten, like historical and ancient manuscripts [1]. For such paper documents, the mere scanning or conversion of them to their digital image format, despite their well-known advantages, is neither sufficiently efficient nor practically useful compared with further advantages and additional facilities of their fully electronic counterparts. Since those electronic ones may enable text-based search, data mining, information retrieval, and full access or processing of all content and physical entities, i.e., text, paragraphs, text lines, words, tables, charts, blocks, graphics, figures, and others. In order to enable these advantages, the information contained in paper document images must be converted into the corresponding machine-understandable form [2]. As such, document layout analysis (DLA) is used as a standard preprocessing and an essential prerequisite for developing any document image processing and analysis system. Thus, DLA has emerged as a priority topic and active research domain [3] and has increasingly become a significant interest in numerous research studies [4–9]. DLA algorithms can be carried out top-down or bottom-up with respect to their processing order [10]. Several research explorations were carried out on complex documents [2,11], whereas some others focused on more complex historical documents, which may implicate challenging handwritten manuscripts in different languages [12–14]. Moreover, DLA can be an even more challenging task when applied to historical handwritten documents with highly unconstrained structure and complex page layouts [15,16], as in ancient/historical Arabic manuscripts [17–19].
Most DLA approaches share the common primary goal of physical/structural layout analysis and the initial task of simply segmenting an input document image into textual and non-textual regions [20]. While a number of those approaches undertake a further task of classifying text/non-text regions based on positional role in the document into classes like title, paragraph, header, footer, or sidenote [21], and non-text classes can be a table, figure, chart, graphic, or separator [22]. For this classification, a diversity of preliminary and sophisticated techniques of image processing, computer vision, and machine learning was effectively devoted. Consequently, various research approaches were proposed using different combinations of such functional techniques comprising: anisotropic diffusion with geometric features for historical DLA [17]; local binary pattern (LBP) for text/non-text separation of handwritten documents [4]; contour classification methods and morphological operators for the complex layout of newspapers and magazines [11]; Harris corner detectors for gradient-based manuscript segmentation and reconstruction [19]; homogeneity algorithm and mathematical morphology for page element segmentation [22]; 2D Markovian approach with supplemental textual and spatial information for handwritten letters [6]; and support vector machine (SVM) for text and metadata extraction from Arabic documents [5]. Performing consecutive or cumulative connected component (CC) and pixel analyses on a document image was a typical dominant technique enforced to initially identify regions and then classify them, as adopted by the majority of proposed DLA systems [17,19,22]. Furthermore, advanced deep learning models were also used for empowering different DLA frameworks [7–9,23].
Many research studies have been conducted using DLA for document layout-based clustering, highlighting the importance and usefulness of clustering documents–depending on different common layout properties–in several practical applications [18,24–26]. For instance, to solve the problem of non-standard and densely populated documents, a clustering algorithm combined with simple refinement rules was used to cluster some layout constituents and improve document image segmentation [9]. Furthermore, clustering documents by their types (e.g., invoices, articles, letters) is a desirable solution for archiving massive collections of scanned documents. It can be offered by exploiting layout characteristics to assist in grouping similar documents [24]. Further detailed clustering of layout elements for constructing a cluster tree to model the layout hierarchy could also be influential on document layout understanding [25]. Nevertheless, it was found more challenging to analyze and cluster relying on a layout or its modules when document scripts are written in languages, like Arabic, with cursive writing and different styles [18].
Document retrieval is a critical capability and highly demanding task, which may often be associated with clustering as a prior stage in integrated document analysis systems. Therefore, document image retrieval (DIR) has been deemed as the primary research interest in multiple DLA-relevant studies [1,27,28]. A DIR on a layout similarity basis was proposed using regions’ extraction and tree-based representation with a combination of different clustering and indexing methods, aiming to retrieve the most similar pages from sizable digital library collections [26]. String edit distance was suggested as graph-based layout matching and document retrieval [29]. Unsegmented images were used to find layout sub-region matches for scalable ranked retrieval from a large document corpus [30]. In [31], text parsing and DLA were combined to develop a gadget tool for messaging apps, allowing users to link certain document parts, e.g., figures or tables, to be instantly retrieved and displayed across their chats.
Very little research has been concerned with inferable semantic-related aspects, which are contained in analyzed document files or images [32,33]. One likely reason is that semantic analyses largely depend on the document type, which makes it challenging to produce a generalized solution of logical/semantic layout analysis able to identify inter-region relationships and realize the semantic arrangement of these regions [21]. A unified DLA framework was proposed as a multimodal analyzer for enhanced document understanding. Such that it processes both text and image formats of an input portable document format (PDF) file of a machine-written document and fuses vision-based image features with natural language processing (NLP) based text semantics, besides the relations between layout components [32]. Another study proposed a multimodal neural model for the semantic segmentation of historical newspapers by combing visual and textual features [14]. For document triage, from the semantic point of view, structural information potential (SIP) was introduced as a measure of information based on the potentiality of structures to be informative about their content [33].
The latent semanticity power is yet to be essentially investigated or mainly employed in DLA and characterization and has been unlikely to be considered by earlier related research efforts. However, the analysis, derivation, and interpretation of image semantic information were proved to be effectively valuable and successful in supplementing traditional/physical features in other computer vision-based estimation and classification problems [34,35], as well as bridging the semantic gap as a crucial problem present in most automatic image annotation (AIA) tasks and content-based image retrieval (CBIR) systems [35–37]. Hence, this research is conducted as an initial study to investigate the validity and potency of proposed semantic document layout characteristics in enabling further semantic-based capabilities and achieving improved document processes, including clustering and retrieval based on layout similarities using different combinations of the proposed semantic characteristics.
In this research, the concept of semantic document layout analysis (SDLA) is introduced and distinguished from the traditional well-established, and widely used standard DLA. Such automatic semantic layout analysis and characterization capabilities of complex handwritten manuscripts can be effectively utilized in dozens of practical applications and different purposes, in a way bridging the semantic gap and providing human-friendly, more understandable document analysis and characterization. Although the resulting high-level semantic characteristics describe the document layout with absolute and relative labels in a less detailed and more overview manner than the traditional or physical low-level layout features. They can be more invariant and immune to potential minor errors or imperfect processes of detection and segmentation in the corresponding physical DLA. Unlike the majority of existing research explorations, this research effort is devoted to achieving an effective automated system for physically and semantically analyzing document layout of a considerable number of scanned documents of complex handwritten manuscripts in the Arabic language. The main contributions of this research can be summarized as follows:
• extending the traditional concept of document layout analysis (DLA) to the semantic domain and introducing the corresponding concept of semantic document layout analysis (SDLA);
• proposing a set of high-level semantic layout characteristics along with a descriptive group of absolute and relative labels for effectively characterizing a handwritten manuscript layout;
• designing a novel SDLA framework for semantic layout analysis and characterization of handwritten manuscripts, enabling automatic derivation of implicit semantic information using extended image processing, computer vision, and machine learning techniques in such a way as bridging the semantic gap; and
• conducting detailed investigation and validation of new semantic-based manuscript clustering and retrieval approaches incorporating different combinations of effective semantic characteristics and physical features.
The remainder of this paper comprises four sections. Section 2 introduces the proposed semantic layout characteristics and their descriptive absolute and relative labels. While Section 3 describes in detail the SDLA framework and methodology used in this research. Semantic-based manuscript clustering and retrieval are demonstrated in Section 4, and finally, conclusions and future work are provided in Section 5.
2 Semantic Layout Characteristics
Amongst many possible document layout characteristics, an initial set is adopted for this research study comprising those which appear to be fundamental, generic, and more suited for semantically characterizing a handwritten manuscript or document. As such, the set of characteristics is chosen and defined in a top-down manner, starting with semantically describing the overall aspects of the manuscript, then gradually describing the underlying non-textual/textual content and components. This set of characteristics is considered to be as much as possible structural, comprehensive, observable, conventional, and understandable. In this research, the proposed semantic layout characteristics differently describe the manuscript using absolute and relative groups of labels, where a single characteristic can be described using either or both types of labels. Table 1 shows the proposed list of semantic layout characteristics with their assigned absolute and relative labels. Note that fifteen characteristics are shown in bold as they are relatively describable with relative labels.

2.1 Semantic Absolute Labeling
A semantic layout characteristic can be described with a group of applicable absolute labels. The group of absolute labels can be defined as any conventional or nominal descriptions used to characterize that semantic characteristic. For example, the labels (‘Single-page,’ ‘Double-page’) can be used as absolute descriptions for the characteristic ‘Page layout.’ Note that the group of absolute labels can be in any order as they are consistently represented and used for labeling since they are merely nominal descriptions and not reflecting any measurements or ordering. Each absolute label is assigned an integer number ranging from 0 to 5 to be used as the corresponding numeric representation of that label.
2.2 Semantic Relative Labeling
A semantic layout characteristic can also be relative if it is measurable and can be described by its degree of presence/strength. Therefore, it can be described with a group of descriptive relative labels. The group of relative labels can be defined as any conventional or ordinal descriptions used to relatively characterize that semantic characteristic, such as the labels (‘None,’ ‘Narrow,’ ‘Moderate,’ ‘Wide’) can be used as relative descriptions for the characteristic ‘Margins’ of the manuscript. Note that the group of relative labels must be ascendingly or descendingly ordered since they are ordinal descriptions reflecting the degree of measurement or ordering. Each relative label is assigned an integer number ranging from 0 to 5, based on its order or scale in the label group, to be used as the corresponding numeric representation of that label.
The proposed research methodology based on a framework constitutes of a number of phases starting with using a raw manuscript document as an input to the preprocessing phase, followed by the main processing phase of semantic layout analysis and characterization, and ending with the phase of semantic modeling and nascent capabilities of semantic-based clustering and retrieval. The vital phase of the proposed framework is the semantic layout analysis and characterization phase, designated for semantic characteristic extraction and labeling. This phase comprises four modules: analyzing the page overall, analyzing non-textual objects, analyzing text layout, and analyzing text details. Fig. 1 presents an overview of the proposed framework for SDLA and the characterization of complex manuscripts.

Figure 1: SDLA framework for semantic layout analysis and characterization of handwritten manuscripts
3.1 Handwritten Manuscript Database
In this research, the proposed experimental work is conducted using a large complex document database consisting of 44968 scanned Arabic manuscripts in PDF format, while 27604 are mostly double-page landscape manuscripts resulting in over 70000 pages when added to the remaining portrait single-page manuscripts. All manuscripts were handwritten over around ten years by multiple cooperated authors and ended up with a single encyclopedia specialized in interpreting and studying the Holy Quran text on different levels, including word, verse (ayah), section, and chapter (surah). This raw database was originally divided per chapter (surah) into 114 groups. Each group included a set of related manuscripts, and each manuscript belonged to one of the four categories of study (i.e., word, verse, section, and chapter). Nevertheless, here the whole manuscript data is reorganized and divided into five datasets based on the four categories mentioned above and an additional fifth category comprising 44 manuscripts of the encyclopedia introduction. Table 2 shows a summary of the handwritten manuscript database and the implied five datasets of different categories, while Fig. 2 shows a data sample of each of these five manuscript categories.


Figure 2: A data sample of each of the five manuscript categories listed in Table 2, respectively
Each manuscript is initially passed through a preprocessing stage, starting with converting the PDF file to a joint photographic expert group (JPEG) image format for further required image processing and computer vision-based analysis. This conversion is automatically applied with the highest JPEG quality to an input PDF document using a programmer-friendly convert document to image (CDTI) tool by SoftInterface. The resulting manuscript image is normalized in such a way as to maintain the aspect ratio based on the initial image width

Figure 3: Different forms of a normalized manuscript image used for CC-/pixel-based analysis
3.3 Semantic Document Layout Analysis (SDLA) and Characterization
In this stage, basic and advanced image processing, computer vision, and machine learning techniques are devoted and effectively used not merely for traditional document layout analysis and segmentation but beyond that for bridging the semantic gap and achieving semantic-based layout analysis and characterization. This semantic analysis and characterization lead to generating a list of meaningful and conventional high-level descriptions to better understand and validate a document layout, especially in the case of atypical complex handwritten manuscripts. As such, for all four document aspects in Table 1, each semantic characteristic is analyzed and assigned the most suited label from the corresponding absolute/relative group of labels, using the proposed SDLA and characterization, as shown in Fig. 4.

Figure 4: SDLA report of semantic layout analysis, characterization, and physical feature extraction
Three semantic characteristics (C1, C2, and C3) related to the manuscript page’s overall appearance, namely page orientation, layout, and margins, are analyzed and semantically characterized by assigning appropriate absolute or relative labels. The page ‘Orientation’ (C1) is detected and assigned a suitable label by simply computing the ratio between the width
The ‘Page layout’ (C2) is recognized to infer the correct label by applying to the inverted binary manuscript image
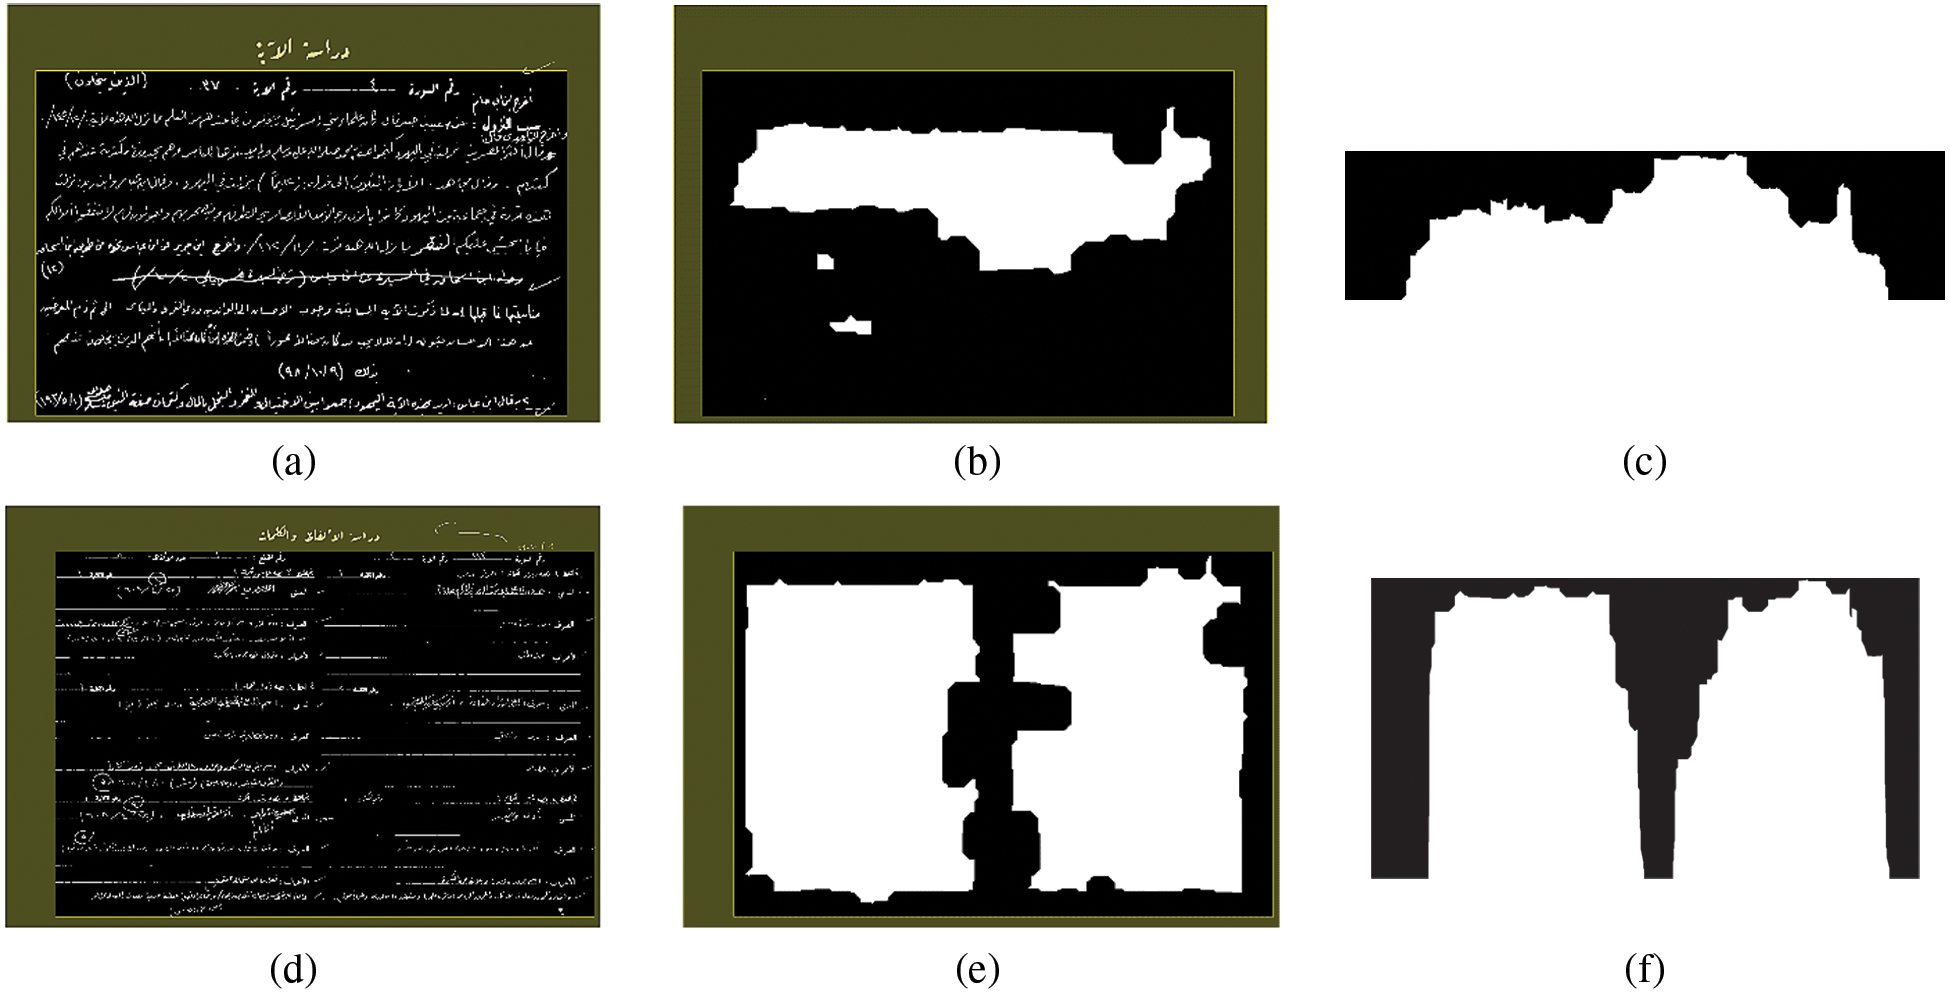
Figure 5: Analyzing the page’s overall semantic characteristics orientation (C1), layout (C2), and margins (C3). Processes (a–c) are for a single-page layout sample, and (d–f) for a double-page sample
The page ‘Margins’ (C3) are analyzed and characterized differently by corresponding absolute and relative labels. Thus, the area open operation is performed on the inverted binary image
where
where
3.3.2 Analyzing Non-Textual Objects
This semantic analyzer of non-textual objects is focused on characterizing objects other than texts within the manuscript content using absolute and relative descriptive labels. In particular, ‘Non-text’ (C4) objects like visual graphics or decorations, any existing ‘Scribble’ (C5) instances, and visible ‘Page lines’ (C6) captured during document scanning, as can be observed in Figs. 4a and 4d. The capability of detecting, localizing, and analyzing such objects is instrumental in simplifying manuscript complexity and enabling exclusion if needed to consequently achieve a high-quality layout analysis with accurate physical or semantic characterization.
The detection and labeling of likely ‘Non-text’ (C4) objects are applied to the inverted binary image
Before semantically labeling either non-text or scribble characteristics, each detected non-text or scribble object, as shown in magenta in Figs. 4a and 4d, is segmented. Then, it is examined using a scribble (detection) validation technique based on extracting a histogram of oriented gradient (HOG) features [35,40] along with a one-class SVM classifier [41,42]. Here the learning is achieved in a way using only positive examples [43,44], where scribble samples represent the positive examples, and the negative examples are all other non-text objects or original texts, which could be initially misdetected/misclassified as scribbles. It is perhaps due to their intersections/overlapping with visible page lines, as shown in Fig. 6.

Figure 6: Positive and negative scribble examples
Supposing X is the resulting HOG feature space and
Thus, the one-class SVM training algorithm is used for mapping the data vectors into the feature space H corresponding to the kernel, then separating the mapped data vectors from the origin with the maximum margin. Hence, to achieve this separation, the following quadratic minimization problem needs to be solved:
where
will be positive for most of the
Also, if any scribble object is invalidated as scribbles, it is excluded from the scribble mask group. Hence, only the remaining scribble objects are analyzed and semantically labeled using the same absolute and relative labeling methods used for non-text objects and described in Eq. (6). However, the relative labeling function
After excluding detected non-text and scribble objects from the manuscript, the ‘Page lines’ (C6) characteristic is analyzed using the inverted grayscale image
From a high-level perspective, eight semantic characteristics (C7 to C14) describing text layout, in general, are analyzed and labeled here, as shown in Fig. 4. For ‘Title’ (C7) detection, a title segment (if any) is localized within an expected title zone. The title zone is relatively deduced in manuscript image I on the top center of the image, excluding the top margin strip. The title zone is located right below the lower edge of the top margin
The same analysis and characterization approaches are used for both ‘Miscellaneous text’ (C8) and ‘Paragraph’ (C9). The process first starts with the inverted binary image
The ‘Text-lines’ (C10) characterization is achieved by processing and analyzing the inverted binary image
The analysis of the text lines (C10) is, in turn, exploited to characterize ‘Avg. line spacing’ (C11), since the identified upper and lower boundary pixels for each line segment
While the relative labeling function for spacing
Likewise, the analyses of (C9) and (C10), along with the labeling functions in Eqs. (7) and (8), are also utilized for achieving ‘Avg. paragraph spacing’ (C12), such that the upper and lower boundary pixels are identified for each paragraph segment p detected for (C9) using the same method used with the text-line segments. This is for inferring the length of the blank space between every two paragraphs, as the distance
Consequently, for both (C11) and (C12), a suitable absolute label of ‘Tight,’ ‘Single,’ ‘Double,’ or ‘Multiple’ is assigned based on a comparison of spacing when the function in Eq. (7) value equals (1, 2, 3, or 4), respectively, which corresponds to single, double, triple, or more than triple of the average text-line height. Furthermore, a relative label of ‘Narrow,’ ‘Moderate,’ or ‘Wide’ is assigned based on a comparison of spacing when the function in Eq. (8) value equals (1, 2, or 3), respectively, which corresponds to an average spacing less than or equal double, triple, or more than triple of the average text-line height
The manuscript’s paragraphs, detected for (C9), are further analyzed in terms of ‘Baseline quality’ (C13) and characterized using applicable absolute/relative labeling, where the baseline here is estimated and analyzed with respect to a whole text line only within a paragraph. The inverted binary image
In addition, a baseline estimation method inspired by [46] is used but per the whole text line rather than per word or sub-word. Hence, the original inverted binary image
As such, ‘None’ is stated as the absolute and relative labels when
For characterizing the overall text ‘Alignment’ (C14), all paragraph and text-line segments, derived previously for (C9) and (C10), are evaluated here to assign the most descriptive absolute and relative labels. It is noteworthy that the first and last lines of a paragraph may have a different appearance than the other in-between lines, and some exceptional cases need to be considered in analyzing and classifying the alignment style, such as first-line indention and incomplete last line, which can be expected in all standard alignment styles, i.e., left, right, center, or justified. Therefore, ‘None’ is assigned for both absolute and relative labeling once no paragraphs are detected, as for (C9). However, if ‘None’ is not the applicable absolute/relative label, the following algorithm is used for text alinement analysis and assignment of the other applicable labels.

Further characteristics (C15 to C20) representing some different text details are semantically analyzed (See Fig. 4) and only relatively described, each using an applicable label of (‘None,’ ‘Very low,’ ‘Low,’ ‘Medium,’ ‘High,’ and ‘Very high’) according to the comparison between a proportional value deduced by
where
The ‘Text intensity’ (C15) characteristic is deduced as
For analyzing and labeling the ‘Word density’ (C16) characteristic, the inverted binary image
Each paragraph segment, detected earlier for (C9 in Section 3.3.3), is segmented into text lines and words for further semantic analysis to characterize the ‘Avg. lines per paragraph’ (C17) and ‘Avg. words per paragraph’ (C18). The text-line segmentation is attained using the exact mechanism of the horizontal projection profile used with overall manuscript text lines (C10), but per paragraph segment instead. The exact word detection and localization technique used for (C16) is utilized here for word segmentation and counting within each paragraph segment as an area of interest instead of the overall manuscript.
For (C17) labeling, the average number of lines per paragraph is computed as
For (C18) labeling, the average number of words per paragraph is computed using
The text ‘Size consistency’ (19) in the case of handwriting, which is unlikely to be as high as in the case of machine-written documents, is explored and analyzed by utilizing all segmented text lines and words along with their inferred rectangular bounding boxes, as derived earlier for (C10 in Section 3.3.3, and C16). Since the width of words is naturally anticipated to vary highly from one to another based on shape, width, and the number of their composing letters, especially in such cursive Arabic scripts used in this research, the height of words is, therefore, supposed (and deemed as a desirable characteristic of good handwriting) to maintain some consistency and appears with a notable baseline and virtual upper and lower bounds conceptualizing the upper and lower limits of words within a text-line. Thus, the mean height
By using the labeling function in Eq. (11) with Eq. (12),
Finally, the overall manuscript is analyzed and characterized in terms of ‘Text complexity’ (C20) using the inverted grayscale image
where
where
Thus, the text complexity characteristic is attained using Eqs. (11) and (12) such that
4 Semantic-Based Clustering and Retrieval
4.1 Semantic Characteristic-Based Manuscript Clustering
It is a practical use of the proposed semantic layout characteristics to successfully attain a beneficial and meaningful manuscript clustering based on their semantic characteristic similarities. In such an unsupervised learning task and among a variety of functional techniques of clustering validity measurement [47], the Davies-Bouldin index (DBI) method is used to suggest an optimal number of clusters for partitioning the manuscript data into reasonable and separable groups. The DBI method is used along with k-means in such a way as to consider the advantages of both internal, besides external cluster evaluation schemes [48,49] to minimize intra-cluster and maximize inter-cluster distances, resulting in optimal k-number selection and better manuscript clustering. Thereby, after extensive and iterative evaluation of different k sizes ranging from 2 to 100, k = 24 continuously receives the smallest DBI and is, therefore, suggested as an optimal k number of clusters for better cluster configurations, as shown and compared with other 49 evaluated k values in Fig. 7. Thus, the optimal suggested 24-means are used for clustering all manuscripts in the database based on semantic layout characteristic similarities, as illustrated in Fig. 8.

Figure 7: Davies-Bouldin clustering validation of different k-means

Figure 8: k-means clustering of manuscript data
4.2 Semantic Characteristic-Based Manuscript Retrieval
The capability of manuscript retrieval based on semantic layout similarities is investigated, and the retrieval performance is evaluated and compared using different proposed combinations of semantic layout characteristics and physical features. Their performance is further explored and compared for their counterpart (physical features) derived by SDLA simultaneously to each semantic characteristic as vision-based metadata when used and added as supplemental features to the semantic characteristics. All gallery and query samples are analyzed and characterized via SDLA to obtain the required semantic characteristics and accompanying (metadata) physical features. Note that in the current experimental context, for a query manuscript image sample
For achieving retrieval performance evaluation, 454 manuscript image samples from all 114 groups (Surahs) in all five categories/datasets (i.e., Dataset-1 to Dataset-5) are randomly selected and excluded to be used as a query subset to probe a gallery comprising all remaining manuscripts using four different approaches for retrieval. These approaches incorporate the top-performing combinations of semantic characteristics and physical features, which are used to compose four types of feature vectors for gallery data and correspondingly for query data, as follows: SemAbs-14 consists of 14 absolute semantic characteristics; SemRel&PhysFtr-35 consists of 15 relative semantic characteristics in addition to 20 physical feature values corresponding to the 20 semantic characteristics; SemAll-29 combines all 29 semantic characteristics including both 14 absolute and 15 relative characteristics; SemAll&PhysFtr-49 is the combination of all 29 semantic absolute/relative characteristics and 20 physical features.
In this retrieval evaluation, suitable binary similarity (or relevance) metrics [32,50–52] are adopted and redefined to suit the current context and used based on the ground trough that classifies each query sample to one of the 24 determined k-means or clusters in the semantic characteristic space, such that a retrieved gallery sample is considered as a true positive (tp) sample only if it belongs to the actual cluster of the query sample. Otherwise, it is considered as a false positive ( fp) sample, and, therefore, all missed (positive) samples belonging to the actual cluster and supposed to be retrieved from the galley are considered false negative ( fn) samples. Min-max normalization is applied to both gallery and query samples using the minimum and maximum values of only gallery (training) data. As such, different retrieval evaluation metrics are inferred, including precision (P), recall (R), and F-measure (F), which can be expressed as follows:
In addition to three additional consequent mean-averaged metrics deduced as mean average precision (MAP), mean average recall (MAR), and mean average F-measure (MAF), which can be formulated as follows:
where Q is the total number of queries for retrieval evaluation, K denotes the current rank quantifying the number of top K retrieved items for a given query, and S is the number of retrieved manuscripts only with (relevant) similar layouts, which is used for averaging the sum of all
Table 3 reports the retrieval performance with respect to MAP, MAR, and MAF measurements deduced for the four proposed semantic approaches (SemAbs-14, SemRel&PhysFtr-35, SemAll-29, and SemAll&PhysFtr-49). SemAll&PhysFtr-49 receives the highest scores in all measurements, indicating the best possible retrieval capability attained by the total capacity of proposed semantic characteristics and supplemental physical features. The SemAll-29 approach gains the second-best performance with a smaller number of features comprising solely semantic characteristics, emphasizing their potency even when used alone for retrieval. The approach merely using all absolute characteristics, SemAbs-14, outperforms the approach of SemRel&PhysFtr-35, which uses all relative characteristics even when supplemented by physical features. Fig. 9 shows that all approaches start with high precision for retrieval ranging from 94% to 98%, where the best precision-recall performance is consistently demonstrated by SemAll&PhysFtr-49, followed by the other approaches in the same order of performance, in compliance with Table 3.


Figure 9: Precision vs. recall measures of semantic retrieval performance
4.3 Top-k Retrieval Using Semantic Layout Characteristics
Top-k retrieval is a highly potential practical application where proposed SDLA may be conducted, and resulting semantic layout characteristics can be enforced for different classification, match, search, and retrieval purposes. Thus, as a proof of concept, the four proposed semantic approaches, along with the same query subset described in Section 4.2, are used here for conducting several experiments to retrieve top-k similar manuscripts where k is set to 10, 20, 40, 60, 80, and 100 consecutively throughout experiments, where retrieval is achieved based on semantic characteristic-based layout similarities. Hence, for a query manuscript image sample
Table 4 and Fig. 10 summarize and illustrate the variation and comparison of retrieval performance in terms of F-measure inferred with different top-k retrievals. Furthermore, the average MAF value of all scores of MAF per top-k is computed for each approach to conclude overall performance/rank. As can be observed in Table 4, the retrieval performance may vary by changing the number of retrieved top-k manuscripts. For instance, although SemAll-29 achieves higher overall rank and performance than SemAbs-14 with respect to average MAF and MAF scores of top-k from 10 to 60, the performance of SemAbs-14 exceeds the performance of SemAll-29 in MAF scores of top-k from 80 to 100. This can also be remarked in Fig. 10, where the SemAbs-14 curve overcomes the curve and performance of SemAll-29 at some point between 60 and 80 up to 100.


Figure 10: Mean average F-measure (MAF) of semantic retrieval performance along top-k increase
Semantic document layout characteristics can be utilized as highly effective descriptions and ancillary information for analyzing and characterizing a complex structured handwritten document or manuscript. Such high-level semantic characteristics can offer additional advantages over the standard low-level layout features inferred by traditional DLA approaches and provide (human-friendly) more understandable and less confusable document analysis, besides more invariant labeling and characterization for successful layout similarity-based clustering and retrieval. In this research study, with a view to bridging the semantic gap, the extended SDLA approach is proposed and conducted, and the capabilities of the nascent semantic characteristics are investigated and evaluated. Even in case of imperfect detections or segmentations using physical layout analysis, the proposed semantic-based layout analysis and characterization can still assign accurate semantic layout characteristics, as they are observed to be more invariant and immune to potential minor errors or imperfect processes in the corresponding physical DLA.
The observed retrieval performance comparisons emphasize that the proposed semantic characteristics have different latent capabilities from the physical features. Nevertheless, they are found to be viable for high-performance retrieval when used alone, and they can offer additional potency for even higher performance when combined interacting with their counterpart physical features. Furthermore, the overall high-performance results of semantic characteristic-based clustering and retrieval on a large dataset of Arabic handwritten manuscripts with complex layouts suggest that the capability of semantically analyzing a document layout may pave the way for a variety of potential applications and future explorations.
This research work as an initial investigation was conducted using a single largescale dataset, which was limited to comprising only Arabic handwritten manuscripts. Thus, among several likely future research investigations, the proposed SDLA can be applied to different handwritten manuscript/document datasets in different languages, allowing for further performance comparison and generalization investigation. Moreover, the observed efficacy of the proposed SDLA approach and the capabilities of the proposed semantic layout characteristics can be exploited for automating many practical, real-life tasks, such as effort estimation and pricing of transcription or typing of complex handwritten manuscripts. Additionally, deep learning techniques may be adopted and used to learn a semantic characteristic-centric of document layouts.
Acknowledgement: The author would like to thank King Abdulaziz University Scientific Endowment for funding the research reported in this paper. The author would also like to thank Mr. Adel Turkistani, the editor-in-chief of the non-publicly available data source of the (preprint) Interpretation Encyclopedia of the Holy Quran, for providing the valuable large dataset of scanned manuscripts, which was used for conducting the experimental work of this research.
Funding Statement: This research was supported and funded by KAU Scientific Endowment, King Abdulaziz University, Jeddah, Saudi Arabia.
Conflicts of Interest: The authors declare that they have no conflicts of interest to report regarding the present study.
References
1. G. M. Binmakhashen and S. A. Mahmoud, “Document layout analysis: A comprehensive survey,” ACM Computing Surveys (CSUR), vol. 52, no. 6, pp. 1–36, 2019. [Google Scholar]
2. S. Bhowmik, S. Kundu and R. Sarkar, “BINYAS: A complex document layout analysis system,” Multimedia Tools and Applications, vol. 80, no. 6, pp. 1–34, 2020. [Google Scholar]
3. S. Mao, A. Rosenfeld and T. Kanungo, “Document structure analysis algorithms: A literature survey,” in Document Recognition and Retrieval X, Santa Clara, California, USA: SPIE, pp. 197–207, 2003. [Google Scholar]
4. S. Ghosh, D. Lahiri, S. Bhowmik, E. Kavallieratou and R. Sarkar, “Text/non-text separation from handwritten document images using LBP based features: An empirical study,” Journal of Imaging, vol. 4, no. 4, pp. 57, 2018. [Google Scholar]
5. W. Qin, R. Elanwar and M. Betke, “Text and metadata extraction from scanned Arabic documents using support vector machines,” Journal of Information Science, vol. 48, no. 2, pp. 268–279, 2022. [Google Scholar]
6. M. Lemaître, E. Grosicki, E. Geoffrois and F. Prêteux, “Layout analysis of handwritten letters based on textural and spatial information and a 2D markovian approach,” in Int. Conf. on Frontiers in Handwriting Recognition (ICFHR), Québec, Canada, vol. 182, 2008. [Google Scholar]
7. H. T. Tran, N. Q. Nguyen, T. A. Tran, X. T. Mai and Q. T. Nguyen, “A deep learning-based system for document layout analysis,” in 2022 The 6th Int. Conf. on Machine Learning and Soft Computing, Haikou, China, pp. 20–25, 2022. [Google Scholar]
8. F. Grijalva, E. Santos, B. Acuña, J. C. Rodríguez and J. C. Larco, “Deep learning in time-frequency domain for document layout analysis,” IEEE Access, vol. 9, pp. 151254–151265, 2021. [Google Scholar]
9. R. Agombar, M. Luebbering and R. Sifa, “A clustering backed deep learning approach for document layout analysis,” in Int. Cross-Domain Conf. for Machine Learning and Knowledge Extraction, Dublin, Ireland, pp. 423–430, 2020. [Google Scholar]
10. A. M. Namboodiri and A. K. Jain, “Document structure and layout analysis,” in Digital Document Processing, London: Springer, pp. 29–48, 2007. [Google Scholar]
11. N. Vasilopoulos and E. Kavallieratou, “Complex layout analysis based on contour classification and morphological operations,” Engineering Applications of Artificial Intelligence, vol. 65, pp. 220–229, 2017. [Google Scholar]
12. S. Ravichandra, S. Siva Sathya and S. Lourdu Marie Sophie, “Deep learning based document layout analysis on historical documents,” in Advances in Distributed Computing and Machine Learning, Singapore: Springer, pp. 271–281, 2022. [Google Scholar]
13. V. Alabau, C. -D. Martínez-Hinarejos, V. Romero and A. -L. Lagarda, “An iterative multimodal framework for the transcription of handwritten historical documents,” Pattern Recognition Letters, vol. 35, pp. 195–203, 2014. [Google Scholar]
14. R. Barman, M. Ehrmann, S. Clematide, S. A. Oliveira and F. Kaplan, “Combining visual and textual features for semantic segmentation of historical newspapers,” Journal of Data Mining & Digital Humanities, vol. HistoInformatics, pp. 1–26, 2021.Based on the journal link: https://jdmdh.episciences.org/7097 [Google Scholar]
15. O. Kodym and M. Hradiš, “Page layout analysis system for unconstrained historic documents,” in 16th Int. Conf. on Document Analysis and Recognition, Lausanne, Switzerland, pp. 492–506, 2021. [Google Scholar]
16. E. Granell, L. Quirós, V. Romero and J. A. Sánchez, “Reducing the human effort in text line segmentation for historical documents,” in Int. Conf. on Document Analysis and Recognition, Lausanne, Switzerland, pp. 523–537, 2021. [Google Scholar]
17. G. M. BinMakhashen and S. A. Mahmoud, “Historical document layout analysis using anisotropic diffusion and geometric features,” International Journal on Digital Libraries, vol. 21, no. 3, pp. 1–14, 2020. [Google Scholar]
18. A. M. Hesham, M. A. Rashwan, H. M. Al-Barhamtoshy, S. M. Abdou, A. A. Badr et al., “Arabic document layout analysis,” Pattern Analysis and Applications, vol. 20, no. 4, pp. 1275–1287, 2017. [Google Scholar]
19. A. Baig, S. A. Al-Ma’adeed, A. Bouridane and M. Cheriet, “Automatic segmentation and reconstruction of historical manuscripts in gradient domain,” IET Image Processing, vol. 12, no. 4, pp. 502–512, 2017. [Google Scholar]
20. V. P. Le, N. Nayef, M. Visani, J. -M. Ogier and C. De Tran, “Text and non-text segmentation based on connected component features,” in 2015 13th Int. Conf. on Document Analysis and Recognition (ICDAR), Tunis, Tunisia, pp. 1096–1100, 2015. [Google Scholar]
21. S. Bhowmik and R. Sarkar, “Classification of text regions in a document image by analyzing the properties of connected components,” in 2020 IEEE Applied Signal Processing Conf. (ASPCON), Kolkata, India, pp. 36–40, 2020. [Google Scholar]
22. T. A. Tran, I. S. Na and S. H. Kim, “Page segmentation using minimum homogeneity algorithm and adaptive mathematical morphology,” International Journal on Document Analysis and Recognition (IJDAR), vol. 19, no. 3, pp. 191–209, 2016. [Google Scholar]
23. B. Liebl and M. Burghardt, “An evaluation of DNN architectures for page segmentation of historical newspapers,” in 2020 25th Int. Conf. on Pattern Recognition (ICPR), Virutal-Milano, Italy, pp. 5153–5160, 2021. [Google Scholar]
24. C. Finegan-Dollak and A. Verma, “Layout-aware text representations harm clustering documents by type,” in Proc. of the First Workshop on Insights from Negative Results in NLP, Online, pp. 60–65, 2020. [Google Scholar]
25. C. -A. Boiangiu, D. -C. Cananau, B. Raducanu and I. Bucur, “A hierarchical clustering method aimed at document layout understanding and analysis,” International Journal of Mathematical Models and Methods in Applied Sciences, vol. 2, no. 1, pp. 413–422, 2008. [Google Scholar]
26. S. Marinai, E. Marino and G. Soda, “Tree clustering for layout-based document image retrieval,” in Second Int. Conf. on Document Image Analysis for Libraries, Lyon, France, pp. 245–253, 2006. [Google Scholar]
27. U. D. Dixit and M. Shirdhonkar, “A survey on document image analysis and retrieval system,” International Journal on Cybernetics & Informatics (IJCI), vol. 4, no. 2, pp. 259–270, 2015. [Google Scholar]
28. U. D. Dixit and M. Shirdhonkar, “Document image retrieval: Issues and future directions,” in 2021 Int. Conf. on Computational Intelligence and Computing Applications (ICCICA), Nagpur, India, pp. 1–4, 2021. [Google Scholar]
29. D. Sharma, G. Harit and C. Chattopadhyay, “Attributed paths for layout-based document retrieval,” in Workshop on Document Analysis and Recognition, Hyderabad, India, pp. 15–26, 2018. [Google Scholar]
30. R. Jain, D. W. Oard and D. Doermann, “Scalable ranked retrieval using document images,” in Document Recognition and Retrieval XXI, Singapore, San Francisco, CA, USA: SPIE, vol. 9021, pp. 179–193, 2014. [Google Scholar]
31. L. Denoue, S. Carter, J. Marlow and M. Cooper, “DocHandles: Linking document fragments in messaging apps,” in Proc. of the 2017 ACM Symp. on Document Engineering, Valletta, Malta, pp. 81–84, 2017. [Google Scholar]
32. P. Zhang, C. Li, L. Qiao, Z. Cheng, S. Pu et al., “VSR: A unified framework for document layout analysis combining vision, semantics and relations,” in Int. Conf. on Document Analysis and Recognition, Lausanne, Switzerland, pp. 115–130, 2021. [Google Scholar]
33. V. Atanasiu, “The structural information potential and its application to document triage,” IEEE Access, vol. 10, pp. 13103–13138, 2021. [Google Scholar]
34. R. S. Howyan and E. S. Jaha, “Semantic human face analysis for multi-level age estimation,” Intelligent Automation and Soft Computing, vol. 31, no. 1, pp. 555–580, 2022. [Google Scholar]
35. H. Kwaśnicka and L. C. Jain (Eds.“Bridging the semantic gap in image and video analysis,” in Image and Video Analysis, vol. 145, Berlin: Springer, 2018. [Google Scholar]
36. W. Hu, Y. Sheng and X. Zhu, “A semantic image retrieval method based on interest selection,” Wireless Communications and Mobile Computing, vol. 2022, pp. 1–6, 2022. [Google Scholar]
37. S. Lai, Q. Yang, W. He, Y. Zhu and J. Wang, “Image retrieval method combining bayes and SVM classifier based on relevance feedback with application to small-scale datasets,” Tehnički Vjesnik, vol. 29, no. 4, pp. 1236–1246, 2022. [Google Scholar]
38. R. Youssef, H. Bouhadoun, J. D. Laredo and C. Chappard, “Semi-automatic compartment extraction to assess 3D bone mineral density and morphometric parameters of the subchondral bone in the tibial knee,” in 2015 19th Int. Conf. on Information Visualisation, Barcelona, Spain, pp. 518–523, 2015. [Google Scholar]
39. J. Fabrizio, “A precise skew estimation algorithm for document images using KNN clustering and Fourier transform,” in 2014 IEEE Int. Conf. on Image Processing, Paris, France, pp. 2585–2588, 2014. [Google Scholar]
40. T. Malisiewicz, A. Gupta and A. A. Efros, “Ensemble of exemplar-svms for object detection and beyond,” in 2011 Int. Conf. on Computer Vision, Barcelona, Spain, pp. 89–96, 2011. [Google Scholar]
41. R. Kabir, Y. Watanobe, M. R. Islam, K. Naruse and M. M. Rahman, “Unknown object detection using a one-class support vector machine for a cloud–robot system,” Sensors, vol. 22, no. 4, pp. 1352, 2022. [Google Scholar] [PubMed]
42. S. Amraee, A. Vafaei, K. Jamshidi and P. Adibi, “Abnormal event detection in crowded scenes using one-class SVM,” Signal, Image and Video Processing, vol. 12, no. 6, pp. 1115–1123, 2018. [Google Scholar]
43. G. P. C. Fung, J. X. Yu, H. Lu and P. S. Yu, “Text classification without negative examples revisit,” IEEE Transactions on Knowledge and Data Engineering, vol. 18, no. 1, pp. 6–20, 2005. [Google Scholar]
44. Y. Wang, J. Wong and A. Miner, “Anomaly intrusion detection using one class SVM,” in Proc. from the Fifth Annual IEEE SMC Information Assurance Workshop, West Point, NY, USA, pp. 358–364, 2004. [Google Scholar]
45. É. Puybareau and T. Géraud, “Real-time document detection in smartphone videos,” in 2018 25th IEEE Int. Conf. on Image Processing (ICIP), Athens, Greece, pp. 1498–1502, 2018. [Google Scholar]
46. A. Lawgali, A. Bouridane, M. Angelova and Z. Ghassemlooy, “Automatic segmentation for Arabic characters in handwriting documents,” in 18th IEEE Int. Conf. on Image Processing, Athens, Greece, pp. 3529–3532, 2011. [Google Scholar]
47. C. Legány, S. Juhász and A. Babos, “Cluster validity measurement techniques,” in Proc. of the 5th WSEAS Int. Conf. on Artificial Intelligence, Knowledge Engineering and Databases, Madrid, Spain, pp. 388–393, 2006. [Google Scholar]
48. A. K. Singh, S. Mittal, P. Malhotra and Y. V. Srivastava, “Clustering evaluation by Davies-Bouldin index (DBI) in cereal data using k-means,” in 2020 Fourth Int. Conf. on Computing Methodologies and Communication (ICCMC), Erode, India, pp. 306–310, 2020. [Google Scholar]
49. M. Mughnyanti, S. Efendi and M. Zarlis, “Analysis of determining centroid clustering x-means algorithm with davies-bouldin index evaluation,” in IOP Conf. Series: Materials Science and Engineering, Ulaanbaatar, Mongolia, pp. 1–6, 2020. [Google Scholar]
50. I. Mehmood, A. Ullah, K. Muhammad, D. -J. Deng, W. Meng et al., “Efficient image recognition and retrieval on IoT-assisted energy-constrained platforms from big data repositories,” IEEE Internet of Things Journal, vol. 6, no. 6, pp. 9246–9255, 2019. [Google Scholar]
51. M. Sajjad, A. Ullah, J. Ahmad, N. Abbas, S. Rho et al., “Integrating salient colors with rotational invariant texture features for image representation in retrieval systems,” Multimedia Tools and Applications, vol. 77, no. 4, pp. 4769–4789, 2018. [Google Scholar]
52. D. O’Sullivan, E. McLoughlin, M. Bertolotto and D. Wilson, “Context-oriented image retrieval,” in Int. and Interdisciplinary Conf. on Modeling and Using Context, Paris, France, pp. 339–352, 2005. [Google Scholar]
Cite This Article
 Copyright © 2023 The Author(s). Published by Tech Science Press.
This work is licensed under a Creative Commons Attribution 4.0 International License , which permits unrestricted use, distribution, and reproduction in any medium, provided the original work is properly cited.
 Downloads
 Citation Tools