
 Submit a Paper
 Propose a Special lssue
 Open Access
ARTICLE

A New Model for Network Security Situation Assessment of the Industrial Internet
1 College of Computer Science and Information Engineering, Harbin Normal University, Harbin, 150025, China
2 School of Information Technology, Luoyang Normal University, Luoyang, 471934, China
3 Shanghai Key Laboratory of Integrated Administration Technologies for Information Security, Shanghai, 200240, China
* Corresponding Author: Shiming Li. Email:
Computers, Materials & Continua 2023, 75(2), 2527-2555. https://doi.org/10.32604/cmc.2023.036427
Received 29 September 2022; Accepted 29 December 2022; Issue published 31 March 2023
 View Full Text
 Download PDF
Abstract
To address the problem of network security situation assessment in the Industrial Internet, this paper adopts the evidential reasoning (ER)algorithm and belief rule base (BRB) method to establish an assessment model. First, this paper analyzes the influencing factors of the Industrial Internet and selects evaluation indicators that contain not only quantitative data but also qualitative knowledge. Second, the evaluation indicators are fused with expert knowledge and the ER algorithm. According to the fusion results, a network security situation assessment model of the Industrial Internet based on the ER and BRB method is established, and the projection covariance matrix adaptive evolution strategy (P-CMA-ES) is used to optimize the model parameters. This method can not only utilize semiquantitative information effectively but also use more uncertain information and prevent the problem of combinatorial explosion. Moreover, it solves the problem of the uncertainty of expert knowledge and overcomes the problem of low modeling accuracy caused by insufficient data. Finally, a network security situation assessment case of the Industrial Internet is analyzed to verify the effectiveness and superiority of the method. The research results show that this method has strong applicability to the network security situation assessment of complex Industrial Internet systems. It can accurately reflect the actual network security situation of Industrial Internet systems and provide safe and reliable suggestions for network administrators to take timely countermeasures, thereby improving the risk monitoring and emergency response capabilities of the Industrial Internet.Keywords
The Industrial Internet integrates various technologies, such as the internet, industrial networks, the Industrial Internet of Things [1], and enterprise resource planning (ERP) systems, to improve intelligent manufacturing technology. Its applications are not limited to key fields such as electricity, natural gas, transportation, smart manufacturing, aerospace, and nuclear power plants [2,3]. Due to the openness of the internet, the Industrial Internet faces various security threats; in some important industrial application environments, attacks on the network may be fatal.
Since the Industrial Internet involves industrial control systems, which are the core part of industrial production, security is an important indicator for evaluating the normal operation of industrial control systems. When a security problem arises, the consequences can be disastrous. As the Industrial Internet is an emerging technology, its security situation assessment technology still needs to be developed. In most cases, network administrators find security vulnerabilities or attack behaviors in the network after the Industrial Internet infrastructure suffers significant losses. Many typical Industrial Internet security incidents have occurred [4]. For example, in 2010, an Iranian nuclear power plant was attacked by hackers using the Stuxnet virus, causing more than 1,000 centrifuges to be paralyzed and causing major damage to the entire nuclear power plant. In 2019, an American electric power company was attacked by remote attackers through vulnerabilities in firewall firmware, causing the equipment to restart continuously and interrupt network communication. In 2021, the largest American oil pipeline company suffered a ransomware attack that forced it to shut down its pipeline system. Thus, the security of the Industrial Internet is an important guarantee for safe and reliable operation, and it is also a key issue that urgently needs to be solved.
Network security situation assessment is an important approach to measuring network security. The assessment results can reflect the health of network security and provide safe, reliable and efficient suggestions for network administrators to take effective countermeasures in a timely manner [5].
Similarly, network security situation assessment of the Industrial Internet is important. Because the Industrial Internet is characterized by a complex structure, large data heterogeneity, and poor protocol compatibility, it must meet the requirements of high-complexity calculation, high robustness and security [6]. This makes it difficult to establish a comprehensive network security situation assessment model for the Industrial Internet. The industrial production environment and industry sensitivity make it difficult to collect industrial data [7,8]. In addition, the requirements for data security are high, and the proportion of core sensitive data is small; thus, many factors must be considered when establishing a model with high evaluation accuracy. Additionally, most factors have some level of uncertainty (including probabilistic uncertainty and fuzzy uncertainty) [9–11]. Furthermore, the established model should be able to effectively and accurately assess the network security situation of the Industrial Internet, thereby improving the risk monitoring and emergency response capabilities of the Industrial Internet.
Currently, the main methods for network security situation assessment in the Industrial Internet can be divided into the following three categories: methods based on qualitative knowledge, methods based on quantitative data and methods based on semiquantitative information [12]. Detaileddescriptions of these approaches are as follows:
(1) Assessment methods based on qualitative knowledge comprehensively consider various factors that affect the network security of the Industrial Internet, and experts must determine the weight of each factor according to practical experience and use appropriate algorithms to calculate the network security situation values. Some example methods include the analytic hierarchy process [13], cluster analysis [14], fuzzy logic [15], and expert systems [16]. Due to the complexity of the Industrial Internet and the unpredictability of network attacks, methods based solely on qualitative knowledge are often insufficient to establish an accurate evaluation model. In addition, this approach is based on subjective factors: if expert knowledge is inaccurate, the results of the assessment are often subject to large errors. Furthermore, such methods cannot effectively utilize various types of uncertain information.
(2) Assessment methods based on quantitative data use artificial intelligence algorithms to establish mathematical models and then train the assessment model on a large amount of data to obtain the network security situation values [17]. Some example methods are the radial basis function neural network (RBFNN) [18], random forest (RF) [19], network attack behavior classification [20], the backpropagation neural network (BPNN) [21], the wavelet neural network [22], deep autoencoders and deep neural networks [23]. However, these approaches lack an effective explanation of the model mechanism, and they are difficult to apply to the network security situation assessment of large and complex Industrial Internet systems. Moreover, Industrial Internet network security situation assessment data cannot be directly observed. When the number of data samples is insufficient, assessment methods based on quantitative data cannot effectively learn data information when training the model, resulting in reduced evaluation accuracy.
(3) Assessment methods based on semiquantitative information first set the initial parameters of the model according to expert experience and then use quantitative data to train the model to obtain the network security situation values. Some example methods include dynamic Bayesian networks [24], hidden Markov models [25], D-S and BP neural networks [26], D-S and radial basis perceptron (RBP) neural networks [27], long short-term memory networks and decision tree algorithms [28]. Such methods consider both qualitative knowledge and quantitative data and utilize expert knowledge for modeling in the early stage to ensure that the model can accurately evaluate the security situation of the complex Industrial Internet network system when few data samples are available. However, expert knowledge may be affected by factors in the environment and the limitations of experts themselves, making expert knowledge uncertain, thereby affecting the accuracy of the evaluation results. In addition, many kinds of uncertain information exist in the large and complex network system of the Industrial Internet, which is random and fuzzy. However, existing methods based on semiquantitative information can handle only a single type of uncertain information.
In summary, neither the first nor second methods can effectively utilize qualitative knowledge and quantitative data simultaneously. Although the third method can effectively utilize semiquantitative information, it can handle only a single type of uncertain information and does not take into account the uncertainty of expert knowledge. Therefore, to solve the above problems, Wang et al. proposed the ER algorithm [29] and BRB method [30]. ER is a multicriteria decision analysis method that can effectively utilize semiquantitative information, fuse multiattribute information [31] and prevent the combinatorial explosion problem of the BRB model. BRB is a complex system modeling method based on If-Then rules that uses ER as a reasoning tool, which enables it to describe more types of uncertain information [32]. Moreover, it can comprehensively utilize qualitative knowledge and quantitative data. Zhou et al. extended the BRB model on the basis of existing theory and further proposed using semiquantitative information to predict the hidden behavior of complex systems, established a new prediction model based on BRB and used the CMA-ES algorithm to optimize the model [33]. Hu et al. applied the BRB method to the field of network security situational awareness [34], proposed a BRB-based combined classification model for network security factor classification, proposed a BRB-based network security situation quantification method for network security situation assessment, applied the hidden behavior prediction model based on CHBRB to network security situation prediction [17,35], and applied the PHBRB hidden behavior prediction model under the power set identification framework to the security situation prediction of special network systems [36]. This approach fully excavates the hidden information behind massive network data, provides new network defense tools for managers, and meets the security protection requirements of large and complex networks. He et al. proposed a fault assessment and prediction model for a wireless sensor network (WSN) based on ER and BRB [37], used the ER algorithm to fully evaluate the fault state of the WSN and then used the BRB method to accurately predict the fault state of the WSN. The model makes better use of semiquantitative information and solves the influence of uncertain information on modeling.
Therefore, based on the above description, this paper adopts the ER algorithm and BRB method to establish an Industrial Internet network security situation assessment model and then uses theP-CMA-ES algorithm [36] to optimize the model, which solves difficult modeling problem caused by the complexity of the Industrial Internet system. The ER iterative algorithm can effectively utilize semiquantitative information in the Industrial Internet system to establish a model and integrate more uncertain information to prevent the combinatorial explosion problem of the BRB model. The BRB uses ER rules as a reasoning tool to make the reasoning process visible and the reasoning results explicable and traceable, and it can overcome the problem of the poor modeling accuracy of complex Industrial Internet systems, which is caused by insufficient data due to the difficulty of data collection in the Industrial Internet. The P-CMA-ES optimization algorithm can address the problem of the uncertainty of expert knowledge to improve the accuracy of the assessment model. Accurate assessment results can provide network administrators with reliable suggestions so countermeasures can be taken in a timely manner, thereby improving the risk monitoring and emergency response capabilities of the Industrial Internet.
The organizational structure of this paper is as follows. In Section 2, the problem formulation of the Industrial Internet network security situation is described. In Section 3, an Industrial Internet network security situation assessment model is constructed based on ER and BRB. In Section 4, a case study is designed to verify the validity of the Industrial Internet network security situation assessment model. Finally, Section 5 concludes this paper.
The question of network security situation assessment in the Industrial Internet includes evaluation indicator fusion and security situation assessment.
(1) Evaluation indexes are determined by analyzing the influencing factors of the Industrial Internet network security situation, and the ER iterative algorithm is selected to fuse the evaluation indexes. Evaluation indicators are characterized by large numbers, many types and high uncertainty. The ER iterative algorithm can solve the fusion problem of multiple uncertain indexes.
(2) By analyzing the fusion results of the evaluation indicators, the BRB method is used to establish an Industrial Internet network security situation assessment model based on the fusion results. The model can effectively improve the accuracy of the Industrial Internet network security situation assessment.
All parameters are listed in Table 1.

2.2 Fuse Evaluation Indicators
To conveniently describe the integration problem of the assessment indicators, a four-level assessment indicator is defined for the network security situation of the Industrial Internet, and the sets of the four-level assessment indicators are defined as Dxyz, Cxy, Bx, and A.
Step 1 The evaluation indicator set is defined as follows:
where Dxyz denotes the 4th level evaluation indicator set, Cxy denotes the 3rd level evaluation indicator set, Bx denotes the 2nd level evaluation indicator set, and A denotes the 1st level evaluation indicator set. dxykz denotes all evaluation indicators of the 4th level, cxyk denotes all evaluation indicators of the 3rd level, bxy denotes all evaluation indicators of the 2nd level, and ax denotes all evaluation indicators of the 1st level. x denotes the xth evaluation indicator of the 1st level, y denotes the yth evaluation indicator of the 2nd level, z denotes the zth evaluation indicator of the 3rd level, and k denotes the kth evaluation indicator of the 4th level.
Step 2 The fusion process of evaluation indicators at all levels is expressed as follows:
where ER(•) denotes the nonlinear transformation process based on the evaluation indicator fusion of the ER iterative algorithm. a, β, and γ represent the set of ER parameters. cxyk denotes the 3rd level evaluation indicators obtained by fusing all evaluation indicators in set Dxyz, bxy denotes the 2nd level evaluation indicators obtained by fusing all evaluation indicators in set Cxy, and ax denotes the 1st level evaluation indicators obtained by fusing all evaluation indicators in set Bx.
2.3 Security Situation Evaluation
To describe the problem of Industrial Internet network security situation assessment, the assessment result is represented by y, and the process is described as follows:
where BRB(•) denotes the nonlinear transformation process based on BRB. η denotes the set of BRB parameters.
In summary, this paper defines the problem of the Industrial Internet network security situation assessment as the problem of solving ER(•), BRB(•) and parameters a, β, γ, η.
3 Network Security Situation Assessment of an Industrial Internet Model Based on ER and BRB
The assessment process of the Industrial Internet network security situation is shown in Fig. 1. The evaluation process is divided into three steps:
Step 1 According to the influencing factors of the Industrial Internet network security situation, the appropriate evaluation indicators are selected; decision-makers determine the weight of each evaluation indicator and establish a four-level evaluation indicator structural framework for the network security situation assessment of the Industrial Internet according to expert knowledge and practical investigation. Then, the decision-makers analyze the evaluation grade of each indicator and determine its reference value corresponding to the evaluation grade.
Step 2 The ER-based Industrial Internet network security situation assessment model isestablished, and the qualitative and quantitative indicators are gradually fused with uncertainty layer by layer through the ER iterative algorithm. Then, the fusion results of the evaluation indicators are calculated.
Step 3 The BRB-based Industrial Internet network security situation assessment model isestablished. The ER fusion results are taken as inputs, and the ER analytic algorithm is used to calculate the assessment results. The P-CMA-ES algorithm is then used to optimize the constructed BRB assessment model to improve its evaluation accuracy.

Figure 1: The assessment process of the Industrial Internet network security situation
3.2 Assessment Indicators and Grades
Due to the complexity of the Industrial Internet system, as well as the difficulty of data collection, this paper considers only external attacks on the Industrial Internet [38]. Based on the factors influencing the network security situation of the Industrial Internet, an assessment indicator structure was established, taking into account the actual situation of the Industrial Internet system and the data information collected, as shown in Fig. 2.

Figure 2: The assessment indicator structure for the network security situation of the Industrial Internet
The assessment indicator structure is divided into two parts: software security and hardwaresecurity. The evaluation indicators for software security include the communication protocol, operating system and application program; the evaluation indicators for hardware security include those for the monitor, router, and server. These hardware and software devices are mainly attacked by denial of service (DoS), distributed denial of service (DDoS), ransomware, scanning, backdoor, injection, cross-site scripting (XXS) and password attacks. The type of attack varies for different hardware and software devices. Among the above eight attack types, only 4–5 of the attack types will impact a software or hardware device. For each type of attack, the considered indicators include the frequency of the attack and its severity. The attack frequency is quantitative data calculated according to the number of attacks in the collected dataset. The severity of an attack is qualitative knowledge determined by experts according to their own experience and actual investigation.
After the Industrial Internet network security situation assessment indicator structure is constructed, decision-makers assign different weights (ω) to the assessment indicators (r) according to the importance of each level of the assessment indicator and then establish a four-level assessment indicator framework table for the network security situation of the Industrial Internet, as shown in Table 2. The first level includes software security and hardware security, the second level includes equipment belonging to software security and hardware security, the third level includes the types of attacks suffered by each device, and the fourth level includes the attack frequency and attack severity. The weights (ω) of all assessment indicators (r) are illustrated in the table.
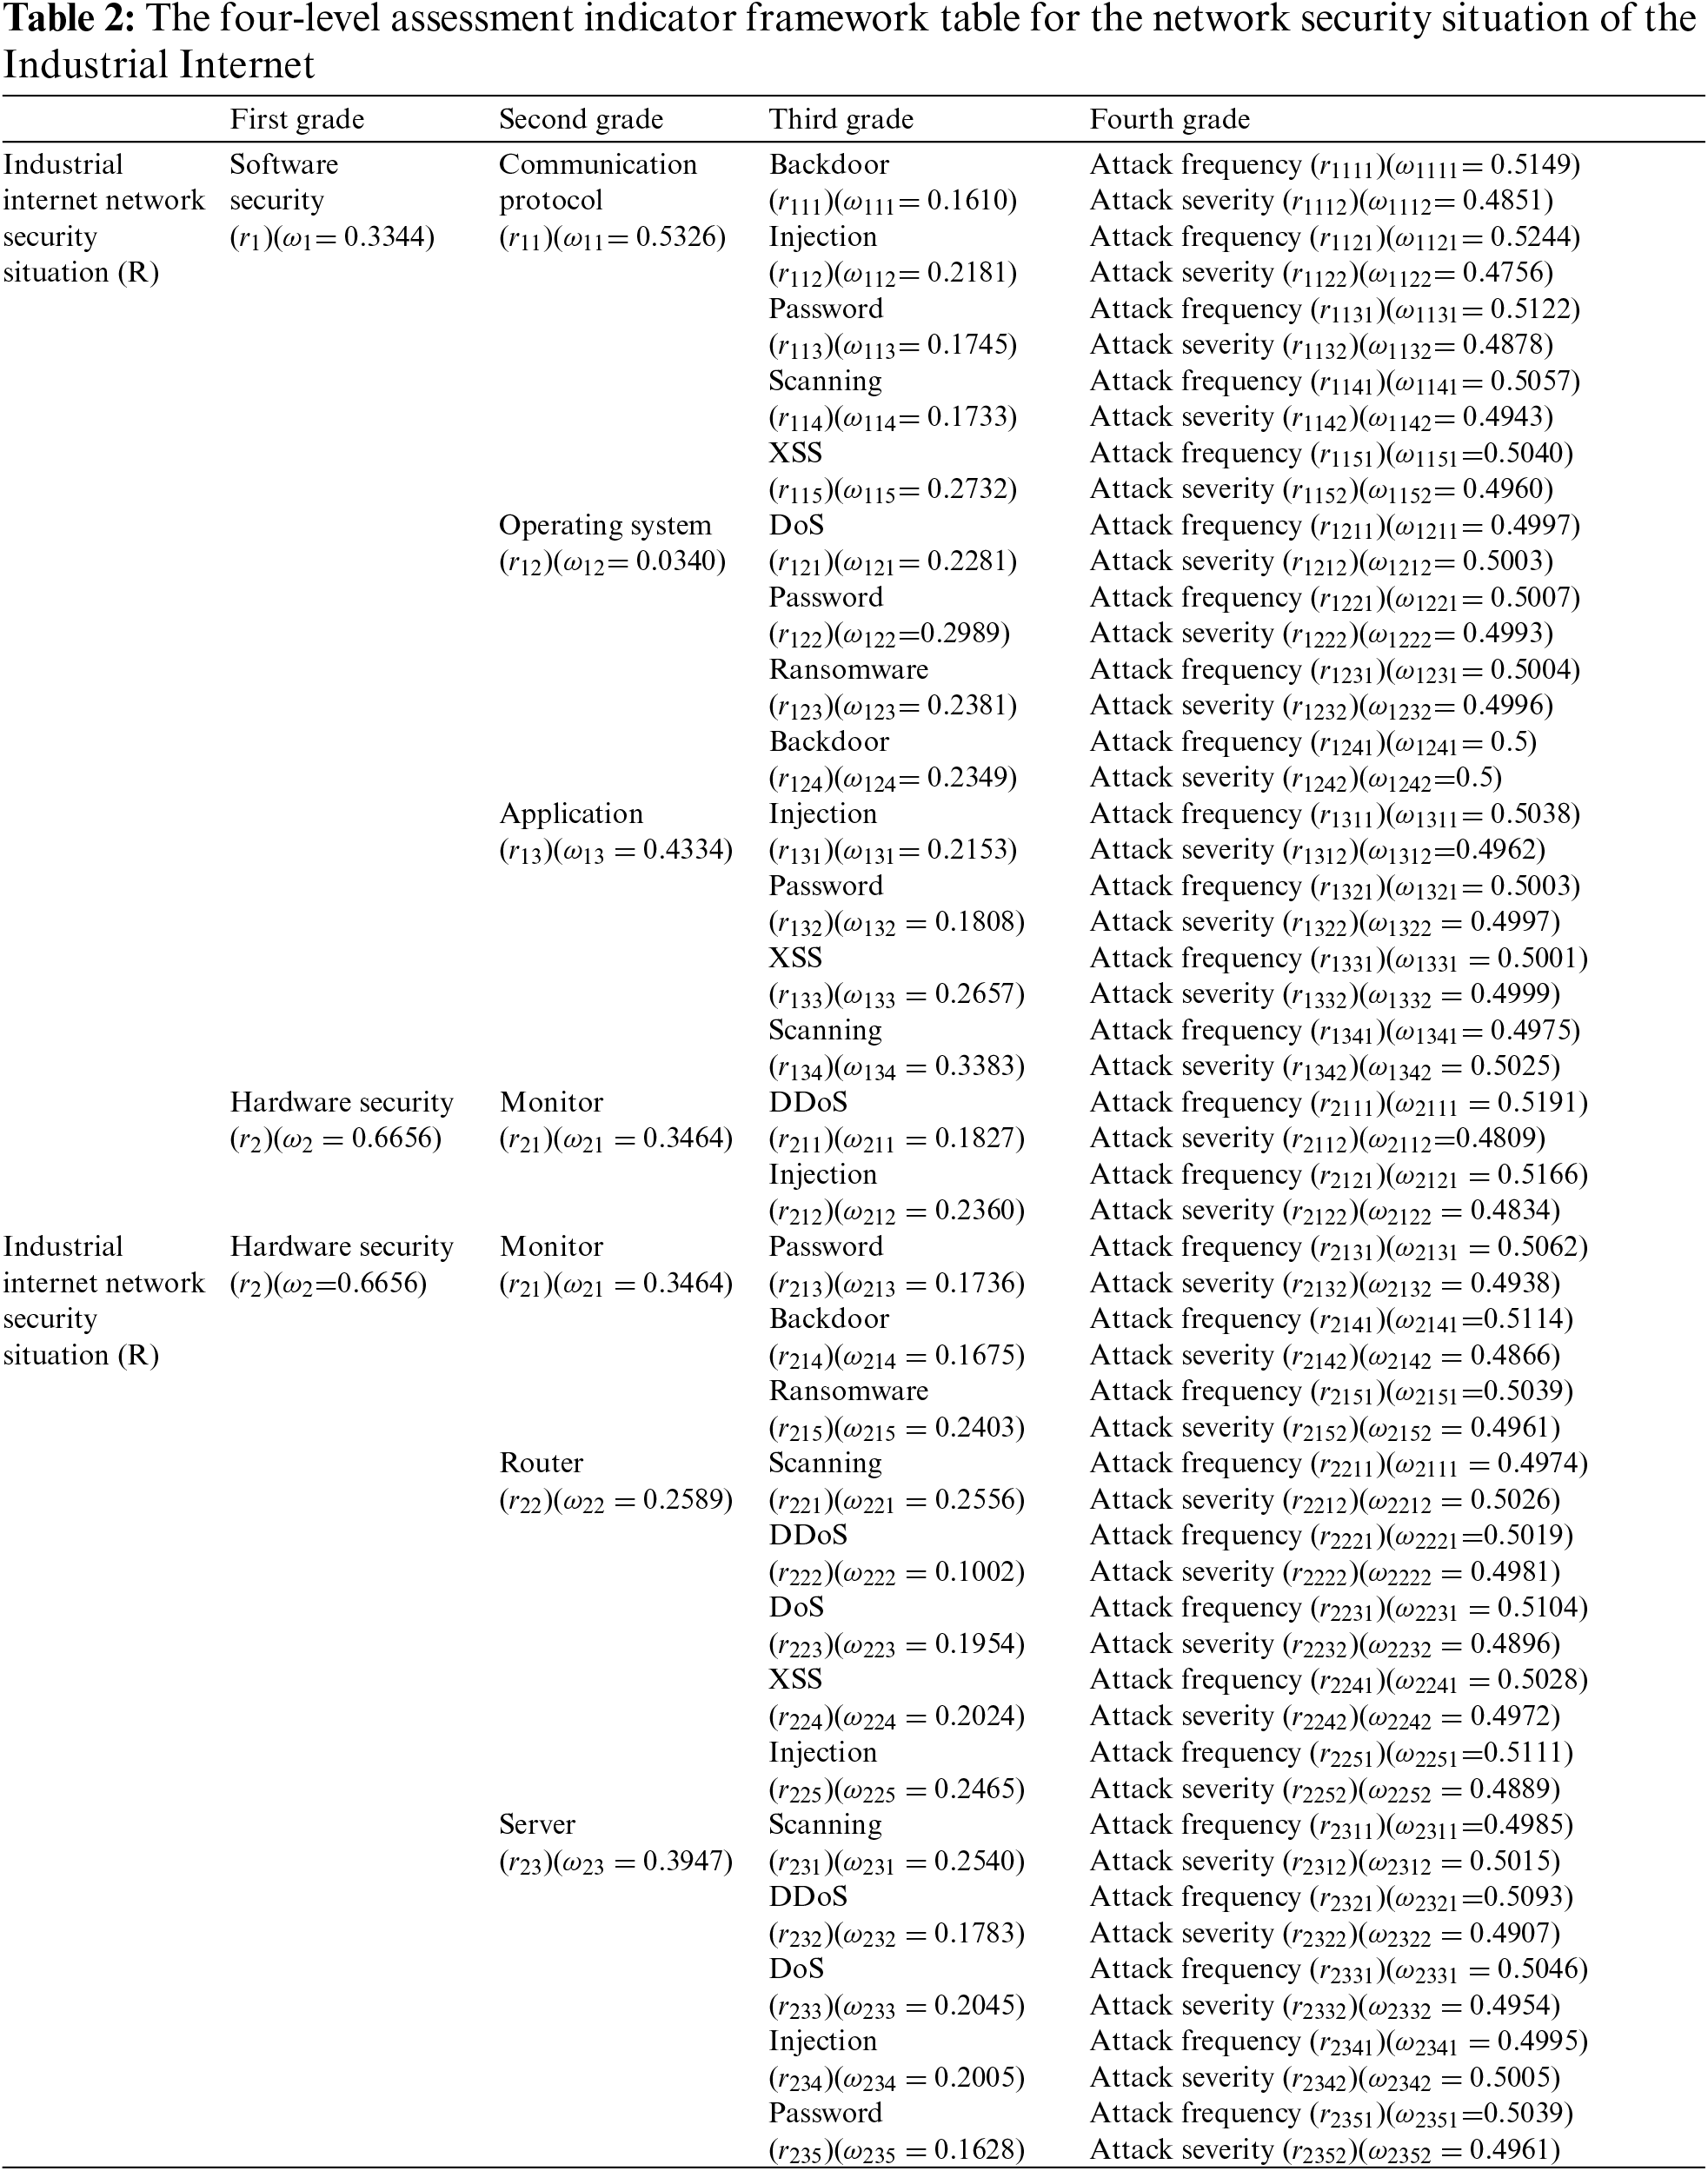
For the weights of the evaluation indicators, according to the specificity of the network security situation assessment, the stronger the data volatility of the evaluation indicators is, the greater the impact on the situation evaluation results. In other words, the more volatile the evaluation indicators are, the greater the weights. This is exactly in line with the algorithm ideology of the entropy value method [39], so the decision-maker can determine the weight of each evaluation indicator according to the entropy value method. The calculation process is described as follows:
Step 1: Generate the initial indicator data matrix.
Generate the original indicator data matrix X from the four-level assessment indicator data.
where xij denotes the value of the jth assessment indicator of the ith sample, n denotes the number of samples, and m denotes the number of assessment indicators.
Step 2: Normalization.
Normalize the values of the assessment indicators.
Step 3: Calculate the proportion of assessment indicators.
Calculate the proportion pij of the ith sample value under the jth assessment indicator to the assessment indicator.
Step 4: Calculate the entropy values.
Calculate the entropy values ej of the jth assessment indicator.
Step 5: Calculate the information entropy redundancies.
Calculate the information entropy redundancy dj of the jth assessment indicator.
Step 6: Calculate the weight.
Calculate the weight ωj of each assessment indicator.
Step 7: Calculate the comprehensive score.
Calculate the comprehensive score si of each sample.
According to the four-level assessment indicator framework table (Table 2) established in Section 3.2.1, the assessment grades of the Industrial Internet network security situation are determined.
For qualitative indicators, the assessment grade is determined by experts based on their own experience. The qualitative indicators are divided into reasonable evaluation intervals based on expert knowledge to accurately reflect the actual security status of the Industrial Internet. For quantitative indicators, five assessment grades are considered: very low (VL), low (L), medium (M), high (H) and very high (VH). The evaluation intervals of the quantitative indicators are set based on expert experience and actual investigations to ensure the accuracy and traceability of the data. For a complex system, such as in the Industrial Internet, the use of semiquantitative information inference methods to address security indicators has considerable advantages.
As the indicators of the last level are the attack frequency and severity of the external attacks on the software and hardware devices, all attack frequencies are expressed by Eq. (16), and all attack severities are expressed by Eq. (17):
where x denotes the xth evaluation indicator of the first level, y denotes the yth evaluation indicator of the second level, and z denotes the zth evaluation indicator of the third level.
In summary, the reference values of the evaluation grades corresponding to each evaluation indicator are shown in Table 3.

3.3 Industrial Internet Network Security Situation Assessment Model Based on ER
According to the four-level assessment indicator structure and assessment grades in Section 3.2, the ER iterative algorithm is used to gradually fuse all indicators step by step to obtain the fusion result. The fusion process is shown in Fig. 3.

Figure 3: The fusion process of the ER iterative algorithm
The calculation process of the ER iterative algorithm [29] is shown in Fig. 4. The detailed calculation process is described as follows:
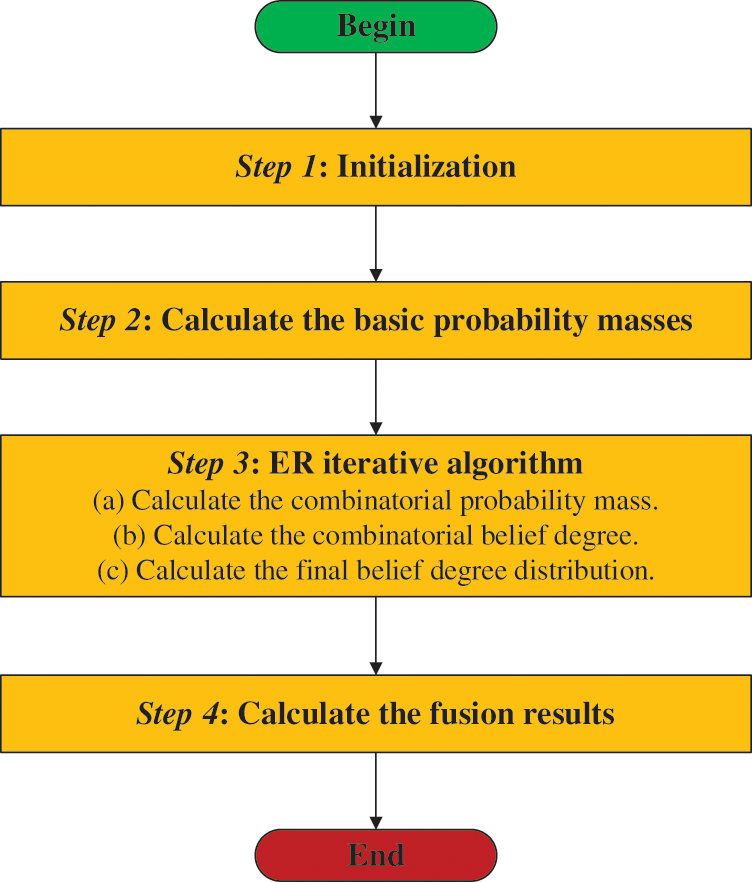
Figure 4: The calculation process of the ER iteration algorithm
Step 1: Initialization.
The belief degrees of different evaluation grades in each evaluation indicator are initialized, and the evaluation indicator ri of each level is described as follows:
Step 2: Calculate the basic probability masses.
The basic probability masses of the evaluation indicators ri are calculated according to the belief degrees ρn,i, which are described as follows:
Step 3: ER iterative algorithm.
This paper uses Dempster rules to fuse multiple evaluation indicators. The fourth-levelassessment indicators r1 (attack frequency) and r2 (attack severity) in the four-level assessment indicators framework table are fused, and the derivation process is as follows:
(a) Calculate the combinatorial probability mass.
(b) Calculate the combination belief degree.
(c) Calculate the final belief degree distribution.
According to the fusion process of the evaluation indicators, the final belief degree distribution of evaluation grades can be obtained by cycling (a) and (b) successively, and the results are as follows:
Step 4: Calculate the fusion results.
Assuming that the utility set of the evaluation grade Dn is u(Dn), the fusion results can be calculated by the utility formula:
The fusion results are quantified as follows:
(1) The final fusion result is standardized to the interval of [0, 1].
(2) The lower the final fusion result is, the safer the Industrial Internet, showing a negative correlation.
The ER iterative algorithm is used to deduce the network security situation assessment model of the Industrial Internet, and the fusion results of the evaluation indicators are obtained. After layer-by-layer fusion, the fused software security and hardware security results are taken as input attributes of the BRB model, and the final fusion result is taken as the actual output of the BRB model.
3.4 Industrial Internet Network Security Situation Assessment Model Based on BRB
The fused software security and hardware security results are expressed by SW and HWrespectively, and are analyzed to calculate the final Industrial Internet network security situation value. The BRB model can be described as:
where Rk, k = 1…K denotes the kth rule of the model.
The ER analytical algorithm is used to deduce the network security situation assessment model for the Industrial Internet based on BRB [30], and the calculation process is shown in Fig. 5. The detailed calculation process is described as follows:

Figure 5: The calculation process of the BRB algorithm
Step 1: Calculate the attribute matching degree.
When the input premise attribute data are available, the matching degree of its attribute reference value is calculated by the following formula, and the input premise attribute data are converted into a unified format.
Step 2: Calculate the total matching degree.
Based on the model framework, the following formula is used to calculate the total matching degree of all attributes.
Step 3: Calculate the activation weight.
If the input attribute is available, it will activate the belief rules in the evaluation model, and the activation weights are calculated by the following formula:
Step 4: ER analytic algorithm (Combine the rules).
After the belief rules are activated, the rules are combined by the ER analytic algorithm, and the calculation formula can be described as:
Step 5: Utility calculation.
After obtaining the belief degree of each evaluation grade, the utility formula is used to calculate the final evaluation result of the Industrial Internet system, which is the Industrial Internet network security situation value.
3.5 Optimized BRB Model Based on the P-CMA-ES Algorithm
Due to the complexity of the actual Industrial Internet system and the influence of interference factors in the environment, experts cannot provide completely precise system information, resulting in uncertainty in expert knowledge. To address the impact of expert knowledge uncertainty, theP-CMA-ES algorithm is used to establish an optimization model to improve the accuracy of theBRB-based Industrial Internet network security situation assessment model.
The optimization model and restrictions of the BRB-based Industrial Internet network security situation assessment model are described as follows:
where MSE(•) denotes the mean square error (MSE) function that reflects the accuracy of the BRB-based Industrial Internet network security situation assessment model, and it can be described by the following formula:
where outputactual denotes the actual security situation of the Industrial Internet system, which is determined by the final fusion result. outputestimated denotes the estimated output of the evaluation model, and it is calculated by
The calculation process of the P-CMA-ES optimization [36] algorithm is shown in Fig. 6. The detailed calculation process is described as follows:

Figure 6: The calculation process of the P-CMA-ES optimization algorithm
Step 1: Initialization.
The initial parameter vector Ω0 is determined as the initial expectation of the P-CMA-ES algorithm. The initial parameters are described as follows:
Step 2: Sampling.
The population is selected through the following formula:
The covariance matrix is the normal distribution of Cg:
Step 3: Projection.
The projection operation is performed on each equality constraint to map the candidate solution back to the feasible region so that it satisfies the constraint conditions:
The hyperplane can be defined as:
Step 4: Selection and recombination.
A selection operation is performed to update the mean by the following formula:
Step 5: Update the covariance matrix.
When all the solutions in the population satisfy the constraint conditions, the covariance matrix of the population needs to be updated to obtain the evolutionary trend of the population and the search range of the population. The updating process of the covariance matrix of the population can be described as:
Then, the update process is continued according to the following formula:
Next, the step size σ is updated according to the following formula:
Additionally, pσ is updated according to the following formula:
The above steps are repeated until the number of evolution generations of the population reaches the maximum; then, the final optimal parameter is output.
The aim of this case study is to demonstrate the validity of the proposed evaluation method. The TON_IoT dataset [40–42] proposed by UNSW Canberra is adopted for experiments in the context of Industrial Internet systems, and the data in the Train_Test_dataset folder are selected and processed. The datasets were collected from a realistic and large-scale network designed at the Cyber Range and IoT Labs, UNSW Canberra. A new testbed network was created for the Industry 4.0 network. The testbed was deployed using multiple virtual machines and hosts with Windows, Linux and Kali operating systems, and various attack techniques were used to attack web applications, operating systems, communication protocols, and various network devices. The dataset has the versatility of the Industrial Internet, and the built experimental platform environment also has the commonality of the Industrial Internet; hence, the feasibility and effectiveness of the model proposed in this paper can be verified. For each specific industry, the network architecture is different, and the generality and universality of the model constructed is low. This paper uses part of the dataset and builds the experimental topology for simulation experiments.
All experiments were executed with MATLAB tools in Windows 10 on an Intel core i7-12700H 3.60 GHz CPU, NVIDIA RTX3060 6 GB graphics card and 16 GB memory.
The topological structure diagram of the experiment is constructed based on the dataset, the test platform environment in the literature [42], and the description of the equipment, as shown in Fig. 7. The dataset contains data on attacks on multiple devices. In this paper, the selected software devices are the Modbus communication protocol, the operating system of a device whose IP is 192.168.1.193 and the web application of a device whose IP is 192.168.1.195. Moreover, the selected hardware devices are a weather monitor, a router whose IP is 192.168.1.1 and a server whose IP is 192.168.1.190.

Figure 7: Topology structure diagram of the experiment
The considered attack types are DoS, DDoS, ransomware, scanning, backdoor, injection, XXS and password attacks. Each device suffers from four to five main attack types. After determining the hardware and software devices and attack types, all the data from 24 h is divided into 15 min bins (96 groups in total), and the attack frequency of each attack type on all devices is calculated every 15 min.
4.2 ER Iterative Algorithm Fusion Experiment
The experimental process of ER iterative algorithm fusion is shown in Fig. 3.
According to the evaluation indicators and evaluation grades in Section 3.2 and the ER model in Section 3.3, a layer-by-layer fusion experiment is performed to obtain the software security, hardware security and final fusion results, as shown in Figs. 8–10. The fusion results of the software security and hardware security were taken as premise attribute 1 and premise attribute 2 of the BRB evaluation model respectively, and the final fusion result was taken as the actual output of the BRB evaluation model.

Figure 8: Fusion result of software security

Figure 9: Fusion result of hardware security

Figure 10: The final fusion result
As shown in Fig. 10, the overall security situation of network systems in the first three groups is relatively good, and even if network attacks occur, they will not cause serious harm to the security of the entire system. However, the security situation value suddenly increases in the 4th group, which indicates that this network system suffered more serious attacks than the first three groups. Then, from the 4th group to the 33rd group, the network system is basically maintained in a relatively good security state, and the attacks suffered during this process do not cause serious harm to the security of the entire system. However, in the 34th group, the security situation value of the network system suddenly increases sharply, indicating that the network system suffered major attacks, and it is not until the 42nd group that it recovers to a very safe state. In the 52nd group, the security situation value of the network system suddenly increases sharply again, which means that the network system suffered major attacks again. It is not until the 72nd group that it returns to normal and remains in a safe state.
4.3 Establishment of an Industrial Internet Network Security Situation Assessment Model Based on ER and BRB
After fusion of the evaluation indicators, the BRB-based Industrial Internet network security situation assessment model is established. The two premise input attributes are software security and hardware security, which are represented by SW and HW respectively. The five assessment grades of
Industrial Internet network security are defined as excellent (E), good (G), common (C), bad (B) and dangerous (D), which can be described as follows:
In summary, the specific belief rules of the Industrial Internet network security situation assessment model based on BRB are as follows:
First, the reference points of the two premise attributes (SW and HW) and the evaluation results are defined as excellent (E), good (G), common (C), bad (B) or dangerous (D). The reference values of SW and HW are confirmed by experts according to the range of the data changes. Therefore, the reference points and reference values of SW and HW are shown in Table 4. Second, the reference points and reference values of the evaluation results are shown in Table 5. Finally, the initial BRB model is constructed, in which the initial values of the rule weight and attribute weight are set to 1, and the initial belief degree is given by experts, as shown in Table 6.


The processed data were used for training and testing according to the evaluation model constructed in Section 4.3. The initial parameters of the model were adjusted and optimized by randomly selecting 64 samples. The remaining 32 groups were used as test data to calculate the evaluation precision of the model. In the training process, the model parameters were adjusted and optimized by the P-CMA-ES algorithm in Section 3.5, and the optimized belief degree is shown in Table 7. This paper conducted 10 rounds of experiments to verify the validity of the Industrial Internet network security situation assessment model. The evaluation results of the model are shown in Fig. 11. The green ellipse in Fig. 11 shows that when the Industrial Internet network security situation is stable, its security situation can be accurately assessed; the purple ellipse in Fig. 11 shows that when the Industrial Internet system is suddenly attacked, the security situation can still be accurately assessed. Therefore, the model proposed in this paper can accurately assess the network security situation of the Industrial Internet.

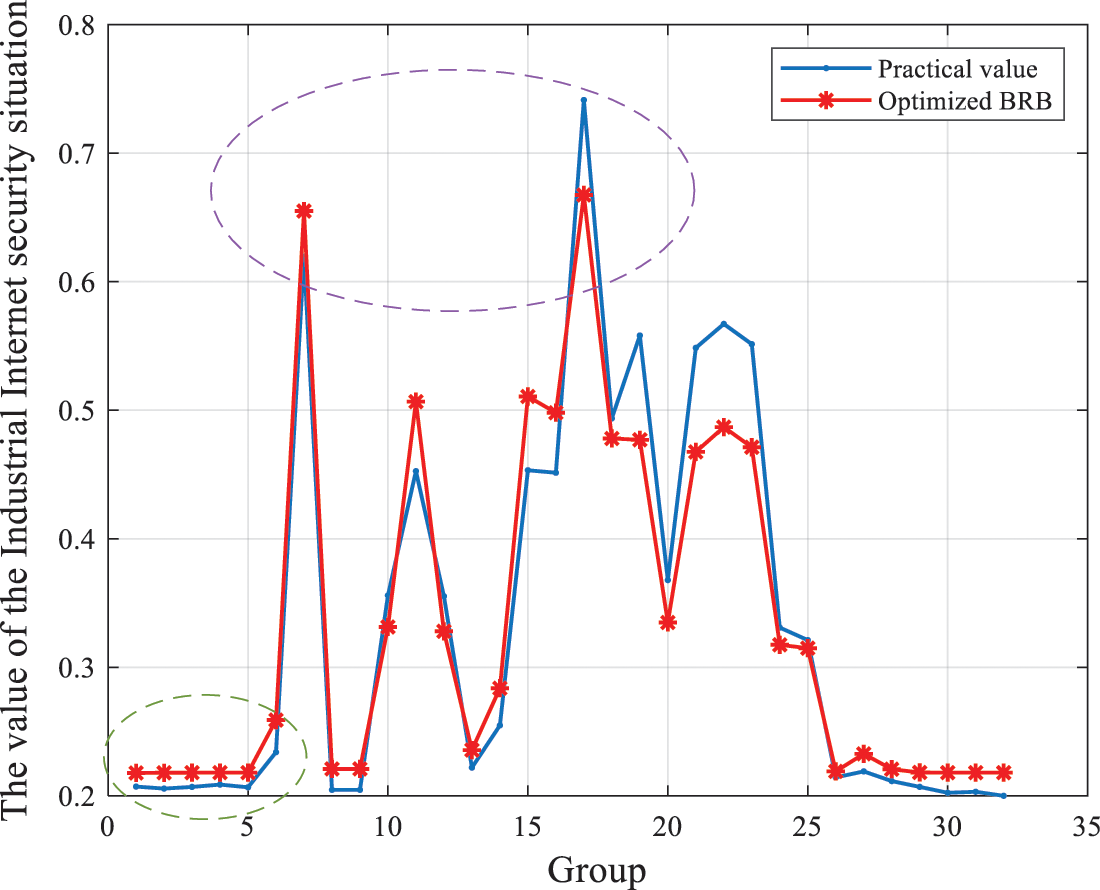
Figure 11: Assessment results of the security situation assessment model
First, the initial BRB model is compared with the BRB model optimized by the P-CMA-ES algorithm to demonstrate that the P-CMA-ES optimization algorithm can address the problem of low accuracy caused by expert knowledge uncertainty. The comparison results are shown in Fig. 12.

Figure 12: Comparison results of the initial BRB model with the optimized BRB model
Second, to prove the superiority of the BRB model, the BRB model is compared with the BPNN, RBFNN and RF models. The BPNN, RBFNN and RF models are all typical models based on quantitative data.
The comparison results of the evaluation models established by the four methods are shown in Fig. 13. The average MSE for each evaluation model in 10 rounds of experiments is shown in Table 8.
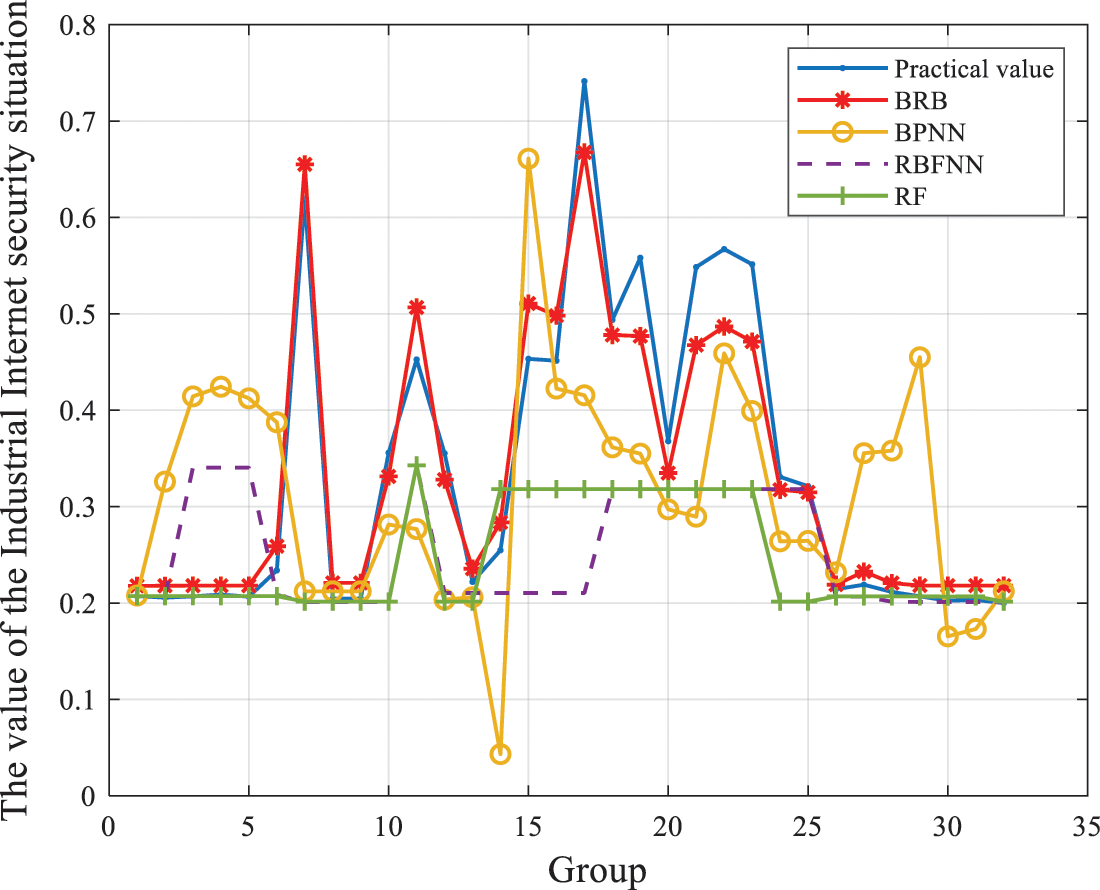
Figure 13: Comparison results of the BRB model with other assessment models

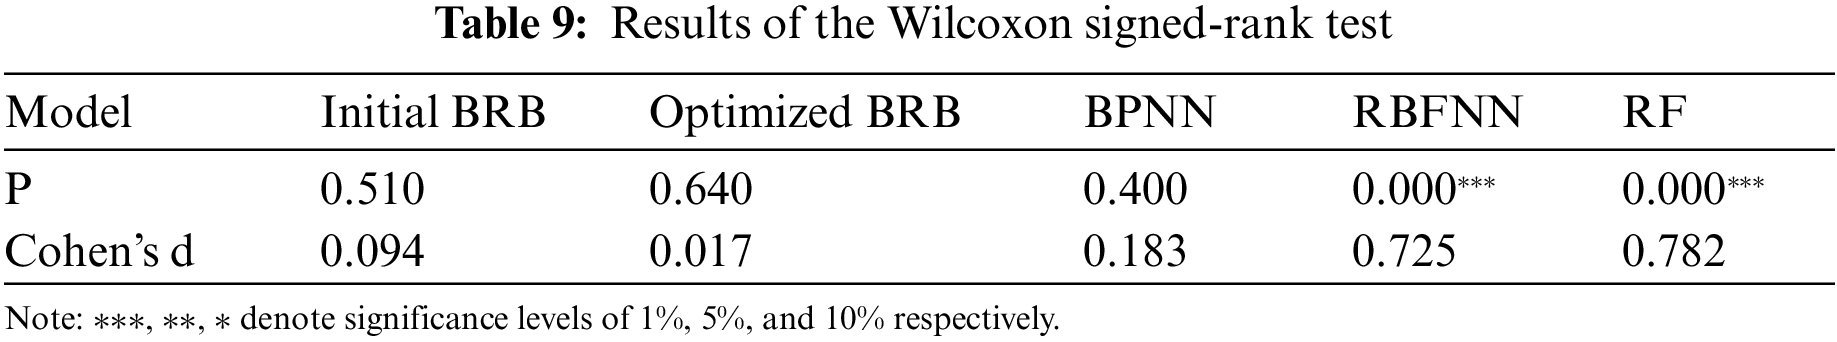
The evaluation results of each model were paired with the actual values, and the Wilcoxon signed-rank test was performed using SPSS statistical software. The test results are shown in Table 9.
According to the above results, the Industrial Internet network security situation assessment model proposed in this paper is reliable and effective and has high assessment accuracy. By analyzing the experimental results, the following conclusions can be drawn:
(1) As shown in Fig. 12, the BRB model optimized by the P-CMA-ES algorithm significantly improves the evaluation effect and reduces the influence of the uncertainty of expert knowledge. Since the initial BRB model is constructed by experts and is an assessment method based on qualitative knowledge, the semiquantitative information assessment method based on BRB has higher accuracy than the evaluation method based on qualitative knowledge.
(2) As shown in Fig. 13, the evaluation results of the BRB method are more in line with the actual security situation value, and the evaluation results of the other three methods have relatively large errors. Because it is very difficult to collect data samples in complex Industrial Internet systems and the number of collected data samples is small, methods based on quantitative data cannot be used to effectively evaluate complex network systems, resulting in low evaluation accuracy. Thus, the semiquantitative information method based on BRB can more effectively solve the situation assessment problem of complex Industrial Internet systems when there are few data samples.
(3) As shown in Table 8, in ten rounds of experiments, the average MSE value of the BRB method is 1.5 × 10⁻³, while the average MSE values of the other three methods are at the 10−2 level. Therefore, the BRB method has better accuracy.
(4) As shown in Table 9, the P value between the estimated value of the initial BRB and the actual value is 0.510, which is greater than 0.05, so the null hypothesis cannot be rejected. Therefore, there was no significant difference between the two groups of data. Additionally, the Cohen’s d value is 0.094, and the difference range is relatively small. The P value between the estimated value of the optimized BRB model and the actual value is 0.640, which is greater than 0.05, so the null hypothesis cannot be rejected. Therefore, there was no significant difference between the two groups of data. Additionally, the Cohen’s d value is 0.017, the difference range is very small, and there is almost no difference. The P value between the estimated value of the BPNN and the actual value is 0.400, which is greater than 0.05, so the null hypothesis cannot be rejected. Therefore, there was no significant difference between the two groups of data. Additionally, the Cohen's d value is 0.183, and the difference range is relatively small. The P values between the estimated values of the RBFNN and RF models and their actual values are both less than 0.05, so the null hypothesis is rejected: there is a significant difference, and the difference range is relatively large. This shows that the difference between the evaluation results of the optimized BRB model and the actual security situation value is the smallest, and the second smallest difference is observed for the initial BRB model. Therefore, the BRB-based method can be used to accurately evaluate the network security situation of the Industrial Internet.
By selecting the common characteristics and assessment indicators of many Industrial Internet systems, an Industrial Internet network security situation assessment model based on ER and BRB is established in this paper. This model can solve the difficult modeling problem caused by the complexity of Industrial Internet systems. It can not only effectively use semiquantitative information but also accurately describe various uncertain information and address the uncertainty of expert knowledge by using the P-CMA-ES optimization algorithm. The experiments show that the ER and BRB evaluation method based on semiquantitative information has higher accuracy than other machine learning methods, is more applicable to the security situation of complex Industrial Internet systems and can accurately reflect the actual network security situation of the Industrial Internet. The accurate assessment results can provide network administrators with safe and reliable recommendations so that they can discover unsafe events in the network and take countermeasures in a timely manner, thereby improving the risk monitoring and emergency response capabilities of the Industrial Internet. However, this model may still encounter the problem of unreliable expert knowledge, and this work only addresses the assessment problem of network security situation awareness in the Industrial Internet. Therefore, based on the above description, future work will mainly include the following two points:
(1) To solve the problem of unreliable expert knowledge, by reducing unreliable rules, a BRB model considering the reliability of rules will be constructed and applied to the network security situation assessment of the Industrial Internet, and this model will further improve the assessment accuracy.
(2) The improved BRB method will be used to further study the problem of the Industrial Internet network security situation prediction, and the prediction component of the Industrial Internet security situation awareness will be perfected.
Acknowledgement: We thank the anonymous reviewers for their valuable comments and suggestions, which helped us to improve the content and presentation of this paper.
Funding Statement: This research is supported by the Provincial Universities Basic Business Expense Scientific Research Projects of Heilongjiang Province (No. 2021-KYYWF-0179), the Science and Technology Project of Henan Province (No. 212102310991), the Opening Project of Shanghai Key Laboratory of Integrated Administration Technologies for Information Security (No. AGK2015003), the Key Scientific Research Project of Henan Province (No. 21A413001), and the Postgraduate Innovation Project of Harbin Normal University (No. HSDSSCX2021-121).
Conflicts of Interest: The authors declare that they have no conflicts of interest to report regarding the present study.
References
1. K. L. Keung, C. K. M. Lee and P. Ji, “Industrial internet of things-driven storage location assignment and order picking in a resource synchronization and sharing-based robotic mobile fulfillment system,” Advanced Engineering Informatics, vol. 52, pp. 101540, 2022. [Google Scholar]
2. J. Q. LI, F. R. Yu, G. Q. Deng, C. W. Luo, Z. Ming et al., “Industrial internet: A survey on the enabling technologies, applications, and challenges,” IEEE Communications Surveys & Tutorials, vol. 19, no. 3, pp. 1504–1526, 2017. [Google Scholar]
3. K. L. Keung, C. K. M. Lee, P. Ji and J. G. Huo, “Cloud-based cyber-physical robotic mobile fulfillment systems considering order correlation pattern,” in Proc. of the 2020 IEEE Int. Conf. on Industrial Engineering and Engineering Management (IEEM), Singapore, Singapore, pp. 113–117, 2020. [Google Scholar]
4. W. Knowles, D. Prince, D. Hutchison, J. F. P. Disso and K. Jones, “A survey of cyber security management in industrial control systems,” International Journal of Critical Infrastructure Protection, vol. 9, pp. 52–80, 2015. [Google Scholar]
5. Y. B. Leau, S. Manickam and Y. W. Chong, “Network security situation assessment: A review and discussion,” Information Science and Applications, vol. 339, no. 48, pp. 407–414, 2015. [Google Scholar]
6. J. Zhao and D. Wu, “The risk assessment on the security of industrial internet infrastructure under intelligent convergence with the case of GE’s intellectual transformation,” Mathematical Biosciences and Engineering, vol. 19, no. 3, pp. 2896–2912, 2022. [Google Scholar] [PubMed]
7. Q. Zhang, C. J. Zhou, Y. C. Tian, N. X. Xiong, Y. Q. Qin et al., “A fuzzy probability Bayesian network approach for dynamic cybersecurity risk assessment in industrial control systems,” IEEE transactions on industrial informatics, vol. 14, no. 6, pp. 2497–2506, 2018. [Google Scholar]
8. K. L. Keung, Y. Y. Chan, K. K. H. Ng, S. L. Mak, H. C. Li et al., “Edge intelligence and agnostic robotic paradigm in resource synchronisation and sharing in flexible robotic and facility control system,” Advanced Engineering Informatics, vol. 52, no. 1, pp. 101530, 2022. [Google Scholar]
9. Z. C. Feng, Z. J. Zhou, C. H. Hu, X. J. Ban and G. Y. Hu, “A safety assessment model based on belief rule base with new optimization method,” Reliability Engineering & System Safety, vol. 203, no. 12, pp. 107055, 2020. [Google Scholar]
10. H. Q. Song, D. M. Zhao and C. Y. Yuan, “Network security situation prediction of improved lanchester equation based on time action factor,” Mobile Networks and Applications, vol. 26, no. 3, pp. 1008–1023, 2021. [Google Scholar]
11. D. Codetta-Raiteri and L. Portinale, “Decision networks for security risk assessment of critical infrastructures,” ACM Transactions on Internet Technology, vol. 18, no. 3, pp. 1–22, 2018. [Google Scholar]
12. Z. J. Zhou, L. L. Chang, C. H. Hu, X. X. Han and Z. G. Zhou, “A new BRB-ER-based model for assessing the lives of products using both failure data and expert knowledge,” IEEE Transactions on Systems, Man, and Cybernetics: Systems, vol. 46, no. 11, pp. 1529–1543, 2016. [Google Scholar]
13. H. Wang, Z. F. Chen, X. Feng, X. Q. Di, D. Liu et al., “Research on network security situation assessment and quantification method based on analytic hierarchy process,” Wireless Personal Communications, vol. 102, no. 2, pp. 1401–1420, 2018. [Google Scholar]
14. J. Wu, K. Ota, M. X. Dong, J. H. Li and H. K. Wang, “Big data analysis-based security situational awareness for smart grid,” IEEE Transactions on Big Data, vol. 4, no. 3, pp. 408–417, 2018. [Google Scholar]
15. M. Alali, A. Almogren, M. M. Hassan, I. A. L. Rassan and M. Z. A. Bhuiyan, “Improving risk assessment model of cyber security using fuzzy logic inference system,” Computers & Security, vol. 74, no. 1, pp. 323–339, 2018. [Google Scholar]
16. Z. J. Zhou, G. Y. Hu, C. H. Hu, C. L. Wen and L. L. Chang, “A survey of belief rule-base expert system,” IEEE Transactions On Systems, Man, and Cybernetics: Systems, vol. 51, no. 8, pp. 4944–4958, 2021. [Google Scholar]
17. G. Y. Hu and P. L. Qiao, “Cloud belief rule base model for network security situation prediction,” IEEE Communications Letters, vol. 20, no. 5, pp. 914–917, 2016. [Google Scholar]
18. B. Yi, Y. P. Cao and Y. Song, “Network security risk assessment model based on fuzzy theory,” Journal of Intelligent & Fuzzy Systems, vol. 38, no. 4, pp. 3921–3928, 2020. [Google Scholar]
19. Y. H. Jin, Y. J. Shen, G. D. Zhang and H. Zhi, “The model of network security situation assessment based on random forest,” in Proc. of the 2016 7th IEEE Int. Conf. on Software Engineering and Service Science (ICSESS), Beijing, China, pp. 977–980, 2016. [Google Scholar]
20. H. Y. Yang, Z. X. Zhang, L. X. Xie and L. Zhang, “Network security situation assessment with network attack behavior classification,” International Journal of Intelligent Systems, vol. 37, no. 10, pp. 6909–6927, 2022. [Google Scholar]
21. R. Zhang, Z. H. Pan, Y. F. Yin and Z. Y. Cai, “Network security situation assessment model based on SAA-SSA-BPNN,” Computer Engineering and Application, vol. 58, no. 11, pp. 117–124, 2022. [Google Scholar]
22. D. M. Zhao and J. X. Liu, “Study on network security situation awareness based on particle swarm optimization algorithm,” Computers & Industrial Engineering, vol. 125, no. 10, pp. 764–775, 2018. [Google Scholar]
23. H. Y. Yang, R. Y. Zeng, G. Q. Xu and L. Zhang, “A network security situation assessment method based on adversarial deep learning,” Applied Soft Computing, vol. 102, no. 8, pp. 107096, 2021. [Google Scholar]
24. Z. Y. Pu, “Network security situation analysis based on a dynamic Bayesian network and phase space reconstruction,” Journal of Supercomputing, vol. 76, no. 2, pp. 1342–1357, 2020. [Google Scholar]
25. Z. J. Zhou, C. H. Hu, D. L. Xu, M. Y. Chen and D. H. Zhou, “A model for real-time failure prognosis based on hidden Markov model and belief rule base,” European Journal of Operational Research, vol. 207, no. 1, pp. 269–283, 2010. [Google Scholar]
26. F. Wang, J. Qiang and X. L. Dang, “Network security based on D-S evidence theory optimizing CS-BP neural network situation assessment,” in Proc. of the 2018 5th IEEE Int. Conf. on Cyber Security and Cloud Computing (CSCloud)/the 2018 4th IEEE Int. Conf. on Edge Computing and Scalable Cloud (EdgeCom), Shanghai, China, pp. 153–159, 2018. [Google Scholar]
27. H. B. Wang, D. M. Zhao and X. X. Li, “Research on network security situation assessment and forecasting technology,” Journal of Web Engineering, vol. 19, no. 7–8, pp. 1239–1265, 2020. [Google Scholar]
28. H. F. Zhang, C. Y. Kang and Y. Xiao, “Research on network security situation awareness based on the LSTM-DT Model,” Sensors, vol. 21, no. 14, pp. 4788, 2021. [Google Scholar] [PubMed]
29. Y. M. Wang, J. B. Yang, D. L. Xu and K. S. Chin, “The evidential reasoning approach for multiple attribute decision analysis using interval belief degrees,” European Journal of Operational Research, vol. 175, no. 1, pp. 35–66, 2006. [Google Scholar]
30. J. B. Yang, J. Liu, J. Wang, H. S. Sii and H. W. Wang, “Belief rule-base inference methodology using the evidential reasoning approach-RIMER,” IEEE Transactions on Systems, Man, and Cybernetics-Part A: Systems and Humans, vol. 36, no. 2, pp. 266–285, 2006. [Google Scholar]
31. S. W. Tang, Z. J. Zhou, C. H. Hu, F. J. Zhao and Y. Cao, “A new evidential reasoning rule-based safety assessment method with sensor reliability for complex systems,” IEEE Transactions on Cybernetics, vol. 52, no. 5, pp. 4027–4038, 2022. [Google Scholar] [PubMed]
32. Z. C. Feng, W. He, Z. J. Zhou, X. J. Ban, C. H. Hu et al., “A new safety assessment method based on belief rule base with attribute reliability,” IEEE/CAA Journal of Automatica Sinica, vol. 8, no. 11, pp. 1774–1785, 2021. [Google Scholar]
33. Z. J. Zhou, C. H. Hu, G. Y. Hu, X. X. Han, B. C. Zhang et al., “Hidden behavior prediction of complex systems under testing influence based on semiquantitative information and belief rule base,” IEEE Transactions on Fuzzy Systems, vol. 23, no. 6, pp. 2371–2386, 2015. [Google Scholar]
34. G. Y. Hu, “Research on network security situation awareness technology based on belief rule base,” Ph.D. dissertation. Harbin: Harbin University of Science and Technology, 2016. [Google Scholar]
35. G. Y. Hu, Z. J. Zhou, B. C. Zhang, X. J. Yin, Z. Gao et al., “A method for predicting the network security situation based on hidden BRB model and revised CMA-ES algorithm,” Applied Soft Computing, vol. 48, no. 4, pp. 404–418, 2016. [Google Scholar]
36. Z. J. Zhou, G. Y. Hu, B. C. Zhang, C. H. Hu, Z. G. Zhou et al., “A model for hidden behavior prediction of complex systems based on belief rule base and power set,” IEEE Transactions on Systems, Man, and Cybernetics: Systems, vol. 48, no. 9, pp. 1649–1655, 2018. [Google Scholar]
37. W. He, C. Q. Yu, G. H. Zhou, Z. J. Zhou and G. Y. Hu, “Fault prediction method for wireless sensor network based on evidential reasoning and belief-rule-base,” IEEE Access, vol. 7, pp. 78930–78941, 2019. [Google Scholar]
38. A. Aijaz and M. Sooriyabandara, “The tactile internet for industries: A review,” Proceedings of the IEEE, vol. 107, no. 2, pp. 414–435, 2019. [Google Scholar]
39. J. X. Sun, L. Z. Gu and K. Y. Chen, “An efficient alert aggregation method based on conditional rough entropy and knowledge granularity,” Entropy, vol. 22, no. 3, pp. 324, 2020. [Google Scholar] [PubMed]
40. N. Moustafa, “A new distributed architecture for evaluating AI-based security systems at the edge: Network TON_IoT datasets,” Sustainable Cities and Society, vol. 72, pp. 102994, 2021. [Google Scholar]
41. T. M. Booij, I. Chiscop, E. Meeuwissen, N. Moustafa and F. T. H. den Hartog, “ToN_IoT: The role of heterogeneity and the need for standardization of features and attack types in IoT network intrusion data sets,” IEEE Internet of Things Journal, vol. 9, no. 1, pp. 485–496, 2022. [Google Scholar]
42. A. Alsaedi, N. Moustafa, Z. Tari, A. Mahmood and A. Anwar, “TON_IoT telemetry dataset: A new generation dataset of IoT and IIoT for data-driven intrusion detection systems,” IEEE Access, vol. 8, pp. 165130–165150, 2020. [Google Scholar]
Cite This Article
 Copyright © 2023 The Author(s). Published by Tech Science Press.
This work is licensed under a Creative Commons Attribution 4.0 International License , which permits unrestricted use, distribution, and reproduction in any medium, provided the original work is properly cited.
 Downloads
 Citation Tools