
 Submit a Paper
 Propose a Special lssue
 Open Access
ARTICLE

Data Center Traffic Scheduling Strategy for Minimization Congestion and Quality of Service Guaranteeing
School of Computer Science, Hubei University of Technology, Wuhan, 430068, China
* Corresponding Author: Weidong Cao. Email:
Computers, Materials & Continua 2023, 75(2), 4377-4393. https://doi.org/10.32604/cmc.2023.037625
Received 11 November 2022; Accepted 08 February 2023; Issue published 31 March 2023
 View Full Text
 Download PDF
Abstract
According to Cisco’s Internet Report 2020 white paper, there will be 29.3 billion connected devices worldwide by 2023, up from 18.4 billion in 2018. 5G connections will generate nearly three times more traffic than 4G connections. While bringing a boom to the network, it also presents unprecedented challenges in terms of flow forwarding decisions. The path assignment mechanism used in traditional traffic scheduling methods tends to cause local network congestion caused by the concentration of elephant flows, resulting in unbalanced network load and degraded quality of service. Using the centralized control of software-defined networks, this study proposes a data center traffic scheduling strategy for minimization congestion and quality of service guaranteeing (MCQG). The ideal transmission path is selected for data flows while considering the network congestion rate and quality of service. Different traffic scheduling strategies are used according to the characteristics of different service types in data centers. Reroute scheduling for elephant flows that tend to cause local congestion. The path evaluation function is formed by the maximum link utilization on the path, the number of elephant flows and the time delay, and the fast merit-seeking capability of the sparrow search algorithm is used to find the path with the lowest actual link overhead as the rerouting path for the elephant flows. It is used to reduce the possibility of local network congestion occurrence. Equal cost multi-path (ECMP) protocols with faster response time are used to schedule mouse flows with shorter duration. Used to guarantee the quality of service of the network. To achieve isolated transmission of various types of data streams. The experimental results show that the proposed strategy has higher throughput, better network load balancing, and better robustness compared to ECMP under different traffic models. In addition, because it can fully utilize the resources in the network, MCQG also outperforms another traffic scheduling strategy that does rerouting for elephant flows (namely Hedera). Compared with ECMP and Hedera, MCQG improves average throughput by 11.73% and 4.29%, and normalized total throughput by 6.74% and 2.64%, respectively; MCQG improves link utilization by 23.25% and 15.07%; in addition, the average round-trip delay and packet loss rate fluctuate significantly less than the two compared strategies.Keywords
As an important carrier in the information age, data centers are the core infrastructure of cloud computing. People from all walks of life are beginning to fully embrace the cloud and smart era as a result of the rapid development of the internet and information technology. In this process, many new production elements, such as artificial intelligence, smart cities, smart factories, and telemedicine, require data centers to provide the necessary platform support [1]. However, in order to support the growing business of big data, industrial internet, artificial intelligence, and fully utilize the scale benefits of data centers, the number of network devices, servers, and network traffic in data centers is increasing exponentially, and the network complexity is rapidly rising [2]. Meanwhile, with the advent of 5G and the artificial intelligence era, many new applications such as augmented reality, virtual reality, in-vehicle networks, and the internet of things have put higher demands on network communication quality, e.g., burst tolerance, bandwidth, throughput, packet loss rate, and delay [3].
The traditional equivalent multi-path approach tends to cause local congestion in the network and only partially utilizes the abundant link resources in the network. Traffic scheduling methods based on Software-defined network (SDN) [4] and OpenFlow [5] are applied to data centers. SDN is an emerging software-based network architecture and technology. Compared with traditional networks, the control plane and forwarding plane of network devices are separated in SDN, and the network has a specific hierarchy. At the same time, SDN has centralized control and network programmability characteristics. Administrators can realize self-defined network functions such as controlling data layer forwarding decisions and collecting and processing network link status through an open application programming interface. Users can flexibly specify network control policies according to specific application scenarios. The basic idea is to deploy network applications without designing new devices. However, the SDN and OpenFlow-based traffic scheduling approach have its inherent drawbacks, most notably that the delay between the first packet of a new network flow received by an OpenFlow switch and the receipt of a flow entry from an SDN controller is more significant than in the traditional distributed control approach. In addition, in a large-scale data center, the number of network flows is enormous, and most are small flows that are short and sensitive to latency. If a centralized scheduling approach is performed for all the streams, the additional latency brought by this approach is unacceptable for the small streams. Therefore, how to fully utilize the advantages of SDN in traffic scheduling in data centers while avoiding its disadvantages. Improving the network’s service quality while reducing local congestion is a pressing issue for data center networks today [6].
Many studies have shown that there are two typical traffic types in data center networks, namely, elephant flows (EFs) and mouse flows (MFs) [7]. EFs are bandwidth-sensitive traffic of size more than 100 KB and longer duration, such as file backups and transfers, while MFs are delay-sensitive traffic of size less than 100 KB and shorter duration, such as query requests from search engines. However, EFs, which account for only 10% in number, account for 90% of the total traffic transmitted over the data center network. In a data center network with a mixture of EFs and MFs, the network needs to provide high available bandwidth to the bandwidth-sensitive EFs and not to increase the transmission delay of the delay-sensitive MFs. But, current network routing protocols, such as the open shortest path first protocol [8], do not take full advantage of the redundant paths in the network to improve network throughput or reduce network latency. Equivalent multi-path protocols, such as Equal Cost Multi-Path (ECMP) [9], is a classic static traffic scheduling method. It first calculates the hash value according to the field information in the data packet header and then maps the network traffic to the corresponding path through the hash value. The computational cost of this algorithm is relatively low. Still, it doesn‘t consider the actual load of the link and the bandwidth requirement of network traffic, which may easily lead to local link congestion and reduce network performance [10].
Considering the issues mentioned earlier, we proposed a traffic scheduling strategy that Minimization Congestion and Quality of service Guaranteeing (MCQG). The purpose is to improve the data center’s quality of service (Qos) [11] and solve the locality link congestion problem [12]. Firstly, a multi-constrained linear programming model is introduced to detect the real-time state of the network utilizing the method of periodic queries, and the actual overhead of the network links is calculated synthetically. Set the threshold of flow classification for EFs detection. When the EFs are detected, the path optimization module is enabled, and the path set with the fewest number of hops is used as the initial solution set of the sparrow search algorithm (SSA) [13], The SSA is a novel population intelligence algorithm proposed by Xue and Shen in 2020. By calculating the weight of each path, a path with the least actual link cost is found for the EFs as the delivery path. The actual load of the link, the number of EFs, and the delay are used to form a weighted evaluation function. When the actual load of a path is heavier, the number of EFs is more extensive, and the delay is more considerable, it is more likely to cause network congestion, the lower the weight it obtains, and the lower the probability of being selected. At the same time, the MFs are processed by using the fast response capability of ECMP. In this way, the EFs and the MFs are separated and transmitted, and the traffic on the link can be dynamically adjusted, avoiding the possibility of network congestion to the greatest extent and ensuring that the delay-sensitive traffic has a slight transmission delay and a low transmission delay. Packet loss rate and provide sufficient transmission bandwidth for bandwidth-sensitive traffic. As a result, network load balancing is achieved.
This article’s remaining sections are organized as follows: Section 2 introduces the research of traffic engineering and multipath routing algorithm. Section 3 introduces MCQG, a data center traffic scheduling strategy for Minimization Congestion and Quality of Service Guaranteeing. In the fourth part, the experimental results and performance analysis are presented. Finally, we draw a conclusion and further work in Section 5.
Traffic scheduling implements load balancing by controlling and managing traffic on the network. The purpose of traffic scheduling and load balancing is to ensure the balanced distribution of traffic on different paths in the network and minimize the completion time of traffic. By sharing traffic among multiple different paths, what can reduce network congestion and network resource utilization can be improved. There are many solutions to the data center load balancing problem.
2.2 Traffic Scheduling Considering Flow Size
It is generally accepted that EFs are the leading cause of network congestion, so researchers have proposed a specialized placement or rerouting only for EFs that appear in the network. Some approaches directly determine the flow type and adapt their methods to the type of flow.
Al-Fares et al. [14] propose a traffic scheduling strategy that does rerouting for EFs (namely Hedera). Flows with transmission rates greater than 10% of the link bandwidth are defined as EFs in Hedera, and the SDN controller is used to query the transmission rates of the flows in the switch in a polling manner. When an elephant flow is found, the bandwidth requirements of the elephant flow are first evaluated. A lightly loaded path that meets its bandwidth needs is found, and finally, a flow table is issued to achieve rerouting of the elephant flow.
Xiao et al. [15] propose an OpenFlow-Based Path-Planning with a Bandwidth Guarantee algorithm (OPPBG); OPPBG is a path selection strategy based on the remaining available bandwidth of a link. First, the remaining available bandwidth of each link is calculated. Then Dijkstra’s algorithm is used to find the path with the most significant remaining available bandwidth among all paths under the same source and destination addresses, which is the ideal path. Port queues are set up on the switches along the path, and the shortest path is used directly to avoid potential service interference.
Abdollahi et al. [16] proposed a backpack model where the link bandwidth represents the backpack capacity, and the input flows represent items. Also, a flow labeling method is proposed, where each flow includes two characteristics, size and value. The flow is classified according to the data flow size by the formulated service type, and the lower the category, the higher the value, which is then injected into the backpack value vector. The backpack problem is optimized using a particle swarm algorithm, which aims to fill the link capacity by exploiting the flow size.
These methods can satisfy the bandwidth-sensitive EFs transmission but do not consider the delay-sensitive MFs transmission, which may lead to an increase in the average round-trip delay of MFs and the degradation of QoS.
2.3 Traffic Scheduling Considering Quailty of Service
When the network is overloaded or congested, Qos can ensure that critical services are delivered without delay or packet loss while also ensuring the network’s efficiency. As a result, researchers have paid close attention to traffic scheduling engineering for Qos.
Guo et al. [17] designed a quality-of-service oriented SDN global multipath traffic scheduling algorithm (QOGMP). The forwarding rules of flows are specified by packet loss, delay, and link capacity, and deep reinforcement learning is used to compute the forwarding paths. A strategy generation network is constructed, reward and penalty functions are set, and the link graph collected from the data layer is used as input to continuously iteratively update the weights of the links to obtain the path scheme finally.
Zaher et al. [18] propose a framework based on distributed software-defined networking (Sieve). Sieve initially schedules only a portion of the traffic based on available bandwidth, sending a part of the packets to the controller through a distributed sampling technique. In addition, Sieve periodically polls the edge switches and redistributes only for EFs, while MFs are scheduled based on ECMP. Qos of the network is guaranteed by isolating EFs and MFs to improve the completion time of data flows and reduce sampling overhead and ECMP-related data flow conflicts.
Lin et al. [19] propose a delay-sensitive data flow scheduling method, which calculates the approximate optimal scheduling based on the instantaneous Qos index, calculates the traffic allocation strategy through the probability matching method and allocates the traffic to multiple end-to-end paths.
These methods take into account the effect of MFs scheduling on network quality of service, which can reduce the increase of round-trip delay of MFs caused by computation overhead and effectively improve Qos. However, considering the path load of the flow table is necessary for the link bandwidth to be effectively utilized.
2.4 Traffic Scheduling Considering Load Balancing
Wu [20] proposes an intelligent multi-layer traffic scheduling scheme based on SDN and deep reinforcement learning. The number of path hops, criticality, and the cost are used as forwarding rules for data flows. Criticality is represented by the number of EFs on the link, and the cost is represented by link bandwidth and delay weighting. A deep Q network is introduced to execute traffic scheduling algorithms on the SDN control plane to obtain the current global optimal strategy based on the real-time traffic demand in the network.
Long et al. [21] put forward a scheduling method that sets the link load threshold according to the load status of the link obtained regularly. If the link load exceeds the threshold, reroute scheduling is carried out for the data flows, and these data flows are scheduled to the link with a light load. Although locality link congestion can be alleviated, traffic is not scheduled from a global perspective.
Hao et al. [22] propose a load balancing algorithm based on the artificial colony, based on the minimum residual bandwidth paths, the number of EFs on the path, and the path of the largest link load conditions, to carry on the linear programming model, get the weight of link cost, using artificial colony algorithm to solve the shortest path set, finally get the optimal path. These methods are based on link bandwidth and load and do not consider the impact of link delay on the network.
These methods take into account the impact of link load on network load balancing, but since the instantaneous load of a network link fluctuates, the load of a link at a certain moment does not exactly reflect the load of the link in the current state.
3 Problem Modeling and Solutions
In this section, we model the data center network traffic scheduling problem and present our solution.
In this paper, the traffic scheduling problem is modeled. In the range of path load capacity, the objective function is optimized by traffic scheduling, so that the traffic can be evenly distributed on each link and the network load balance can be realized. The specific modeling is described as follows:
The data center network topology is expressed as an undirected graph
Through the delay calculation of Link Layer Discovery Protocol (LLDP) [23] and Echo packets, the transmission delay of each link
Count the number of EFs along the path. If there are n links in the feasible path and
In the judgment of EFs, to adapt to different network topology link bandwidths, when the data flow exceeds 10% of the link bandwidth, the data flow is considered as an EFs, and the calculation method is shown in Eq. (5):
Considering the maximum link utilization, delay, and number of EFs as the factors to find the optimal scheduling path of data flows, a data center network multi-objective optimization data model based on multi-constrained linear programming was established. Let the comprehensive objective function F be shown in Eq. (6):
The constraint conditions are shown in Eqs. (7)–(9):
Eq. (7) indicates that the total bandwidth
This paper uses different traffic scheduling methods based on the features of data center service types. Considering the relatively short duration of MFs, it is highly likely that the quality of service will be degraded due to computation loss if it is rerouted. The strategy proposed in this paper is to carry out the isolated transmission for delay-sensitive MFs and bandwidth-sensitive EFs. The EFs prone to network congestion are rerouted through the path optimization module, and the MFs are scheduled by ECMP. The maximum link utilization and the number of EFs on the path represent the possibility of congestion on the path to some extent. Delay is the quality of service on behalf of the network. The multi-objective optimization is transformed into a single-objective optimization by a multi-constrained linear programming model, and the SSA is used to solve the optimal solution of the model, and the data flows on the overloaded link are rerouted and scheduled. Redundant links in the data center network are fully utilized to alleviate network link congestion caused by flow conflicts, ensure user experience, and improve service quality.
To realize the reasonable scheduling of network traffic, the system architecture of this paper includes five modules, such as topology discovery, traffic monitoring, EFs detection, delay detection, path optimization, and configuration flow table, as shown in Fig. 1.

Figure 1: System frame diagram
The controller uses the LLDP and takes the active measurement method to send LLDP packets periodically. According to the packets returned by each switch port, the controller calculates the current topology of the entire network.
The controller sends MULTIPART_REQUEST messages to the switch periodically to query the statistics of the various ports and flow entries. The switch replies to the controller with a MULTIPART_REPLY message.
EFs judgment, if the transmission rate is greater than the set threshold for the network flow, is EFs. MFs adopt an equivalent multipath algorithm to complete the scheduling.
The controller calculates the transmission delay of each link by LLDP protocol and Echo packet delay.
3.2.5 Path Optimization Module
This module is based on the K-shortest paths (KSP) [24] algorithm in the python network x library, through which the path set of k shortest hops between the source and destination hosts can be found. Taking the shortest path set as the initial path set of the SSA can reduce the computational loss caused by an invalid search. According to the obtained topology information and data flow information, the SSA is used to find the ideal transmission path for EFs.
The following describes the overall flow of the traffic scheduling strategy: the edge layer switch receives the flow table sent by the host; If it was directly connected to the destination host, the flow table was sent to the destination host to complete the scheduling. If it was not directly connected, the controller sensed the network topology of the data center. Simultaneously detect the network system condition; If it is an MFs, the equivalent multipath scheduling method is adopted to complete the scheduling. Using the KSP based on hop count, the controller determines the shortest path set between the data source and the destination host for the data flow if it is an EFs. The SSA is used to find the optimal path from the short-circuit set and send the flow table to complete the flow scheduling.
The SSA is a new swarm intelligence optimization algorithm. SSA has the characteristics of high search accuracy and fast convergence speed and is suitable for multi-objective optimization. The disadvantage of the traffic scheduling method based on weight lies in its lack of self-adaptability, sluggish response to the network running state, easy fall into locality optimum, and not making full use of the advantages of SDN global view. Therefore, the SSA is adopted to optimize the path to find the globally optimal path. Firstly, this paper calculates the globally optimal path for EFs based on multiple available path sets obtained by the KSP algorithm as the initialization population of sparrows. The algorithm’s detailed steps are as follows:
Step 1: Initialize the algorithm parameters, including but not limited to the maximum number of iterations
Step 2: According to the solution set of the KSP algorithm as the initial input, the initial population is randomly generated. The position X of all sparrows can be expressed by the following Eq. (11):
m is the number of sparrows and
Step 3: Calculate the fitness value corresponding to each sparrow according to the fitness function equation, and sort them. According to the size of the fitness value, the population is divided into discoverers and entrants, and find the sparrow with the highest and lowest fitness value and the current position. The fitness
The fitness function equation is shown in Eq. (6).
Step 4: Select the former
Step 5: All the remaining sparrows in the population are considered entrants, and their positions are updated according to Eq. (14):
Step 6: Randomly select
Step 7: Get the current updated position. The old position will be updated if the fitness value of the new position is greater than that of the old position.
Step 8: Continue to iterate before the stop condition is met, and finally get the global best fitness value and the optimal traffic scheduling path.
4 Experimental Results and Performance Analysis
4.1 Experimental Environment Setting
This paper uses Mininet [25], a lightweight simulation platform, to build the Fat-tree [26] topology. The Fat-tree topology is widely used by researchers for its high pair of profiling bandwidth and ease of use. Its most prominent feature is that it is based on a common commercial switch architecture, so the network links all have the same bandwidth. This study will seek to use Fat-tree as the network topology for simulation experiments, as depicted in Fig. 2, and sets the link parameters as shown in Table 1. The Ryu [27] controller is used to implement the flow control strategy. Nine data center network traffic models were simulated: random, stag_0.1_0.2, stag_0.2_0.3, stag_0.4_0.3, stag_0.5_0.3, stag_0.6_0.2, stag_0.7_0.2, stag _0.8_0.1. Random indicates that the initiating host selects the peer in a wholly random way and forms a traffic model. Take stag _0.4 _0.3 as an example for other models. Stag 0.4 0.3 denotes that 40% of the overall traffic is contained within the edge layer switch, 30% is included within traffic between edge layer switches, and 30% is contained within traffic between Pods. The experimental findings of each traffic model are averaged after each traffic model is conducted 20 times.

Figure 2: Experimental topology

This section will assess the experiment’s findings to demonstrate the superiority of this approach. The performance indexes include average throughput and normalized total throughput, link utilization, average round-trip delay, and packet loss rate.
4.2.1 Average Throughput and Normalized Total Throughput
Average throughput refers to the average throughput of a network per unit of time; Normalized total throughput refers to the ratio of the actual total throughput of a network to the maximum throughput in an ideal network. The average throughput is shown in Fig. 3, and the normalized total throughput is shown in Fig. 4. Both reflect the network’s capacity to traffic and are the leading performance indicators of this experiment. Table 2 shows the relative performance gains of MCQG by calculating the average values of 9 traffic models.

Figure 3: Average throughput
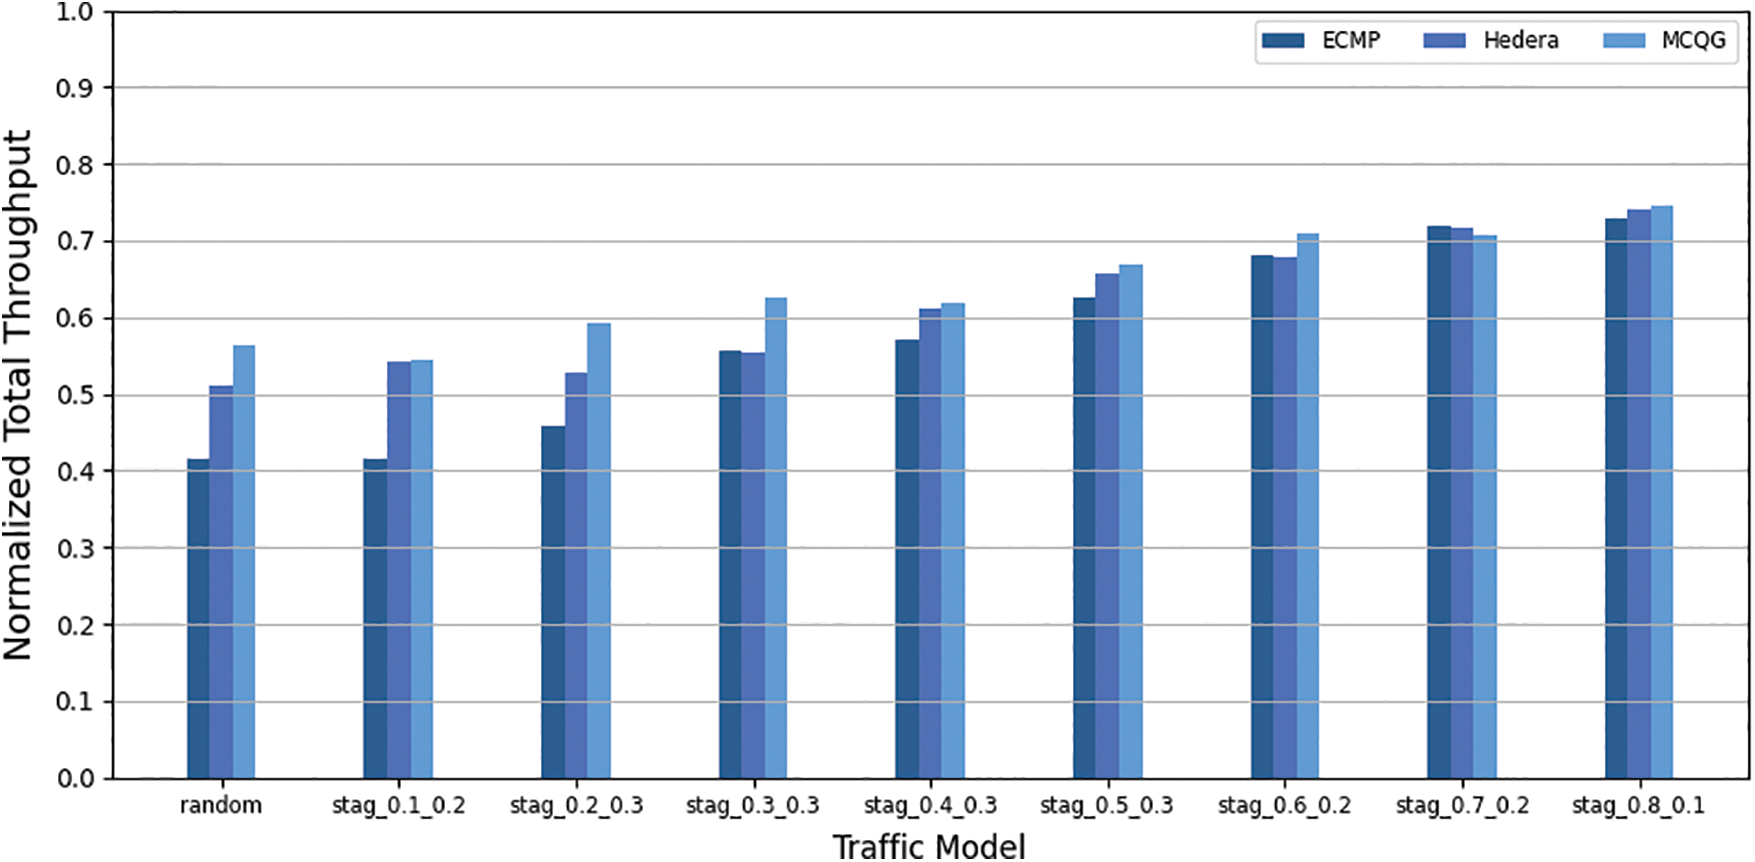
Figure 4: Normalized total throughput

As seen in Figs. 3 and 4, ECMP performed poorly due to the network performance degradation caused by the inability to avoid EFs collisions when the traffic ratio between different pods was higher. Compared with ECMP, Hedera can improve network throughput under different traffic models, proving the effectiveness of polling EFs and evaluating their bandwidth requirements for rerouting scheduling. Compared with ECMP and Hedera, MCQG achieves higher throughput under different traffic models, showing that the path calculation method based on multi-constraint linear programming is better than residual link bandwidth. As shown in Table 2, MCQG increased its average throughput by 11.73% and 4.29% compared to ECMP and Hedera and increased its standardized total throughput by 6.74% and 2.64%.
Link utilization is the ratio of the total number of links to the number of links that the network topology uses. The higher the link utilization, the more evenly the network traffic is distributed in the topology. It may show whether the traffic scheduling technique can fully utilize the remaining network links. The link utilization of the three methods is shown in Fig. 5, and the average increase of MCQG link utilization is shown in Table 3.
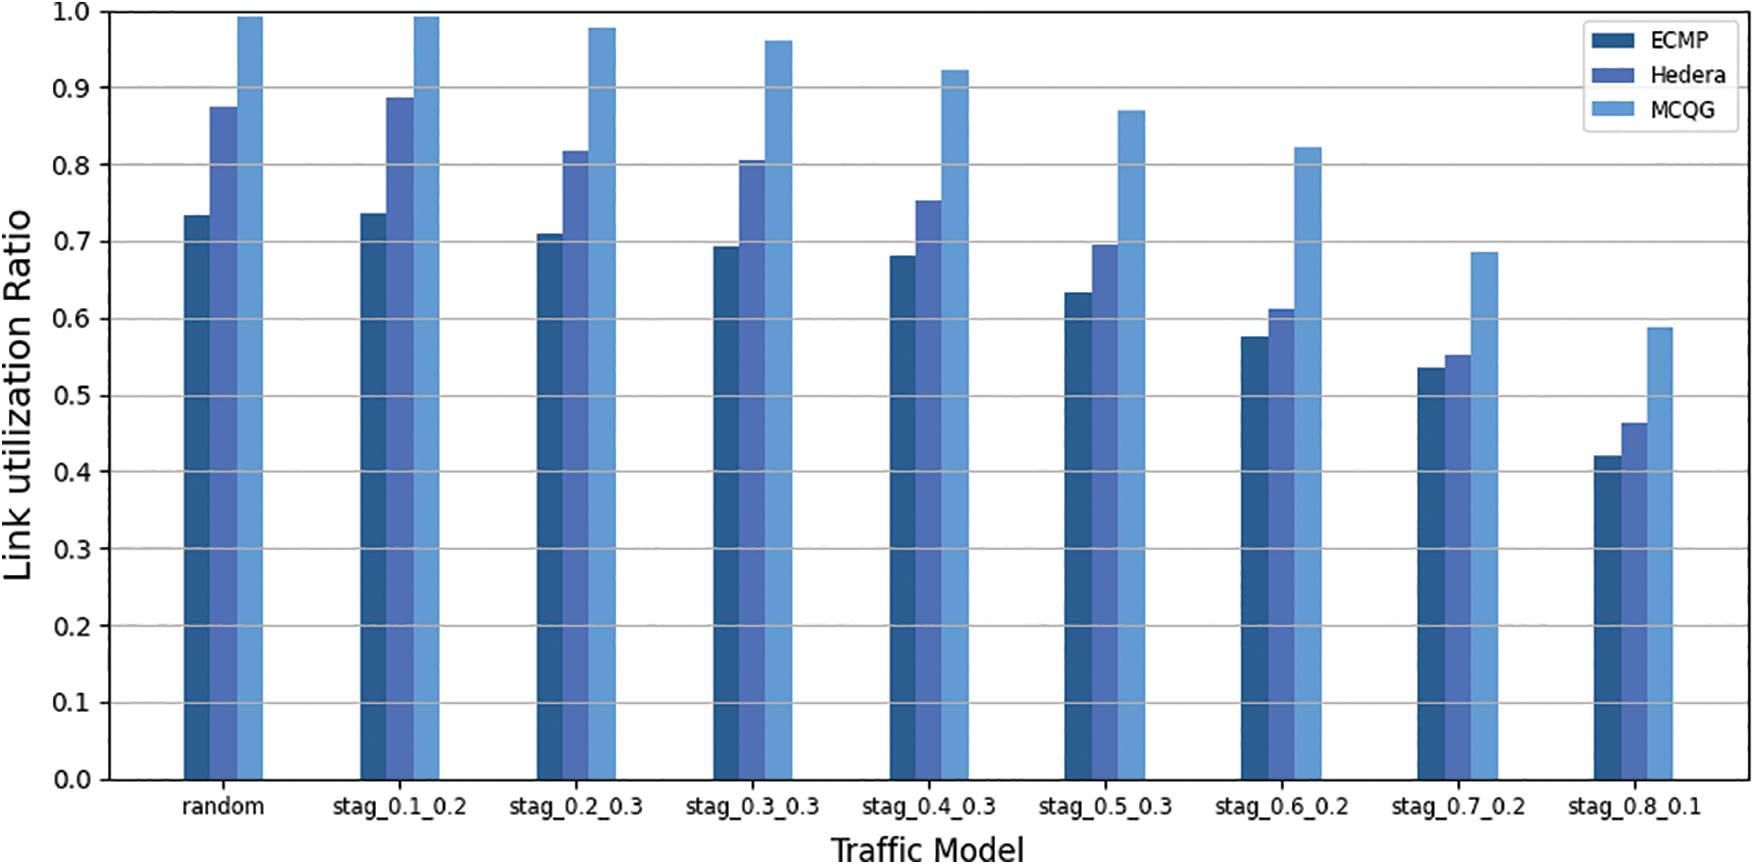
Figure 5: Link utilization

As shown in Table 3, the link utilization of MCQG is 23.25% and 15.07% higher than that of ECMP and Hedera, respectively. As shown in Fig. 5, MCQG performs best under the stag_0.1_0.2 traffic model. Because the stag 0.1 0.2 traffic model reveals that 70% of the total network traffic is generated by traffic between different Pods, it means that there are more link resources available. In several traffic models, MCQG outperforms ECMP and Hedera, demonstrating that this approach can fully utilize the remaining link resources to achieve network load balancing.
4.2.3 Average Round-Trip Delay and Packet Loss Rate
The average packet delay from the source address to the packet reply from the destination address is the “average round-trip delay.” The probability of packet loss is referred to as the packet loss rate. The link packet loss rate is an important performance parameter that reflects the network link status and is the basis for network performance statistics, prediction, and network fault diagnosis. The average round-trip delay and packet loss rate of the three methods are shown in Figs. 6 and 7.
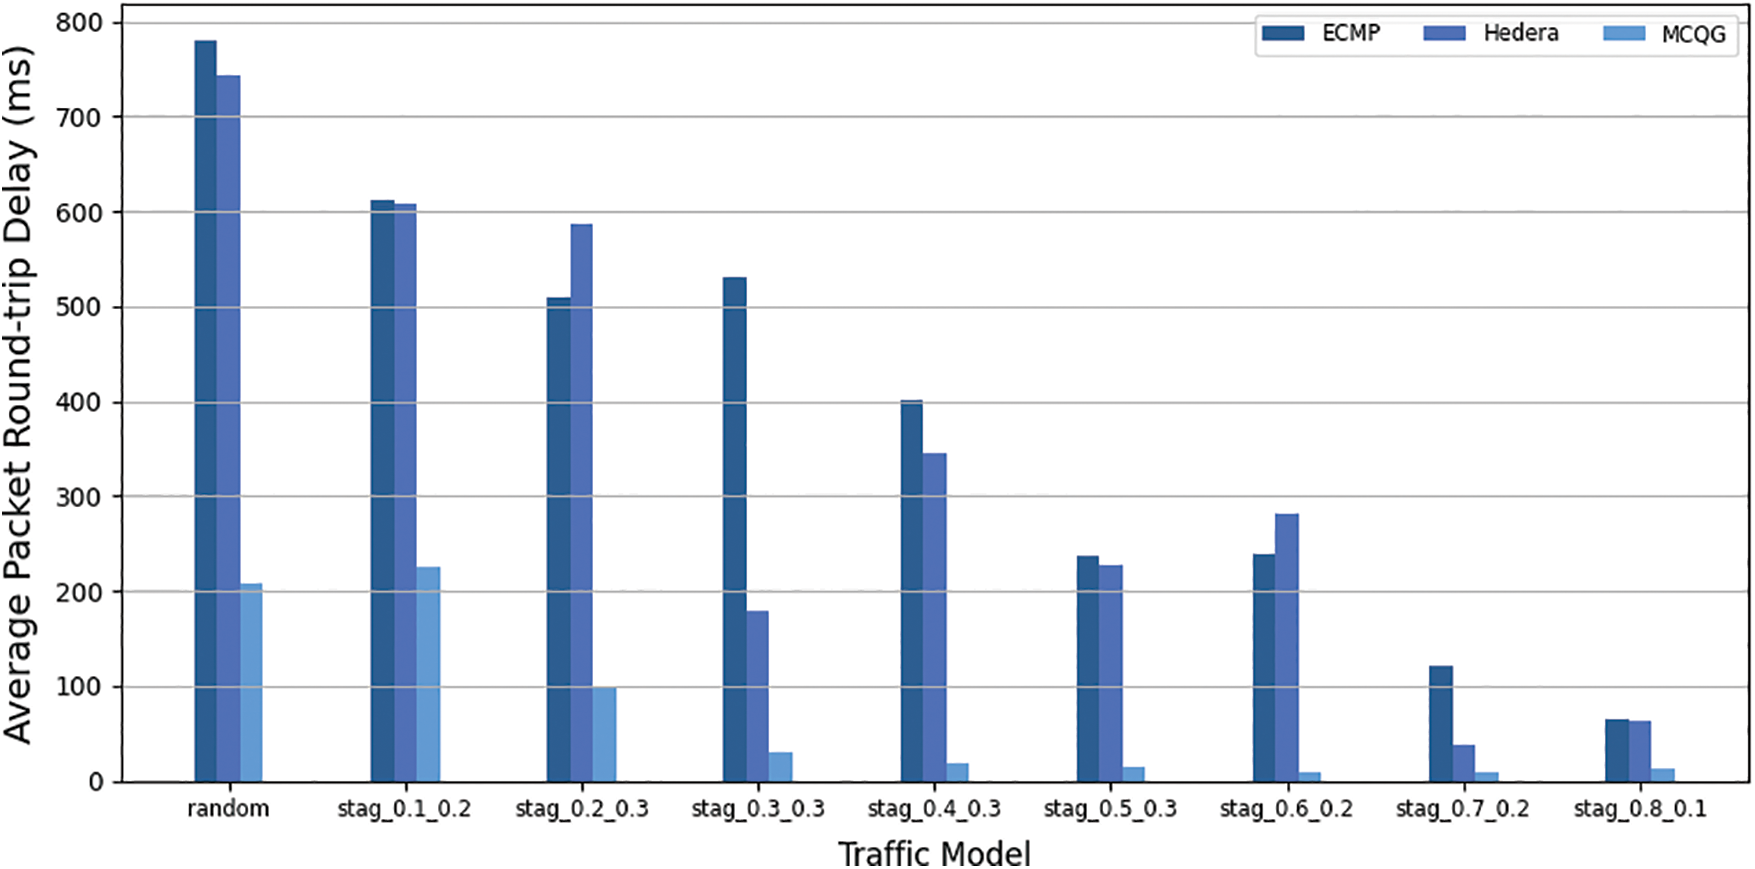
Figure 6: Average round trip delay
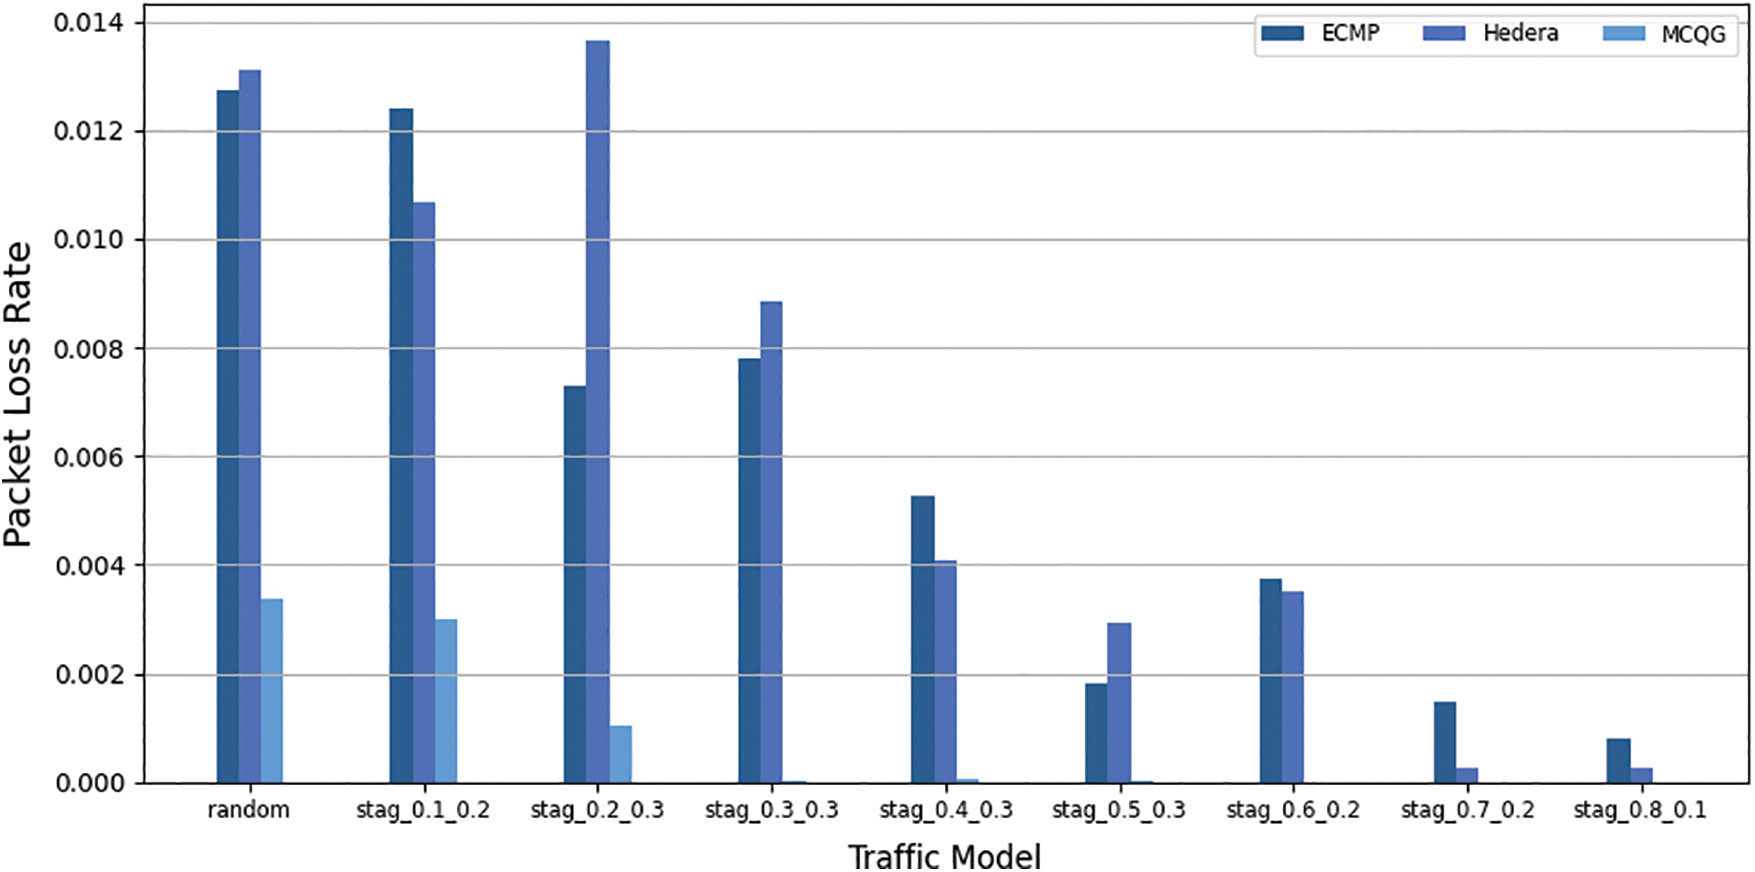
Figure 7: Packet loss rate
Due to the interference of EFs, the average round-trip delay of ECMP and Hedera fluctuates greatly, and the maximum packet loss rates are 1.2% and 1.3% respectively. ECMP, Hedera, and MCQG all transmit MFs using ECMP, but MCQG isolates EFs and MFs so that the transmission of MFs is no longer interfered with by elephant streams, and the average round-trip delay is relatively stable with small fluctuations. It performs better under different traffic models.
This paper aims to solve the problem of unbalanced network load and performance degradation caused by local link congestion caused by data flow conflict in traffic scheduling. We propose a traffic scheduling strategy that MCQG. The approximate optimal scheduling scheme of data flow is obtained through the path calculation method based on multi-constrained linear programming. The effectiveness of the proposed strategy is verified by simulating real traffic scenarios in the data center network. The experimental results show that MCQG improves the average throughput by 11.73% and 4.29%, the normalized total throughput by 6.74% and 2.64%, and the link utilization by 23.25% and 15.07% under different traffic models compared with ECMP and Hedera algorithms. At the same time, MCQG is significantly less volatile than ECMP and Hedera in terms of delay and packet loss rate, proving that the proposed strategy can effectively reduce network congestion and ensure quality of service. After that, the detection of EFs will be further optimized using machine learning or deep learning methods to overcome the drawbacks of constant thresholds in this paper. Furthermore, the next step is configuring the strategy in a real OpenFlow network environment and conducting more experiments to improve the method’s performance.
Acknowledgement: This work was supported by the Research on key technologies of intelligent management of green data center resources based on deep learning, the Key R & D plan of Hubei Province (2020BAB012).
Funding Statement: This work is funded by the National Natural Science Foundation of China under Grant No. 61772180, the Key R & D plan of Hubei Province (2020BHB004, 2020BAB012).
Conflicts of Interest: The authors declare that they have no conflicts of interest to report regarding the present study.
References
1. S. Saraswat, V. Agarwal, H. P. Gupta, R. Mishra, A. Gupta et al., “Challenges and solutions in software defined networking: A survey,” Journal of Network and Computer Applications, vol. 141, pp. 23–58, 2019. [Google Scholar]
2. Cisco, “Cisco annual internet report 2018–2023 white paper,” 2020, [Online]. Available: https://www.cisco.com/c/en/us/solutions/collateral/executive-perspectives/annual-internet-report/white-paper-c11-741490.html [Google Scholar]
3. B. Cao, J. Zhang, X. Liu, Z. Sun, W. Cao et al., “Edge–Cloud resource scheduling in space–Air–Ground-integrated networks for internet of vehicles,” IEEE Internet of Things Journal, vol. 9, no. 8, pp. 5765–5772, 2021. [Google Scholar]
4. Q. Yan, F. R. Yu, Q. X. Gong and J. Q. Li, “Software-defined networking (SDN) and distributed denial of service (DDoS) attacks in cloud computing environments: A survey, some research issues, and challenges,” IEEE Communications Surveys & Tutorials, vol. 18, no. 1, pp. 602–622, 2015. [Google Scholar]
5. A. Lara, A. Kolasani and B. Ramamurthy, “Network innovation using openflow: A survey,” IEEE Communications Surveys & Tutorials, vol. 16, no. 1, pp. 493–512, 2013. [Google Scholar]
6. D. Choudhary and R. Pahuja, “Improvement in quality of service against doppelganger attacks for connected network,” International Journal of Interactive Multimedia and Artificial Intelligence, vol. 7, no. 5, pp. 51–58, 2022. [Google Scholar]
7. M. Hamdan, B. Mohammed, U. Humayun, A. Abdelaziz, S. Khan et al., “Flow-aware elephant flow detection for software-defined networks,” IEEE Access, vol. 8, pp. 72585–72597, 2020. [Google Scholar]
8. M. Caria, A. Jukan and M. Hoffmann, “SDN partitioning: A centralized control plane for distributed routing protocols,” IEEE Transactions on Network and Service Management, vol. 13, no. 3, pp. 381–393, 2016. [Google Scholar]
9. J. Zhang, F. R. Yu, S. Wang, T. Huang, Z. Y. Liu et al., “Load balancing in data center networks: A survey,” IEEE Communications Surveys & Tutorials, vol. 20, no. 3, pp. 2324–2352, 2018. [Google Scholar]
10. L. Lu, “Multi-path allocation scheduling optimization algorithm for network data traffic based on SDN architecture,” IMA Journal of Mathematical Control and Information, vol. 37, no. 4, pp. 1237–1247, 2020. [Google Scholar]
11. M. Karakus and A. Durresi, “Quality of service (QoS) in software defined networking (SDNA survey,” Journal of Network and Computer Applications, vol. 80, pp. 200–218, 2017. [Google Scholar]
12. R. Amin, M. Reisslein and N. Shah, “Hybrid SDN networks: A survey of existing approaches,” IEEE Communications Surveys & Tutorials, vol. 20, no. 4, pp. 3259–3306, 2018. [Google Scholar]
13. J. K. Xue and B. Shen, “A novel swarm intelligence optimization approach: Sparrow search algorithm,” Systems Science & Control Engineering, vol. 8, no. 1, pp. 22–34, 2020. [Google Scholar]
14. M. Al-Fares, S. Radhakrishnan, B. Raghavan, N. Huang and A. Vahdat, “Hedera: Dynamic flow scheduling for data center networks,” in Proc. NSDI, Berkeley, CA, USA, pp. 89–92, 2010. [Google Scholar]
15. J. B. Xiao, S. Chen and M. Sui, “The strategy of path determination and traffic scheduling in private campus networks based on SDN,” Peer-to-Peer Networking and Applications, vol. 12, no. 2, pp. 430–439, 2019. [Google Scholar]
16. S. Abdollahi, A. Deldari, H. Asadi, A. Montazerolghaem and S. M. Mazinani, “Flow-aware forwarding in SDN datacenters using a knapsack-PSO-based solution,” IEEE Transactions on Network and Service Management, vol. 18, no. 3, pp. 2902–2914, 2021. [Google Scholar]
17. Y. Guo, G. Hu and D. Shao, “QOGMP: QoS-oriented global multi-path traffic scheduling algorithm in software defined network,” Scientific Reports, vol. 12, no. 1, pp. 1–12, 2022. [Google Scholar]
18. M. Zaher, A. H. Alawadi and S. Molnár, “Sieve: A flow scheduling framework in SDN based data center networks,” Computer Communications, vol. 171, pp. 99–111, 2021. [Google Scholar]
19. C. Lin, Y. Bi, H. Zhao, Z. Liu, S. Jia et al., “DTE-SDN: A dynamic traffic engineering engine for delay-sensitive transfer,” IEEE Internet of Things Journal, vol. 5, no. 6, pp. 5240–5253, 2018. [Google Scholar]
20. G. Wu, “Deep reinforcement learning based multi-layered traffic scheduling scheme in data center networks,” Wireless Networks, pp. 1–12, 2022. https://doi.org/10.1007/s11276-021-02883-w [Google Scholar] [CrossRef]
21. X. X. Long, C. Yun, H. L. Yun and K. Anup, “MTSS: Multi-path traffic scheduling mechanism based on SDN,” Journal of Systems Engineering and Electronics, vol. 30, no. 5, pp. 974–984, 2019. [Google Scholar]
22. Y. G. Hao, W. M. Qing and Y. Xu, “A data center load balancing algorithm based on artificial bee colony algorithm,” in Proc. ICCC, Chengdu, SC, China, pp. 1770–1775, 2020. [Google Scholar]
23. A. Nehra, M. Tripathi, M. S. Gaur, R. B. Battula and C. Lal, “SLDP: A secure and lightweight link discovery protocol for software defined networking,” Computer Networks, vol. 150, pp. 102–116, 2019. [Google Scholar]
24. J. Y. Yen, “Finding the k shortest loopless paths in a network,” Management Science, vol. 17, no. 11, pp. 712–716, 1971. [Google Scholar]
25. A. Frömmge, D. Stohr, J. Fornoff, W. Effelsberg and A. Buchmann, “Capture and replay: Reproducible network experiments in mininet,” in Proc. ACM SIGCOMM, Florianopolis, SC, Brazil, pp. 621–622, 2016. [Google Scholar]
26. Z. Y. Guo, J. Duan and Y. Y. Yang, “On-line multicast scheduling with bounded congestion in fat-tree data center networks,” IEEE Journal on Selected Areas in Communications, vol. 32, no. 1, pp. 102–115, 2013. [Google Scholar]
27. M. Islam, N. Islam and M. Refat, “Node to node performance evaluation through RYU SDN controller,” Wireless Personal Communications, vol. 112, no. 1, pp. 555–570, 2020. [Google Scholar]
Cite This Article
 Copyright © 2023 The Author(s). Published by Tech Science Press.
This work is licensed under a Creative Commons Attribution 4.0 International License , which permits unrestricted use, distribution, and reproduction in any medium, provided the original work is properly cited.
 Downloads
 Citation Tools