
 Submit a Paper
 Propose a Special lssue
 Open Access
ARTICLE

Improved HardNet and Stricter Outlier Filtering to Guide Reliable Matching
1 Queen Mary University of London, London, E14NS, UK
2 Didi Chuxing, Beijing, 100193, China
3 Peking University, Beijing, 100091, China
* Corresponding Author: Pengfei Xu. Email:
Computers, Materials & Continua 2023, 75(3), 4785-4803. https://doi.org/10.32604/cmc.2023.034053
Received 05 July 2022; Accepted 28 September 2022; Issue published 29 April 2023
 View Full Text
 Download PDF
Abstract
As the fundamental problem in the computer vision area, image matching has wide applications in pose estimation, 3D reconstruction, image retrieval, etc. Suffering from the influence of external factors, the process of image matching using classical local detectors, e.g., scale-invariant feature transform (SIFT), and the outlier filtering approaches, e.g., Random sample consensus (RANSAC), show high computation speed and pool robustness under changing illumination and viewpoints conditions, while image matching approaches with deep learning strategy (such as HardNet, OANet) display reliable achievements in large-scale datasets with challenging scenes. However, the past learning-based approaches are limited to the distinction and quality of the dataset and the training strategy in the image-matching approaches. As an extension of the previous conference paper, this paper proposes an accurate and robust image matching approach using fewer training data in an end-to-end manner, which could be used to estimate the pose error This research first proposes a novel dataset cleaning and construction strategy to eliminate the noise and improve the training efficiency; Secondly, a novel loss named quadratic hinge triplet loss (QHT) is proposed to gather more effective and stable feature matching; Thirdly, in the outlier filtering process, the stricter OANet and bundle adjustment are applied for judging samples by adding the epipolar distance constraint and triangulation constraint to generate more outstanding matches; Finally, to recall the matching pairs, dynamic guided matching is used and then submit the inliers after the PyRANSAC process. Multiple evaluation metrics are used and reported in the 1st place in the Track1 of CVPR Image-Matching Challenge Workshop. The results show that the proposed method has advanced performance in large-scale and challenging Phototourism benchmark.Keywords
The image matching task aims to find correspondences in pixel-level [1] in the same real area of the image pair that has a co-visible view [2], the correspondences are established through the similarity and consistency of texture, feature, structure, etc. Image matching method is the basic process of further 3D high-level computer vision problems, such as object detection, video compression and tracking, vision-based localization, etc. Traditional image-matching algorithms are affected by environmental changes in practical applications, the main challenge is from the local features trained and tested on the small datasets couldn’t serve downstream tasks [3,4]. In recent years, with the continuous progress of deep learning technology and increment in data scale, the application of convolutional neural networks in the image matching process has become popular to suit long-term large-scale environment tasks.
The image matching method with deep learning strategy could apply multi-stage problems [5,6], and thus can be used in augmenting the performance on large-scale datasets using multiple evaluation metrics. However, the performance for accuracy and robustness also suffers from variable environment features, e.g., lighting variation, perspective change, and repetitive textures, especially in outdoor scenes where the scale and conditions change significantly. To tackle the common issue, end to end algorithms and modified description networks are proposed for the merits of learning more robust features from image pairs. Features using log-polar sampling are generated for improving scale invariance [7]. Further works [8,9] jointly learn feature detectors and descriptors and description to achieve higher accuracy and robustness in image matching.
Based on the previous conference paper [10], in the extended version more constraints are added in three-step processing, which includes extracting features, matching features, and pre-filtering outliers stages, to obtain the image pair corresponding pixels, as illustrated in Fig. 1. Each stage is added constraints to learn better image matching from the algorithm. Not the same as previous methods, this proposed pipeline builds a light-weighted model in an end-to-end manner without separate training on multi-braches. Compared to the previous paper, this study proposes a method which adds triangulation constraint and bundle adjustment optimization in the outlier filtering stage combined with OANet, and describes how the dynamic guided matching (DGM) method recalls matching pairs in detail. Lots of related experiments are also supplemented to verify the effectiveness of the proposed method.
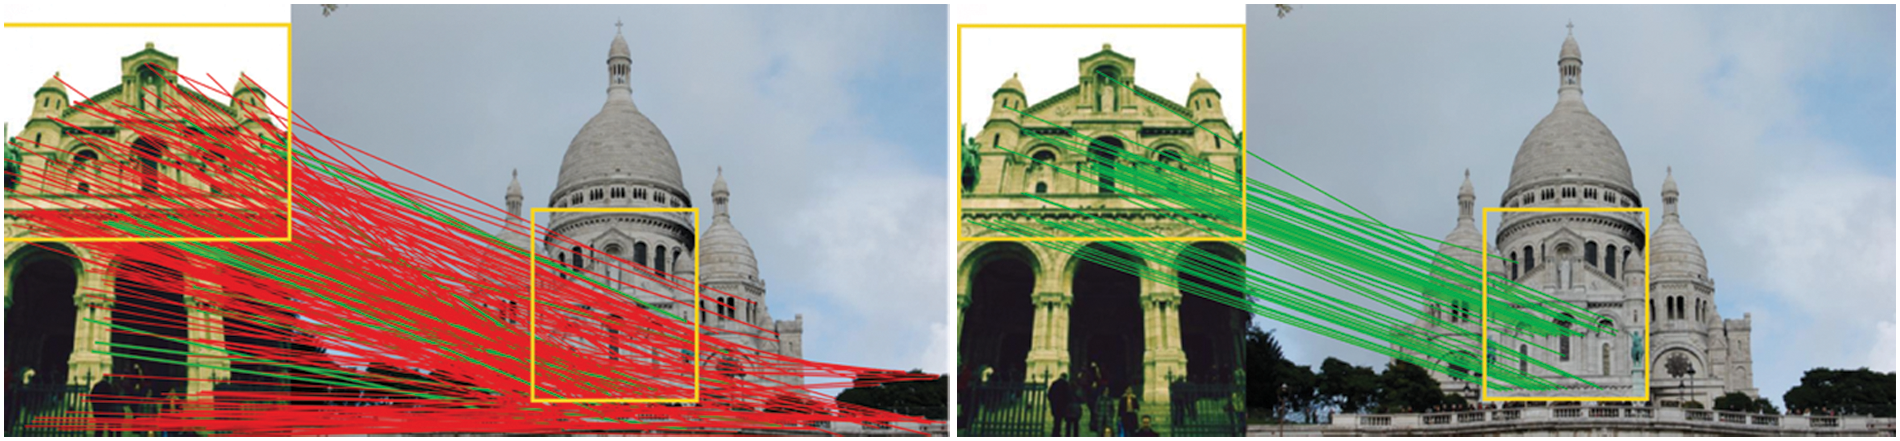
Figure 1: Visualization of the correspondence of SIFT and this proposed method under extreme illumination variation and viewpoint changes (green and red each show correct and wrong matches)
This paper provides a detailed understanding of how the proposed data processing algorithm, feature matching network (based on HardNet [11] network) and modified outlier filtering method (based on OANet [2] combined with a guided matching algorithm (GM) [3]) could serve the pipeline to improve matching performance in accuracy and robustness and validate the method by estimating the pose error. The main contributions are:
• This study proposes a novel patch dataset construction on the basis of the provided Phototourism images, as well as the sparse models, that is with similar formats to UBC Phototour and [4] the pre-trained models;
• This study proposes the modified QHT loss based on feature-description HardNet method, also improves OANet coupled by adding triangulation, bundle adjustment constraint and guided matching algorithm to obtain more reliable feature matches and outlier filterings;
• This research experimentally shows that the proposed algorithm surpasses previous methods and achieves advanced results in large-scale environments and under challenging conditions, ranking 1st on both stereo task and multi-view task with the evaluation of Phototourism benchmark [12].
Feature extraction, matching, as well as outlier pre-filtering play important roles in image matching, nowadays traditional and neural network based methods have been attempted and implemented.
2.1 Local Features in Image Matching
Image matching algorithms can be divided into region-based methods and feature-based methods (including global features and local features), according to whether the matching target is a region similar to the search image information or the structural features in the image. The Region-based image matching methods usually are not robust to image noise and deformation and have high computational complexity and slow matching speed. The global feature-based matching method extracts the overall low-pixel-level features of the image, but it is not available for the situation where the image has occlusion and overlap.
Local features become popular because the simple and stable features are robust to changes in noise, deformation, illumination, etc. Classical solutions apply handcrafted algorithms, such as scale-invariant feature transform (SIFT) [13], Root SIFT [14], Speeded Up Robust Features (SURF) [15], Oriented FAST and Rotated BRIEF (ORB) [16], and AcceleratedKAZE (A-KAZE) [17]. Following keypoints from SIFT, learnable descriptors trained on pre-cropped patches, in that LogPolar [7] depicts better relative pose performance compared to ContextDesc [18]. SOSNet [19] and HardNet exceed Group Invariant Feature Transform (GIFT) [20] in public validation dataset. SIFT-like detectors are replaced to learn keypoints by training networks, such as Temporally Invariant Learned Detector (TILDE) [21], QuadNet [22], and Key.Net [23]. According to the feature detection and description orders, end-to-end approaches, e.g., SuperPoint [24], R2D2, D2-Net, DEep Local Feature (DELF) [25], are all in an end-to-end manner. However, these methods are with low efficiency in matching and storing or poor performance in challenging conditions.
2.2 Outlier Pre-Filtering for Robust Matching
Classical outlier filtering approaches conclude ratio-test [13], Grid-based motion statistics (GMS) [26], guided match [3], etc. Deep learning based methods judge and filter the outlier matches by regressing the pose relationships through convolutional networks, however, the network is hard to converge when training. Another approach converts the pose to a judgement of if the matching is an inlier or outlier by applying the epipolar constraints, which transforms the regression task to a classification task, in which the model applies binary-cross entropy loss in the training process.
Deep learning based methods are required to be not sensitive and thus could obtain transformations with the unordered input image pairs. Inspired by PointNet [27], CNe [2] uses multi-layer weight sharing perception strategy to make this network unrelated to the correspondence sequence. Every input match pair shares a same perceptron for iteration processing, which leads to the separate process of every matching pair and lacks circulating information, thus couldn’t integrate the useful information from all matched image pairs. Context normalization [28] is instantly frequently applied in image-style transferring tasks [29] and Generative Adversarial Network (GAN) [30], which normalizes, exchanges and circulates the correspondence outputs. However simply using the mean-variance couldn’t make use of the global features with high-complexity, thus couldn’t obtain the correlation data across separate modules.
OANet [2] proposes to apply DiffPool, as well as DiffUnPool modules to speed up data circulation and conenction with network neurons. Guided matching [3] could increase automated matching percentage and recall matching pairs in the image pairs with few corresponding points, guided matching, triangulation constraint and bundle adjustment optimization can be used as a supplement to OANet to further improve matching performance.
In order to compute more precise and reliable pose from the provided image matches or 3D reconstruction in large-scale challenging conditions through image matching based method, the following aspects should be improved: 1) stable and accurate keypoints need to be obtained invariably; 2) reliable and distinct descriptors from different environmental conditions should be provided; 3) Powerful outlier pre-filtering ability to filter wrong matches and recall correct matches. This network uses HardNet as the baseline model and re-training it on training scenes of the Phototourism dataset. The SIFT method is used to extract keypoints and patches and reconstruct 3D models with known poses from given sparse models. In particular, this study proposes a dataset construction method for hyperparameters optimization ahead of the network training with small-scale datasets and proposes the QHT loss function for feature descripting on the basis of the HardNet in the outlier filtering period, this study combines the dynamic guided matching with a modified stricter OANet to learn matches with higher accuracy.
Fig. 2 shows an overview architecture of the pose estimation method on the basis of image matching, containing several public approaches, as well as the selected algorithms. Firstly, each scene inputs
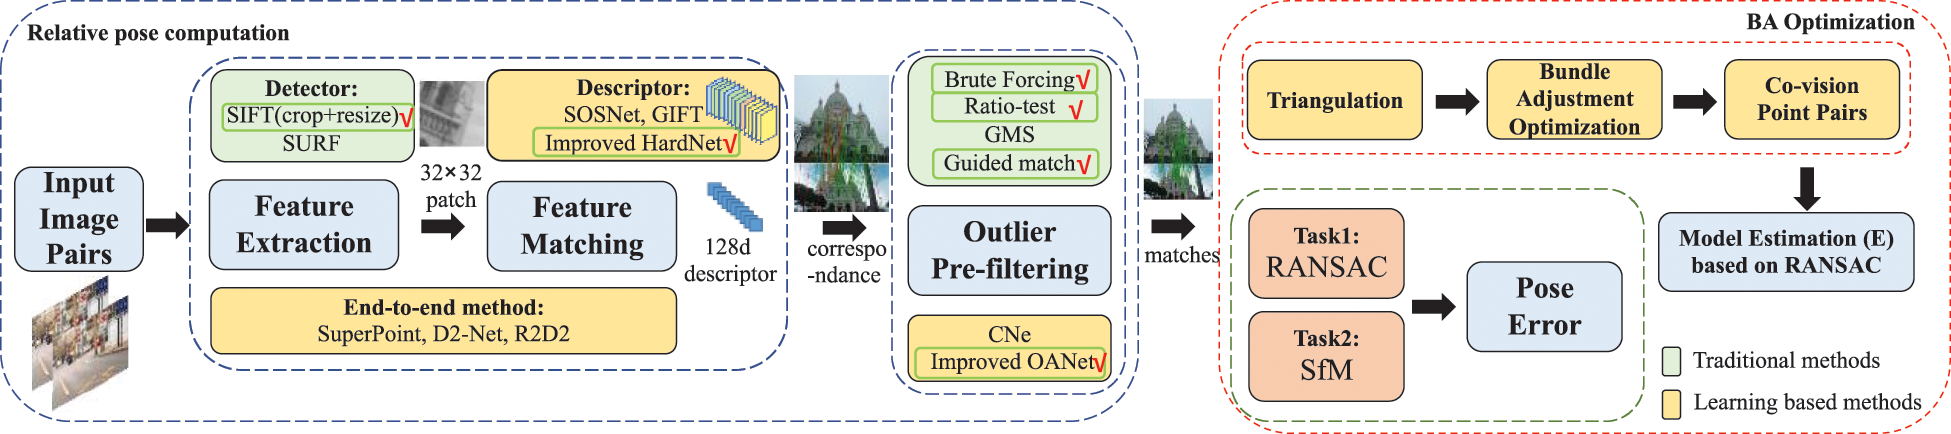
Figure 2: Architecture overview: pose estimating method overview based on image matching, the green box specifies the selected methods to improve, a SIFT feature detector is used with the improved HardNet to generate a 128-dimensional descriptor, the correspondences are generated through nearest neighbour matching and outlier filtering to compute the pose estimation
3.1.1 The UBC Dataset Generation for Pretraining
For faster training a light-weighted pipeline, as well as searching for appropriate hyperparameters for further use in the pre-trained models, UBC Phototour is applied in the pre-training process, whose patch images are very suitable for HardNet training. Table 1 shows the construction information of UBC Phototour.

3.1.2 Phototourism Dataset Construction for Training
This research constructs a low-noise and less-redundancy dataset through the Phototourism dataset with the pre-training process on the reconstructed UBC Phototour in order to quicker hyper-parameter selection in the training process. Eliminating the unnecessary data could speed up the training process to a great extent while reducing noise labels optimizes the gradient descent and could improve the pipeline’s performance.
A discard threshold is set to decrease the noise label when images have low confidence by tracking at least 25% 3d points. While eliminating redundant data, the 3d-points are sampled if results are tracked over 5 times. By repeating the sampling process for ten times while the Normalized Cross-Correlation (NCC) number is computed for every sample, and result with the smallest NCC is reserved. Additionally, data enhancement strategies with random-flip and random-rotation are employed in both pre-training and training periods.
3.2 The Feature Extraction and Feature Matching by Improved HardNet
When extracting features, which consists of feature detection and description processes, SIFT [13] is the first method that extracts the input image’ positional and scale information of the chosen keypoint. This model adopts SIFT (implemented by the OpenCV) with a small detection threshold by obtaining not larger than 8000 points with a fixed-orientation.
The real-valued convolutional HardNet network is selected to describe the keypoint of input images. For describing the keypoint and its surrounding information, the keypoint is clipped into a patch with aligning to the scale size (32 × 32), then patches are extracted to descriptors from HardNet network. Through the seven-layers HardNet, the feature with a 128-dimensional vector is generated from the input patch. The network retains Visual Geometry Group Network (VGG) [31] style network structure which contains convolutional layers with batch normalization and ReLU activation and makes progressions to the loss function to train the pipeline on the large-scale reconstructed dataset in a stable and efficient way.
To measure the performance of the local feature description task, HardNet applies the triplet margin loss [32] to learn closer positive corresponding patches than noncorresponding patches, which embeds the difficult sample mining. To decrease the difference of the descriptors in the internal class while increasing the difference of the descriptors in the external classes, as well as make the model training more effective and stable, a QHT loss on the basis of triplet loss is proposed by adding a square term. The corresponding positive descriptor pairs are denoted as
where the margin M is set to 1,
Quadratic Hinge triplet loss weights the network’s gradients regarding the parameters through the value of the QHT loss. In comparison to HardNet, QHT loss improves the training gradient’s sensitiveness, and also makes the model more stable. A larger
3.3 Outlier Filtering with Stricter OANet and Bundle Adjustment
When the input data is unordered, traditional filtering algorithms are not feasible with convolutional or fully-connected layers for training. CNe network uses multi-layer weight-sharing perceptrons and context norms to individually process each keypoint, which cannot capture the local context and overlooks the underlying complex relations among different points. To solve the above problem and make the output permutation-invariant, training scenes of the Phototourism dataset provided by the organizers are utilized to generate a training dataset with stricter labels. When generating the ground truth for the classification of matches, this study first defines the positive samples by constraining the symmetric epipolar distance [33] of the correspondences less than the threshold of
The OANet can filter out most outliers due to its great ability to capture the local and global context, which jointly uses Diffpool layers, as well as DiffUnPool layers to serve the data circulation and calculation in the internal neurons. Features including N × D matching pairs are fed into the CNe network’s to get the intermediate result with the same dimensions. OANet network uses the Diffpool to decrease the dimension of input matching pairs to M × D, then uses DiffUnpool to increase the dimension into N × D. The information are aggregated by mapping the N matches and M matches through learning a soft distribution of learning weights with the Diffpool layer, while the information are reorganized into N with the DiffUnpool layer. OANet network is not sensitive to disturbances that are not in order and could directly interact between points. Fig. 3 shows the OANet outlier filtering process.
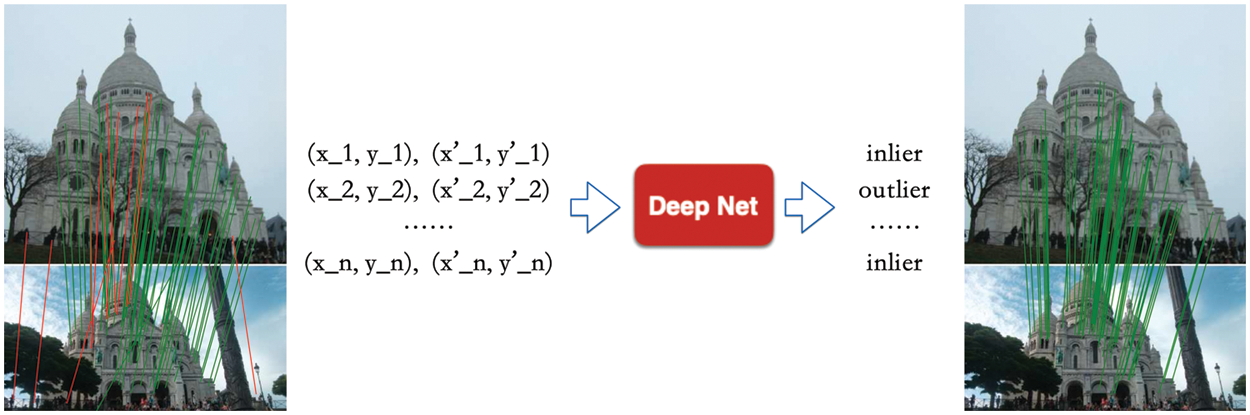
Figure 3: OANet filtering outliers process with deep networks
This research learns the image matching accuracy and then converts it to calculate the pose accuracy. The following improvements have been made to make OANet more capable and effective to learn positive matches and filter exception points, which could improve the accuracy of the matching judgements and the pose estimation performance. This research decreases the geometric error threshold from
In the process of solving the relative pose of the two images, only 7–8 points of information are used to calculate the motion model E. Using more point information can obtain a more accurate motion model and inliers. The input of the bundle adjustment optimization is the image pair, image feature and corresponding image pair (after brute forcing and ratio-test process, before the geometric verification process), and the output is the optimized image point pairs, which could be utilized for further model estimation.
3.4 Matching Pairs Recall with Dynamic Guided Matching
Generally, inadequate matches may lead to inaccurate Random sample consensus (RANSAC) and pose estimation. Except for OANet, the dynamic guided matching (DGM) is also proposed to enhance the matching ability when the matching number of image pairs is less than 100. Contrary to conventional guided-match [3], a dynamic threshold is employed with the Sampson difference limitation in relation to the amount of image pair matchings. This work argues that smaller matches needs higher dynamic threshold. The threshold
where
The problem of inaccurate pose estimation of image pairs caused by insufficient matching and too few matching pairs can be solved by increasing the number of matching pairs by guided matching, which can further improve the accuracy. The specific calculation process is divided into the following steps:
• Calculate the
• Check the epipolar geometry constraint discrimination on the elements in the distance matrix F, which is shown below.
• Filter feature points on the filtered distance matrix through ratio-test and crosscheck, in which the ratio test is the expand ratio test based on the brute force match, usually set as 0.01 to 0.05, and could be adjusted;
• The matching finally needs to be submitted as inliers through the PyRANSAC (a general-purpose RANSAC framework written in Python) process.
The proposed model is trained by improved SIFT, HardNet, and OANet on the Phototourism dataset, 8000 SIFT keypoints and improved HardNet descriptors are first extracted. In improved HardNet training, the training dataset is constructed by using the Phototourism training set provided by organizers as depicted in Section 3.2 and Yosemite from UBC Phototour is adopted as a validation set. Similarly, in stricter OANet training, this work uses the training scenes of the Phototourism dataset and 3 of them (Reichstag, Sacre Coeur and Saint Peter’s Square) are selected for validation.
By cropping the input patch into 32 × 32 through mean and variance normalization, as well as the random flip and rotation in the feature description process. The dropout value p is set to 0.3. Optimization is applied by a Stochastic Gradient Descent (SGD) [33] solver, the learning-rate is set to 10 and decreases to 0 in the first 15 epochs with a weight-decay of 0.0001 with a linear way. A dynamic learning rate strategy is employed in the outlier removal training process, where the learning rate is raised from 0 to the maximum
The proposed pipeline is trained on PyTorch platform [34] with an NVIDIA TitanX card in an end-to-end manner without pre-training models. The co-visible threshold is limited to 0.1 in the stereo task while the minimal number of 3D points is to be set to 100 in the multi-view task, and set the maximum number of evaluation images is 25 in the meanwhile.
This section evaluates the proposed method on the public Phototourism benchmark. The pose estimation result is computed and submitted using the online system. The experiment first conducts the performance of different proposed modules, and then analyzes the effectiveness of this approach in a qualitative and quantitative way.
The performance of local descriptors could be verified on multiple datasets, in which, the datasets [4,12] contain not only image sequences but also keypoint correspondences which are suitable for the training and evaluation in the image matching task. This section describes the datasets in this research.
UBC Phototour dataset1 (Brown dataset) [4] involves corresponding patches from the point cloud 3D reconstructions and dense maps by Bundler [35] and Structure from Motion (SfM) in the city of Liberty, Notre Dame and Yosemite. Each scene includes various images with the high-definition resolution (1024 × 1024), in which every bitmap consists of 16 × 16 image patches. Besides, the dataset separately provides the matching statistics (patch 3D point index) and keypoints’ statistics.
Phototourism dataset (IMW Phototourism 2020 dataset) [12] is collected in 26 famous tourism attractions with multi-sensors for the evaluation of the CVPR Image Matching Workshop 2020, where the ground truth of 3D reconstruction is computed by Structure from Motion (SfM) using Colmap with verified patch correspondences. The ground truth contains poses, co-visibility estimations, depth maps and 2D to 3D point correspondences. This dataset includes a training dataset with 13 scenes, a validation set with 3 scenes and a test set with 10 scenes, which varies from different lighting and viewpoints conditions so as to be widely used as a benchmark dataset on a large scale.
4.1.2 Stereo Task and Multiview Task
This experiment implements and compares the proposed pipeline with multiple methods to evaluate the intermediate results regarding two tasks: stereo and multi-view reconstruction with SfM for further evaluation on pose estimation. The downstream tasks take varying dataset formats as input and evaluate the performance using different ways. The stereo task evaluates a pair of images and applies random sampling consensus method (RANSAC) [36] for obtaining the correspondences with motion consistency, and decompose both rotation and translation value of the pose. Multi-view task computes a cosine distance between the vectors of estimated and ground truth pose in angle, and recovers each image’s pose rotation R and translation t from the 3D reconstruction.
Given two images as a pair with a co-visible view, this research could calculate the following metrics in both stereo or the 3D reconstruction experiments. The performance for the stereo task is evaluated with the metric of Mean Average Accuracy (mAA), keypoint repeatability (Rep.) and descriptor matching score (MS) while the multiview tasks utilize three metric of mAA and Mean absolute trajectory error (mATE). The final results are evaluated in terms of Mean Average Accuracy (mAA) as the primary metric in both tasks.
• False positive rate (%FPR) measures a percentage of the value of wrong items that are incorrectly classified as correct and the whole value of real wrong items at a preset recall value. Having little correlation with the actual performance of the descriptor, this metric is usually used in checking the convergence while training. FPR95 (FPR at 0.95 recall) used in the experiments is defined as follows:
• Mean Average Accuracy (%mAA), analogously to the mean Average Precision (mAP) commonly used in object detection, is measured by the under-the-curve area with a maximal threshold, which indicates the difference of the true and computed pose vector in angle. As the stereo task is defined up to a scale factor problem, the error metric of stereo task mAA is computed from difference errors between the estimated and ground truth pose vectors in angular degrees. If the error is less than the set angle threshold, it means that the estimation is correct, so a binary judgment result of 0 or 1 is obtained, the average accuracy of all matching pairs is the final mAA value. This mAA (@
The formula of mAA metric is calculated as follows:
where N is the number of total image pairs,
• Keypoint repeatability (%Rep.) is often used to evaluate the quality of keypoint detectors, which measures the ratio of the number of corresponding point feature points in the common part of a pile of matched images to the number of feature points that appear in the smaller of the two images in the common area. Specifically, for images A and B to be matched, the homography-matrix of the transformation between the two images is known, and two feature points N1 and N2 are respectively detected in the figure. Since images A and B are partially non-overlapping, first pass the homography-matrix calculates the feature’s coordinates in Figure A in B, and removes the unqualified feature points whose calculation results exceed the coordinate range of Figure B. The number of remaining feature points is recorded as N1, and the remaining number of feature points in Figure B is obtained using the same method N2, Calculate the distance between the feature point of map A and the feature point of map B after mapping. If the coordinate distance is less than the threshold s, it is considered to be repeatable, and the number of repeating feature points is recorded as N3, and the repeatability calculation formula is shown as:
• Descriptor matching score (%MS) describes the mean rate of correctly matched pairs with the minimal value of detected keypoints in a common perspective. The criterion for a correct matching pair is that the distance between the feature vectors of the two is the smallest in the descriptor space.
• Mean Absolute Trajectory Error (%mATE) reports the mean divergence of the ground-truth trajectory of each image by scaling the reconstructed model to that of the ground truth and then align different models by using the minimal point.
4.2 Qualitative and Quantitative Results
The Phototourism dataset construction details are listed in Table 2, which can be viewed as the capability of reducing the number of images, 3d points and patches on a large scale, thus the training speed could be highly increased, which improves the pipeline’s performance. Fig. 4 illustrates the performance under different combinations of training and validation sets in the metric of FRP95 of the UBC Phototour, from that we can conclude that the loss is stable and know the data trend that false matches or difficult matches lead to higher FRP95 values. Fig. 5 compares the correspondence performance between traditional Root SIFT based and the proposed matching approach, with more accurate matches, the proposed method shows an accurate and effective way of image matching.

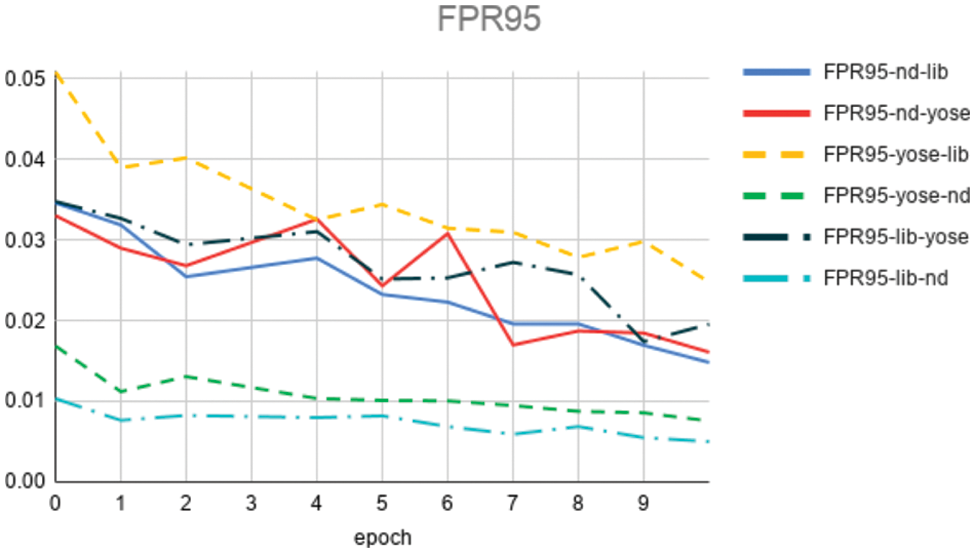
Figure 4: The experimental results on FRP95 metric with different combined training and validation sets on UBC phototour dataset
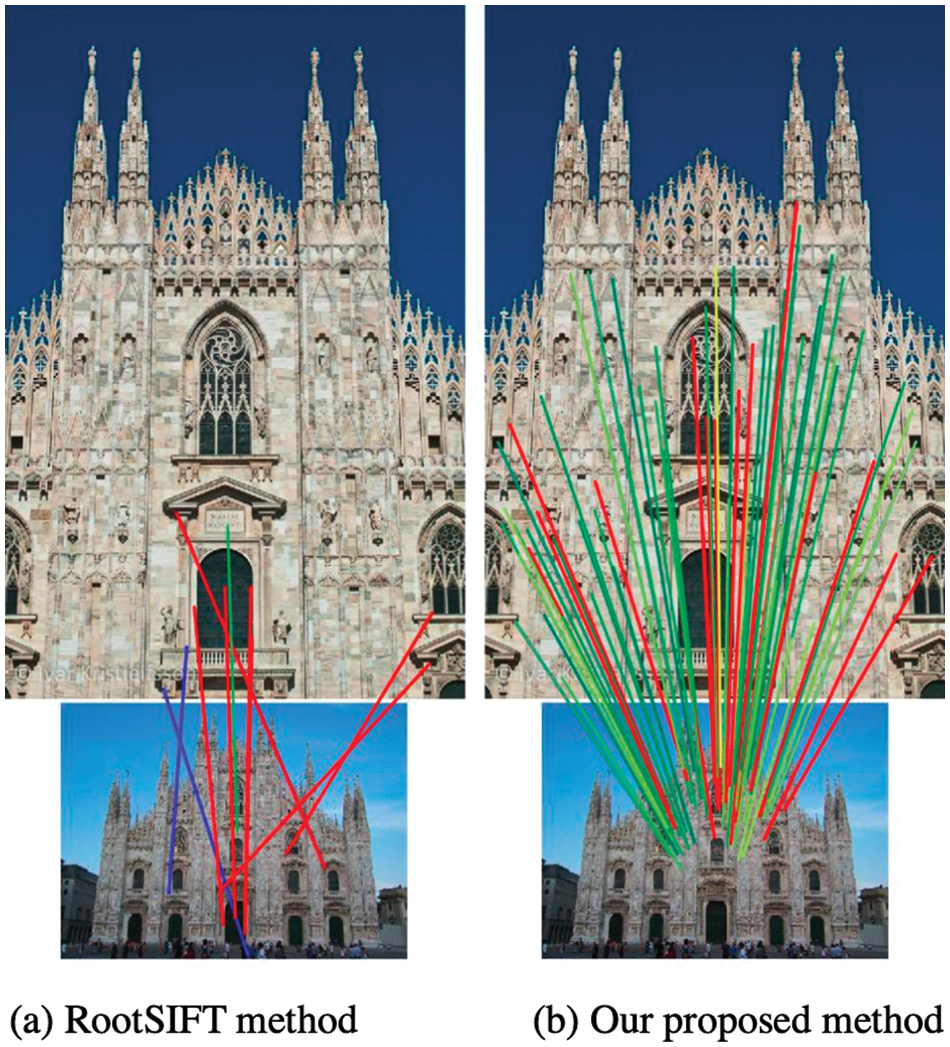
Figure 5: Visualization comparison of the correspondence from traditional root SIFT and proposed method (green indicates right correspondences, yellow shows the match error within 5 pixels, and red represents wrong matching results)
In order to facilitate the selection of training models and data sources, this study has compared different model training results. Table 3 shows the experimental results on different datasets and methods with the metrics of an average number of matches (#matches), an average number of inliers (#geom), a matching score (M.S.), and an inlier matching score (MS_inl), etc. The experimental results indicate that: (1) The results of the self-trained model on the imw2020 validation set under the same data set will be higher than the results of the open source model; (2) The Liberty and NotreDame separately trained models in the UBC data set to have better results. Compared with the HardNetBr6-trained results, all three data sets have a poor effect; (3) Simply increasing the data set does not help the experimental performance, the method of joining the imw2020 training set needs to be carefully selected; (4) It can be seen that the experimental effect is strongly related to the distribution of the data set, and it is not simply the use of patch data.

The effectiveness of the guided matching method is evaluated in Table 4, in which it could be found that the optimal ratio test without guided matching could be used as the initial value of the guided matching tuning parameter. From Table 5 it could be seen that under different initial ratio tests, increasing the ratio test threshold in the guided matching could help to increase the mAA metric. The dynamic guided matching could increase the mAA of the multiview tasks by import expand ratio test, which is indicated by the matching increasing number. There is little difference between the dynamic geometric distance threshold and the fixed threshold. Taking into account the self-adaptability, the dynamic threshold is selected in subsequent experiments.
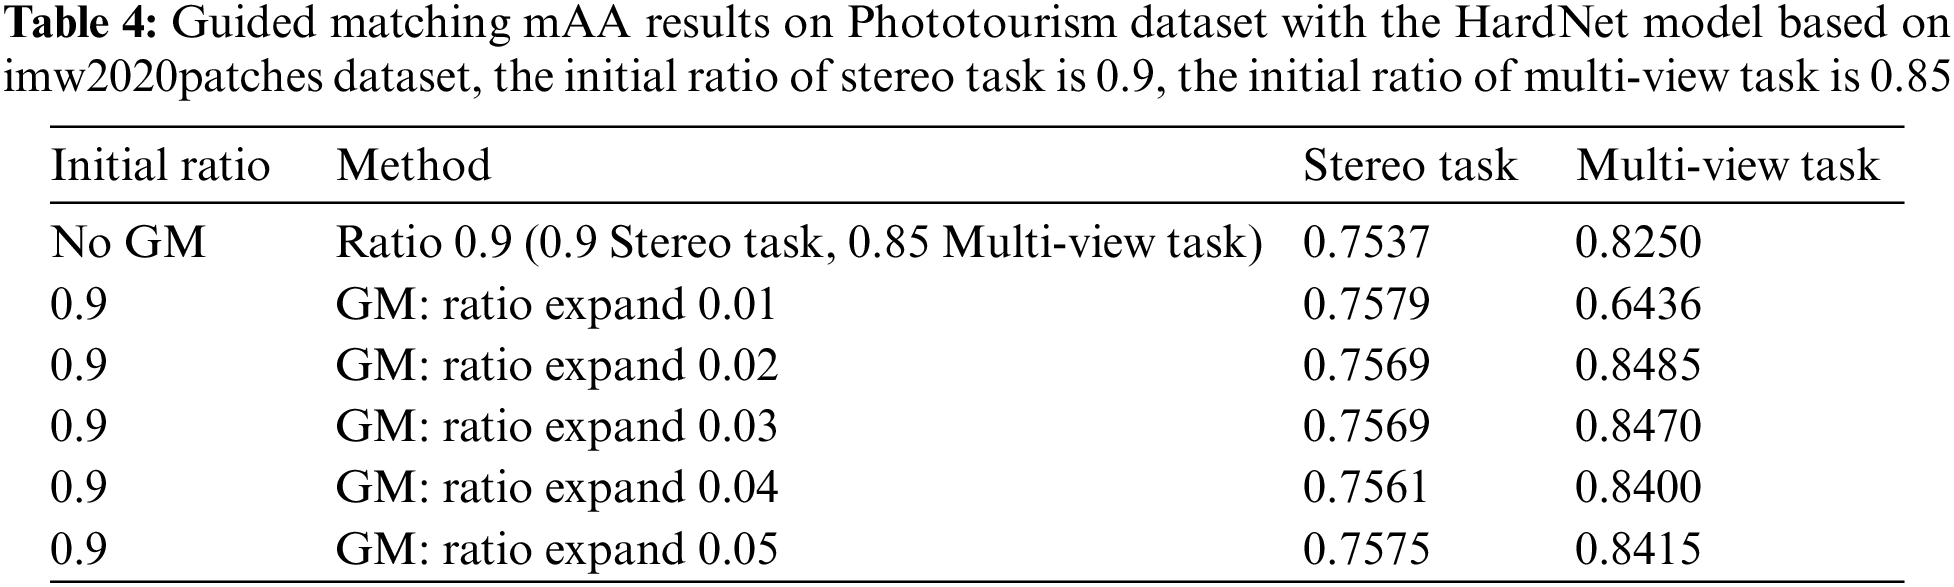
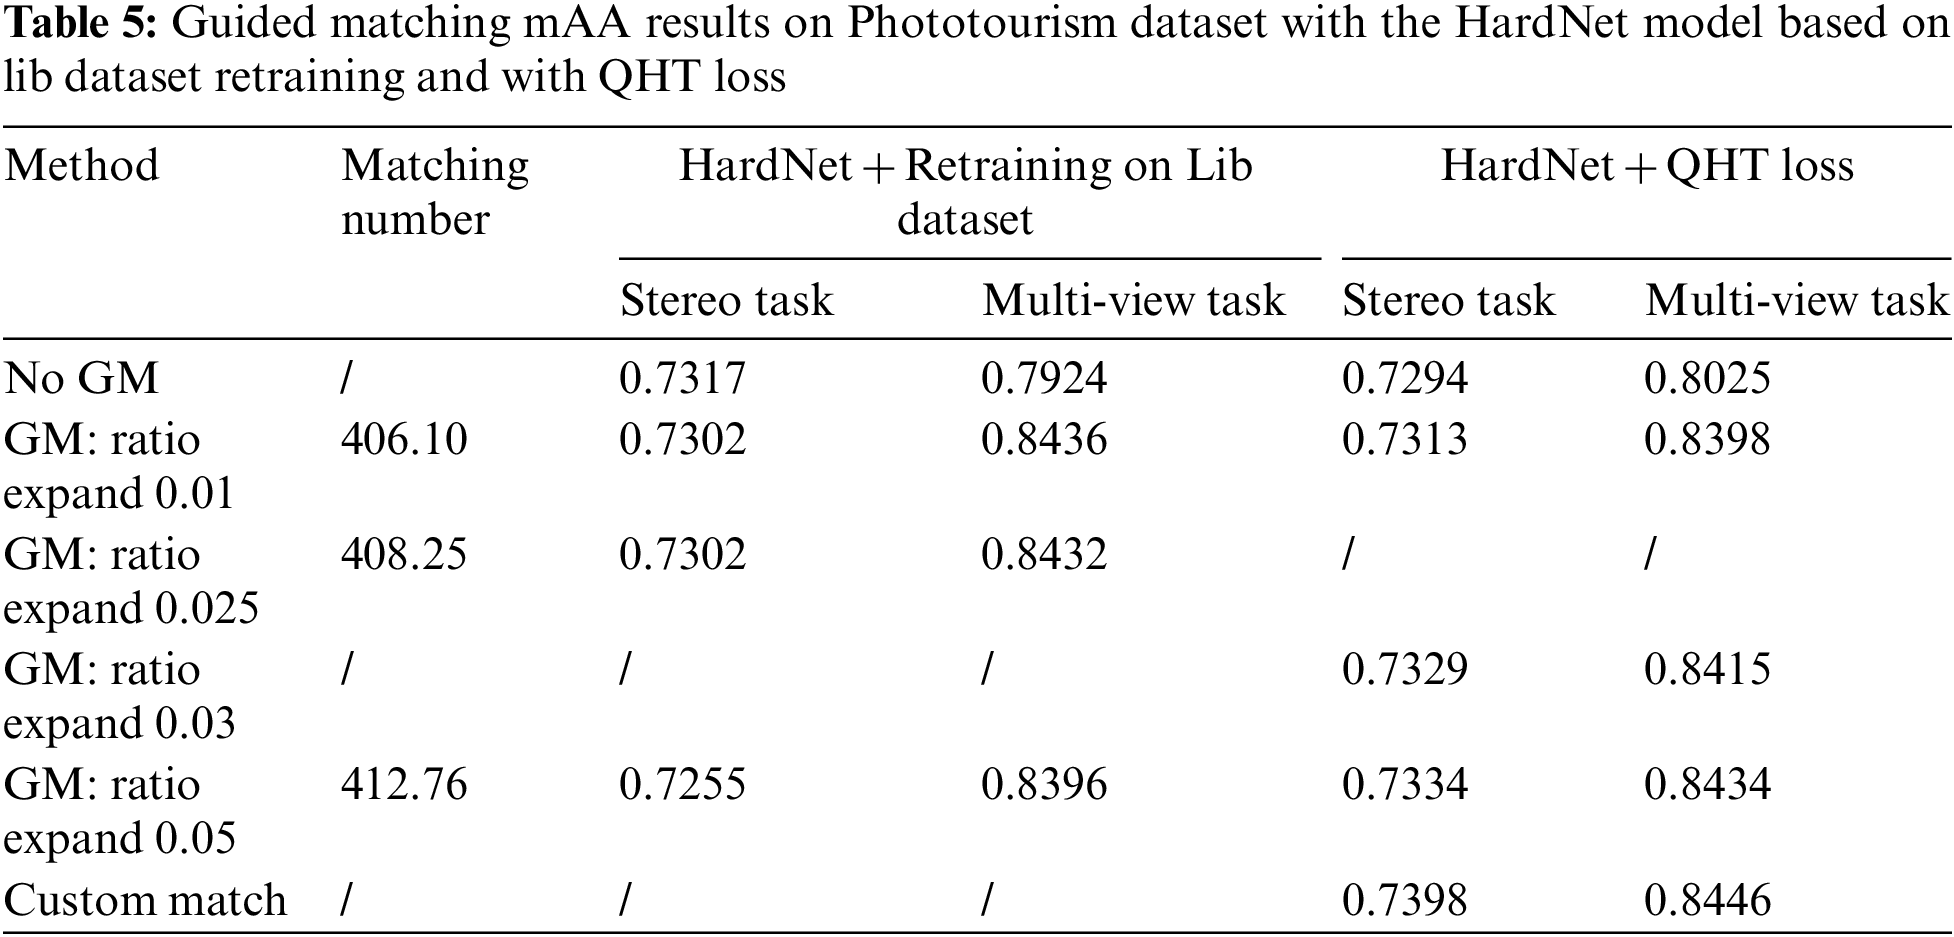
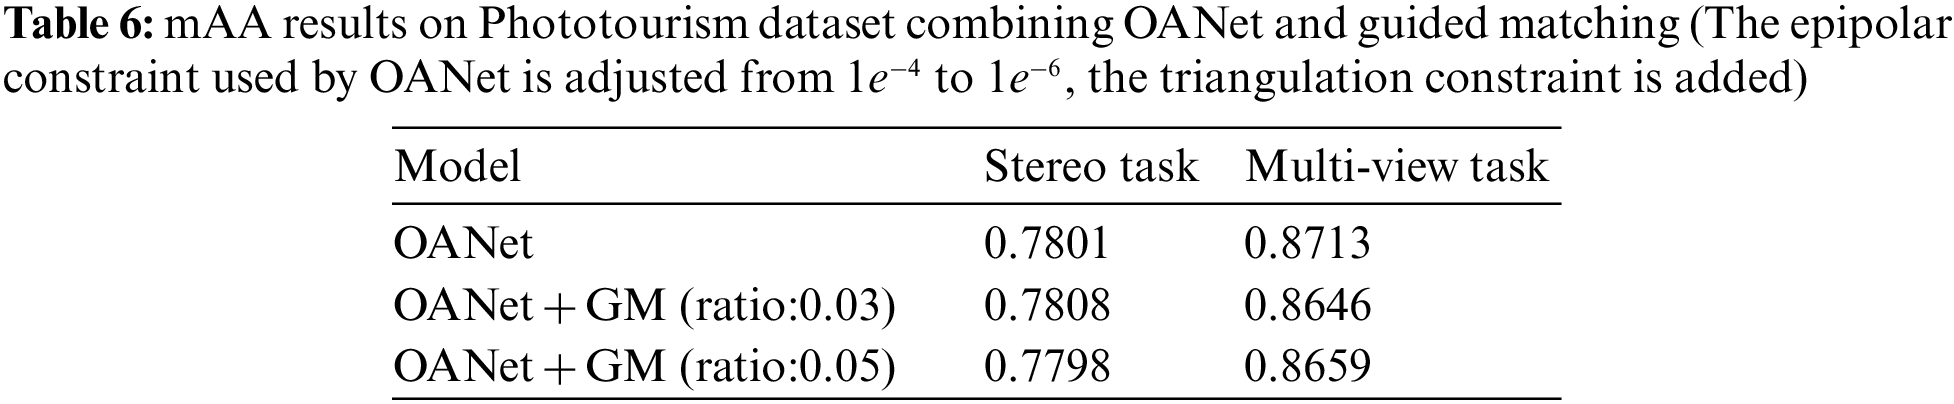
Through these experiments it could be found that guided matching can effectively increase the matching pair number and improve the performance of the HardNet descriptor, which has little impact on the Stereo task, and the improvement is within 0.5 percentage points. For Multiview tasks, the improvement is obvious, which can be increased by 2–5 percentage points. The optimal ratio parameters of HardNet descriptors are generally 0.9 and 0.85 for stereo and multiview tasks, and the optimal matching parameters of the guided match are generally 0.9. On this basis, the ratio expansion is performed, and the optimal guided match parameters can be obtained by testing different ratio expands. This study also uses guided matching and OANet at the same time, as shown in Table 6, but how to improve the generalization ability on the test set needs further experiments.
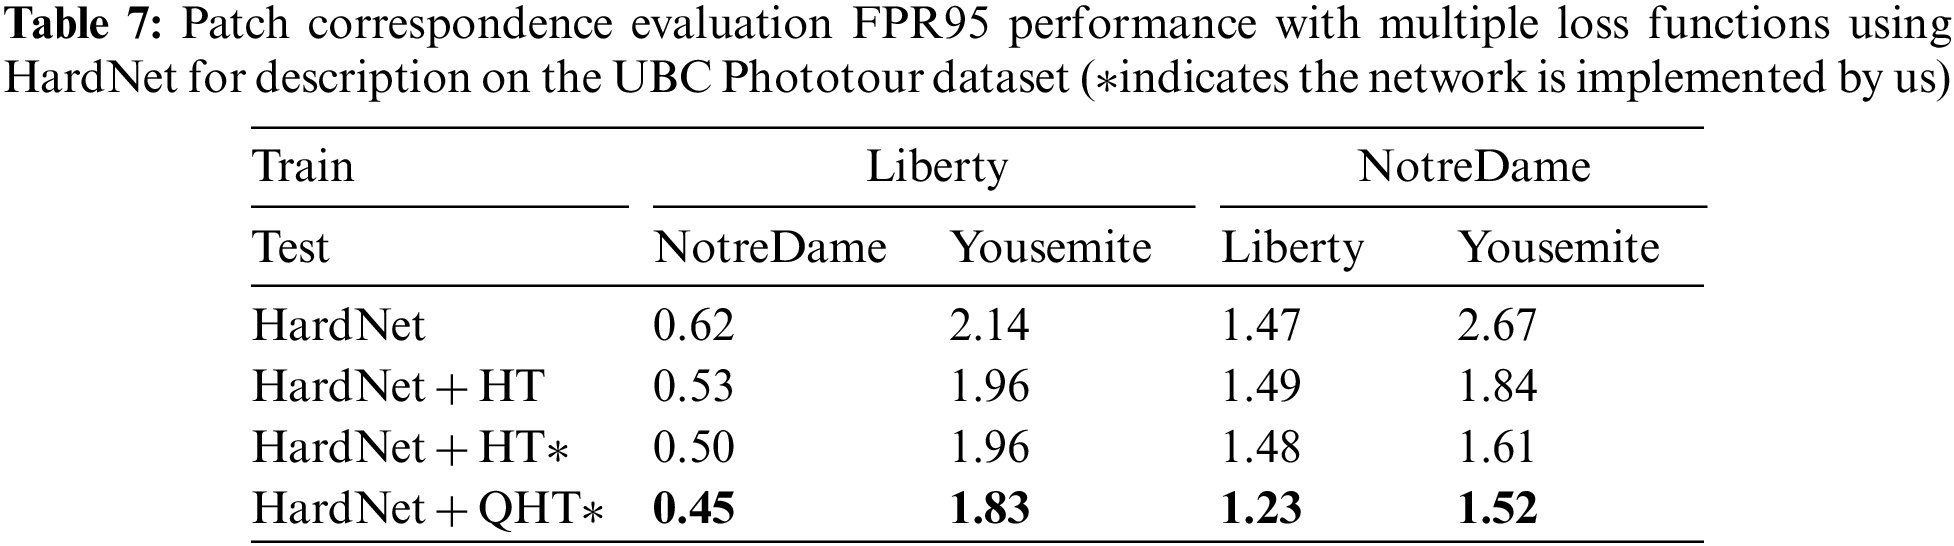
To evaluate the performance of different loss algorithms, Table 7 records the results of correspondence FPR95 on the UBC Phototour dataset, which implies the effectiveness and promotion of the novel QHT loss in comparison to HT (hinge triplet) loss. Table 8 presents the final submissions on Phototourism challenge Track1, this research ranks the best performance on the task.

To separately understand how different module contributes to the proposed pipeline, each module is evaluated on the Phototourism dataset to validate its performance. In Table 9, the proposed method is in comparison to several variants to validate the gain that dataset construction and proposed HardNet can provide in the feature description process and thus benefit the evaluation in both multi-view and stereo sub-tasks. This experiment evaluates the next four versions for the feature description when other components keep invariant: 1) Root SIFT; 2) pre-trained HardNet; 3) the modified HardNet method; 4) the modified HardNet with the dataset construction and cleaning strategy. With the modified HardNet and its constraints in loss functions, the mAA shows an 8% increment in mAA of stereo and multi-view tasks compared to the traditional feature descriptors. Furthermore, the data construction and cleaning strategy help the mAA obtain mAA of 0.7894, which yields the best performance.
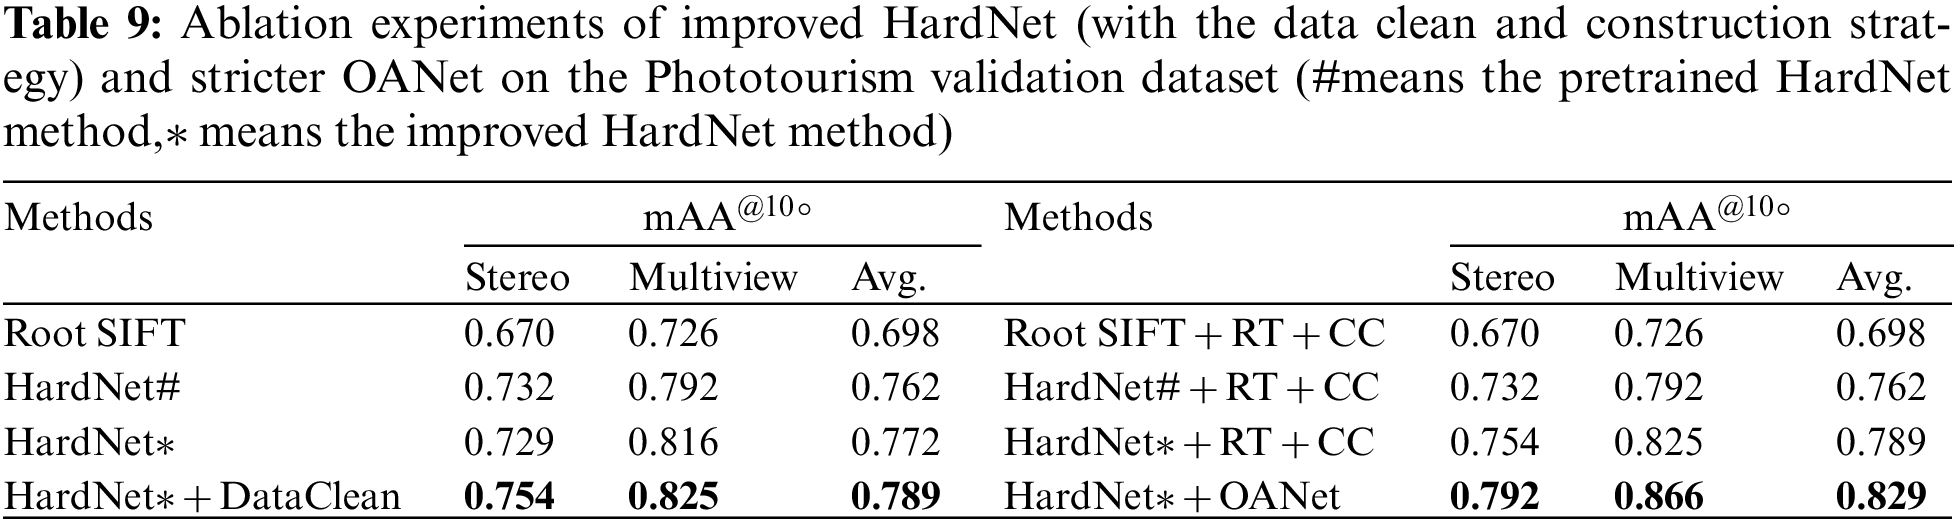
To validate the efficiency that the novel stricter OANet can improve the performance in outlier pre-filtering stage, Table 9 compares the mAA results under different outlier pre-filtering conditions: 1) employ Root SIFT in feature description, and ratio test and cross-check in outlier removing; 2) apply the pre-trained HardNet using the ratio test with cross-check; 3) apply modified HardNet with ratio test with cross-check; 4) apply modified HardNet with the proposed improved OANet. The comparison of several outlier pre-filtering specifies that the results of the revised OANet exceeds the ratio test using cross-check strategy for 4% in the evaluation protocol of mean Average Accuracy (mAA).
A novel image matching pipeline is proposed in this research by adding constraints for obtaining the accurate and robust correspondence of image pairs, thus could adapt outdoor datasets with challenging environments and further estimating pose error. The following improvements are proposed to strengthen the constraints 1) the data cleaning and construction processing to reduce noise and improve the efficiency of data training; 2) the proposed QHT loss in the HardNet description network to improve the noise perceptivity of gradient descent; 3) the stricter OANet by decreasing the symmetrical epipolar distance threshold and adding the triangulation constraint and bundle adjustment optimization to filter incorrect outliers; 4) the guided matching strategy to improve the ability of pre-filtering outliers. Under rich experiments, this research shows advanced results in the Phototourism dataset. In the extended experiment, the feasibility of using OANet and Guided matching methods together are also verified to improve the matching performance. In the future, the research will furtherly explore and enhance the generalization ability of the hybrid methods.
Funding Statement: The funding of this research is in part by a joint QMUL-CSC PhD scholarship. We thank our colleagues from Didi Chuxing who furnished insights and expertise that largely assist the work, especially for Zhongkun Chen, Wei Shao, Jingchao Zhou, Tengfei Xing and Bin Xu.
Conflicts of Interest: The authors declare that they have no conflicts of interest to report regarding the present study.
1Available at http://matthewalunbrown.com/patchdata/patchdata.html.
References
1. K. M. Yi, E. Trulls, Y. Ono, V. Lepetit, M. Salzmann et al., “Learning to find good correspondences,” in Proc. of the IEEE Conf. on Computer Vision and Pattern Recognition, Salt Lake City, Utah, pp. 2666–2674, 2018. [Google Scholar]
2. J. Zhang, D. Sun, Z. Luo, A. Yao, L. Zhou et al., “Learning two-view correspondences and geometry using orderaware network,” in Proc. of the IEEE/CVF Int. Conf. on Computer Vision, Seoul, Korea, pp. 5845–5854, 2019. [Google Scholar]
3. R. Hartley and A. Zisserman, “Frontmatter,” in Multiple View Geometry in Computer Vision, 2nd ed., vol. 1. Canberra, Australia: Cambridge University Press, pp. i–iv, 2004. [Google Scholar]
4. M. Brown and D. G. Lowe, “Automatic panoramic image stitching using invariant features,” International Journal of Computer Vision, vol. 74, no. 1, pp. 59–73, 2007. [Google Scholar]
5. M. Dusmanu, I. Rocco, T. Pajdla, M. Pollefeys, J. Sivic et al., “D2-net: A trainable cnn for joint description and detection of local features,” in Proc. of the IEEE/CVF Conf. on Computer Vision and Pattern Recognition, Long Beach, CA, USA, pp. 8092–8101, 2019. [Google Scholar]
6. J. Revaud, P. Weinzaepfel, C. De Souza, N. Pion, G. Csurka et al., “R2d2: Repeatable and reliable detector and descriptor,” arXiv preprint arXiv:1906.06195, 2019. [Google Scholar]
7. P. Ebel, A. Mishchuk, K. M. Yi, P. Fua and E. Trulls, “Beyond cartesian representations for local descriptors,” in Proc. of the IEEE/CVF Int. Conf. on Computer Vision, Seoul, Korea, pp. 253–262, 2019. [Google Scholar]
8. Y. Jiao, Q. Zhang, Q. Chen, B. Fu, F. Han et al., “Leveraging local planar motion property for robust visual matching and localization,” IEEE Robotics and Automation Letters, vol. 7, no. 3, pp. 7589–7596, 2022. [Google Scholar]
9. A. A. M. A. Y. A. S. A. M. M. K. Muhammad Hameed Siddiqi and H. Al-shammari, “A template matching based feature extraction for activity recognition,” Computers, Materials & Continua, vol. 72, no. 1, pp. 611–634, 2022. [Google Scholar]
10. M. Xu, C. Shen, J. Zhang, Z. Wang, Z. Ruan et al., “A stricter constraint produces outstanding matching: Learning reliable image matching with a quadratic hinge triplet loss network,” in Proc. of Graphics Interface 2021, British Columbia, Canada, pp. 203–209, 2021. [Google Scholar]
11. A. Mishchuk, D. Mishkin, F. Radenovic and J. Matas, “Working hard to know your neighbor’s margins: Local descriptor learning loss,” arXiv preprint arXiv:1705.10872, 2017. [Google Scholar]
12. Y. Jin, D. Mishkin, A. Mishchuk, J. Matas, P. Fua et al., “Image matching across wide baselines: From paper to practice,” International Journal of Computer Vision, vol. 129, no. 2, pp. 517–547, 2021. [Google Scholar]
13. D. G. Lowe, “Distinctive image features from scale-invariant keypoints,” International Journal of Computer Vision, vol. 60, no. 2, pp. 91–110, 2004. [Google Scholar]
14. R. Arandjelovic and A. Zisserman, “Three things everyone should know to improve object retrieval,” in 2012 IEEE Conf. on Computer Vision and Pattern Recognition, Providence, Rhode Island, IEEE, pp. 2911–2918, 2012. [Google Scholar]
15. H. Bay, T. Tuytelaars and L. Van Gool, “Surf: Speeded up robust features,” in European Conf. on Computer Vision, Graz, Austria, Springer, pp. 404–417, 2006. [Google Scholar]
16. E. Rublee, V. Rabaud, K. Konolige and G. Bradski, “Orb: An efficient 113 alternative to sift or surf,” in 2011 Int. Conf. on Computer Vision, Barcelona, Spain, IEEE, pp. 2564–2571, 2011. [Google Scholar]
17. P. F. Alcantarilla and T. Solutions, “Fast explicit diffusion for accelerated 106 features in nonlinear scale spaces,” IEEE Trans. Patt. Anal. Mach. Intell., vol. 34, no. 7, pp. 1281–1298, 2011. [Google Scholar]
18. Z. Luo, T. Shen, L. Zhou, J. Zhang, Y. Yao et al., “Contextdesc: Local descriptor augmentation with cross-modality context,” in Proc. of the IEEE/CVF Conf. on Computer Vision and Pattern Recognition, Long Beach, CA, USA, pp. 2527–2536, 2019. [Google Scholar]
19. Y. Tian, X. Yu, B. Fan, F. Wu, H. Heijnen et al., “Sosnet: Second order similarity regularization for local descriptor learning,” in Proc. of the IEEE/CVF Conf. on Computer Vision and Pattern Recognition, Long Beach, CA, USA, pp. 11016–11025, 2019. [Google Scholar]
20. Y. Liu, Z. Shen, Z. Lin, S. Peng, H. Bao et al., “Gift: Learning transformation-invariant dense visual descriptors via group cnns,” arXiv preprint arXiv:1911.05932, 2019. [Google Scholar]
21. Y. Verdie, K. Yi, P. Fua and V. Lepetit, “Tilde: A temporally invariant learned detector,” in Proc. of the IEEE Conf. on Computer Vision and Pattern Recognition, Boston, MA, USA, pp. 5279–5288, 2015. [Google Scholar]
22. N. Savinov, A. Seki, L. Ladicky, T. Sattler and M. Pollefeys, “Quad-networks: Unsupervised learning to rank for interest point detection,” in Proc. of the IEEE Conf. on Computer Vision and Pattern Recognition, Honolulu, HI, USA, pp. 1822–1830, 2017. [Google Scholar]
23. A. Barroso-Laguna, E. Riba, D. Ponsa and K. Mikolajczyk, “Key.net: Keypoint detection by handcrafted and learned cnn filters,” in Proc. of the IEEE/CVF Int. Conf. on Computer Vision, Seoul, Korea, pp. 5836–5844, 2019. [Google Scholar]
24. D. DeTone, T. Malisiewicz and A. Rabinovich, “Superpoint: Self-supervised interest point detection and description,” in Proc. of the IEEE Conf. on Computer Vision and Pattern Recognition Workshops, Salt Lake City, UT, USA, pp. 224–236, 2018. [Google Scholar]
25. H. Noh, A. Araujo, J. Sim, T. Weyand and B. Han, “Large-scale image retrieval with attentive deep local features,” in Proc. of the IEEE Int. Conf. on Computer Vision, Venice, Italy, pp. 3456–3465, 2017. [Google Scholar]
26. J. Bian, W. -Y. Lin, Y. Matsushita, S. -K. Yeung, T. -D. Nguyen et al., “Gms: Grid-based motion statistics for fast, ultra-robust feature correspondence,” in Proc. of the IEEE Conf. on Computer Vision and Pattern Recognition, Honolulu, HI, USA, pp. 4181–4190, 2017. [Google Scholar]
27. C. R. Qi, H. Su, K. Mo and L. J. Guibas, “Pointnet: Deep learning on point sets for 3d classification and segmentation,” in Proc. of the IEEE Conf. on Computer Vision and Pattern Recognition, Honolulu, HI, USA, pp. 652–660, 2017. [Google Scholar]
28. A. Ortiz, C. Robinson, D. Morris, O. Fuentes, C. Kiekintveld et al., “Local context normalization: Revisiting local normalization,” in Proc. of the IEEE/CVF Conf. on Computer Vision and Pattern Recognition, Seattle, WA, USA, pp. 11276–11285, 2020. [Google Scholar]
29. Y. Zhang and Z. Cui, “Registration of terrestrial lidar and panoramic imagery using the spherical epipolar line and spherical absolute orientation model,” IEEE Sensors Journal, vol. 22, no. 13, pp. 13088–13098, 2022. [Google Scholar]
30. H. Tan, X. Liu, B. Yin and X. Li, “Dr-gan: Distribution regularization for text-to-image generation,” arXiv preprint arXiv: 2204.07945, 2022. [Google Scholar]
31. A. S. Salim, M. B. Abdulkareem, Y. E. Fadhel, A. B. Abdulkarem, A. M. Shantaf et al., “Novel image caption system using deep convolutional neural networks (vgg16),” in 2022 Int. Congress on Human-Computer Interaction, Optimization and Robotic Applications (HORA), Ankara, Turkey, IEEE, pp. 1–6, 2022. [Google Scholar]
32. R. Ranftl and V. Koltun, “Deep fundamental matrix estimation,” in Proc. of the European Conf. on Computer Vision (ECCV), Munich, Germany, pp. 284–299, 2018. [Google Scholar]
33. L. Bottou, “Large-scale machine learning with stochastic gradient descent,” in Proc. of COMPSTAT’2010, Paris, France, pp. 177–186, 2010. [Google Scholar]
34. A. Paszke, S. Gross, F. Massa, A. Lerer, J. Bradbury et al., “Pytorch: An imperative style, high-performance deep learning library,” Advances in Neural Information Processing Systems, vol. 32, pp. 8024–8035, 2019. [Google Scholar]
35. E. A. Morales, C. Arnaiz, E. S. Krystofiak, M. Zanic and M. J. Tyska, “Mitotic spindle positioning (misp) is an actin bundler that selectively stabilizes the rootlets of epithelial microvilli,” Cell Reports, vol. 39, no. 3, pp. 110692, 2022. [Google Scholar] [PubMed]
36. M. A. Fischler and R. C. Bolles, “Random sample consensus: A paradigm for model fitting with applications to image analysis and automated cartography,” Communications of the ACM, vol. 24, no. 6, pp. 381–395, 1981. [Google Scholar]
37. L. Cavalli, V. Larsson, M. R. Oswald, T. Sattler and M. Pollefeys, “Adalam: Revisiting handcrafted outlier detection,” arXiv preprint arXiv:2006.04250, 2020. [Google Scholar]
Cite This Article
 Copyright © 2023 The Author(s). Published by Tech Science Press.
This work is licensed under a Creative Commons Attribution 4.0 International License , which permits unrestricted use, distribution, and reproduction in any medium, provided the original work is properly cited.
 Downloads
 Citation Tools