
 Submit a Paper
 Propose a Special lssue
 Open Access
ARTICLE

Improved Monarchy Butterfly Optimization Algorithm (IMBO): Intrusion Detection Using Mapreduce Framework Based Optimized ANU-Net
School of Computer Science and Engineering, VIT-AP University, Amaravathi, 522237, Andhra Pradesh, India
* Corresponding Author: Yamarthi Narasimha Rao. Email:
Computers, Materials & Continua 2023, 75(3), 5887-5909. https://doi.org/10.32604/cmc.2023.037486
Received 05 November 2022; Accepted 03 March 2023; Issue published 29 April 2023
 View Full Text
 Download PDF
Abstract
The demand for cybersecurity is rising recently due to the rapid improvement of network technologies. As a primary defense mechanism, an intrusion detection system (IDS) was anticipated to adapt and secure computing infrastructures from the constantly evolving, sophisticated threat landscape. Recently, various deep learning methods have been put forth; however, these methods struggle to recognize all forms of assaults, especially infrequent attacks, because of network traffic imbalances and a shortage of aberrant traffic samples for model training. This work introduces deep learning (DL) based Attention based Nested U-Net (ANU-Net) for intrusion detection to address these issues and enhance detection performance. For this IDS model, the first data preprocessing is carried out in three stages: duplication elimination, label transformation, and data normalization. Then the features are extracted and selected based on the Improved Flower Pollination Algorithm (IFPA). The Improved Monarchy Butterfly Optimization Algorithm (IMBO), a new metaheuristic, is used to modify the hyper-parameters in ANU-Net, effectively increasing the learning rate for spatial-temporal information and resolving the imbalance problem. Through the use of parallel programming, the MapReduce architecture reduces computation complexity while significantly accelerating processing. Three publicly available data sets were used to evaluate and test the approach. The investigational outcomes suggest that the proposed technique can more efficiently boost the performances of IDS under the scenario of unbalanced data. The proposed method achieves above 98% accuracy and classifies various attacks significantly well compared to other classifiers.Keywords
Modern communication protocols and information technology developments have resulted in a dramatic rise in network traffic data [1]. Due to the fact practically all computers today are Online-connected, internet apps use numerous networks to provide services like surfing, email, social media, etc. [2–4]. The system and consumers have significantly benefited from the dependence. But it has also left a security gap that presents potential dangerous cyber threats, including network assaults. Network incursions are hostile and damaging computer network operations that involve unwelcome network traffic [5].
A security technique called network intrusion detection was recently developed to constantly monitor, thwart, and fight against system breaches [6]. In particular, it alludes to gathering details from different nodes of a computer network or system and evaluating them to ascertain whether an attack or security policy breach has occurred in the network system [7]. Since 1980, there has extensive research in intrusion detection technology, and it is currently a crucial component of the architecture for network security [8–10].
Deep learning techniques have been popular in recent years and are often utilized in domains like image recognition and natural language processing. These methods have also been successful in the area of IDS by integrating low-level data to produce a higher-level representation that is more abstract and non-linear, followed by mining the input-output correlations among the data [11–13]. Deep Belief Network (DBN), Recurrent Neural Network (RNN), and Convolutional Neural Network (CNN) are the most often utilized neural networks in the field of IDS [14]. Recent research and methods, including ANN and evolutionary algorithms, have drawn significant Attention in the quest for a solution to address intrusion detection difficulties [15,16].
One of the most popular strategies is the artificial neural network (ANN), which has effectively resolved various challenging practical challenges [17,18]. An appealing technique for intrusion detection is provided by ANNs. ANNs stand out from the rest of the conventional methodologies due to their learning capability. Many ANN-based IDSs are still under development as of right now. However, mapping the generalization between the data input and output is still a challenging phase in the learning process [19].
The most significant issue with the general architecture of ANNs, which includes determining the ideal weight setting during training, is an optimization issue. Particularly for non-linear issues or complicated function approximation issues, the training procedure is prone to get trapped in local minima [20]. The search for a globally optimal solution may thus fail due to ANN training techniques. Additionally, the training algorithm’s convergence speed needs to be faster for constructing behavior.
This study created a new classification-based intrusion detection system using deep learning techniques. Because the Network Security Laboratory—Knowledge Discovery in Databases (NSL-KDD), CIC-IDS2017, and CSE-CIC-IDS2018 datasets are imbalanced, they were integrated with the improved ANU-Net strategy and map reduction. Because speed is critical in identifying attacks, the map reduction environment was chosen. Associated research was conducted using the clustering mechanism. The Improved Monarchy Butterfly Optimization Algorithm (IMBO), a new metaheuristic, is used to modify the hyper-parameters in ANU-Net, effectively increasing the learning rate for spatial-temporal information and resolving the imbalance problem. Through the use of parallel programming, the MapReduce architecture reduces computation complexity while significantly accelerating processing. Furthermore, the suggested method was run on the datasets for multi-categorization, and the outcome was confirmed. The presented method’s categorization performance on the dataset was evaluated utilizing the evaluation parameters Accuracy, F-Measure, Precision, and Recall.
This research paper is organized as follows: Study related to this in Section 2. Section 3 explains the suggested method's description and its implementations. Section 4 illustrates performance results and comparative studies. The conclusions of this study and potential guidelines for the future are provided in Section 5.
The main key contributions of this paper are as follows,
• The IFPA approach was utilized to reduce dimensions that speed up the deep learning approach’s processing. Similarly, it first chooses the best attributes. The IFPA technique is used for this assignment because it effectively solves the NP-complete feature selection issue with a slow convergence rate.
• Attention-based Nested U-Net (ANU-Net) is used to classify an effective IDS model optimized by the monarchy butterfly optimization algorithm (MBOA).
• The hyperparameter in ANU-Net is optimized by MBOA, increasing the learning rate for features and effectively solving the class imbalance problem.
• Through the use of parallel programming, the MapReduce architecture reduces computation complexity while significantly accelerating processing.
• The proposed method was compared to various machine learning and deep learning methods. The results demonstrated that the proposed method outperformed the existing methods.
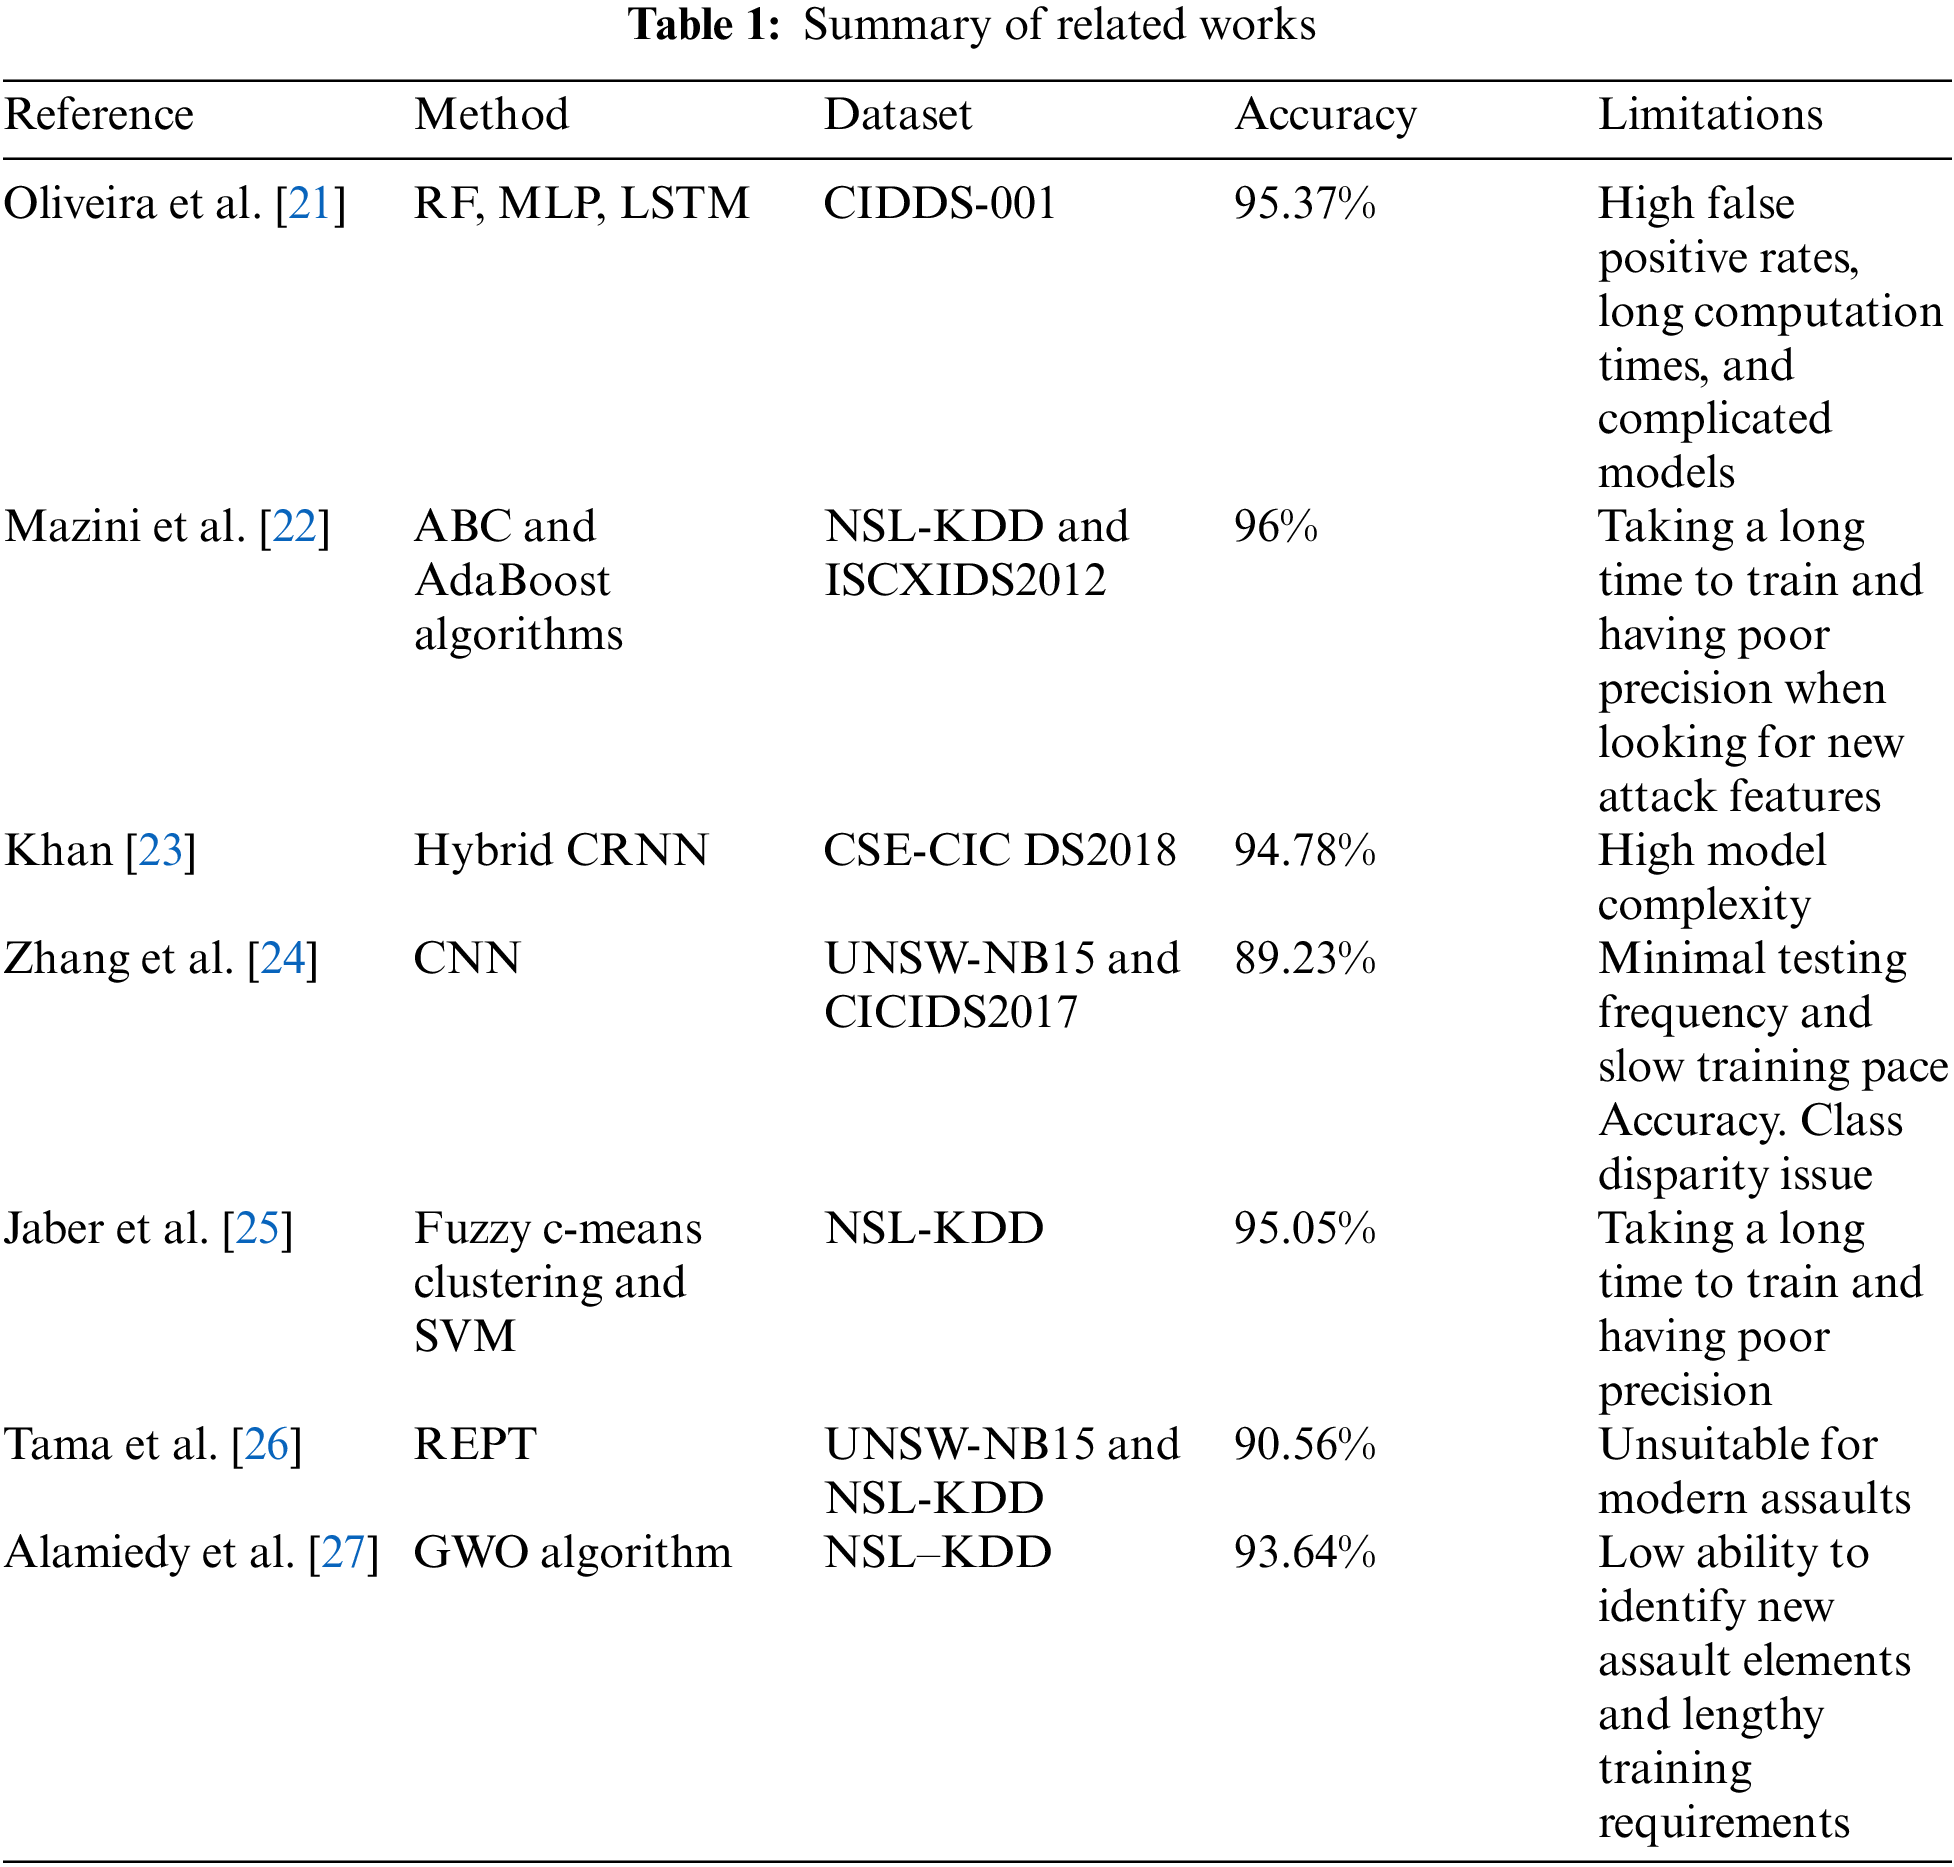
The field of study on NIDS is quite diverse. Convolutional neural network (CNN), Recurrent Neural network (RNN), machine learning (ML), and hybrid models are examples of existing models utilized in the area of IDS. In the realm of IDS, researchers have employed a range of various strategies to tackle the issues of low detection accuracy and difficulties in recognizing some classes of instances. Some existing related works are discussed below.
Oliveira et al. [21] presented a hybrid method and computed the effectiveness of a Random Forest (RF) an Multilayer Perceptron (MLP) and an Long Short Term Memory (LSTM) for cyber-attack detection and classification. LSTM processed the CIDDS-001 dataset. The report didn’t mention any research on the relationship between the size of the flow window and the metrics used to assess the model. The fact that the Class label was chosen as the target value and that data from the External Server was used to emphasize. The results of the experiment indicate that tackling anomaly detection sequentially is preferable. For finding sequential patterns in network traffic data, the LSTM is the reliable approach.
To achieve a high detection rate (DR) with a low false positive rate (FPR), Mazini et al. [22] presented a novel, trustworthy hybrid technique for an anomaly network-based IDS (A-NIDS) employing artificial bee colony (ABC) and AdaBoost algorithms. AdaBoost and the ABC method are used to analyze and categorize the features. It has consistently displayed improved performance in many scenarios, including attacks. Comparing this procedure to legendary ones, accuracy and detection rate increased.
Khan [23] introduced hybrid Convolutional Recurrent Neural Network (HCRNN) for NIDS. A CRNN was used to build a DL-based hybrid ID framework that anticipates and categorizes hostile cyber-attacks in the network. In the HCRNNIDS, the RNN captures temporal information and the CNN performs convolution to better the effectiveness and prediction of the ID system. The simulation outcome shows that the suggested HCRNNIDS significantly exceeds existing ID approaches, achieving a high rate of malicious attack detection.
Zhang et al. [24] suggested CNN for NIDS. After that, they created the flow-based ids model, which combines unbalanced data processing with a convolutional neural network, and examined how the number of convolution kernels and learning rate affected the algorithm’s effectiveness. The suggested strategy performs better when compared to current methods.
A novel intrusion detection system was described by Jaber et al. [25] that integrates the fuzzy c-means clustering (FCM) method with support vector machine (SVM) to enhance the detecting system’s accuracy in cloud computing. By using this method, an IDS is built inside the monitored layer of the virtual machine (VM). SVM and FCM clustering are used in a hybrid process to produce the hypervisor inspector. The FCM-performance SVM’s findings demonstrate that it outperforms the currently used techniques.
Tama et al. [26] describe an improved intrusion detection system based on two-level classifier ensembles and hybrid feature selection. A hybrid feature selection strategy decreases the number of features in trained data by integrating particle swarm optimization (PSO), ant colony algorithm (AC), and genetic algorithm (GA). Features are selected based on how well a reduced error pruning tree (REPT) classifier categorizes the data. A two-level classifier ensemble based on two Meta learners’ rotation forests and bagging were then developed. Better outcomes are obtained with the current methodology.
Alamiedy et al. [27] introduced an improved anomaly-based IDS model based on the multi-objective grey wolf optimisation (GWO) algorithm. The dataset’s most essential characteristics that promote high classification accuracy were isolated using the GWO technique as a feature selection mechanism. It was also determined to what degree attributes were accurate in properly forecasting attacks by utilizing support vector machines. The proposed approach outperforms other current methods in comparison, which is essential. Table 1 represents the summary of related work.
As can be observed from relevant work, some of the research concentrated on deep learning-based assault detection, while others focused on data balancing. The majority of research that recommends an IDS has yet to examine the issue of data instability in depth. This research compared ML and DL methodologies in network-based intrusion detection systems. Furthermore, deep learning methodologies were investigated within themselves, and the effectiveness of the ensemble method was analyzed. An optimized ANU-Net was proposed in the study to classify attacks. Furthermore, the map reduce technique has been developed due to the uneven data sets seen in attack detection systems. This paper will optimize the current deep learning method by optimizing and merging numerous single learners to train an improved efficiency and high speed model to ensure faster training and detection speed under increased accuracy.
The proposed approach contains three fundamental building blocks: preprocessing, feature extraction, selection, and classification, according to the IMBO-ANU Net based IDS model’s overview. A class that comprises the majority of the samples in the input datasets has problems with class imbalance because there is an incomplete data distribution; the other classes have relatively fewer samples. Using such unbalanced datasets will significantly lower classifier performance.
Most current procedures use ML and statistical techniques, including data augmentation, to address the imbalance issue. However, those methods fill the minority class instances with data from the majority class while handling the minority class as little as possible, which, in the absence of regular minority class samples, increases data distribution across all minority classes. The assessment dataset needs high dimensional unbalance issues, including features missing, values of the features missing, and probably noisy cumulative data. To address this problem, oversampling is used, which entails systematically reproducing minority class samples in order to increase the number of occurrences in those classes.
This method improves other sampling and augmentation strategies, although it runs the danger of overfitting the classifier. Often, there is no loss of information. By adjusting the volume of weights and their values in the convolutional layers of the suggested MBO-ANU Net method, the MBO provides structural stabilization to avoid the potential overfitting issue. Because MBO estimates these weighting and their quality optimally, they can be modified within the ideal range without impacting the classifier’s effectiveness. The activities of redundancy elimination, label transformation, and data normalization are carried out in the pre-processing stage following the over-sampling procedure. The datasets are divided in a 7:3 ratio into training and validation sets. The training set is employed for quick evaluation, while the validation set was used for the model’s last assessment. After extracting the features from every dataset, the IFPA chooses the optimum feature subsets to boost the classifier’s performance. Since IFPA has demonstrated outstanding performance in selecting features in large-scale datasets, it is applied in this study. The proposed MBO-ANU Net-based classifier is introduced in the last step of the classification stage. The proposed classifier consists of two components, learning features and classifier. Learning the features contain two layers convolutional and pooling. The extracted outcome is called a feature map, which is the outcome of the classifier. The proposed methodology architecture is shown in Fig. 1.
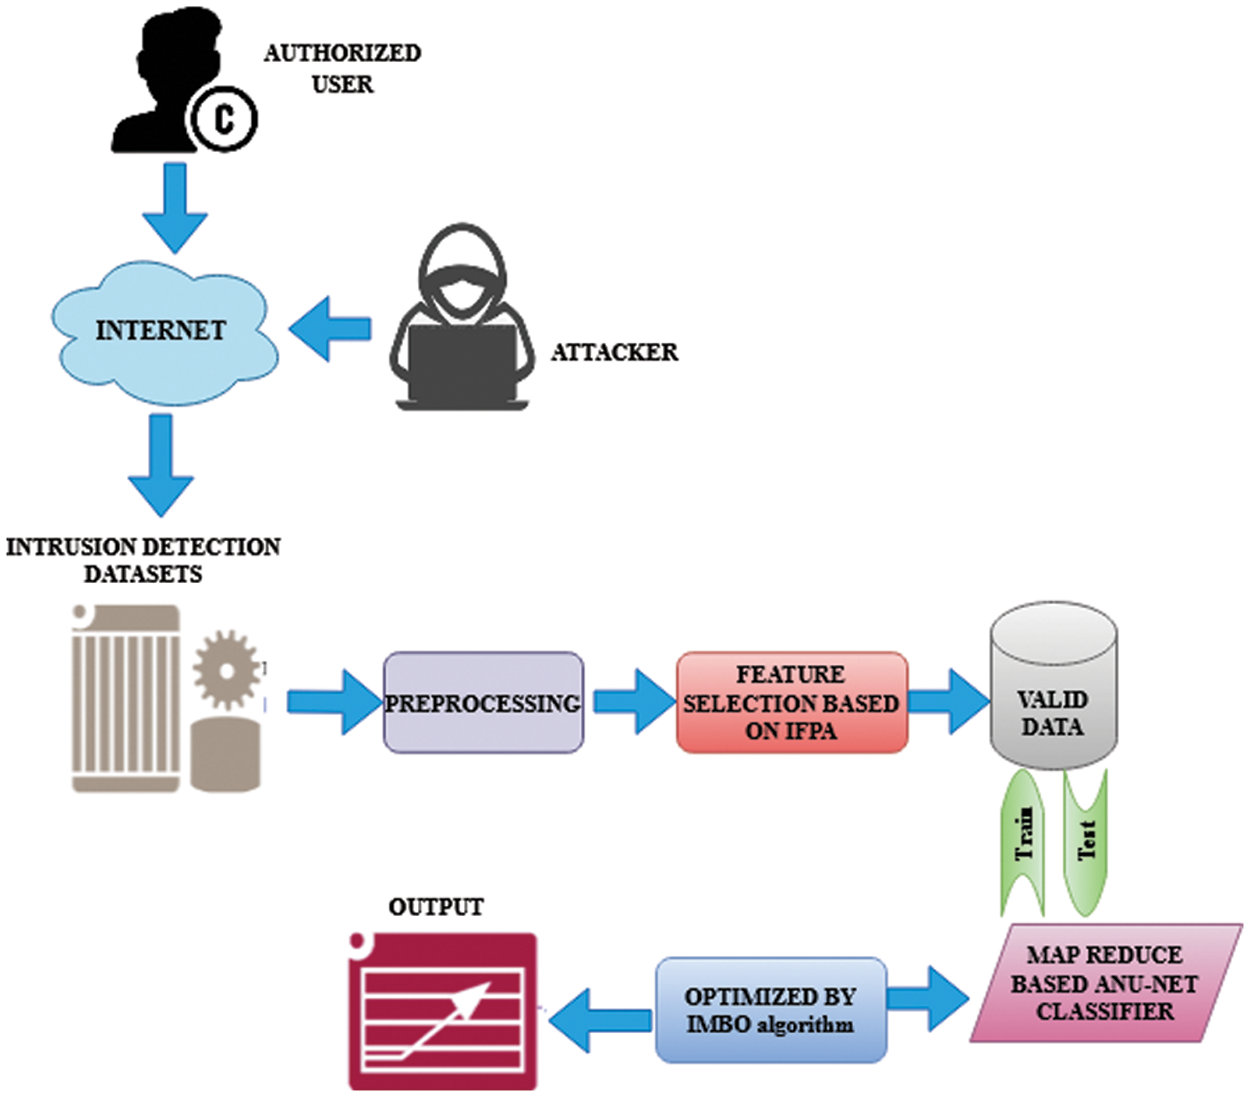
Figure 1: Architecture diagram of the proposed methodology
For this IDS model, data pre-processing is carried out in three steps: duplication elimination, data normalization and label transformation. The label transfer is the initial phase, in which the input columns for the symbolic classes can be changed into numerical labels based on the type of attack.
During the process, Data scaling is used to equalize the wide variety of data attributes, allowing the suggested classification approach to identify the best solution faster. To scale attribute values, we employ the maximum-minimum normalization approach. As per Eq. (1), all attribute values are normalized within a defined range of [0, 1].
While x is an initial value and x′ is the normalized gain. The data set’s shortest and greatest values are represented in min and max, respectively. The normalized values are ranged from 0 and 1. The min and max values computed for every column are employed to normalize the data in the training part.
In order to increase the categorization accuracy of ML classifiers, selecting the best features before removing the least useful or irrelevant features is essential. For all applications involving data processing, feature selection techniques utilizing statistical and optimization methods have been widely used. Several of these feature selection algorithms have also been used on hazardous activity recognition datasets, including NLS-KDD, CICIDS2017, and CSE-CIC IDS2018. The features are chosen and extracted using Improved Flower Pollination Algorithm (IFPA).
3.2.1 Flower Pollination Algorithm
The FPA is based on the processes that flowering plants naturally go through. Pollinators, insects like mammals, bats, birds, and butterflies, among others can significantly influence the pollination process. Flowering plants typically use both biotic and abiotic pollination processes. Furthermore, there are two distinct forms of pollination: self-pollination and cross-pollination.
Cross-pollination is the exchange of pollen between flowers of different blooming plants. The first type of pollination is the movement of pollen from one plant to another within the same type of plant. The pollination procedure can be finished without a pollinator. Next, one process of flowers pollinating one another across very vast distances. Pollinators must make significant deviations from the FPA algorithm to generate the levy distribution function, which the pollination process must observe. Consequently, the flower’s consistency can be used. Whether two flowers are different or similar determines whether the step is raised. The following guidelines for floral constancy and the pollination process depend on the aforementioned aspects of pollination behavior.
• Cross and biotic pollination are two types of global pollination. Several flights have proved the pollinator’s performance.
• Self-pollination and abiotic processes can both be used to describe local pollination of FPA.
• The degree to which two blooms differ or are similar during the pollination process is referred to as flower constancy, affecting the likelihood of reproduction.
• It is possible to use switch probability
From the preceding ideas and optimal FPA algorithm rules. The following is a list of the FPA's characteristics.
Global pollination can be thought of as the result of cross-pollination and biotic processes. Eq. (2) can be used to describe the first rule numerically,
Here,
While
The local pollination is described in Eq. (4) and is derived as,
where
Whether global or local, pollination outcomes are governed by the switching probability. The balance between regional development and international exploration is governed by switching probability. In Eq (5), it mentions switching probability.
The pollination of flowers can occur on all scales commonly. The use of switching likelihood can solve the issue as mentioned above. The chance of transitioning between concentrated local pollination and wide global pollination is employed. In general, p = 0.5 can be used in most applications.
Eventually, the most recent iteration yields new solutions. Compared to the prior solution Pt I, each answer P (t + 1) is better when an update is made, otherwise, it remains unchanged. After updating GB to the most recent version, the procedure is repeated a predetermined number of times.
3.2.5 Improved Flower Pollination Algorithm
Although the FPA has successfully addressed a variety of optimization issues. It still has several impacts, such as computational time, speed for some challenging situations, and premature convergence. Therefore, several changes were suggested to get around these problems. The FPA is currently being improved with a primary focus on accelerating speed and enhancing the balance between exploitation and exploration.
Since switching likelihood (P) regulates the FPA’s exploration and exploitation, it also affects local and global pollination, significantly impacting the FPA’s performance. An adaptive p is offered to direct the algorithm toward a quick and effective convergence. The basic formula for adaptive p is given as.
While
The conventional FPA’s local pollination uses a random number, making it simple for the algorithm to reach the local optimum that is described in Eq. (7). A modified self-pollination approach is suggested, one that adds a polynomial and a Cauchy distribution. Given is a modified self-pollination approach by:
Represent pollen obtained at iteration t from various blooms of the same plant species, with gbest being the present best solution and F coming from a Cauchy distribution.
Crossover and Selection Strategies
Only global or local pollination in the initial FPA yields the optimal result in each cycle. People in the population need to communicate better with one another. A user-defined crossover rate (CR) determines how the crossover process works. A number at random between 0 and 1 is CR. Therefore, a unique rti is generated for each experiment in the manner described below.
While
While
3.3 MapReduce based Attention-Based Nested U-Net (ANU-Net) Classifier
3.3.1 Integration of MapReduce
By planning the deep framework of an optimized ANU-Net and putting it into the MapReduce architecture, MBO-ANU-Net is produced. The distributed programming technique, MapReduce, uses distributed parallel clusters of nodes to analyze enormous amounts of data. Map and reduce are the two primary steps in this procedure. The mapping phase is the transformative process, while the summarizing stage is the reduction stage. Based on the MapReduce framework, the suggested optimized ANU-Net is utilized to reorganize classifier training from a single learning network to a series of micro networks with equal training.
The data batch and labels from the training data are input to the mappers. The batch contains the learning data, and the label represents the ground truth label for every case. A set of ideal weights describes the network’s hidden layers after MBO determines them. The optimum weights for the network are then determined by each mapper using training data gleaned from input data samples. The pair of newly qualified weights that are included in the set of recommended weights specified by the MBO will be the outcome. The reducer that aggregates the weights receives these outputs as inputs. The accretion calculates an overall total of overweight’s and divides it by the amount of overweight’s.
3.3.2 Attention Based Nested U-Net
We build a network called Attention U-Net++ to classify attacks. The nested U-Net structure, inspired by DenseNet, combines a series of U-Nets of varying depths. Every nested convolutional block in layered U-Nets gathers semantic information employing several convolution layers. Furthermore, every layer in the block is connected to the next, permitting the concatenation layer to merge semantic data at numerous levels. The advantages of our new nested design are as follows:
• By examining the value of characteristics at different levels, our nested design may eliminate the time-consuming method of identifying deep and shallow factors.
• Since all of the Nets in our nested design share a feature extractor, only an encoder needs to be trained.
• Because separate decoder paths recover different layers of features individually, we can get hierarchy decoding masks from various phases in our tiered
We use the PASSR Net’s strategy and incorporate a straightforward but efficient Attention Gate into our nested design to concentrate on areas pertinent to the target organ. Details of the attention gate are given below
The initial input (g) acts as the gated signal to assist learning the following input.
• The initial input (g) is utilized as a gating signal to assist in the learning of the next source (f). In other terms, the gating signals (g) can pick the most valuable features from the encoded features (f) and deliver them to the top decoder.
• After a CNN process (Wf, Wg) and Batch Norm (bf, bg), these input data are integrated pixel by pixel.
• The S-shaped activation function sigmoid
• The outcome can be obtained by increasing the encoder characteristic of every pixel by a specific coefficient.
The Attention Gate selecting feature part is formulated as follows:
The classification task-related target region can be better learned by the Attention Gate, while the task-unrelated target area can be suppressed thanks to the Attention Gate’s effective function selection function. Our study integrates Attention Gate to improve the efficiency of information propagation in the novel proposed approach.
In ANU-Net, the primary network design is nested U-Net. More valuable hierarchical features can then be reconstructed. In the form of complex dense skip connections, every block in the decode obtains two equivalent local features as inputs: The initial feature maps are generated from the results of prior Attention Gates with residual connections at the same depth, and the resulting feature map is generated from the results of the deeper block deconvolution operation. Upon collecting all acquired extracted characteristics, the decoder reconfigures characteristics from the bottom up.
Following the concatenated technique, the decoder’s blocks will use only the encoder's chosen identical feature maps, rather than all of the extracted features produced. The network transfer of encoder features is one of ANU-significant Net’s breakthroughs. As a consequence, the performance of ANU-Net should improve. The batch size, momentum, learning rate, and weight decay are all correspondingly 1, 0.9, 0.03, and 0.001. The initial learning rate is 0.01. In the ReLu layer, the learning rate is saturated. Due to the possibility of the network being either under or over-fitted, the amount of epochs is also a crucial training parameter. For this dataset, we trained the network for 50 epochs. The proposed model’s training and testing accuracy vary, it ranges from 0.98 to 0.99 and loss values range from 0.001 to 0.004.
3.4 Monarchy Butterfly Optimization (MBO) Algorithm
This method depends on the migration patterns of the monarch butterfly. Each year during the breeding season, these MB moved to northern America. This algorithm divides the entire population into two lands: land 2 and 1. These areas are classified as subpopulations 1 and 2 based on their fitness values. Each position of the monarch butterfly is displayed here. As a result, two subpopulations are created from all retrieved features. Each butterfly has value in terms of fitness. Here, choosing the best-accurate ideal features is the goal. The exercise feature is
That operator is for migration. The operator changed the wold or parent butterfly with a butterfly from the following generation to sustain the butterflies’ population. The value of r is represented as
The operator of the butterfly adjustment. This operator determines the location of butterflies in subpopulation 2. These factors determine where butterflies land. The top butterfly in the world, excluding butterflies in subpopulation 2. The amount of c is
While Wmax is defined as the max walk step that a butterfly can move separately in the present generation. dM is the butterfly that is analyzed by levy flight
The BAR is utilized for butterfly adjustment rate in enhanced MBO, as opposed to basic MBO, where we examine the likelihood of the BAR to determine the location.
With newly created butterflies, another change is made. In MBO, all new generation butterflies are accepted; however, in this case, we assess the fitness of a freshly created butterfly to other butterflies of the same generation. If it is more fit than the others, we examine it; otherwise, we do not.
The parameters like batch size, momentum, learning rate, and weight decay are finally optimized with the help of improved MBO.
Python is utilized in a controlled environment to evaluate the proposed MapReduce-based system. In order to compare the effectiveness of the suggested approach on the three datasets, experiments are carried out.
An unbalanced dataset has a significant impact on neural network performance during training. The experimental findings suggest that our proposed technique combines Imbalanced Generative Adversarial Network (IGAN) oversampling and greatly enhances attack DR while reducing time cost. The proposed strategy is advantageous for two reasons. First, by utilising mapreduce concept to increase minority classes to a uniform number of instances, the risk of inputting too much redundant data is reduced. To highlight the effectiveness of our proposed intrusion detection model, we compare it to other state-of-the-art intrusion detection approaches utilizing the NSL-KDD, CIC-IDS2017, and CSE-CIC-IDS2018 datasets. When compared to other deep learning algorithms, our model has proven to be superior, particularly in terms of enhancing the detection rate of various categories.
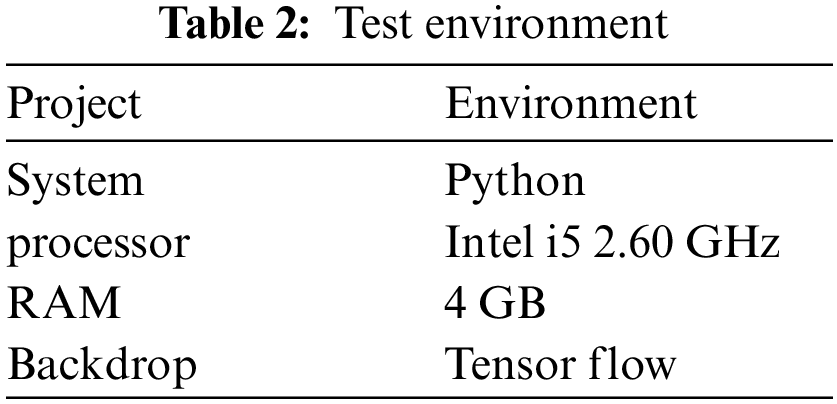
Using 4 GB RAM and an Intel i5 2.60 GHz processor, it runs Windows 10. The studies are carried out in the Anaconda3 environment using Python and KERAS with Tensor flow as a backdrop. The data samples are split into two sections, one of which is utilized to create a classifier and is referred to as the training dataset. The testing dataset is used in the second step to evaluate the classifier. Table 2 shows the test environment.
Three well-known IDS public datasets are employed in this study to evaluate the suggested methodology. The main goal is to create an IDS that can much better access in most datasets with different assaults. The right datasets must be chosen because they are essential to the IDS’s evaluation process.
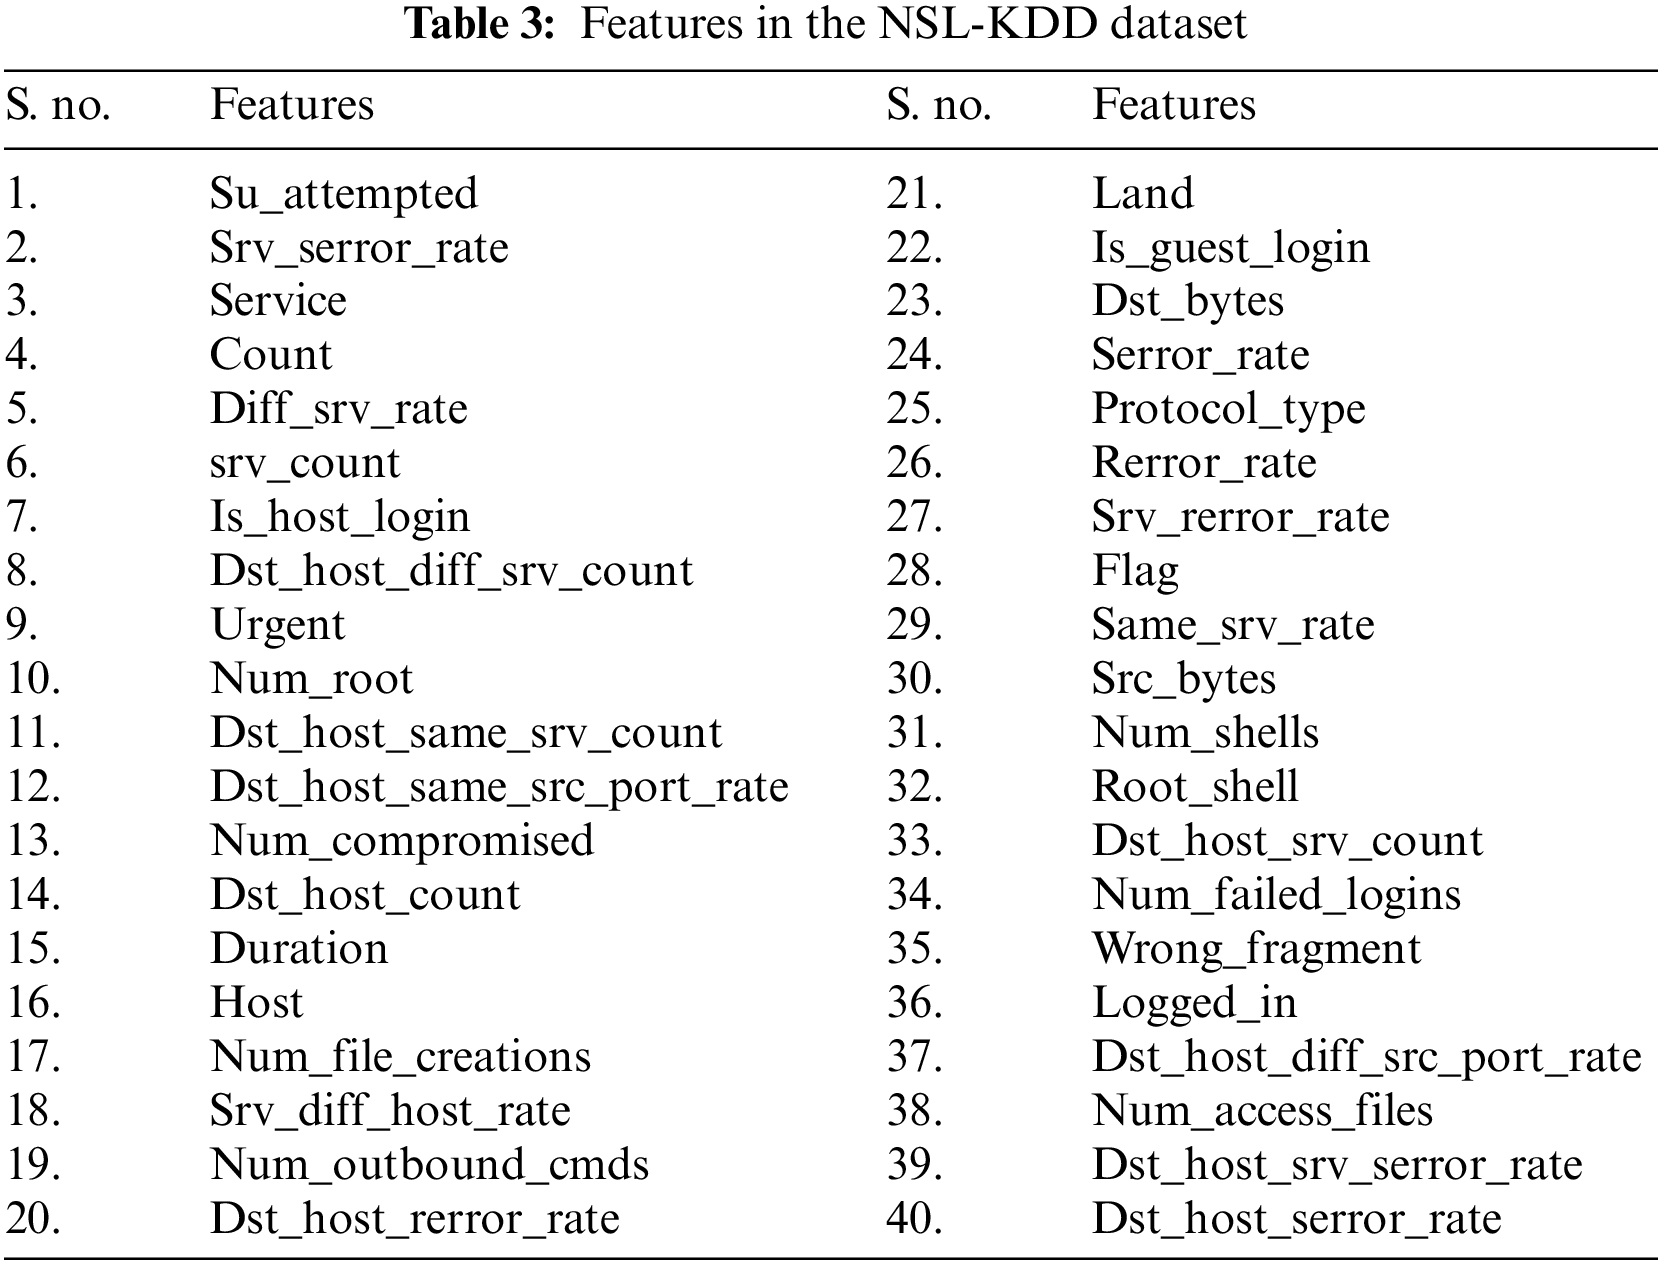
It was created in 2009 to take the place of the well-known KDDCUP99 dataset. The KDDCUP99 has been in use for more than 20 years. The investigators created NSL-KDD as an upgraded KDD since KDDCUP99 includes distinctive duplicated entries. Additionally, it has a sufficient number of datas and evaluations, meaning the categorization is not dependent on frequently updated records. Table 3 displays the NSL-KDD dataset’s characteristics.
4.2.2 CSE-CIC-IDS 2018 Dataset
The unprocessed data were regularly modified after being collected in various data states. IDS2018, therefore, has 80 statistical features computed in forward and reverse modes. Finally, the dataset, which had about 5 million records, was accessible to all academics via the internet. The Packet capture library (PCAP) and comma-separated values (CSV) file formats are both available for the CSE-CIC IDS2018 dataset. 50 machines make up the infrastructure used to target datasets, whilst 30 servers and 420 terminals make up the assaulting companies. CSE-CIC-IDS-2018 class distribution is shown in Table 4.
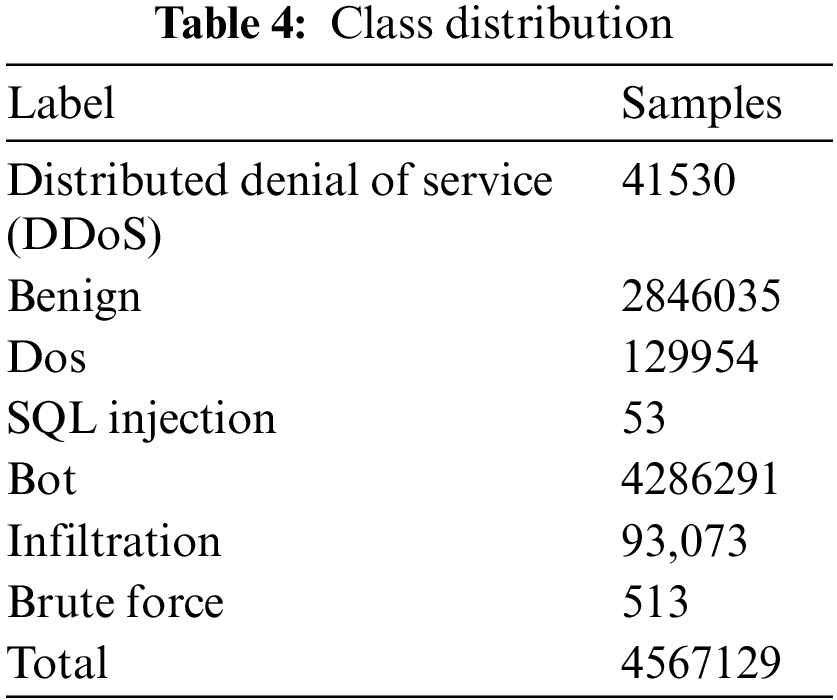
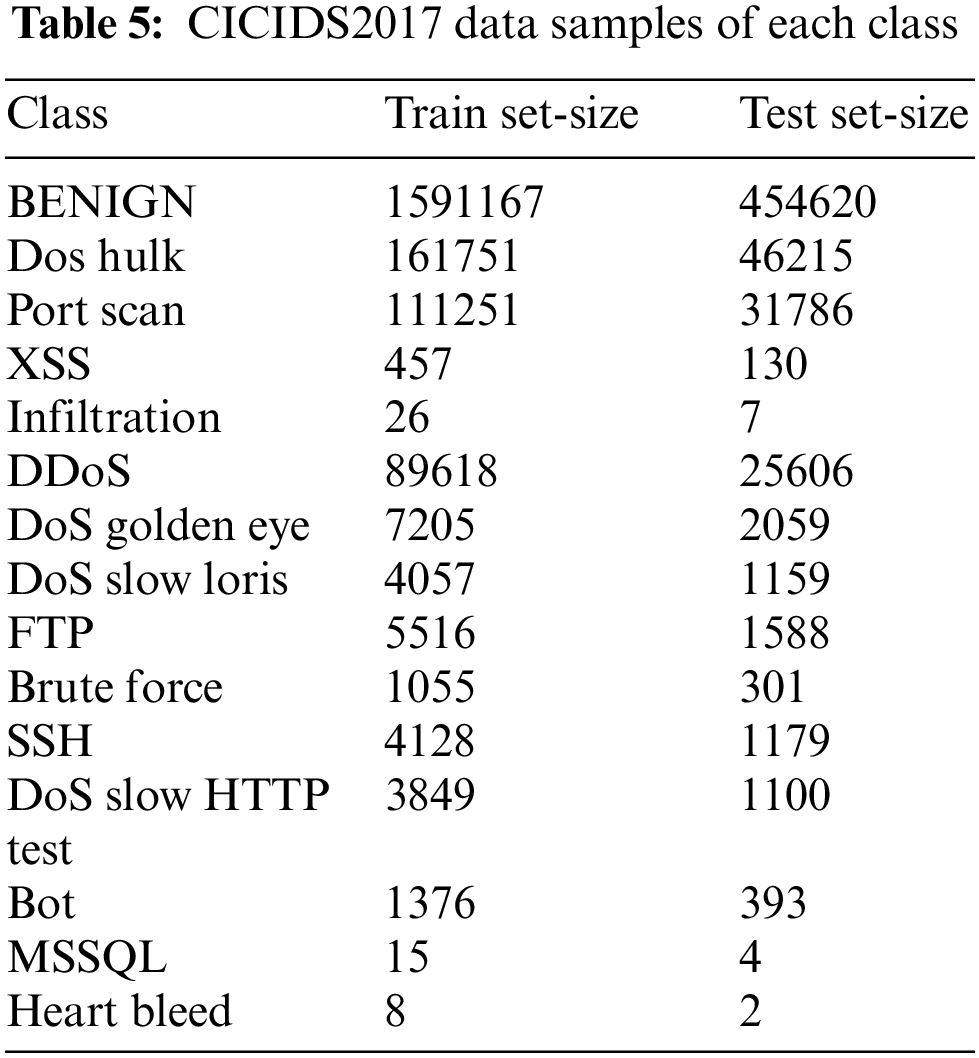
There are 2,830,473 samples of network traffic in the dataset, of which benign traffic makes up 80.30% and attack traffic represents 19.70%. There is one normal class and 14 assault types. The assault types include the most prevalent attack types, like port scan, DDoS, web attacks, botnet, DoS, etc. The last column of the dataset, which contains the multiclass label, contains 84 features extracted from the generated network traffic. Table 5 provides a data distribution for each class.
The false positive rate (FPR), accuracy, precision, F-score, Matthews’s correlation coefficient (MCC) and kappa were used to evaluate the IDS (F). High precision, a high detection rate, and a low false alarm rate are required for the outcome. These characteristics are computed using a confusion matrix. True Positive (TP) is the number of assault reports that were correctly categorized in the confusion matrix. The number of correctly identified normal data is known as a True Negative (TN). The average of typical records that were misclassified is known as false positives (FP). False Negative (FN) is the number of inaccurate assault records.
Accuracy: displays the proportion of real detection in the entire traffic trace. It is derivable as follows:
PR: displays the proportion of actual intrusions compared to those anticipated by a NIDS. It may be deduced that the higher the PR, the smaller the false alarm:
Recall: This metric measures the proportion of links to successfully classified anomalies. It shows how well the model is in picking up abnormalities from every anomalous connection. It is derivable as follows:
FAR: It can be calculated by splitting the average variety of general connections by the number of normal connections that are mistakenly labeled as anomalies. It is derivable as follows:
Kappa: The classifier’s ability to process unbalanced data classes is evaluated using the kappa coefficient. It is determined as
4.3.1 Performance of NSL-KDD Dataset
Map reduce-based proposed approach on NSL-KDD has achieved a greater outcome. Some of the important measures like False Negative Rate (FNR), accuracy, and FPR are compared. The evaluation is analyzed and compared with existing approaches.
Table 6 shows that our suggested method effectively and more accurately categorizes the intrusion. The results show that practically all assault records and regular records have improved detection accuracy. The FPR and FNR values are likewise substantially spread among good values, just like the FPR. When considering the entire dataset, this conclusion was reached.
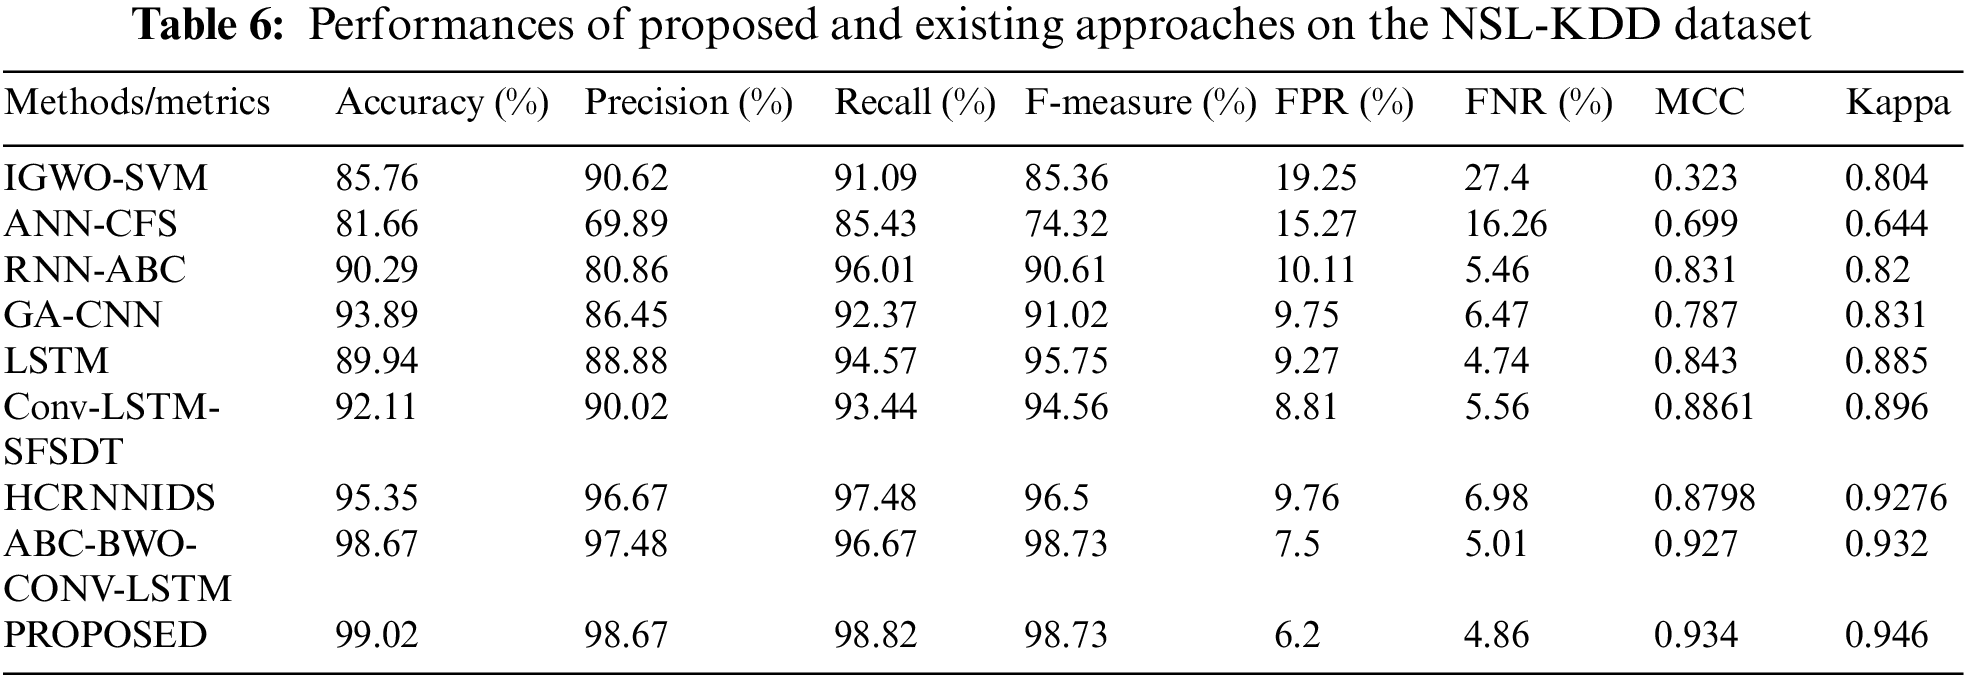
Fig. 2a represents the performance metrics, Fig. 2b represents the evaluation of MCC and kappa and Fig. 2c represents the False Negative Rate and False Positive Rate values. The suggested strategy has produced many superior results for all of the parameters.
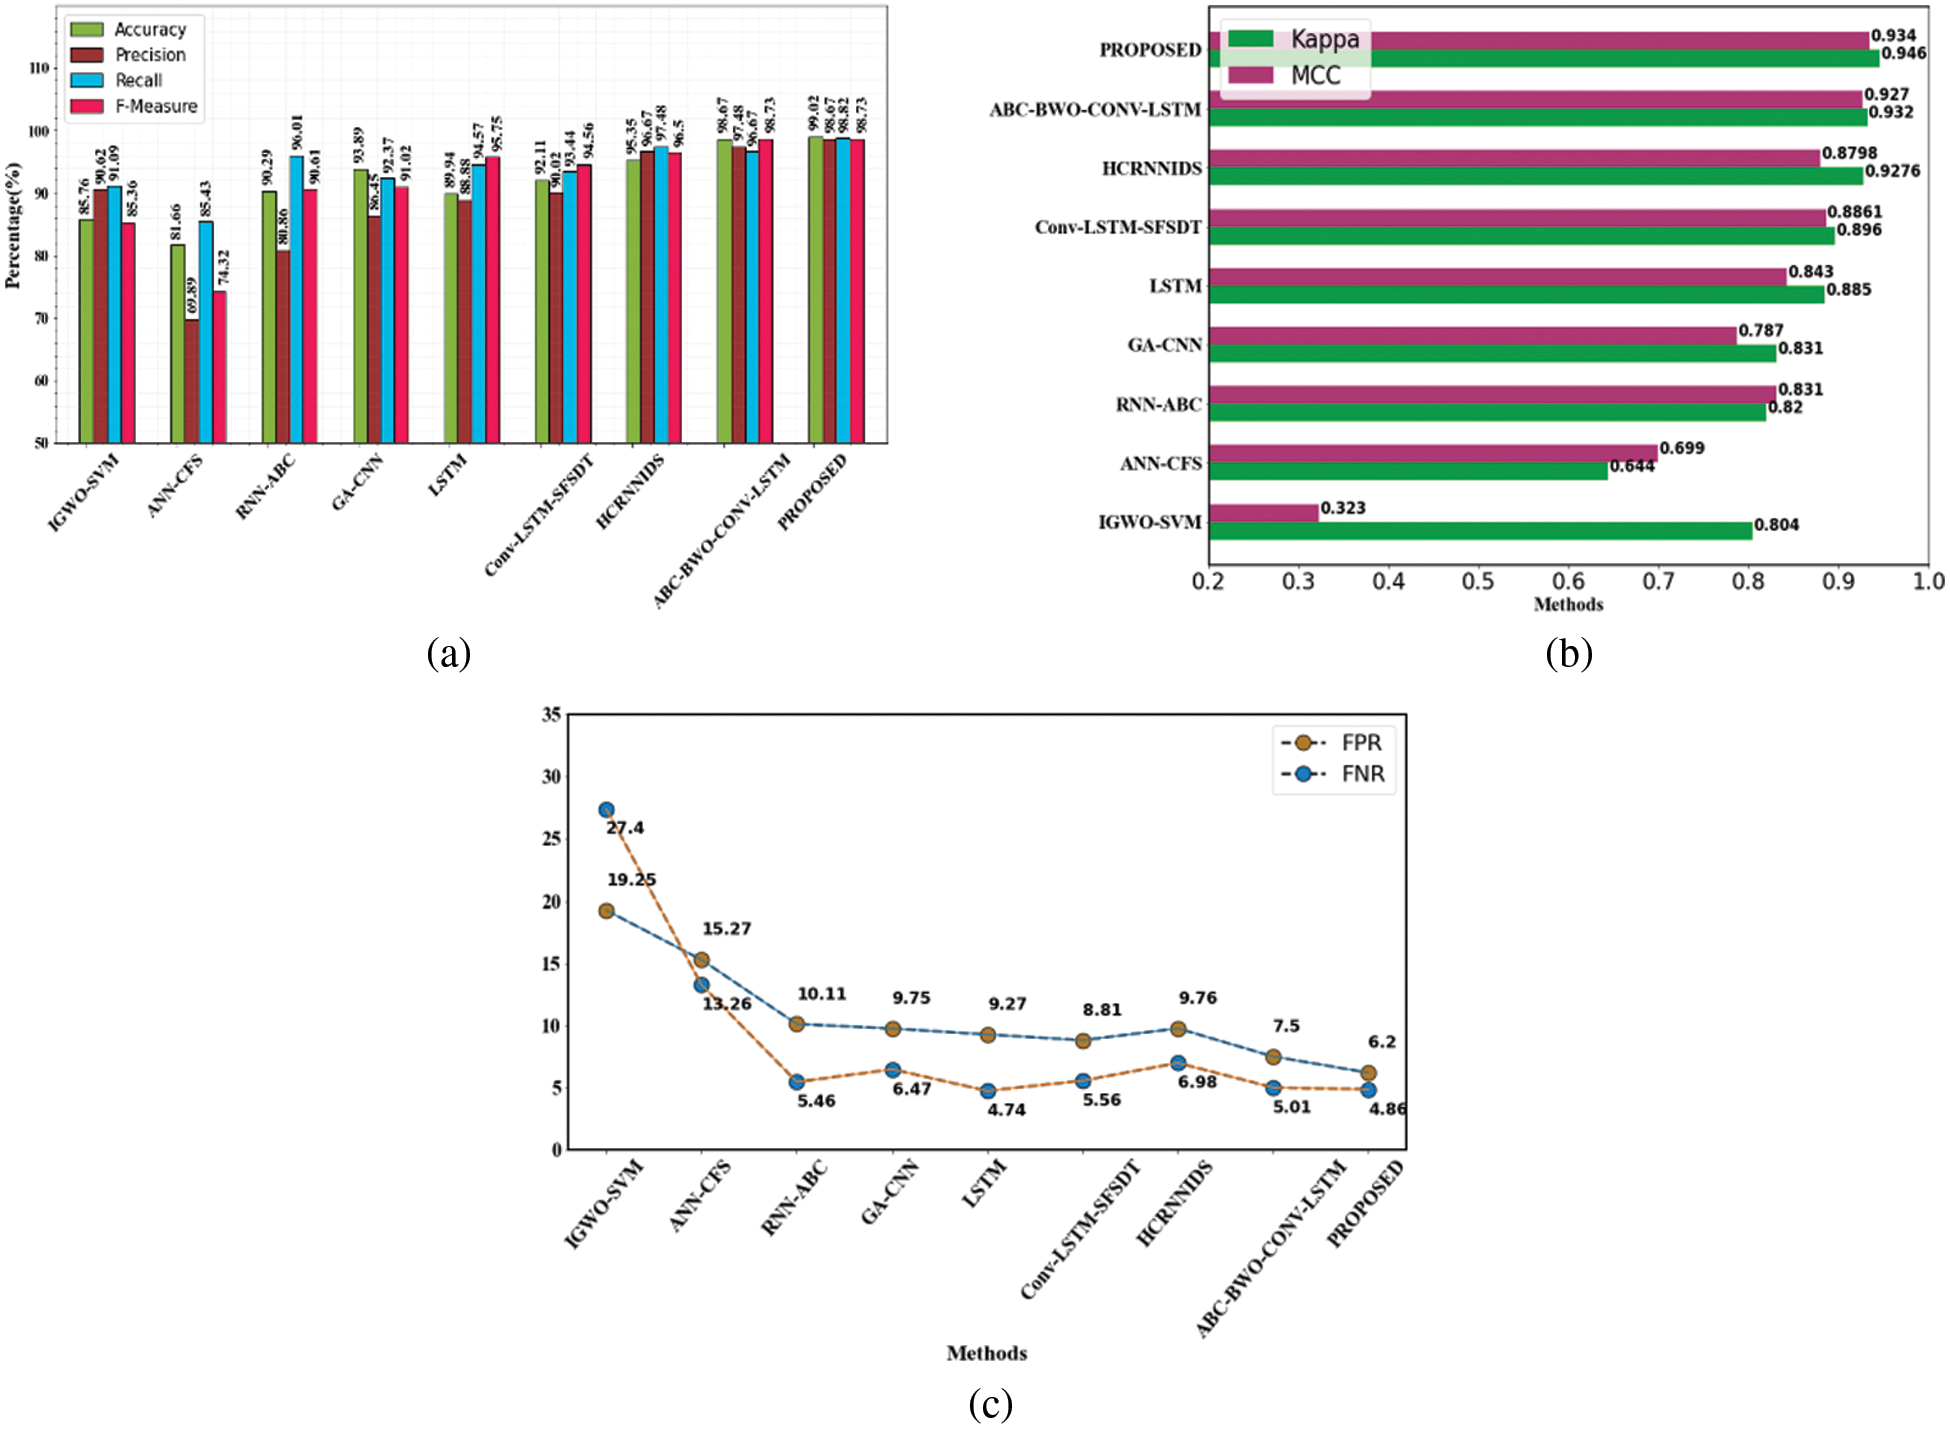
Figure 2: Evaluation performances on NSL-KDD dataset (a) accuracy, precision, recall and f1-measure comparison (b) evaluation of MCC and kappa (c) FPR and FNR differentiation with the existing method
4.3.2 Performance of CIC-IDS2017 Dataset
The performance of the CIC-IDS2017 dataset was analyzed using various existing methods. Comparison can be made with existing approaches like IGWO-SVM, ANN-CFS, RNN-ABC, GA-CNN, LSTM, Conv-LSTM-SFSDT, and HCRNNIDS. Performances of proposed Vs existing methods on the CIC-IDS2017 dataset are shown in Table 7.
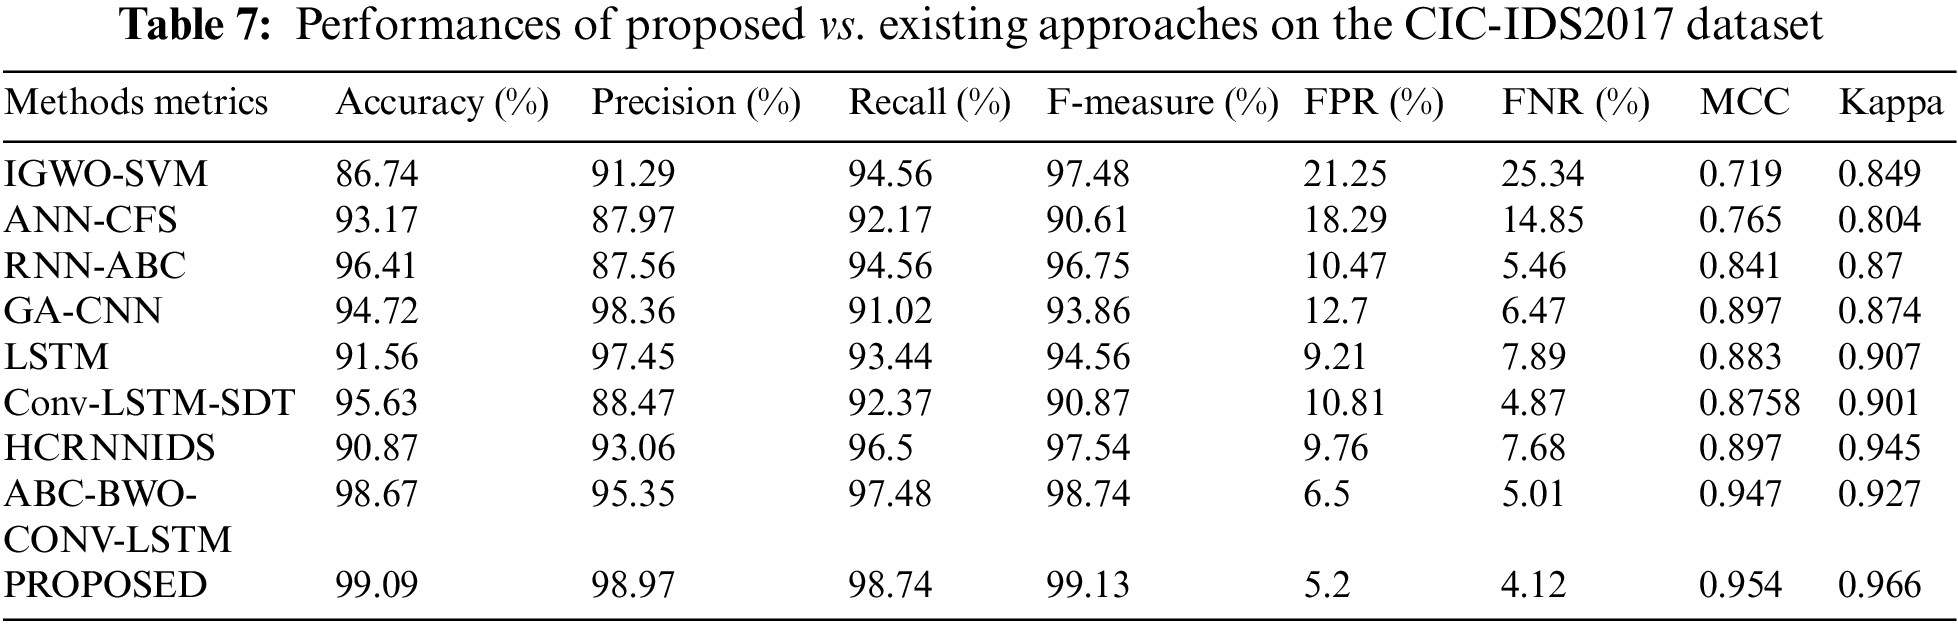
Fig. 3a represents the categorization metrics, Fig. 3b represents the evaluation of MCC and kappa and Fig. 3c represents the False Negative Rate and False Positive Rate values. The suggested strategy has produced many superior results for all of the parameters.
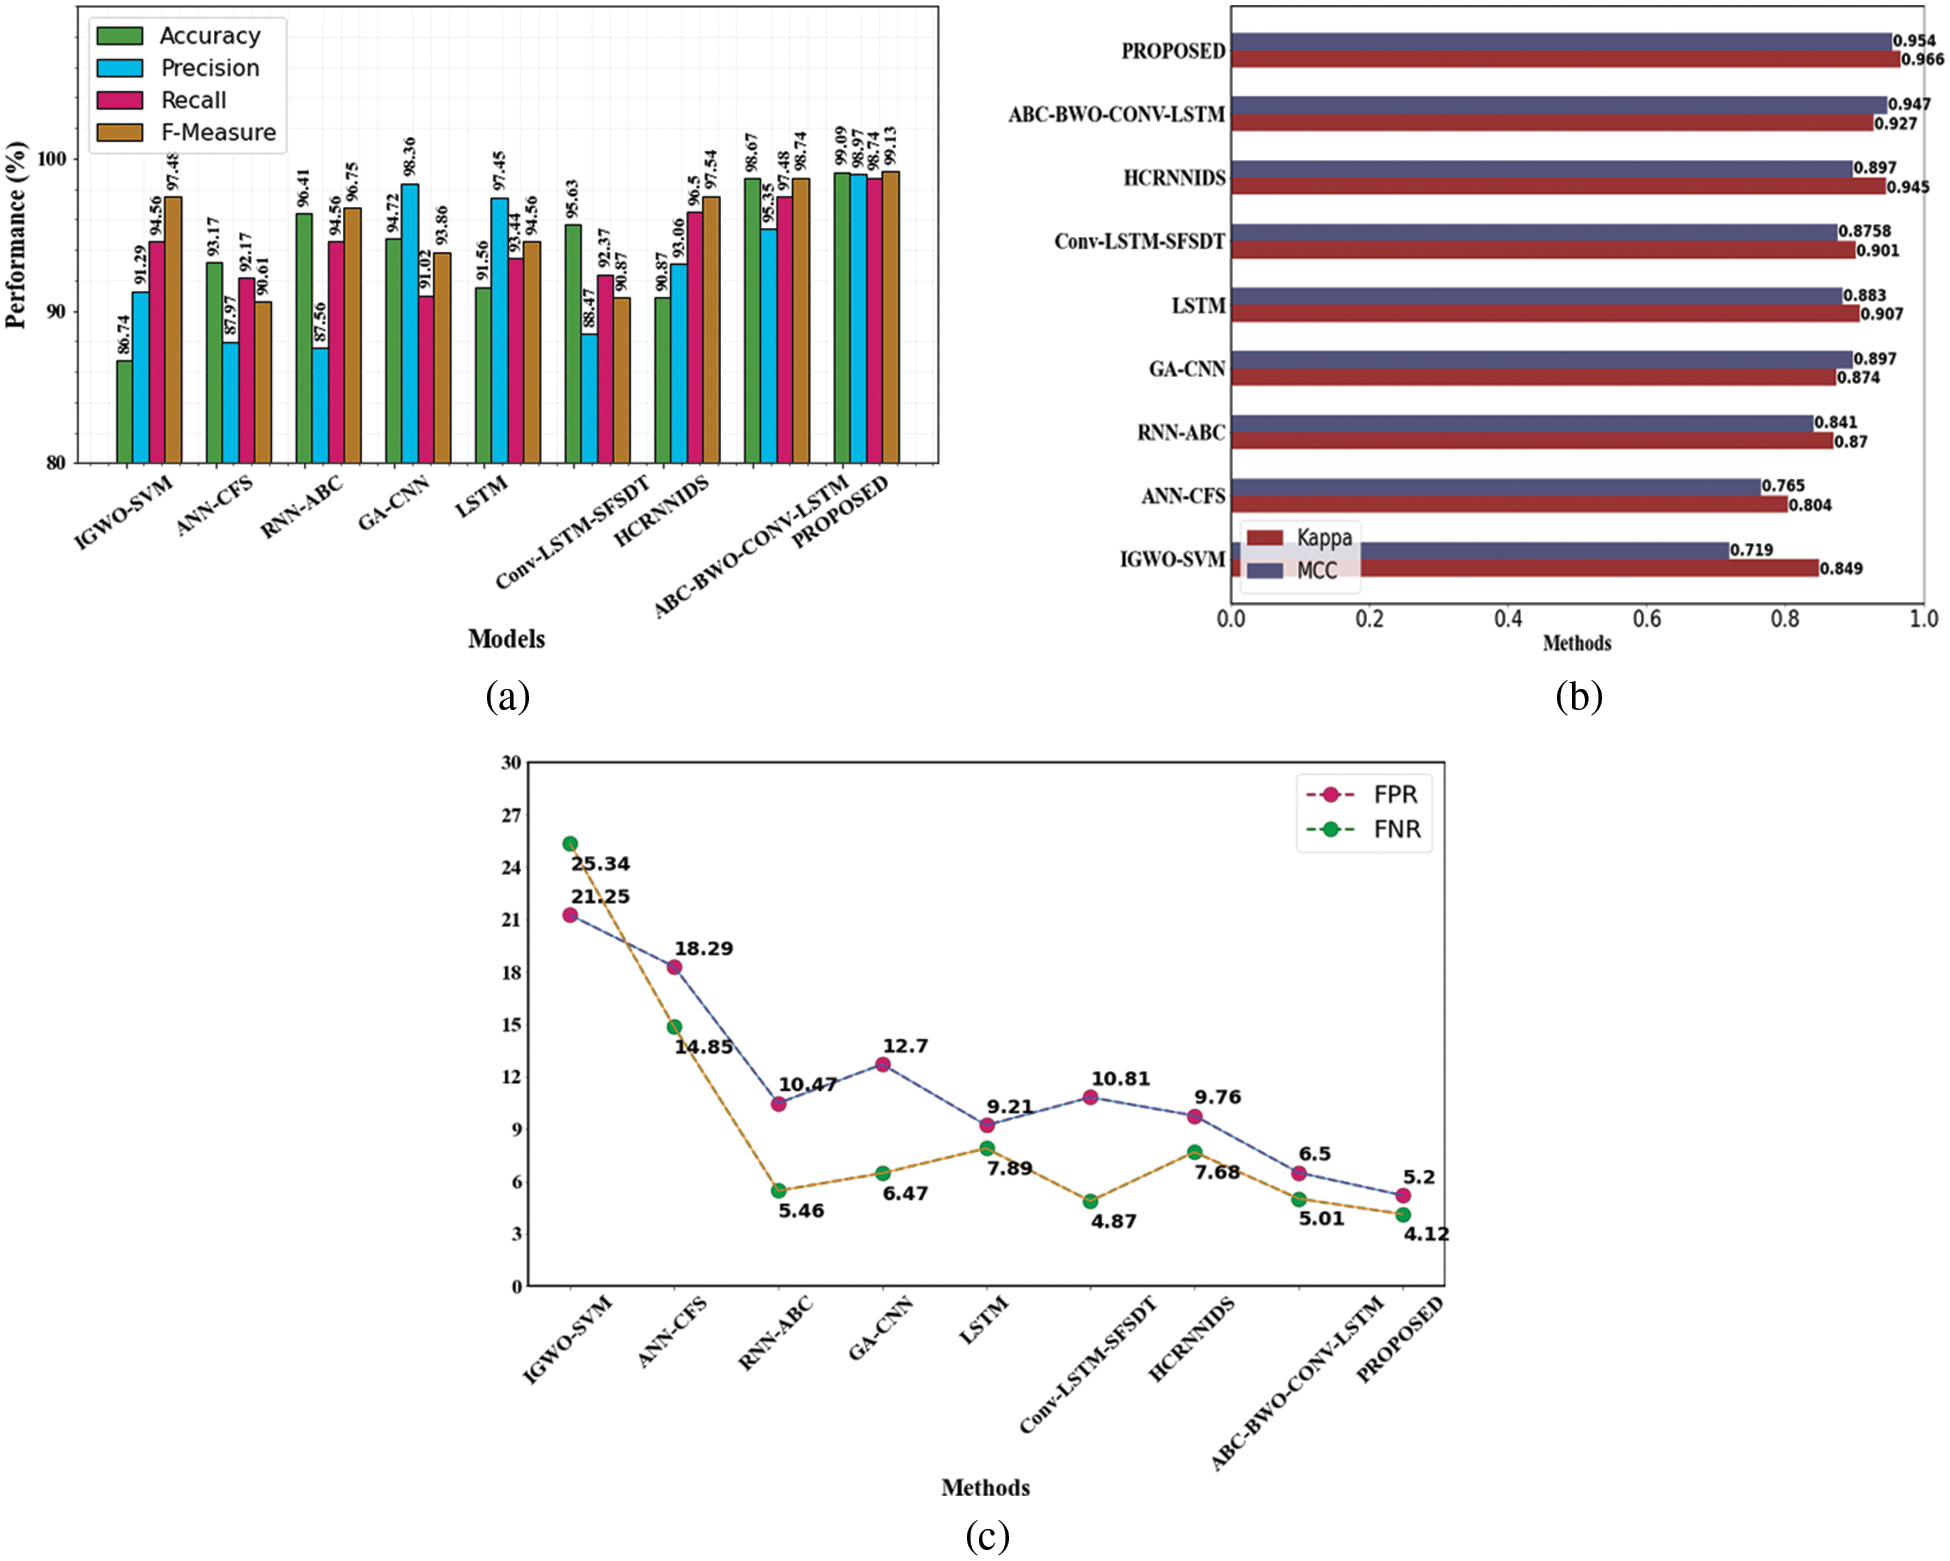
Figure 3: Evaluation performances on CIC-IDS2017 dataset (a) accuracy, precision, recall and f1-measure comparison (b) evaluation of MCC and kappa (c) FPR and FNR differentiation with existing methods
4.3.3 Performance of CSE-CIC-IDS 2018 Dataset
Similarly, CSE-CIC-IDS 2018 dataset was also analyzed and compared with existing approaches. The results of the attack detection tests are shown in Table 8.
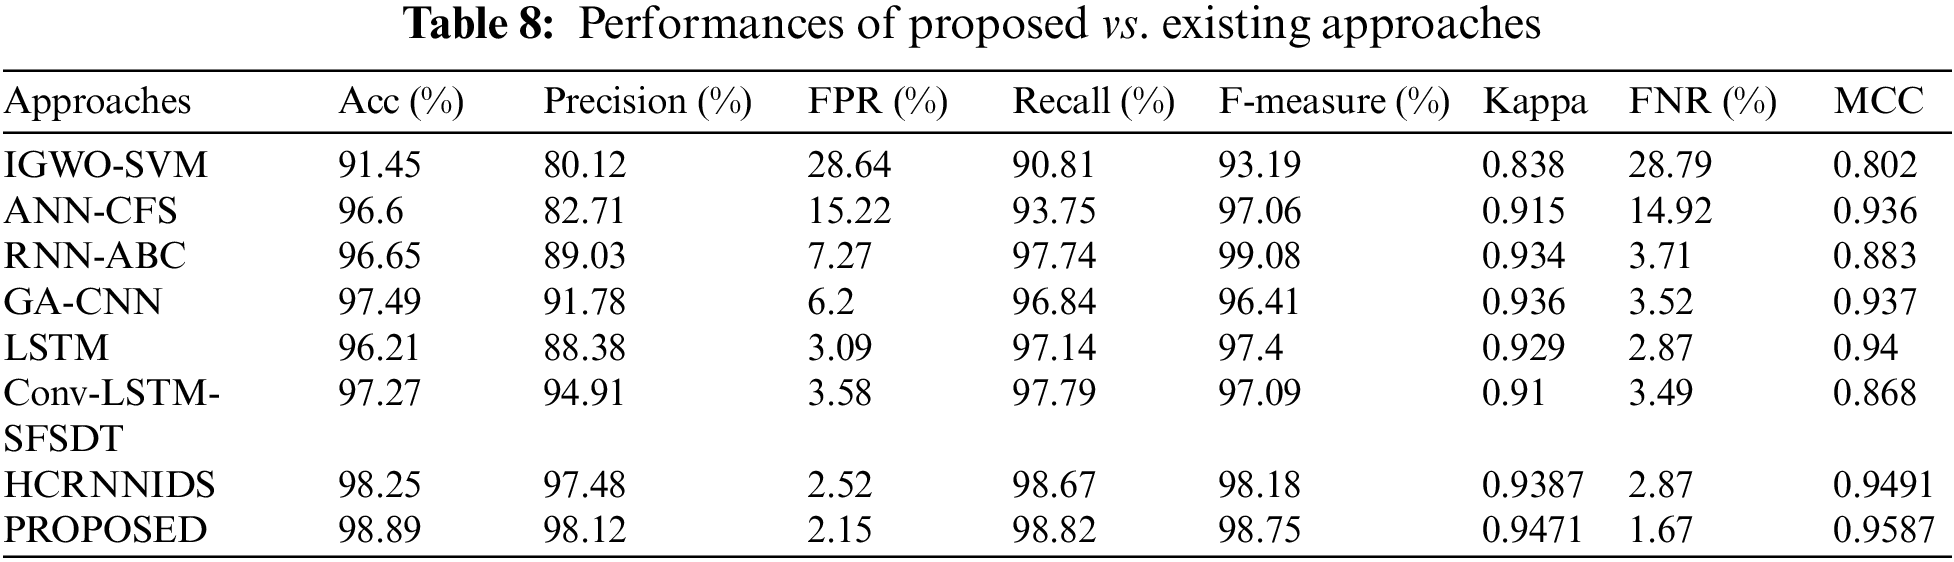
Fig. 4a represents the categorization metrics, Fig. 4b represents the evaluation of MCC and kappa and Fig. 4c shows the False Negative Rate and False Positive Rate values. It is obvious that the suggested strategy has produced much superior results for all of the parameters.
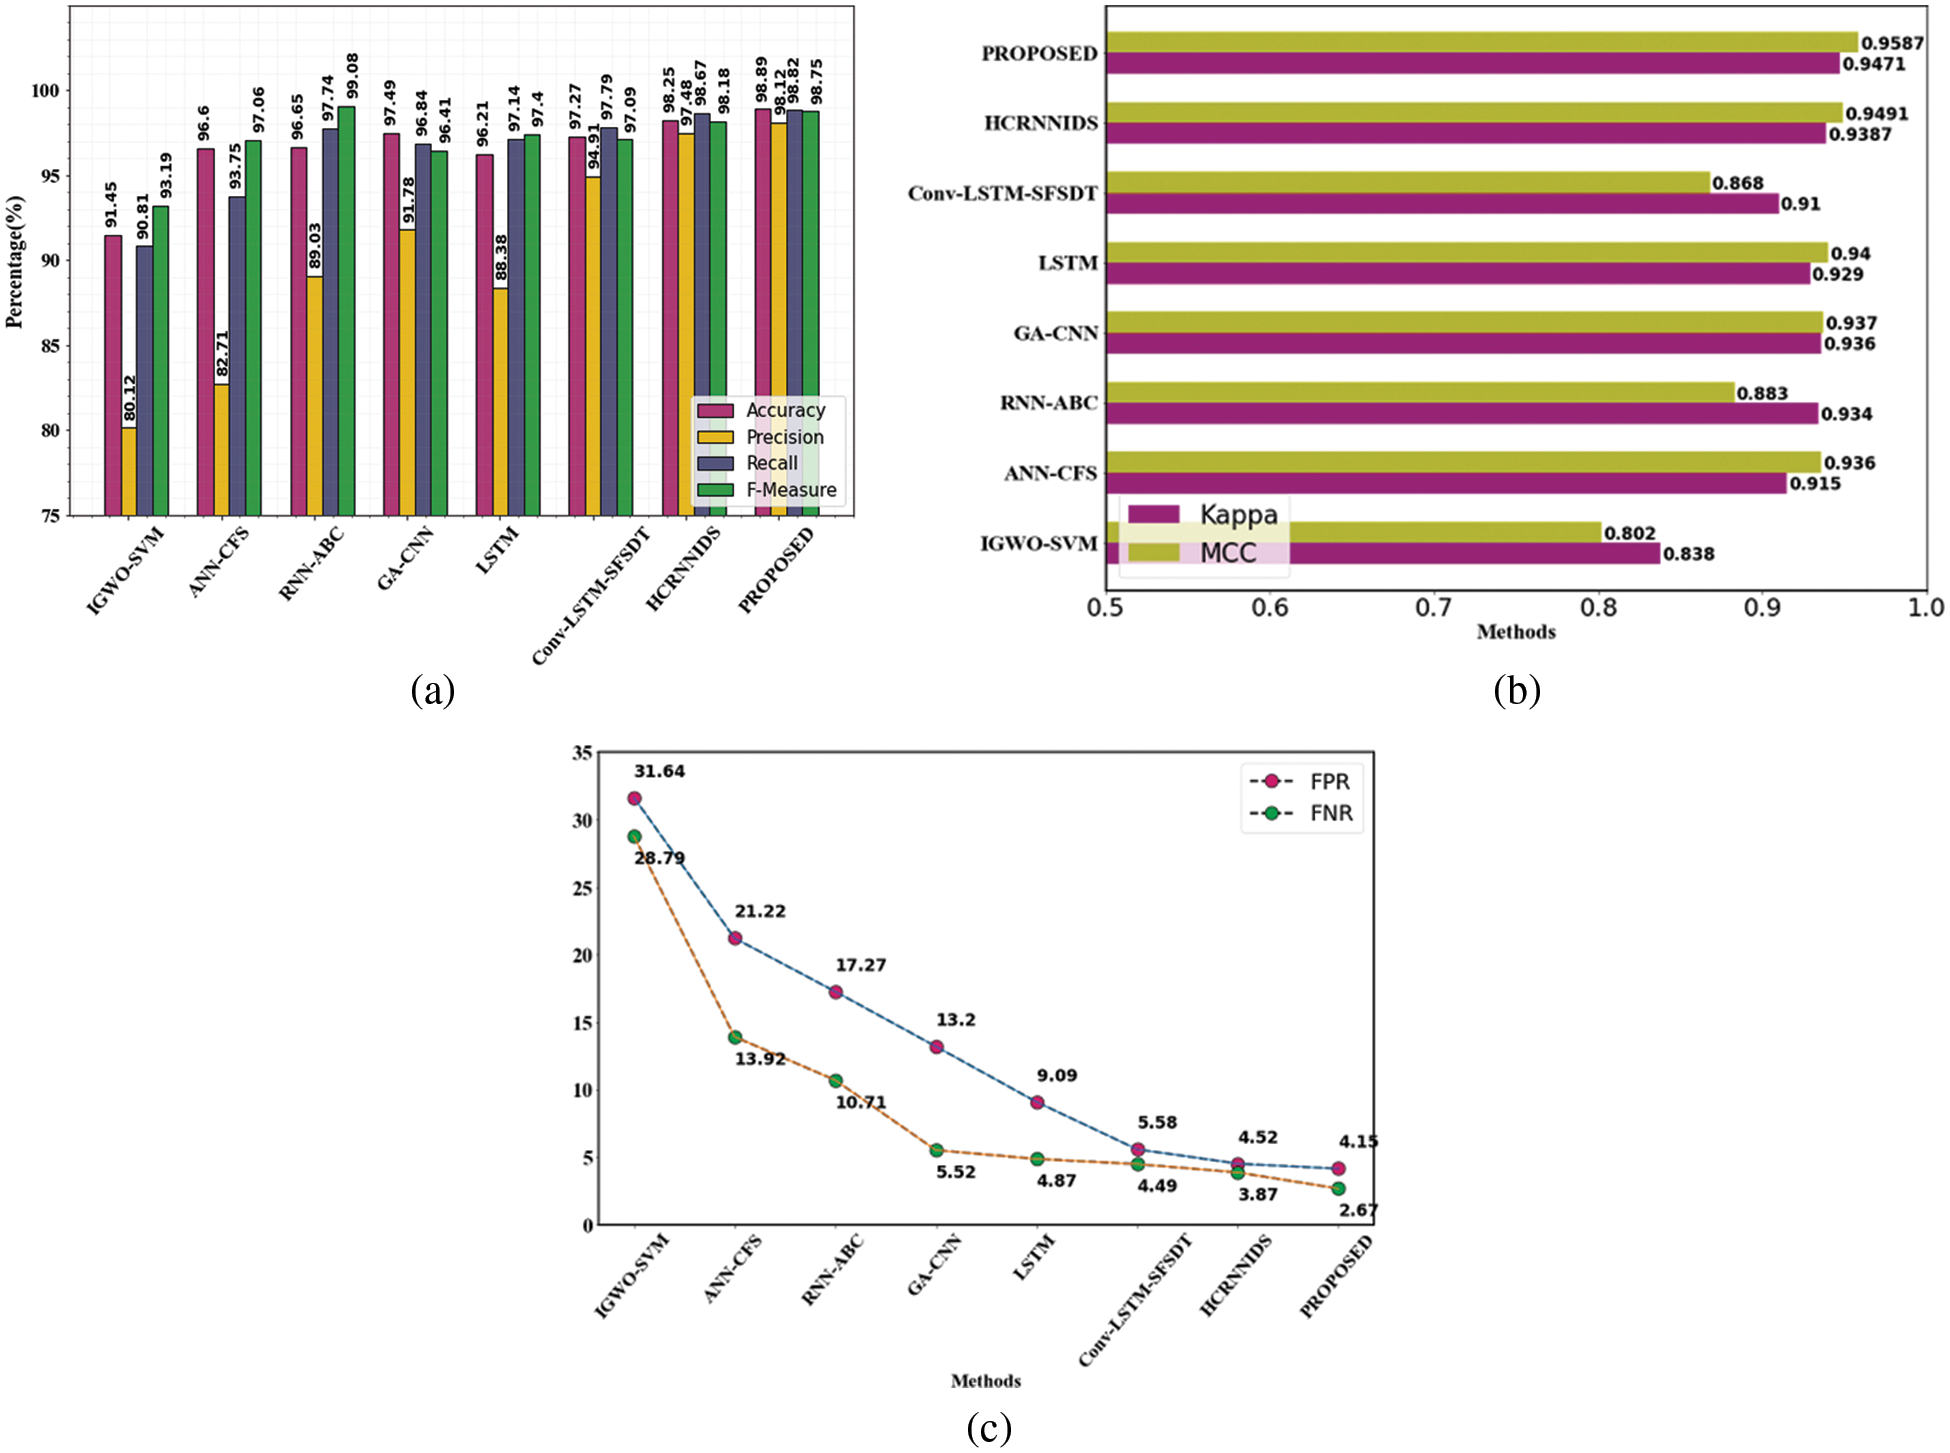
Figure 4: Evaluation performances on CSE-CIC-DS2018 dataset (a) accuracy, precision, recall and f1-measure comparison (b) evaluation of MCC and kappa (c) FPR and FNR differentiation with existing methods
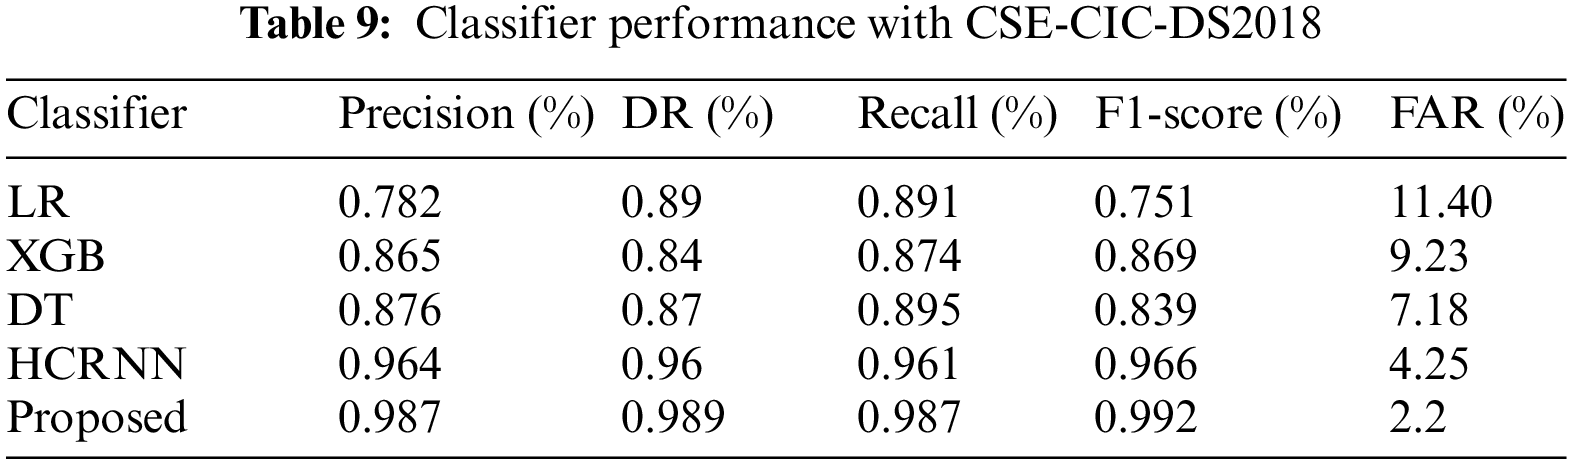
Table 9 represents classifier effectiveness with CSE-CIC-DS2018. The existing approaches like LR, XGB, DT and HCRNN are compared with the proposed approach. From the overall evaluation, our proposed approach yields greater performance. Then the second-best solution obtains in HCRNN.
4.3.4 Overall Intrusion Detection Results
In terms of the majority of the evaluation measures, the suggested approach outperforms the OCNNHMLSTM and other existing models in terms of individual attack detection performance. Table 10 provides an overview of the overall attacker recognition findings achieved using the suggested proposed model.
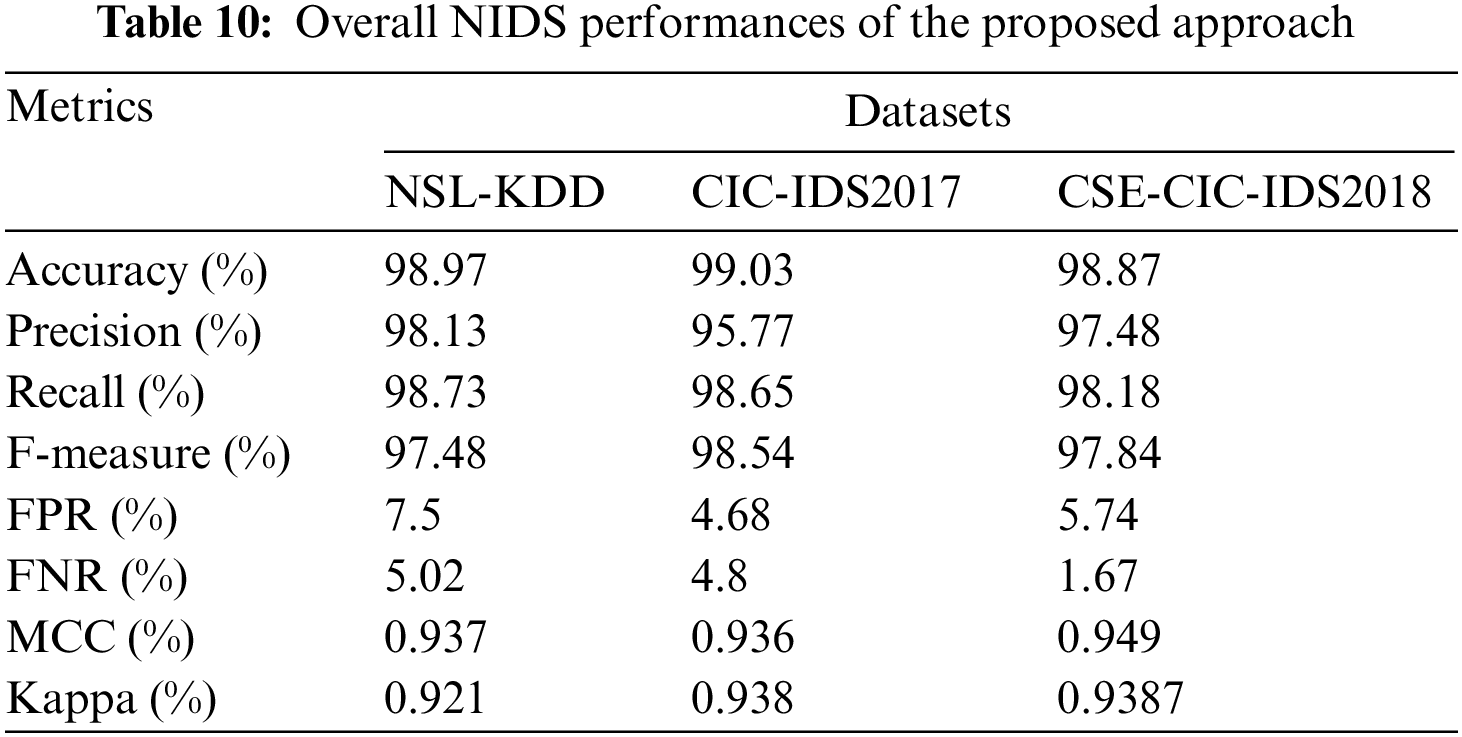
The accuracy values have consistently been above 97%, as shown in Fig. 5. For all four datasets, the precision, recall, and f-measure parameters are effective. The FPR and FNR are below 10%, which is regarded as acceptable. Analyzed three datasets in our proposed approach to gain a good outcome. These findings show that the proposed approach ensures superior IDS over most existing systems by using substantially more sophisticated DL of both spatial and temporal characteristics. The use of MBO for parameter optimization and IFPA for selecting features has also had a major impact on performance.
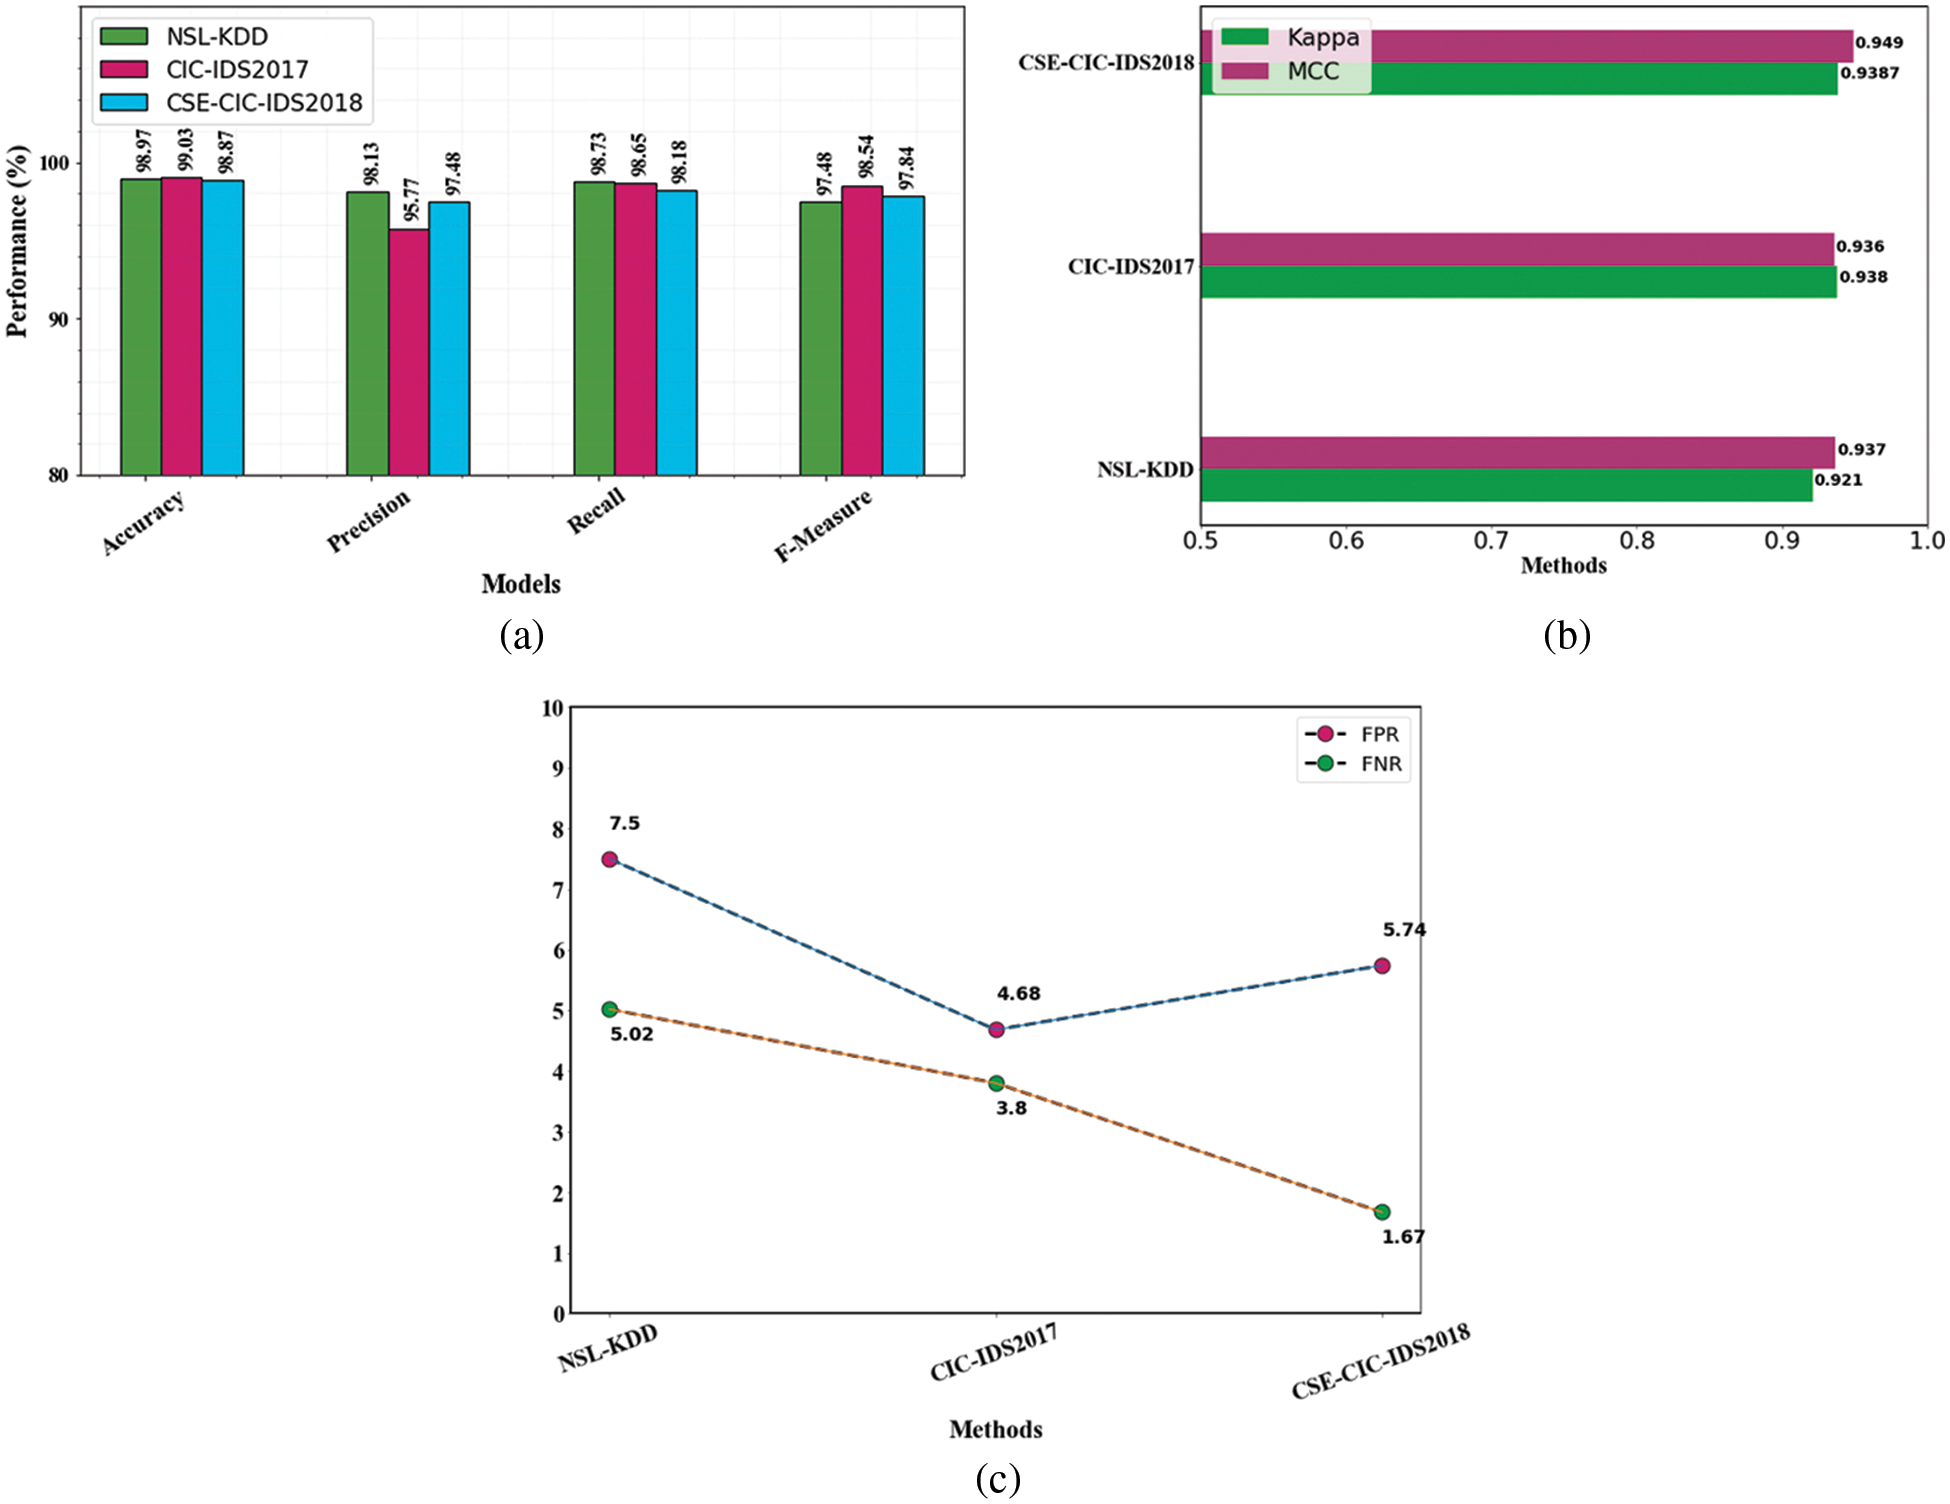
Figure 5: Evaluation performances on overall (a) accuracy, precision, recall and f1-measure comparison (b) evaluation of MCC and kappa (c) FPR and FNR differentiation with an existing method
One of the worst issues in any communication network is detecting malicious activity. This research examined the present constraints using a MapReduce-based suggested technique and recommended an ensemble IDS method. This IMBO-ANU Net classifier learns all attack characteristics and efficiently identifies maximal incursions in the network traffic data when combined with IFPA feature selection. Additionally, the issue of class imbalance is resolved, and excellent performance is attained with little to no spatial loss and a simple framework. This model has been evaluated using the NSL-KDD, CIC-IDS 2017, and CSE-CIC-IDS 2018 datasets. The results demonstrated that the suggested model effectively detected numerous attacks and enhanced IDS for all three datasets. It dramatically decreased the FPR and FNR values while improving accuracy. The outcome of the evaluation using the NSL-KDD, CIC-IDS 2017and CSE-CIC-IDS2018 data sets demonstrates that the proposed NIDS developed in the study has a high detection accuracy, with test sets of 98.97%, 99.03% and 98.87%, respectively. It also achieves the best FPR and FNR in three datasets. In the NSL-KDD dataset, the FPR is 7.5% and the FNR is 5.02%. Similarly, in CICIDS2017 data sets, the FPR is 4.68%, the FNR is 4.8%, and CSE-CIC-IDS 2018 achieves 5.74% FPR and 1.67% FNR. This method's training and detection times are relatively fast compared to other algorithms. It enhances accuracy and reduces the FPR and FNR. In future, various methods for data balancing will be investigated. Furthermore, the proposed method is intended to be applied instantly to network traffic in the big data environment.
Funding Statement: The authors received no specific funding for this study.
Conflicts of Interest: The authors declare that they have no conflicts of interest to report regarding the present study.
References
1. R. Vinayakumar, M. Alazab, K. P. Soman, P. Poornachandran, A. Al-Nemrat et al., “Deep learning approach for the intelligent intrusion detection system,” IEEE Access, vol. 7, no. 1, pp. 41525–44155, 2019. [Google Scholar]
2. Y. Zhou, G. Cheng, S. Jiang and M. Dai, “Building an efficient intrusion detection system based on feature selection and ensemble classifier,” Computer Networks, vol. 174, no. 1, pp. 107–247, 2020. [Google Scholar]
3. X. Li, W. Chen, Q. Zhang and L. Wu, “Building auto-encoder intrusion detection system based on random forest feature selection,” Computers & Security, vol. 95, no. 4, pp. 101–851, 2020. [Google Scholar]
4. M. A. Khan and J. Kim, “Toward developing efficient Conv-AE-based intrusion detection system using heterogeneous dataset,” Electronics, vol. 9, no. 11, pp. 17–71, 2020. [Google Scholar]
5. V. Kumar, D. Sinha, A. K. Das, S. C. Pandey and R. T. Goswami, “An integrated rule based intrusion detection system: Analysis on UNSW-NB15 data set and the real time online dataset,” Cluster Computing, vol. 23, no. 2, pp. 1397–1418, 2020. [Google Scholar]
6. O. Almomani, “A feature selection model for network intrusion detection system based on PSO, GWO, FFA and GA algorithms,” Symmetry, vol. 12, no. 6, pp. 10–46, 2020. [Google Scholar]
7. L. Lv, W. Wang, Z. Zhang and X. Liu, “A novel intrusion detection system based on an optimal hybrid kernel extreme learning machine,” Knowledge-Based Systems, vol. 195, no. 4, pp. 105–648, 2020. [Google Scholar]
8. S. N. Mighan and M. Kahani, “A novel scalable intrusion detection system based on deep learning,” International Journal of Information Security, vol. 20, no. 3, pp. 387–403, 2021. [Google Scholar]
9. M. Safaldin, M. Otair and L. Abualigah, “Improved binary gray wolf optimizer and SVM for intrusion detection system in wireless sensor networks,” Journal of Ambient Intelligence And Humanized Computing, vol. 12, no. 2, pp. 1559–1576, 2021. [Google Scholar]
10. R. Panigrahi, S. Borah, A. K. Bhoi, M. F. Ijaz, M. Pramanik et al., “A consolidated decision tree-based intrusion detection system for binary and multiclass imbalanced datasets,” Mathematics, vol. 9, no. 7, pp. 751, 2021. [Google Scholar]
11. P. Sun, P. Liu, Q. Li, C. Liu, X. Lu et al., “DL-IDS: Extracting features using CNN-LSTM hybrid network for intrusion detection system,” Security and Communication Networks, vol. 1, no. 1, pp. 23–30, 2020. [Google Scholar]
12. S. Gurung, M. K. Ghose and A. Subedi, “Deep learning approach on network intrusion detection system using NSL-KDD dataset,” International Journal of Computer Network and Information Security, vol. 11, no. 3, pp. 8–14, 2019. [Google Scholar]
13. B. A. Tama, M. Comuzzi and K. H. Rhee, “TSE-IDS: A two-stage classifier ensemble for intelligent anomaly-based intrusion detection system,” IEEE Access, vol. 7, no. 2, pp. 94497–94507, 2019. [Google Scholar]
14. R. V. Mendonça, A. A. Teodoro, R. L. Rosa, M. Saadi, D. C. Melgarejo et al., “Intrusion detection system based on fast hierarchical deep convolutional neural network,” IEEE Access, vol. 9, no. 2, pp. 61024–61034, 2021. [Google Scholar]
15. M. Ramaiah, V. Chandrasekaran, V. Ravi and N. Kumar, “An intrusion detection system using optimized deep neural network architecture,” Transactions on Emerging Telecommunications Technologies, vol. 32, no. 4, pp. 21–42, 2021. [Google Scholar]
16. S. Huang and K. Lei, “IGAN-IDS: An imbalanced generative adversarial network towards intrusion detection system in ad-hoc networks,” Ad Hoc Networks, vol. 105, no. 3, pp. 102–177, 2020. [Google Scholar]
17. A. N. Jaber and S. U. Rehman, “FCM-SVM based intrusion detection system for cloud computing environment,” Cluster Computing, vol. 23, no. 4, pp. 3221–3231, 2020. [Google Scholar]
18. A. Yazdinejadna, R. M. Parizi, A. Dehghantanha and M. S. Khan, “A kangaroo-based intrusion detection system on software-defined networks,” Computer Networks, vol. 184, no. 3, pp. 107–688, 2021. [Google Scholar]
19. H. Wang, Z. Cao and B. Hong, “A network intrusion detection system based on convolutional neural network,” Journal of Intelligent & Fuzzy Systems, vol. 38, no. 6, pp. 7623–7637, 2020. [Google Scholar]
20. H. Choi, M. Kim, G. Lee and W. Kim, “Unsupervised learning approach for network intrusion detection system using autoencoder,” The Journal of Supercomputing, vol. 75, no. 9, pp. 5597–5621, 2019. [Google Scholar]
21. N. Oliveira, I. Praça, E. Maia and O. Sousa, “Intelligent cyber-attack detection and classification for network-based intrusion detection systems,” Applied Sciences, vol. 11, no. 4, pp. 16–74, 2021. [Google Scholar]
22. M. Mazini, B. Shirazi and I. Mahdavi, “Anomaly network-based intrusion detection system using a reliable hybrid artificial bee colony and AdaBoost algorithms,” Journal of King Saud University-Computer and Information Sciences, vol. 31, no. 4, pp. 541–553, 2019. [Google Scholar]
23. M. A. Khan, “HCRNNIDS: Hybrid convolutional recurrent neural network-based network intrusion detection system,” Processes, vol. 9, no. 5, pp. 834, 2021. [Google Scholar]
24. H. Zhang, L. Huang, C. Q. Wu and Z. Li, “An effective convolutional neural network based on SMOTE and Gaussian mixture model for intrusion detection in imbalanced dataset,” Computer Networks, vol. 177, no. 1, pp. 107315, 2020. [Google Scholar]
25. A. N. Jaber and S. U. Rehman, “FCM-SVM based intrusion detection system for cloud computing environment,” Cluster Computing, vol. 23, no. 4, pp. 3221–3231, 2020. [Google Scholar]
26. B. A. Tama, M. Comuzzi and K. H. Rhee, “TSE-IDS: A two-stage classifier ensemble for intelligent anomaly-based intrusion detection system,” IEEE Access, vol. 7, no. 1, pp. 94497–94507, 2019. [Google Scholar]
27. T. A. Alamiedy, M. Anbar, Z. N. Alqattan and Q. M. Alzubi, “Anomaly-based intrusion detection system using multi-objective grey wolf optimization algorithm,” Journal of Ambient Intelligence and Humanized Computing, vol. 11, no. 9, pp. 3735–3756, 2020. [Google Scholar]
Cite This Article
 Copyright © 2023 The Author(s). Published by Tech Science Press.
This work is licensed under a Creative Commons Attribution 4.0 International License , which permits unrestricted use, distribution, and reproduction in any medium, provided the original work is properly cited.
 Downloads
 Citation Tools