
 Submit a Paper
 Propose a Special lssue
 Open Access
ARTICLE

Identification of Tuberculosis and Coronavirus Patients Using Hybrid Deep Learning Models
Computer Science Department, Umm Al-Qura University, Makkah City, 24243, Saudi Arabia
* Corresponding Author: Mohammed A. Al Ghamdi. Email:
Computers, Materials & Continua 2023, 76(1), 881-894. https://doi.org/10.32604/cmc.2023.037826
Received 17 November 2022; Accepted 23 April 2023; Issue published 08 June 2023
 View Full Text
 Download PDF
Abstract
Considerable resources, technology, and efforts are being utilized worldwide to eradicate the coronavirus. Although certain measures taken to prevent the further spread of the disease have been successful, efforts to completely wipe out the coronavirus have been insufficient. Coronavirus patients have symptoms similar to those of chest Tuberculosis (TB) or pneumonia patients. Chest tuberculosis and coronavirus are similar because both diseases affect the lungs, cause coughing and produce an irregular respiratory system. Both diseases can be confirmed through X-ray imaging. It is a difficult task to diagnose COVID-19, as coronavirus testing kits are neither excessively available nor very reliable. In addition, specially trained staff and specialized equipment in medical laboratories are needed to carry out a coronavirus test. However, most of the staff is not fully trained, and several laboratories do not have special equipment to perform a coronavirus test. Therefore, hospitals and medical staff are under stress to meet necessary workloads. Most of the time, these staffs confuse the tuberculosis or pneumonia patient with a coronavirus patient, as these patients present similar symptoms. To meet the above challenges, a comprehensive solution based on a deep learning model has been proposed to distinguish COVID-19 patients from either tuberculosis patients or healthy people. The framework contains a fusion of Visual Geometry Group from Oxford (VGG16) and Residual Network (ResNet18) algorithms as VGG16 contains robust convolutional layers, and Resnet18 is a good classifier. The proposed model outperforms other machine learning and deep learning models as more than 94% accuracy for multiclass identification has been achieved.Keywords
China experienced the breakout of an unidentified sickness in December 2019, when a few local people exhibited symptoms of the disease. Initially, although obscure, the sickness was in the long run recognized by specialists as having influenza and COVID-like side effects [1–4]. The emergence of this broad disease was already obscure yet following research center testing and continuous Polymerase Chain Response (PCR) examination of positive sputum, the viral contamination was checked and given the name “COVID-19” by the World Health Organization (WHO). COVID-19 rapidly extends across global boundaries, substantially affecting the well-being, economy, and government assistance of the total populace [5]. As indicated by information from Worldometers (worldometers.info), more than 86 million people around the globe had suffered from COVID-19 until January 5, 2021, and more than 1,870,000 of these people had died from the disease. By guaranteeing patient detachment and pandemic control, early identification of COVID-19 is necessary for both patient consideration and general well-being [6]. Analysts considered screening, quick identification of infected people, and isolation from healthy individuals as basic measures. Because the sickness was obscure at that point, there were no perceived therapies.
Clinical indications of COVID-19 include pneumonia, fever, hack, dyspnea, and respiratory side effects. These side effects, although often observed in pneumonia patients, are not guaranteed to highlight COVID-19, making it hard for specialists to make a diagnosis. Although the RT-PCR test offers the highest-quality level of testing for COVID-19 determination, it has a few restrictions and explicit attributes that enable disease testing to be recognized. Reverse Transcription-Polymerase Chain Reaction (RT-PCR) is a serious, costly, muddled, and tedious procedure. The necessity for a lab pack, which numerous countries find troublesome or even difficult to give during emergencies and plagues, is one of the weaknesses of this methodology. This strategy, similar to other analytic and research facility methods utilized in medical services frameworks, has a predisposition and errors. Since inspecting the nasal and throat mucosa requires a gifted research center specialist and is awkward, numerous patients reject nasal trade testing. Even more critically, a few examinations have revealed the low responsiveness of the RT-PCR test; they have assessed that this demonstrative technique’s responsiveness increases from 30% to up to 60%, showing a drop in the precision of COVID-19 determination on several occasions. Additionally, its misleading destructive rate and clashing outcomes were referenced in specific explorations.
The world has been incapacitated and has lacked assets to battle the coronavirus. The number of asymptomatic patients can be larger than the number of confirmed cases, assuming that testing is performed over a much larger scope. As reported by the World Wells Association, testing should be performed at three times larger rates than is currently being performed. We do not have such a limit established yet to perform testing at this level. Other than coronavirus, we are additionally battling tuberculosis over the years. Nevertheless, we cannot handle this level of illness. A total of 1.5 million individuals died from tuberculosis in 2018. Utilizing radiological imaging, such as X-beams and Computed Tomography (CT) filters, is one of the most vital ways to analyze COVID-19. The underlying device in screening during pandemics, chest imaging, is a quick and straightforward method that is prompted by clinical and well-being rules [7]. As coronavirus has side effects that are similar to pneumonia, asthma, and tuberculosis, it is extremely challenging to anticipate coronavirus on the foundations of side effects without performing tests. Any clinical trial is assessed on the foundations of two boundaries: sensitivity and specificity.
Responsiveness implies that a test needs to distinguish all individuals with an infection. For instance, if 100 individuals are tested, and 50 of them have tuberculosis, a decent test ought to identify each of the 50 individuals. For this situation, healthcare providers would discuss a test with a ‘high responsiveness’. Explicitness implies that a test just distinguishes individuals with an illness and does not incorrectly identify a sickness in someone who is well. If 100 individuals are tested for tuberculosis, 50 individuals are identified as normal, and a test with a decent explicitness would accurately distinguish the 50 normal individuals and show 50 adverse outcomes. Customary approaches to testing are exorbitant and time-consuming. Extraordinary hardware and prepared staff are expected to perform tests. Coronavirus and tuberculosis can likewise be analyzed by X-beam images. On a chest X-beam of someone with tuberculosis, the cavitation of the tuberculosis microscopic organisms’ structure in the lung tissue is frequently observed.
The most common changes in the lungs of a patient with the coronavirus include the accumulation of fluid and/or tissue in pulmonary ducts, the opacity of ground glass, and shrinking and shadowing of nodular veins. This contamination essentially influences the fringe and lower region of the lungs. Although X-beam imaging has lower awareness, it has an accuracy rate above 90%. Thus, these pictures are generally utilized as markers to analyze and recognize COVID-19 and tuberculosis symptoms and those of a normal individual. Man-made consciousness can be consolidated to characterize a COVID-19 patient, tuberculosis patient, and healthy individual using X-beam imaging, as coronavirus and TB have similar side effects and both can be analyzed utilizing X-beam images. To efficiently distinguish between COVID-19 and TB patients, a deep learning framework based on the fusion of VGG16 and Resnet18 has been proposed that outperforms other state-of-the-art models. The following contributions are achieved through the implementation of the proposed model.
• X-ray beams (an effective and cheap resource) are used for the reliable detection of the disease.
• A fusion-based deep learning model is used to distinguish between COVID-19, TB, and healthy persons.
• The proposed model is superior in performance than current state-of-the-art models.
A substantial amount of research on illness recognition has been completed utilizing X-beam images. A portion of this work has addressed the characterization and discovery of coronavirus and pneumonia utilizing X-beam images. Tuberculosis has likewise been analyzed utilizing X-beam images via profound learning. However, TB and coronavirus have not been investigated using profound learning. The authors in [8] employed deep network architecture for quick chest X-ray tuberculosis screening and diagnosis. This work consists of five convolutional blocks, followed by a fully coupled softmax layer with two outcomes and a global normal pooling layer (which packs each component guide to its mean worth). Two 3 × 3 convolutions with Rectified Linear Units (ReLUs) are included in each convolutional block, followed by a maximum pooling activity. Compared with AlexNet [9], the pooling size in step 2 is 3 × 3. The authors in [10] presented chest radiographs for TB using artificial intelligence, where three deep learning frameworks were employed for the characterization. In [11], convolutional brain organization is used to separate TB from other diseases in chest X-beam images. The authors have proposed a novel method for handling erratic, lower-class, X-beam images using a Convolutional Neural Network (CNN). Their method significantly improves the accuracy of analyzing various TB symptoms. To prepare the methodology, the authors examine the effectiveness of mixed examination with cross-approval and discover that it has a notable impact on the categorization of clinical images. They achieved an 85.68% precision rate with a sizable collection of TB images.
In [12], the authors made incremental improvements to COVID-19 identification, utilizing a CNN for thorough component extraction and a Support Vector Machine (SVM) for the classification. They discovered the coronavirus using X-beam images and determined that it had a dual characterization. This research suggests an advanced learning-based method for diagnosing COVID-19 patients using X-beam images. The deep component is used to assist the vector machine in organizing the coronavirus-impacted X-beam images from various sources. The method helps the clinical expertise to evaluate a patient who has been exposed to COVID-19. To identify COVID-19, the recommended model, such as RESNET-50 in combination with the SVM, achieves quality metrics, namely, precision, Final Production Run (FPR) (95.38%), F1-score (95.52%), Matthews Correlation Coefficient (MCC) (91.41%), and Kappa (90.76%). Automated models for pneumonia detection and classification were developed on X-ray images using MobileNet V2 and Xception frameworks. The suggested methods have been verified on the data that contains 5856 images (1583 typical and 4273 pneumonia). The authors concluded that calibrated versions of RESNET-50, with MobileNet V2 and Inception RESNET V2, exhibit appealing results. In [13], the authors tested for viral and COVID-19 pneumonia. The test was administered to examine the effectiveness of Artificial Intelligence (AI) from chest X-ray images. The authors have created a public data collection by combining 1) various public information bases and 2) providing recent research images. The collection contains images of COVID-19 (423), pneumonia (1485), and standard chest X-rays (1579). A few premade deep CNNs were created and approved using the move learning approach and image enhancement. Certain organizations were willing to purchase two different plans: one plan for typical COVID-19 pneumonia and another plan for viral COVID-19 pneumonia with and without image enhancement. For both designs, the respective scores for exactness, accuracy, responsiveness, and explicitness were 99.7%, 99.7%, 99.7%, and 99.55%, respectively, as well as 97.9%, 97.95%, 97.9%, and 98.8%, respectively [14]. A deep learning classifier framework was developed by the authors in [15] to diagnose COVID-19 in X-ray images. The proposed COVIDX-Net includes several types of deep convolutional brain network models, including the second generation of Google MobileNet and the revised VGG19. To efficiently conduct experiments and evaluate COVIDX-Net, 80 percent of X-beam images were used for training the model and 20% for the testing phase. Achieving F1-scores of 0.89 and 0.91 for normal and COVID-19 respectively, VGG19 with the dense convolutional network (DenseNet) models demonstrated a respectable and comparable presentation of robotized COVID-19. In [16], the authors organized images of chest X-beams using fluffy variety and stacking techniques while attempting COVID-19 identification with deep learning models to benefit from social mimic optimization. A kind of automated reasoning that is referred to as deep learning was applied in this review to identify coronavirus. The data collection consists of three different classes: COVID-19, pneumonia, and standard X-beam symbols. The images were organized with the initial pictures that were stacked, and the information classes were reconstructed using a preprocessing step of the fuzzy color technique. The dataset was then employed with MobileNetV2 and SqueezeNet deep learning models. The model capabilities were handled by applying the social mimic augmentation method. The proposed technique yielded a general categorization rate of 99.27% [17]. Additional work has also been completed to use X-beam imaging to identify a specific ailment. COVID-19 has also been more specifically examined using X-beam images. However, attention has been given to the problem of the early and robust identification of the disease. Additionally, deep learning frameworks have not been fully utilized to distinguish COVID and TB using X-beam images. The authors in [18] proposed an Internet of Things (IoT) based screening system to detect face masks using the VGG16 deep learning model.
As profound learning is in its pinnacle period, some exploration has been completed and additional work is underway. Some calculations have been proposed to address different genuine issues. Profound learning models are best utilized in class models for various complex undertakings, including discourse acknowledgment, PC vision, and machine interpretation. Nonetheless, preparing profound learning models, for example, profound brain networks, is a complicated undertaking, as during the preparation stage, the contributions of each layer continually change [19]. We are likewise consolidating a profound learning answer for analyzing COVID-19 and TB. This multiclass characterization consists of three classes: coronavirus-positive, TB-positive, and normal patients. The proposed model contains four fundamental layers, as shown in Fig. 1, namely, the data acquisition layer, data preprocessing layer, application layer, and performance evaluation layer.

Figure 1: Block diagram of the model
The datasets of coronavirus and TB patients are collected from Kaggle [20]. The tuberculosis dataset is accumulated from an alternate source, and the COVID-19 dataset is gathered from an alternate Kaggle account. There are 357 chest X-ray images for coronavirus patients. These two datasets additionally contain chest x-beam pictures of healthy individuals. After the collection of information from various sources, the data is combined to create a solitary dataset. This dataset contains pictures of coronavirus and tuberculosis patients’ chest x-beams. Additionally, the dataset also contains X-beam images of healthy individuals. The information acquisition layer is shown in Fig. 2. A few X-beam images for tuberculosis and coronavirus patients are presented in Fig. 3.
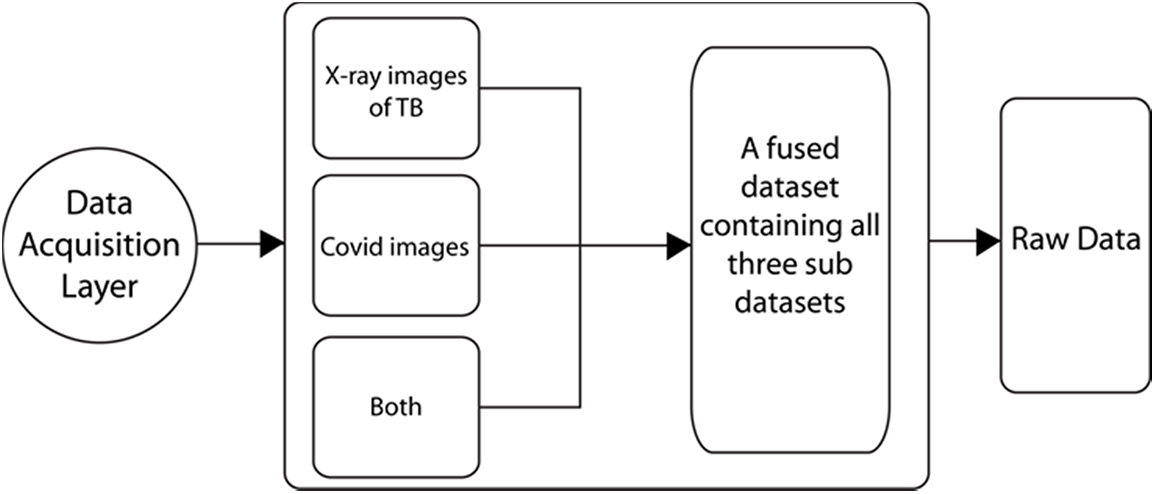
Figure 2: Data acquisition layer
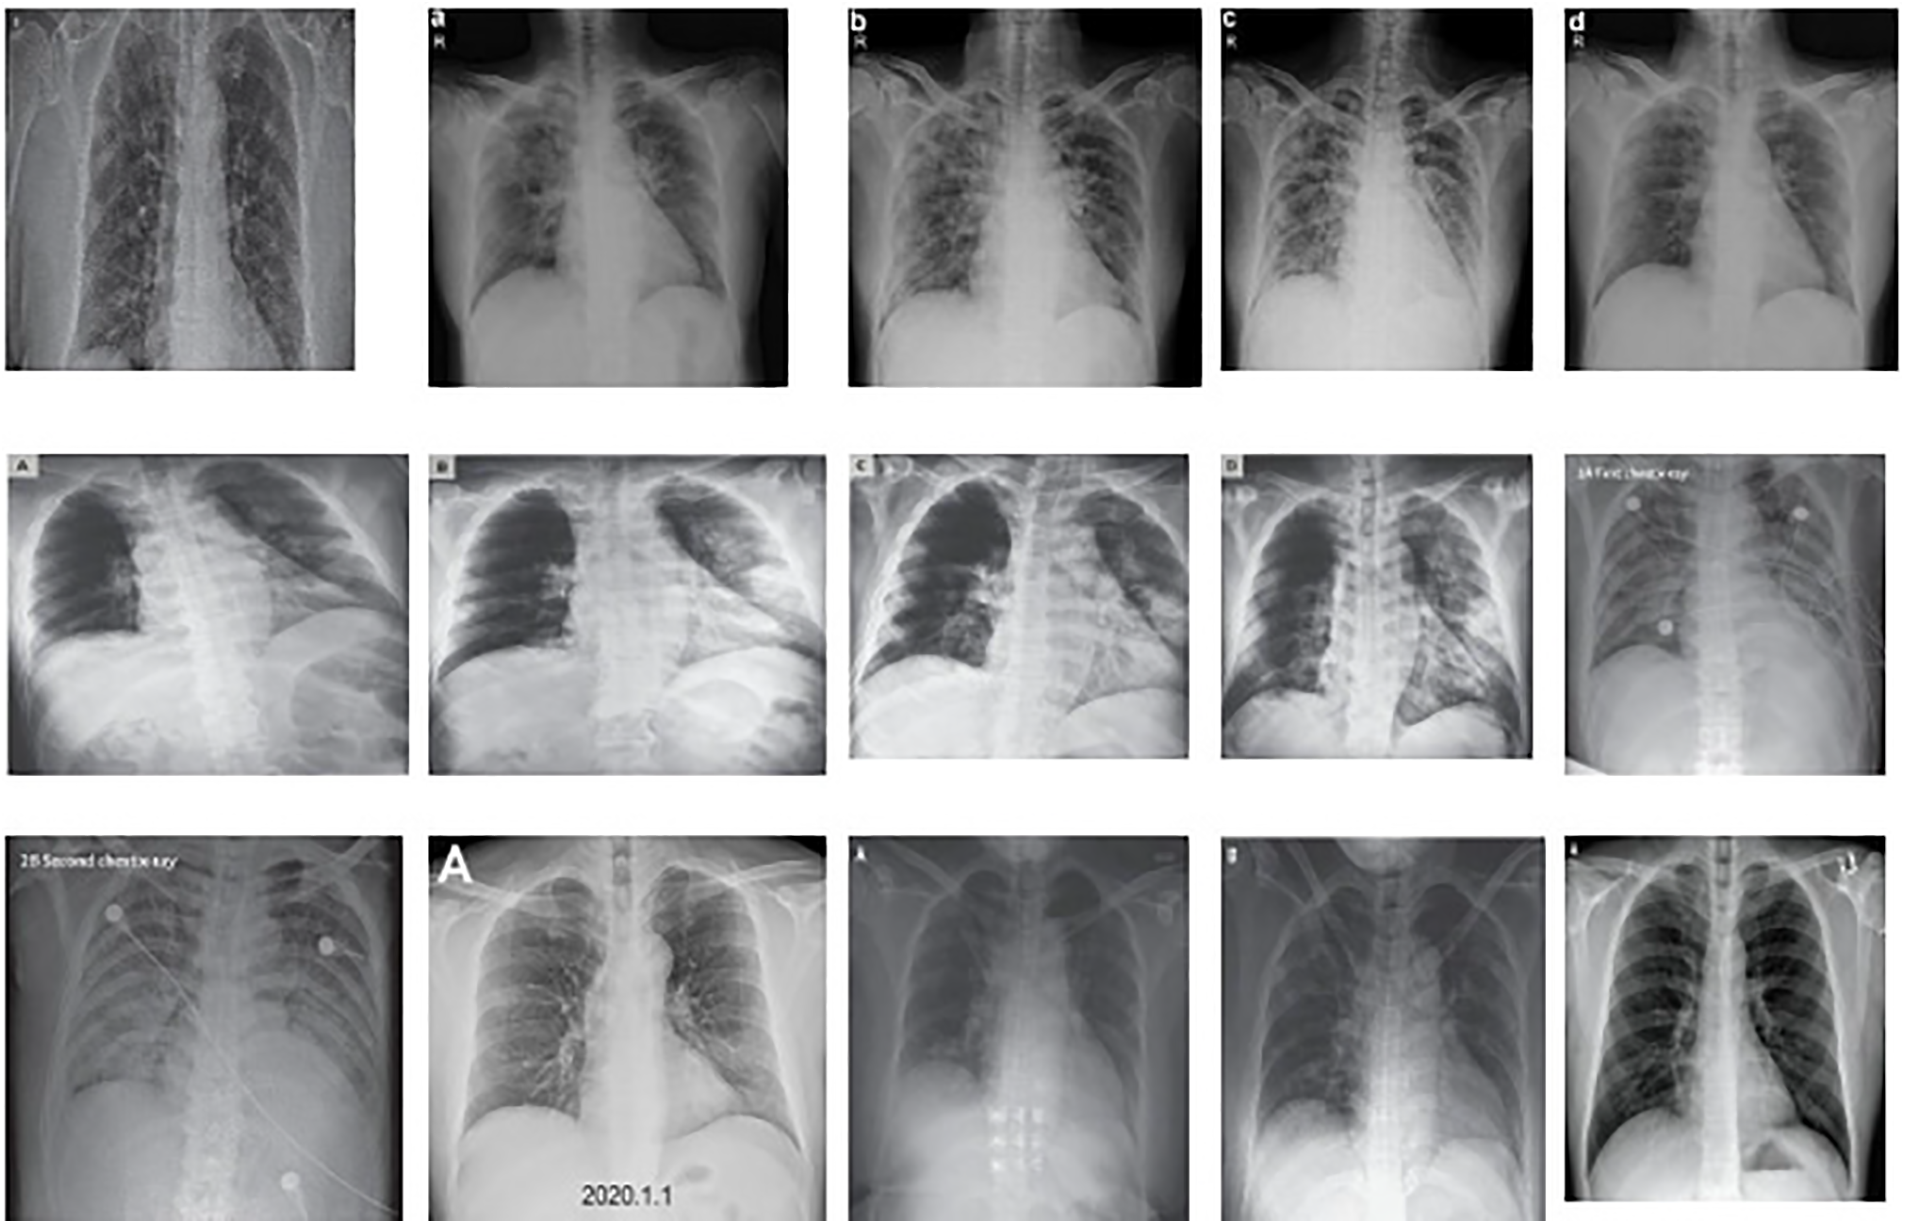
Figure 3: Sample data from the provided dataset
As revealed in the dataset, the X-beam images have different sizes and designs and are on various scales. Furthermore, it is almost consistently beneficial to apply pre-handling changes to the information before it is introduced to an organization. Additionally, the results of the organization frequently present the expected resulting values [21]. Thus, we want to preprocess the information before presenting it to the organization. The information in pre-handling layer is displayed in Fig. 4.
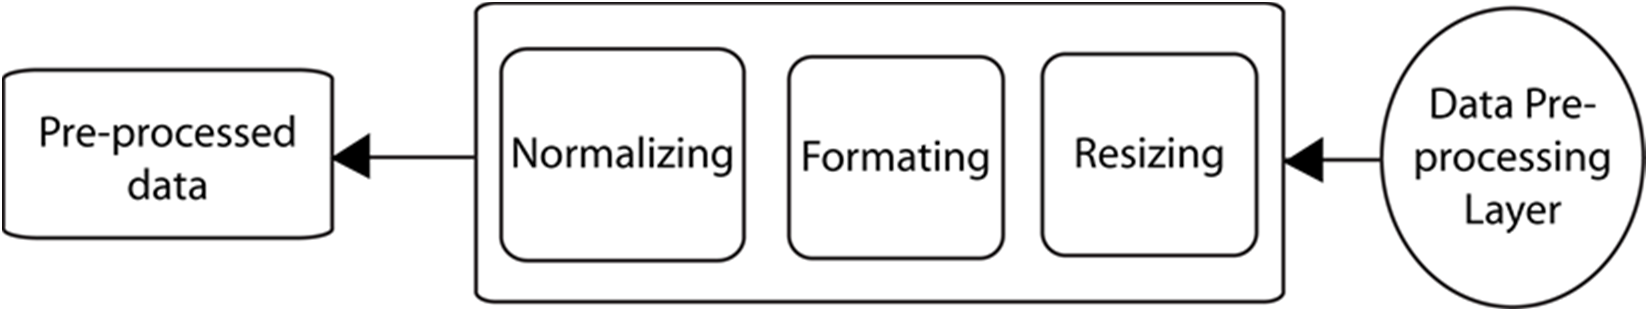
Figure 4: Data preprocessing layer
The information has been designed, resized, and standardized to address these issues. As X-beam images are of various sizes, we resized our pictures to 224 × 224. The obtained pictures are in various organizations. The pictures are in jpg format, png configuration, or other formats. In this way, we converted each of the pictures to png format for further handling. Our X-beam images have various scales. Some pictures are brilliant and some are hazy. Along these lines, we performed picture scaling to standardize our information. The following figure shows a picture after the pre-handling steps. We obtained the five X-beam images as displayed in Fig. 5 during the preprocessing stage.
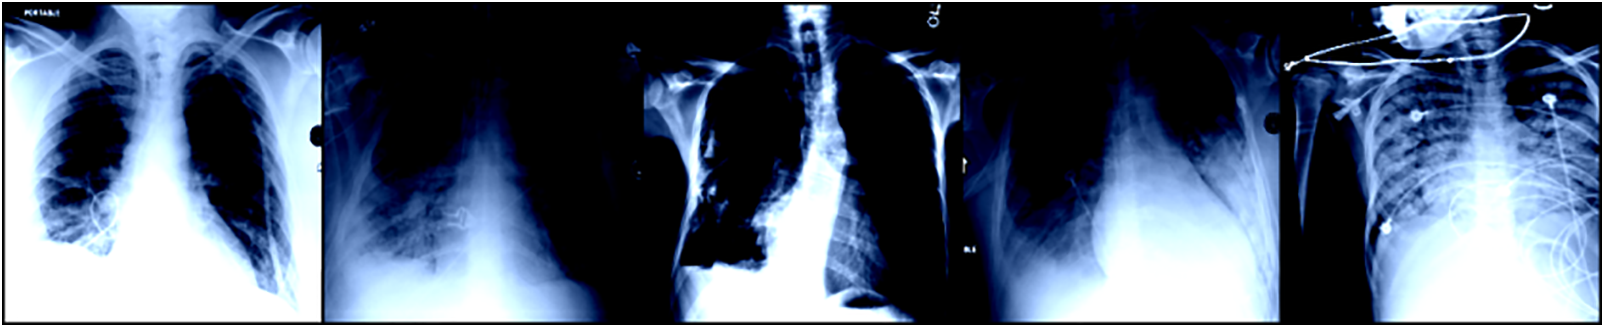
Figure 5: A few sample images from TB dataset
In the application layer, the pre-handled dataset is fed as shown in Fig. 6 with the preparation model. The model used to prepare our framework is known as VGG16 [22]. The model has the greatest number of stored convolutional layers and is known for efficient picture handling and robust feature extraction. VGG16 has a total of 138 million boundaries. Additionally, VGG16 has different convolutional layers, a max-pooling layer, a completely associated layer having ReLU as an actuation capability, and toward the end, it has a delicate max layer. The layered design architecture of VGG16 is presented in Fig. 7.
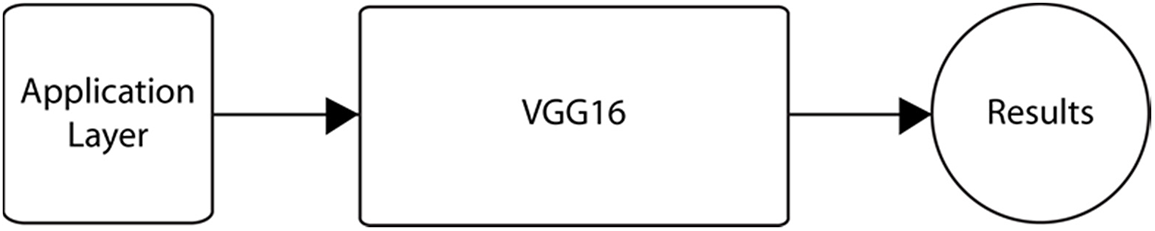
Figure 6: Flow diagram for VGG16 model
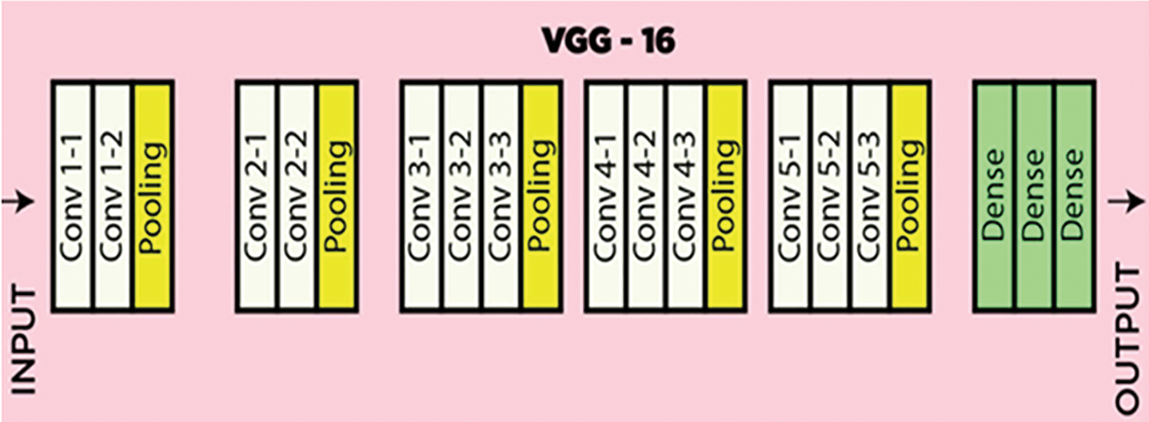
Figure 7: Layered illustration of the VGG16 model
The test image is passed into a series of convolutional layers, where employed channels with tiny receptive fields of size 3 × 3 (minimum range) are used. The convolution step is performed at a distance of each pixel. After the convolutions, pooling is carried out with a stride of 2 or more pixels. The accompanying Fig. 8 shows the building blocks of the VGG16 model.
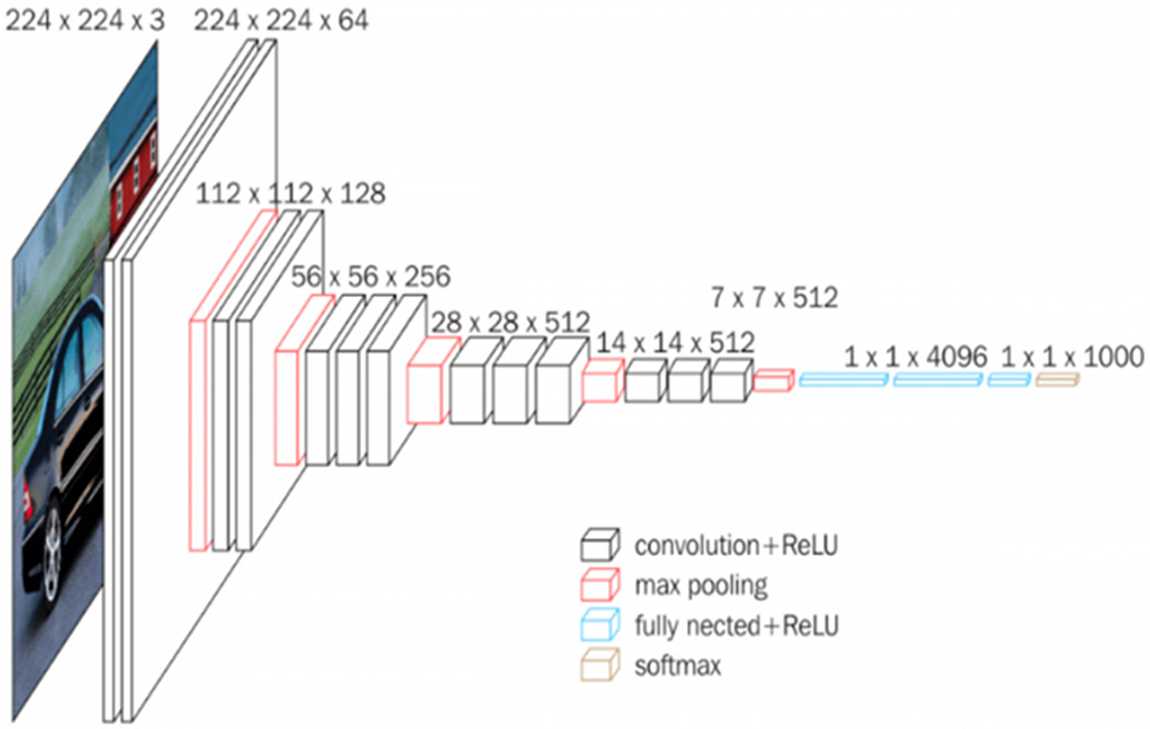
Figure 8: Structural details of VGG16
After these 13 convolution layers and five max-pooling layers, we have thick layers. Each thick layer contains 4096 units and has a ReLU initiation capability. Relu is utilized to quit sending negative qualities and permits rapid organization. The Relu capability is characterized underneath in numerical terms:
In the last thick layer, a delicate max capability is utilized for grouping. It standardizes the results for each class within the range of 0 and 1 and partitions by their total, giving the likelihood of the info esteem being in a particular class. The proposed calculation is carried out in the Python programming language. The different datasets are downloaded from Kaggle, and in our case, the dataset contains 500 chest X-beam images of COVID-19 patients, 500 images of TB patients, and 500 X-beam images of healthy individuals. The entire dataset organizer contains two further envelopes, named “preparing” and “testing”. Every envelope contains TB_images, COVID_images and “Normal_images”. After planning, the labeled data is employed in the VGG16 and ResNet18 networks for classification. The attributes of VGG16 are given in the accompanying figure. We train our information in 40 epochs. In general, datasets are divided into train and test sets (especially when the amount of data is very large) [23]. Typically, fifteen hundred images have a learning rate of 0.001. A hyper-boundary controls the amount to change the model because of the assessed error each time the model loads are refreshed [24]. We compute the error after every age. The error condition is given as:
Considering the above error, we update the weights each time. The equation for weight updating is given below:
Here, we represent the underlying weight, w denotes the weight, and ƞ indicates the learning rate. In this way, our model has been carried out at this point. Additionally, the model is prepared by the above-portrayed boundaries. After the application layer, we have a sublayer referred to as the execution assessment layer, in which we work out our expense capability, accuracy, and precision. We can identify and order the coronavirus and TB from the x-beam pictures.
In Fig. 9, the layer performance of the model is evaluated, and the results are discussed and compared with other works.
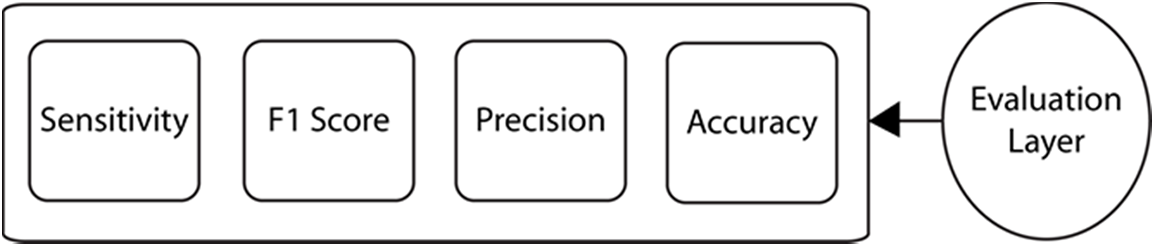
Figure 9: Evaluation layer
This model is designed mostly for people over 40 years of age. The performance of the model increases with increasing age, and the efficiency of the model decreases with decreasing age. Using the entropy of the model, we can characterize the global maxima, where we obtain the least number of errors and the most extreme precision.
Fundamentally, accuracy is the number of correct expectations by the model. The accuracy is numerically expressed as follows:
where TN represents true negative, TP stands for true positive, FP represents false-positive, and FN shows false negative samples. In the preparation stage, our model showed an exactness of 94.26% and an accuracy of 94.18%.
Both exactness and accuracy indicate how close an estimate is to a true value; however, exactness indicates how close an estimate is to a known or acknowledged value, while accuracy indicates how repeatable an estimate is, regardless of how far it is from the value that is acknowledged [25]. One way to describe accuracy is gained from the following expression:
where TP and FP are already defined in Eq. (4). The proposed model achieves 94% precision rate.
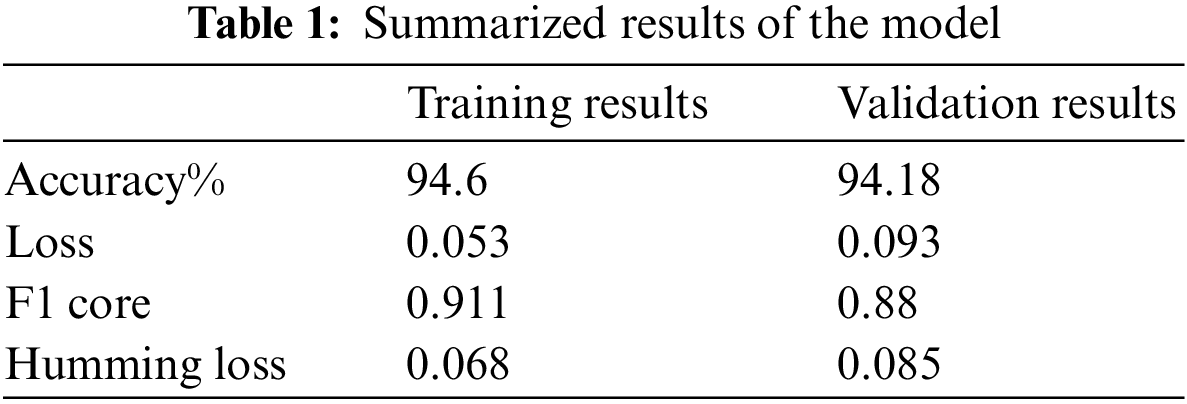
The F1 score and Hamming loss of the model are 0.911 and 0.068, respectively. The F1 score is the symphonious mean of accuracy and review. The condition for the F1 score is given as:
Awareness is also referred to as the hit rate or genuine positive rate and is expressed as the number of accurately certain recognized cases. Responsiveness is given as follows:
Misfortune in the preparing stage is 0.053, and misfortune in the approval stage is 0.093. The misfortune curve for all ages is presented in Fig. 10. The blue line represents training error, and the orange line denotes testing error. The model undergoes a slight over-fitting due to less complexity of features in the training dataset.
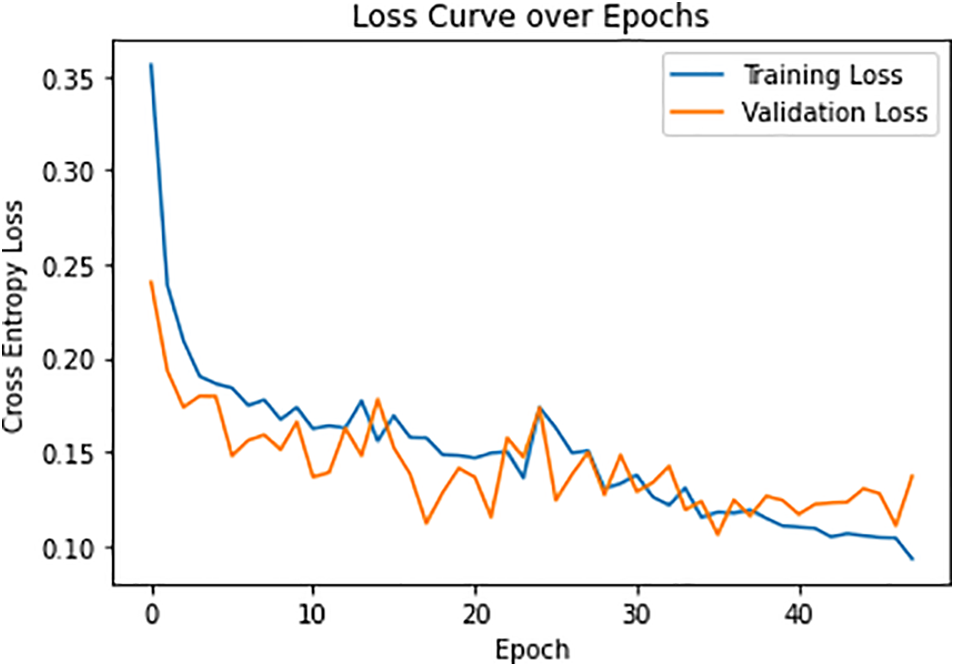
Figure 10: Loss curve over each epoch
The accuracy of this model is shown in Fig. 11:
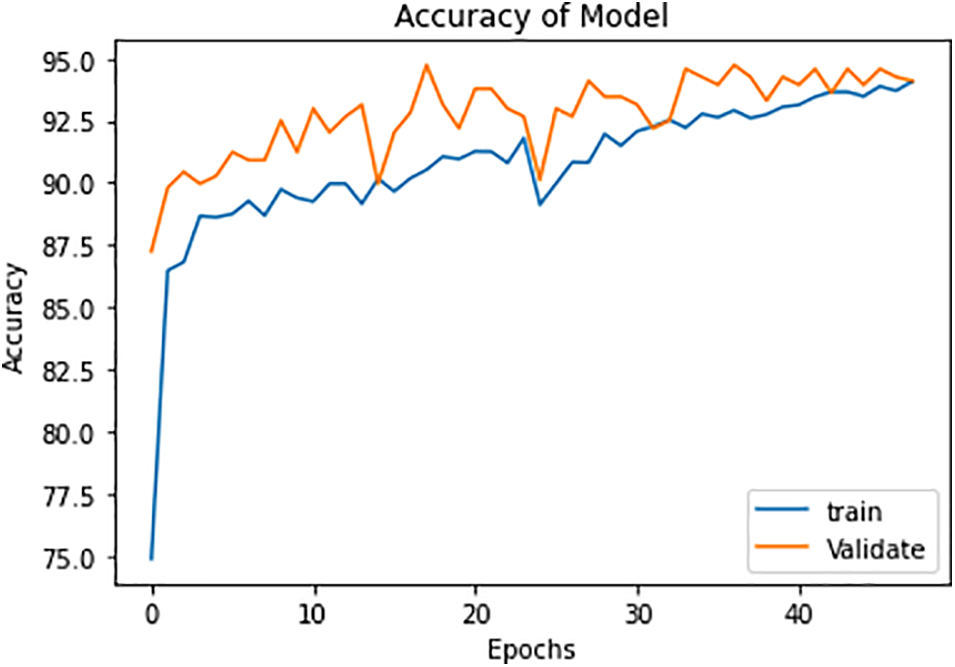
Figure 11: Model accuracy in the training and validation phases
Here, note the slight amount of overfitting and a modest number of X-beam images are accessible for each of the three classes. This overfitting issue can be addressed by choosing a more noteworthy age and having a large measure for preparing the dataset. In the wake of preparing the model and approving it, we selected this model for the absolute test X-beam images. The findings show an exactness of approximately 92% with these test pictures. The results for the proposed model are shown in Table 1. The overall accuracies for the three classes, COVID-19 positive, TB positive, and healthy patients are 92.9%, 92.7%, and 98.2% respectively. There is a slight decrease in the accuracy metrics of TB patients as the X-ray images of a few TB patients are complicated and the pattern is similar to COVID-19 samples. The thickness and texture of fluids are different for both diseases and the proposed model efficiently distinguishes them [26].
The confusion matrix, which is given below in Fig. 12, shows the true positive results of all three classes: COVID-19 +ve, TB +cve, and both −ve.
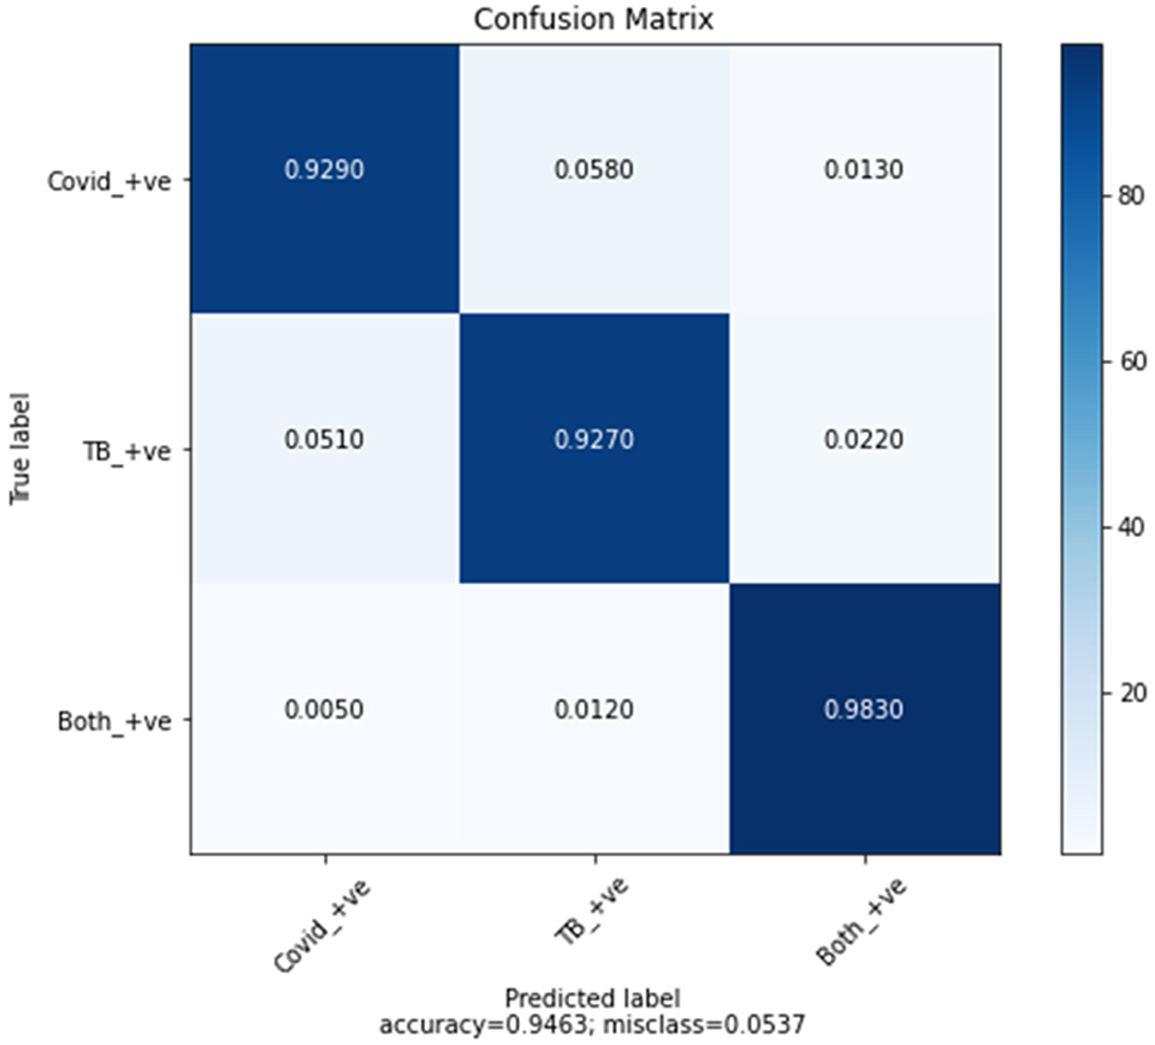
Figure 12: Confusion matrix
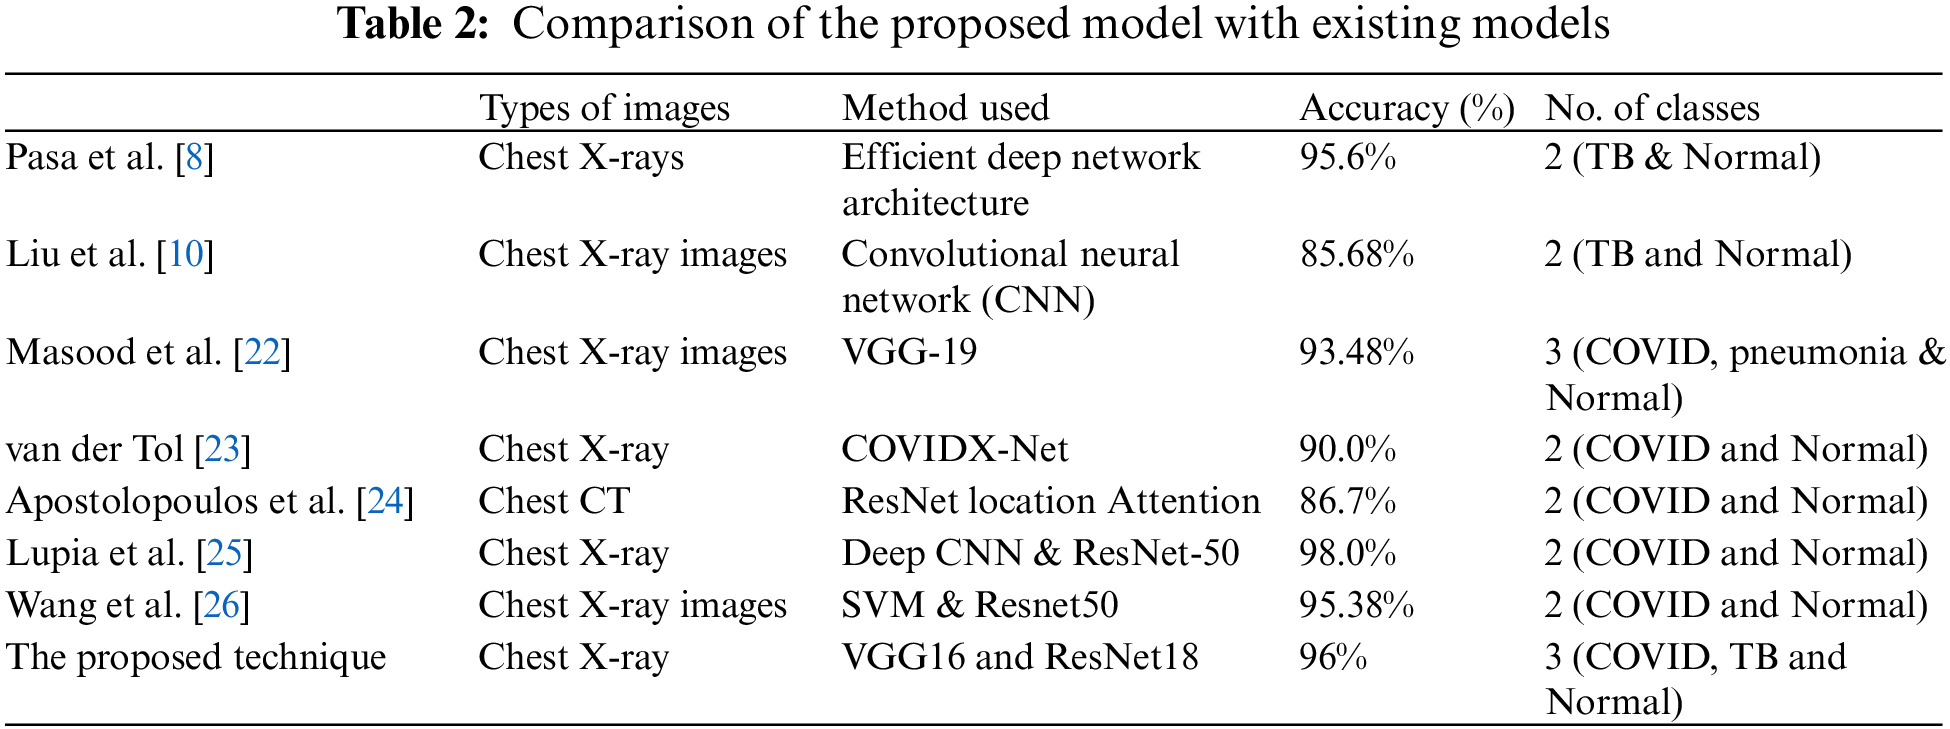
Comparisons of different methods for diagnosing COVID-19 or TB with X-ray images are shown in Table 2.
The proposed study may have a critical contribution to the clinical field and can assist the clinical framework and staff to effectively manage the disease and lessen its spread. Profound learning models are making cutting-edge techniques on various complex tasks, including medical imaging, machine vision, and biomedical signal processing. Nonetheless, preparing profound learning models, for example, profound brain networks, is an intricate task, as during the preparation stage, the contributions of each layer continue to vary. In the proposed model, a framework is designed to analyze COVID-19 and TB symptoms. It is a multiclass model that contains three classes: Coronavirus positive, TB positive, and coronavirus, and TB negative. The model has accomplished an accuracy of 94%. To improve the metrics and unwavering quality, a couple of additional steps will be included in the future, for example, using transformer-based learning for the training data. The combination of two profound learning models, VGG16 and RESNET-18, not only upgrades the quality metrics but also enhances the robustness of the proposed model.
Funding Statement: This research work is supported by Data and Artificial Intelligence Scientific Chair at Umm Al-Qura University, Makkah City, Saudi Arabia. www.uqu.edu.sa.
Conflicts of Interest: The author declares that he has no conflicts of interest to report regarding the present study.
References
1. N. Chen, M. Zhou, X. Dong, J. Qu, F. Gong et al., “Epidemiological and clinical characteristics of 99 cases of 2019 novel coronavirus pneumonia in Wuhan, China: A descriptive study,” The Lancet, vol. 395, no. 10223, pp. 507–513, 2020. [Google Scholar]
2. C. Huang, Y. Wang, X. Li, L. Ren, J. Zhao et al., “Clinical features of patients infected with 2019 novel coronavirus in Wuhan, China,” The Lancet, vol. 395, no. 10223, pp. 497–506, 2020. [Google Scholar]
3. L. Claudio Márcio Amaral, “Information about the new coronavirus disease (COVID-19),” Radiologia Brasileira, vol. 53, no. 2, pp. 112–120, 2020. [Google Scholar]
4. T. Struyf, J. Deeks, J. Dinnes, Y. Takwoingi, C. Davenport et al., “Signs and symptoms to determine if a patient presenting in primary care or hospital outpatient settings has COVID-19 disease,” Cochrane Database Syst. Rev., vol. 7, no. 7, pp. 1240–1250, 2020. [Google Scholar]
5. J. Liao, S. Fan, J. Chen, J. Wu, S. Xu et al., “Epidemiological and clinical characteristics of COVID-19 in adolescents and young adults,” The Innovation, vol. 1, no. 1, pp. 1620–1630, 2020. [Google Scholar]
6. World Health Organization (WHO) Coronavirus Disease (COVID-19) Dashboard, Geneva, Switzerland: World Health Organization. https://covid19.who.int/ [Google Scholar]
7. L. Wang, Z. Lin and A. Wong, “COVID-Net: A tailored deep convolutional neural network design for detection of COVID-19 cases from chest X-ray images,” Scientific Reports, vol. 11, no. 10, pp. 310–320, 2020. [Google Scholar]
8. F. Pasa, V. Golkov, F. Pfeiffer, D. Cremers and D. Pfeiffer, “Efficient deep network architectures for fast chest X-ray tuberculosis screening and visualization,” Scientific Reports, vol. 9, no. 1, pp. 540–550, 2019. [Google Scholar]
9. Z. Qin, M. Sander, B. Rai, C. Titahong, S. Sudrungrot et al., “Using artificial intelligence to read chest radiographs for tuberculosis detection: A multi-site evaluation of the diagnostic accuracy of three deep learning systems,” Scientific Reports, vol. 9, no. 1, pp. 15000, 2019. [Google Scholar] [PubMed]
10. C. Liu, Y. Cao, M. Alcantara, B. Liu, M. Brunette et al., “TX-CNN: Detecting tuberculosis in chest X-ray images using convolutional neural network,” in 2017 IEEE Int. Conf. on Image Processing (ICIP), Beijing, China, pp. 2314–2318, 2017. [Google Scholar]
11. M. Chowdhury, T. Rahman, A. Khandakar, R. Mazhar, M. Abdul Kadir et al., “Can AI help in screening viral and COVID-19 pneumonia?” IEEE Access, vol. 8, pp. 132665–132676, 2020. [Google Scholar]
12. M. Toğaçar, B. Ergen and Z. Cömert, “COVID-19 detection using deep learning models to exploit social mimic optimization and structured chest X-ray images using fuzzy color and stacking approaches,” Computers in Biology and Medicine, vol. 121, no. 1, pp. 1030–1040, 2020. [Google Scholar]
13. Y. Hou, “Photo content classification using convolutional neural network,” Journal of Physics: Conference Series, vol. 1651, no. 1, pp. 121–131, 2020. [Google Scholar]
14. K. Masood, M. Al-Sakhnini, W. Nawaz, T. Faiz, A. Mohammad et al., “Identification of anomaly scenes in videos using graph neural networks,” Computers, Materials & Continua, vol. 77, no. 1, pp. 140–152, 2023. [Google Scholar]
15. T. Amundsen, G. Torheim, A. Waage, L. Bjermer, P. Steen et al., “Perfusion magnetic resonance imaging of the lung: Characterization of pneumonia and chronic obstructive pulmonary disease. A feasibility study,” Journal of Magnetic Resonance Imaging, vol. 12, pp. 224–231, 2000. [Google Scholar] [PubMed]
16. M. Saad, M. Ahmed, M. Asif, K. Masood and M. Alghamdi, “Social distancing and isolation management using machine-to-machine technologies to prevent pandemics,” Computers, Materials & Continua, vol. 67, no. 1, pp. 3545–3562, 2021. [Google Scholar]
17. S. Hussain, Y. Yu, M. Ayoub, A. Khan, R. Rehman et al., “IoT and deep learning based approach for rapid screening and face mask detection for infection spread control of COVID-19,” Applied Sciences, MDPI, vol. 11, no. 8, pp. 3485–3495, 2021. [Google Scholar]
18. W. Al Shehri, J. Almalki, R. Mehmood, K. Alsaif, M. Alshahrani et al., “A novel COVID-19 detection technique using deep learning based approaches,” Sustainability, MDPI, vol. 14, no. 2, pp. 1530–1550, 2022. [Google Scholar]
19. Kaggle. https://www.kaggle.com/datasets, 2022. [Google Scholar]
20. S. Siddiqui, S. Abbas, M. Khan, I. Naseer, T. Masood et al., “Intelligent decision support system for COVID-19 empowered with deep learning,” Computers, Materials & Continua, vol. 66, no. 1, pp. 1719–1732, 2021. [Google Scholar]
21. K. Simonyan and A. Zisserman, “Very deep convolutional networks for large-scale image recognition,” in 3rd Int. Conf. on Learning Representations, ICLR 2015, San Diego, CA, USA, 2015. [Google Scholar]
22. K. Masood and M. Al Ghamdi, “Modeling mental stress using a deep learning framework,” IEEE Access, vol. 2, no. 1, pp. 68446–68454, 2019. [Google Scholar]
23. K. van der Tol, “Ranking working memory ability: Analyzing the variance of results through inhibition,” Master Thesis, Utrecht University, Master’s Program in Clinical Child, Family and Education Studies, Netherlands, 2020. [Google Scholar]
24. I. Apostolopoulos and T. Mpesiana. “COVID-19: Automatic detection from X-ray images utilizing transfer learning with convolutional neural networks,” Physical and Engineering Sciences in Medicine, vol. 43, pp. 635–640, 2020. [Google Scholar] [PubMed]
25. T. Lupia, S. Scabini, S. Pinna and G. Perri, “2019-Novel coronavirus outbreak: A new challenge,” Journal of Global Antimicrobial Resistance, vol. 1, no. 1, pp. 1322–1332, pp. 2020. [Google Scholar]
26. C. Wang, M. Tee, A. E. Roy, M. A. Fardin, W. Srichokchatchawan et al., “The impact of COVID-19 pandemic on physical and mental health of Asians: A study of seven middle-income countries in Asia,” PLoS One, vol. 16, no. 2, pp. 110–120, 2021. [Google Scholar]
Cite This Article
 Copyright © 2023 The Author(s). Published by Tech Science Press.
This work is licensed under a Creative Commons Attribution 4.0 International License , which permits unrestricted use, distribution, and reproduction in any medium, provided the original work is properly cited.
 Downloads
 Citation Tools